
Abstract
Transit agencies often collect valuable information about their customers, through opinion and behavior surveys that assess travel experience and customer needs. The results of these questionnaires can be used to gain a representative snapshot of the behavior and opinions of a transit agency’s customer base. These assessments are often based on large sample sizes and are therefore useful for understanding broad trends related to users’ overall travel experience. However, these large-scale analyses generally do not capture the important and rich nuances that individuals experience while in a transit station, or on-board a train, conventional bus, streetcar, light rail, subway, or a paratransit vehicle. The purpose of this paper is to demonstrate how transit agencies can gain a better understanding of paratransit customers’ experiences during their interactions with paratransit and conventional transit services. Using data from the Toronto Transit Commissions’ paratransit division and the results of in-person customer interviews, a five-step mixed-method approach for mapping paratransit customers’ travel experiences is developed. Specifically, the aggregate analyses of customers’ experiences and opinions which are derived from agency-wide customer satisfaction surveys are combined with the information obtained through in-person discussions. Four example customer journey maps (CJMs) are presented, and findings demonstrate that by using CJMs, transit agencies can gain a broad understanding of their customer base while also understanding the emotions, needs, desires, and stories of individual transit users.
Transit agencies often collect valuable information about their customers, through opinion and behavior surveys that assess travel experience and customer needs. The results of these questionnaires can be used to gain a representative snapshot of the behavior and opinions of a transit agency’s customer base. These assessments are useful for understanding broad trends related to paratransit users’ customer experience, but they generally do not capture the important and rich nuances that individuals experience while in a transit station or on a paratransit vehicle, train, conventional bus, streetcar, light rail, or subway. To increase customer satisfaction and loyalty overall, transit agencies would benefit from providing tailored trip experiences. Accordingly, to understand individuals’ experiences, transit agencies must listen to the unique travel stories of their customers. When aggregate analyses of customers’ experiences and opinions are combined with in-person discussions, transit agencies can gain a broad understanding of their customer base, while also understanding the needs, emotions, desires, and stories of individual transit users.
Customer journey maps (CJMs) are visual representations that show how customers experience the process of interacting with distinct aspects of a business or service. These maps are useful tools for combining large-scale data analysis with the outcomes of in-person conversations with customers. The method is advantageous for “humanizing” substantial amounts of data by connecting customer experience statistics to a specific customer profile. This study focuses on the experiences of transit customers who use either only door-to-door paratransit, or who use paratransit in combination with conventional transit services. The purpose of this paper is to demonstrate how transit agencies can use CJMs to gain a better understanding of paratransit customers’ individual experiences.
In this paper the authors explore how CJMs can be used to better understand the needs and desires of paratransit customers who use both on-demand and conventional transit services. This study is relevant as it assesses the customer experience of transit users who often rely on paratransit services for travel. Because satisfaction with travel is associated with increased perceptions of life satisfaction ( 1 ), understanding how to improve the travel experience of these often more vulnerable members of society is a way to improve their overall quality of life.
The paper is structured as follows: first, the authors define what a CJM is and provide a review of the existing literature. Next, using data from the Toronto Transit Commissions’ paratransit division, a five-step mixed-method approach is used for mapping transit customers’ travel experiences. Using customer feedback forms collected by the agency in the form of questionnaires and the results of in-person interviews, the authors discuss the travel experiences of four distinct paratransit users and develop visual representations that reflect individuals’ experiences. Finally, the authors discuss how the results can be useful for transit agencies to develop customer experience policy.
Literature Review
What is a Customer Journey Map?
CJMs are visual representations that show in a linear format how customers experience interactions with a business or service. They allow organizations and researchers to dive deeply into questions and thoughts that customers may be experiencing as they interact with the service, and to tap into their emotional experiences ( 2 ). The purpose of a CJM is to better understand a customer’s emotional experience across different points in time and identify gaps in service.
Analyzing customer experience at both macro- and micro-scales is helpful for understanding overarching organizational trends, as well as providing more detailed information based on individuals’ experiences. As a method to both analyze and visualize customer information from multiple data sources, CJMs can be used to gain a holistic understanding about where changes to a service will really make a difference to customers’ experiences, and therefore also to their overall satisfaction. Relevant examples include CJMs produced by British Columbia Transit ( 3 ) and Rail Europe ( 4 ). Customer journey mapping is also a form of storytelling, in which different types of customer data are translated into new meaning to create insight into how an organization can better meet the needs of its customers ( 5 ). While CJMs can be applied to any customer-focused business, they are especially useful for understanding paratransit users’ unique trip experiences, as many paratransit customers require tailored customer service to meet their needs.
Mapping Customer Experience: A Three-Phased Approach
CJMs provide a structured way to dive into complex issues, turning what could be an overwhelming amount of information into a visual tool that is digestible and approachable. A CJM would usually assess customers’ experiences in three phases: before, during, and after interacting with a business, service, or product ( 6 ). For example, when deciding how to travel from home to work, a pre-journey experience may involve a mode-choice decision. For an individual with access to a personal car and public transit service, the journey would begin with the decision to take one mode over another. Then, if a customer were to choose to take transit, their trip experience would be composed of different trip attributes related to the access mode, boarding, on-board, and alighting. Finally, after the transit trip is finished, an individual could walk or use a mobility device to get to their final destination, and also reflect on the trip quality and experience which may have an influence on future mode-choice decision making.
In the case of paratransit, the customer experience is distinct from that of the fixed-route conventional transit user. Many paratransit customers are captive riders owing to disability, age, and/or income, meaning that they rely primarily on public transit services (7, 8). This means that mode choice does not occur in the same way it does for captive-by-choice users ( 9 ), who decide to take transit even though they have the possibility of using different modes—including a private vehicle. However, not all captive paratransit users are restricted to the use of a single (paratransit) mode. Because of personal ability and preference, some paratransit users may have the choice to use door-to-door paratransit services, conventional transit, or a combination of the two. This means that even among paratransit users who are considered captive transit riders, in many cases mode-choice decisions are made before planning a transit journey.
Another way in which paratransit differs from conventional transit is that, unlike transit users whose trips take place fully on conventional and scheduled services, paratransit users in many regions must pre-book a part of, or their entire trip ( 10 ). This means that, unlike conventional users who use transit services based on a pre-determined service schedule, paratransit users must interact with the transit agency before beginning of their trip to schedule a ride. Theoretically, this functions similarly to on-demand mobility services, where a customer books a ride using a mobile application in the moment that he or she requires the mobility service. However, in practice, most paratransit services require trips to be pre-booked, sometimes days in advance, and therefore, their on-demand aspect is not comparable to those offered by many well-established and popular transportation network companies. The pre-trip booking experience is therefore very much a part of how paratransit customers experience interactions with a transit agency.
Understanding Touchpoints
The discussion above makes clear that paratransit trips often start with a call to a customer service center or a visit to a trip booking website in order to schedule a ride. The pre-trip contact is the customer’s first interaction with the transit agency. The CJM considers the pre-service customer experience associated with this first touchpoint. In this way, the CJM acts as a tool to understand customers’ emotions and experiences associated with each touchpoint ( 11 ). Whereas traditional service improvement strategies focus on customers’ experiences at specific touchpoints, CJMs allow the researcher or business to go beyond analyzing these clearly understood interactions, and tap into customer emotions, feelings, and questions. CJMs should be developed in a flexible manner, acknowledging that not all customers interact with the same touchpoints. For example, Rosembaum et al. claim that many CJMs are flawed because they treat touchpoints equally for all customers ( 11 ). However, these authors make the claim that CJMs are a crucial step in fostering the innovation of a business or service when approached appropriately, but that three factors limit managers from using CJMs. The first barrier is that few real-world examples of how to develop and interpret CJMs exist; the second is the difficulty to understand the relative importance of touchpoints; and the third is the difficulty in assessing the relationship between the vertical axis and each of the touchpoints ( 11 ). The following section describes the context of this study. Then, context-specific touchpoints are used as the backbone for developing representative CJMs.
Context
The Toronto Transit Commission (TTC) is Canada’s largest public transport agency, and the third largest agency in North America. It operates bus, subway, streetcar, and paratransit services in Toronto, Ontario, Canada. Wheel-Trans is the TTC’s paratransit service, which provides a door-to-door accessible transit service and connections to subway stations and bus stops for persons with physical and cognitive disabilities and eligible seniors under the regular TTC fare structure. Vehicle types for on-demand services include accessible buses, contracted accessible taxi minivans, and sedan taxis. The service provides mobility options for approximately 40,000 customers who take over 4 million trips annually in the City of Toronto ( 12 ).
In 2016, TTC Wheel-Trans created a 10-Year Strategy to develop an accessible transit service that ensures dignity, spontaneity, fairness, and freedom of travel for all customers ( 13 ). Governed by the Ontario Human Rights Code and the Accessibility for Ontarians with Disabilities Act, the Wheel-Trans 10-Year Strategy aimed to re-imagine and transform accessible and specialized public transit services delivered to customers with disabilities ( 13 ). The main focus of the strategy was to develop a customer-focused service model that could anticipate customer needs.
To better understand customers’ expectations and experiences, Wheel-Trans engages with their customers in several ways. First, Wheel-Trans receives feedback from its customers on an ongoing basis. Second, similarly to the TTC’s conventional transit customer experience engagement, Wheel-Trans collects customer satisfaction information using an annual phone and online survey called the TTC Wheel-Trans Customer Satisfaction Survey. To supplement this, Wheel-Trans launched a series of ongoing trip evaluation surveys corresponding to service model changes being introduced. Whereas the overall customer experience data are collected annually, the trip evaluation surveys are collected on a rolling basis.
Finally, Wheel-Trans also engages with its customers through TTC’s Advisory Committee on Accessible Transit (ACAT), who are a group of volunteers that provide ongoing insight into decisions affecting accessible transportation in the City of Toronto. Although the breadth of the data collected through surveys and questionnaires can be beneficial for setting benchmarks and for measuring progress, the information often does not provide the depth of individual customers’ experiences needed to understand their emotions, thoughts, and motivations as they move through their journey and interact with specific touchpoints.
Methods
The Five Steps to Developing Effective Customer Journey Maps
This section provides insight on how to develop effective CJMs in five steps, and Figure 1 provides a high-level visual summary of the process.
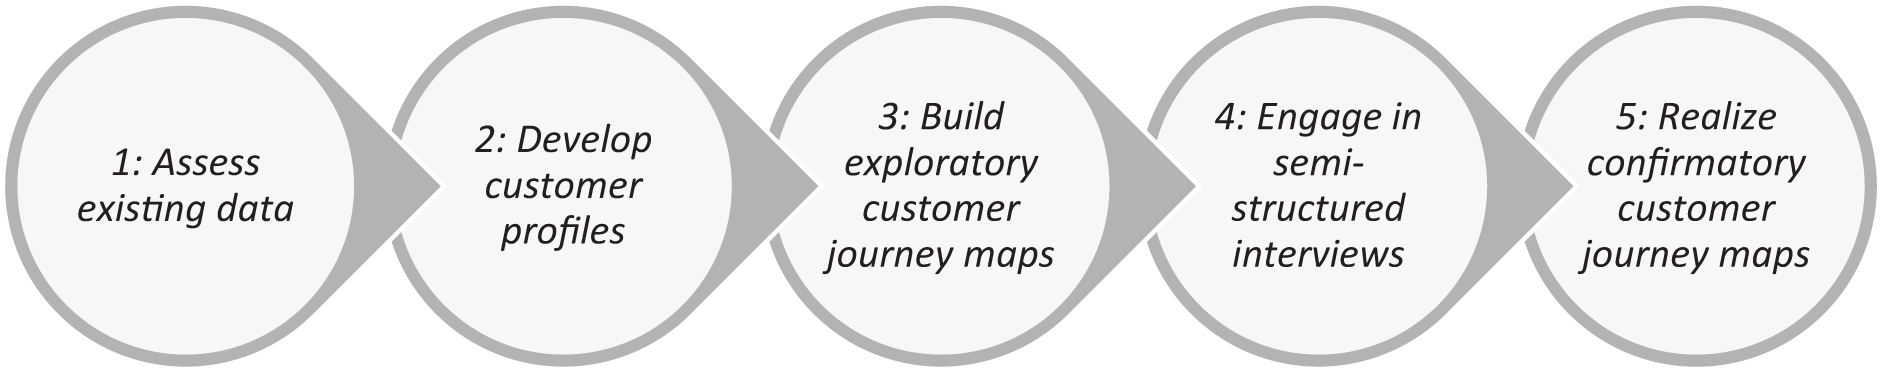
The five steps to developing effective customer journey maps.
Assessing Existing Data
Transit agencies often use opinion surveys and questionnaires to collect valuable information about their customers’ travel experiences and needs. Customer opinions and behaviors are frequently collected through both stated-preference and open-ended questions. Although the quantitative results of stated-preference questions are often helpful for understanding customer experience trends across an agency or specific population segment, the verbatim or long-answer results of open-ended questions can be helpful for better understanding the context from which a customer experiences transit.
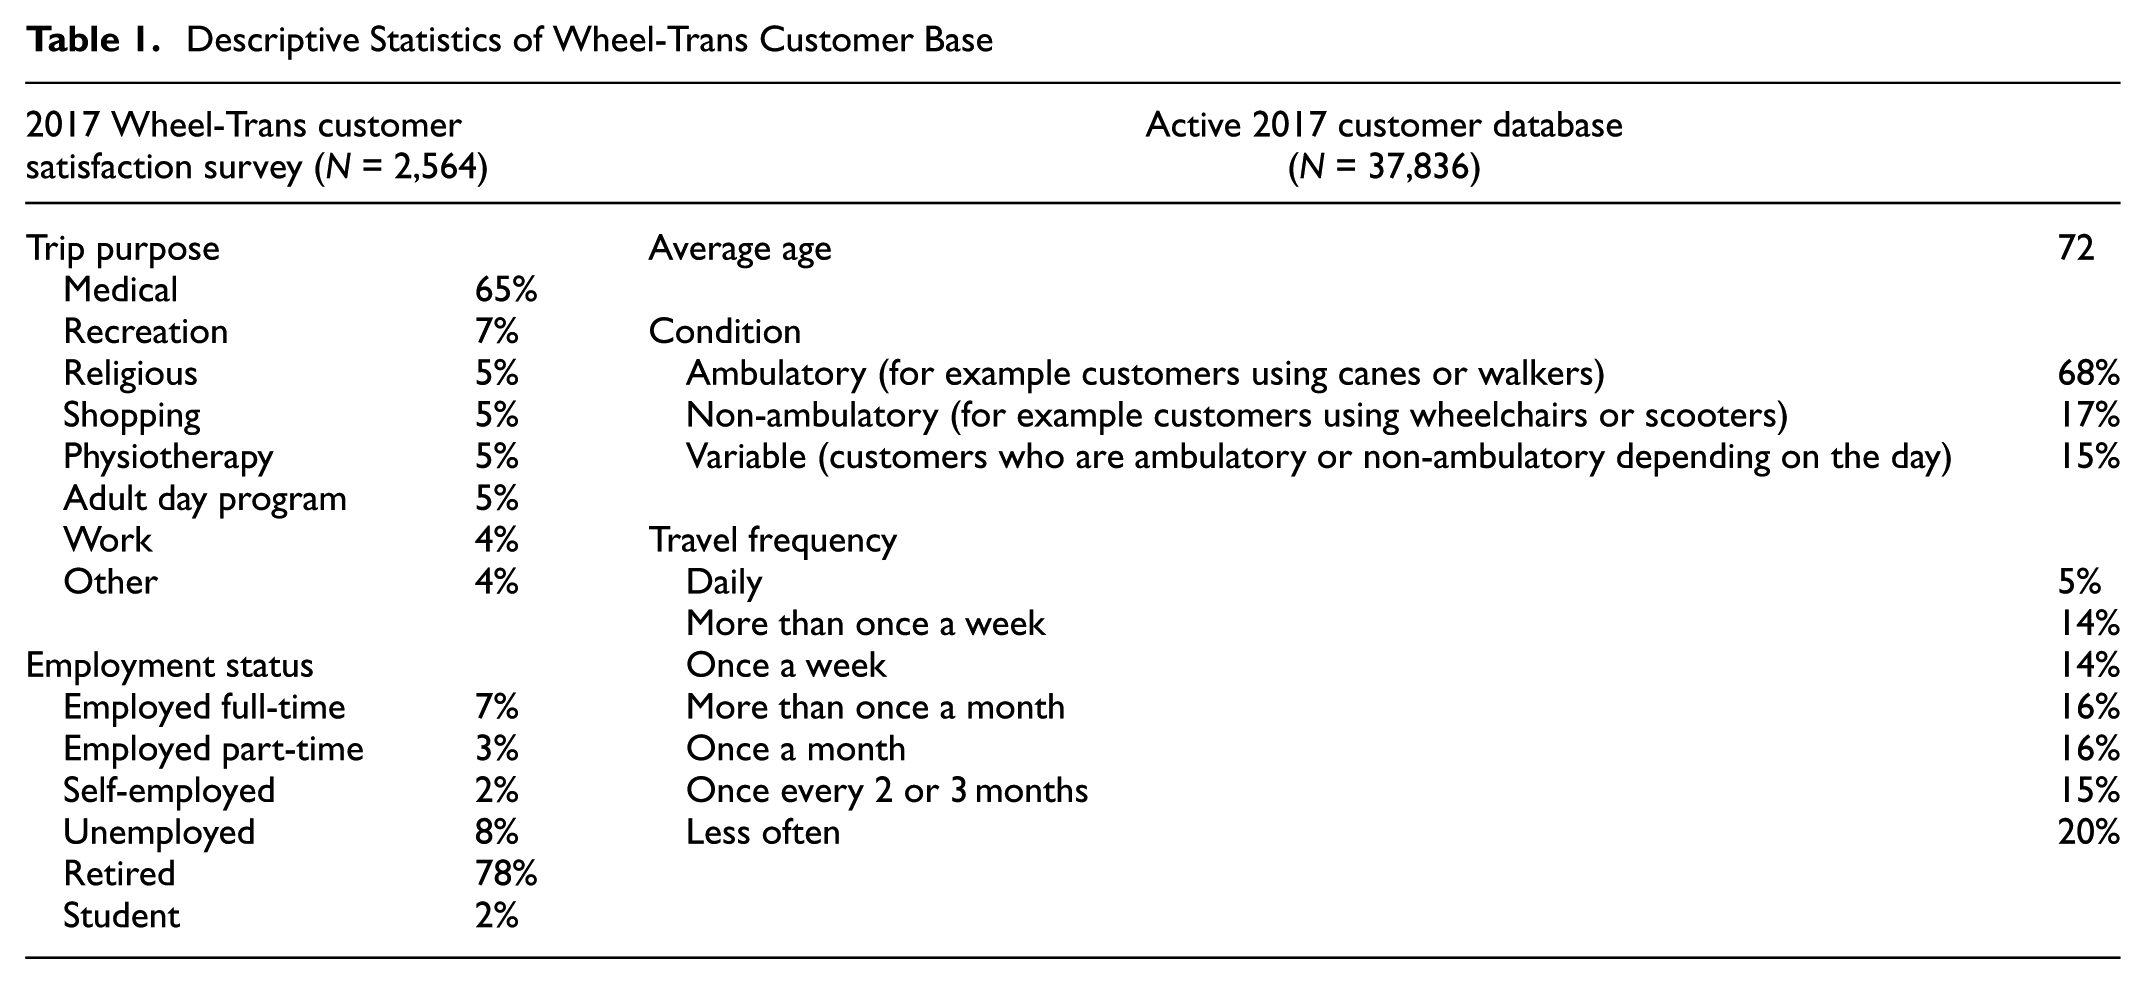
For the purposes of this study, the authors carefully assessed the results of the 2017 TTC Wheel-Trans Customer Satisfaction Survey. Summary statistics were used to assess customer satisfaction with various service attributes including satisfaction with trip booking, on-board experience, and reliability. Also assessed were personal characteristics including age, type of disability, education, and income. Because Wheel-Trans eligibility is based on customer need, Wheel-Trans collects detailed information about its customers including age, disability type, mobility device, and frequency of travel. Table 1 provides a selection of relevant summary statistics describing the 2017 Wheel-Trans customer base.
Descriptive Statistics of Wheel-Trans Customer Base
In addition to analyzing existing databases, the authors also identified how and when Wheel-Trans customers interact with the TTC (both conventional transit services and Wheel-Trans paratransit service) in order to clearly establish customer touchpoints. The customer–agency interactions were then used as a framework to assess customer experience at each touchpoint. For example, it was found that for many Wheel-Trans customers the first point of interaction with the TTC is contacting customer service to book a ride by phone, online, or using the interactive voice response (IVR) system. The results of the customer satisfaction survey revealed that for some customers who book by phone, the long waiting period can be highly problematic. Another example is that for customers who use Wheel-Trans to connect with conventional transit, frustrations can arise when the elevators are not working at a subway station. These examples demonstrate how customers interact with different touchpoints depending on how they choose or need to use the TTC’s Wheel-Trans or conventional transit services. Figure 2 demonstrates the touchpoints that were identified for the customer profiles that are described in the following section.
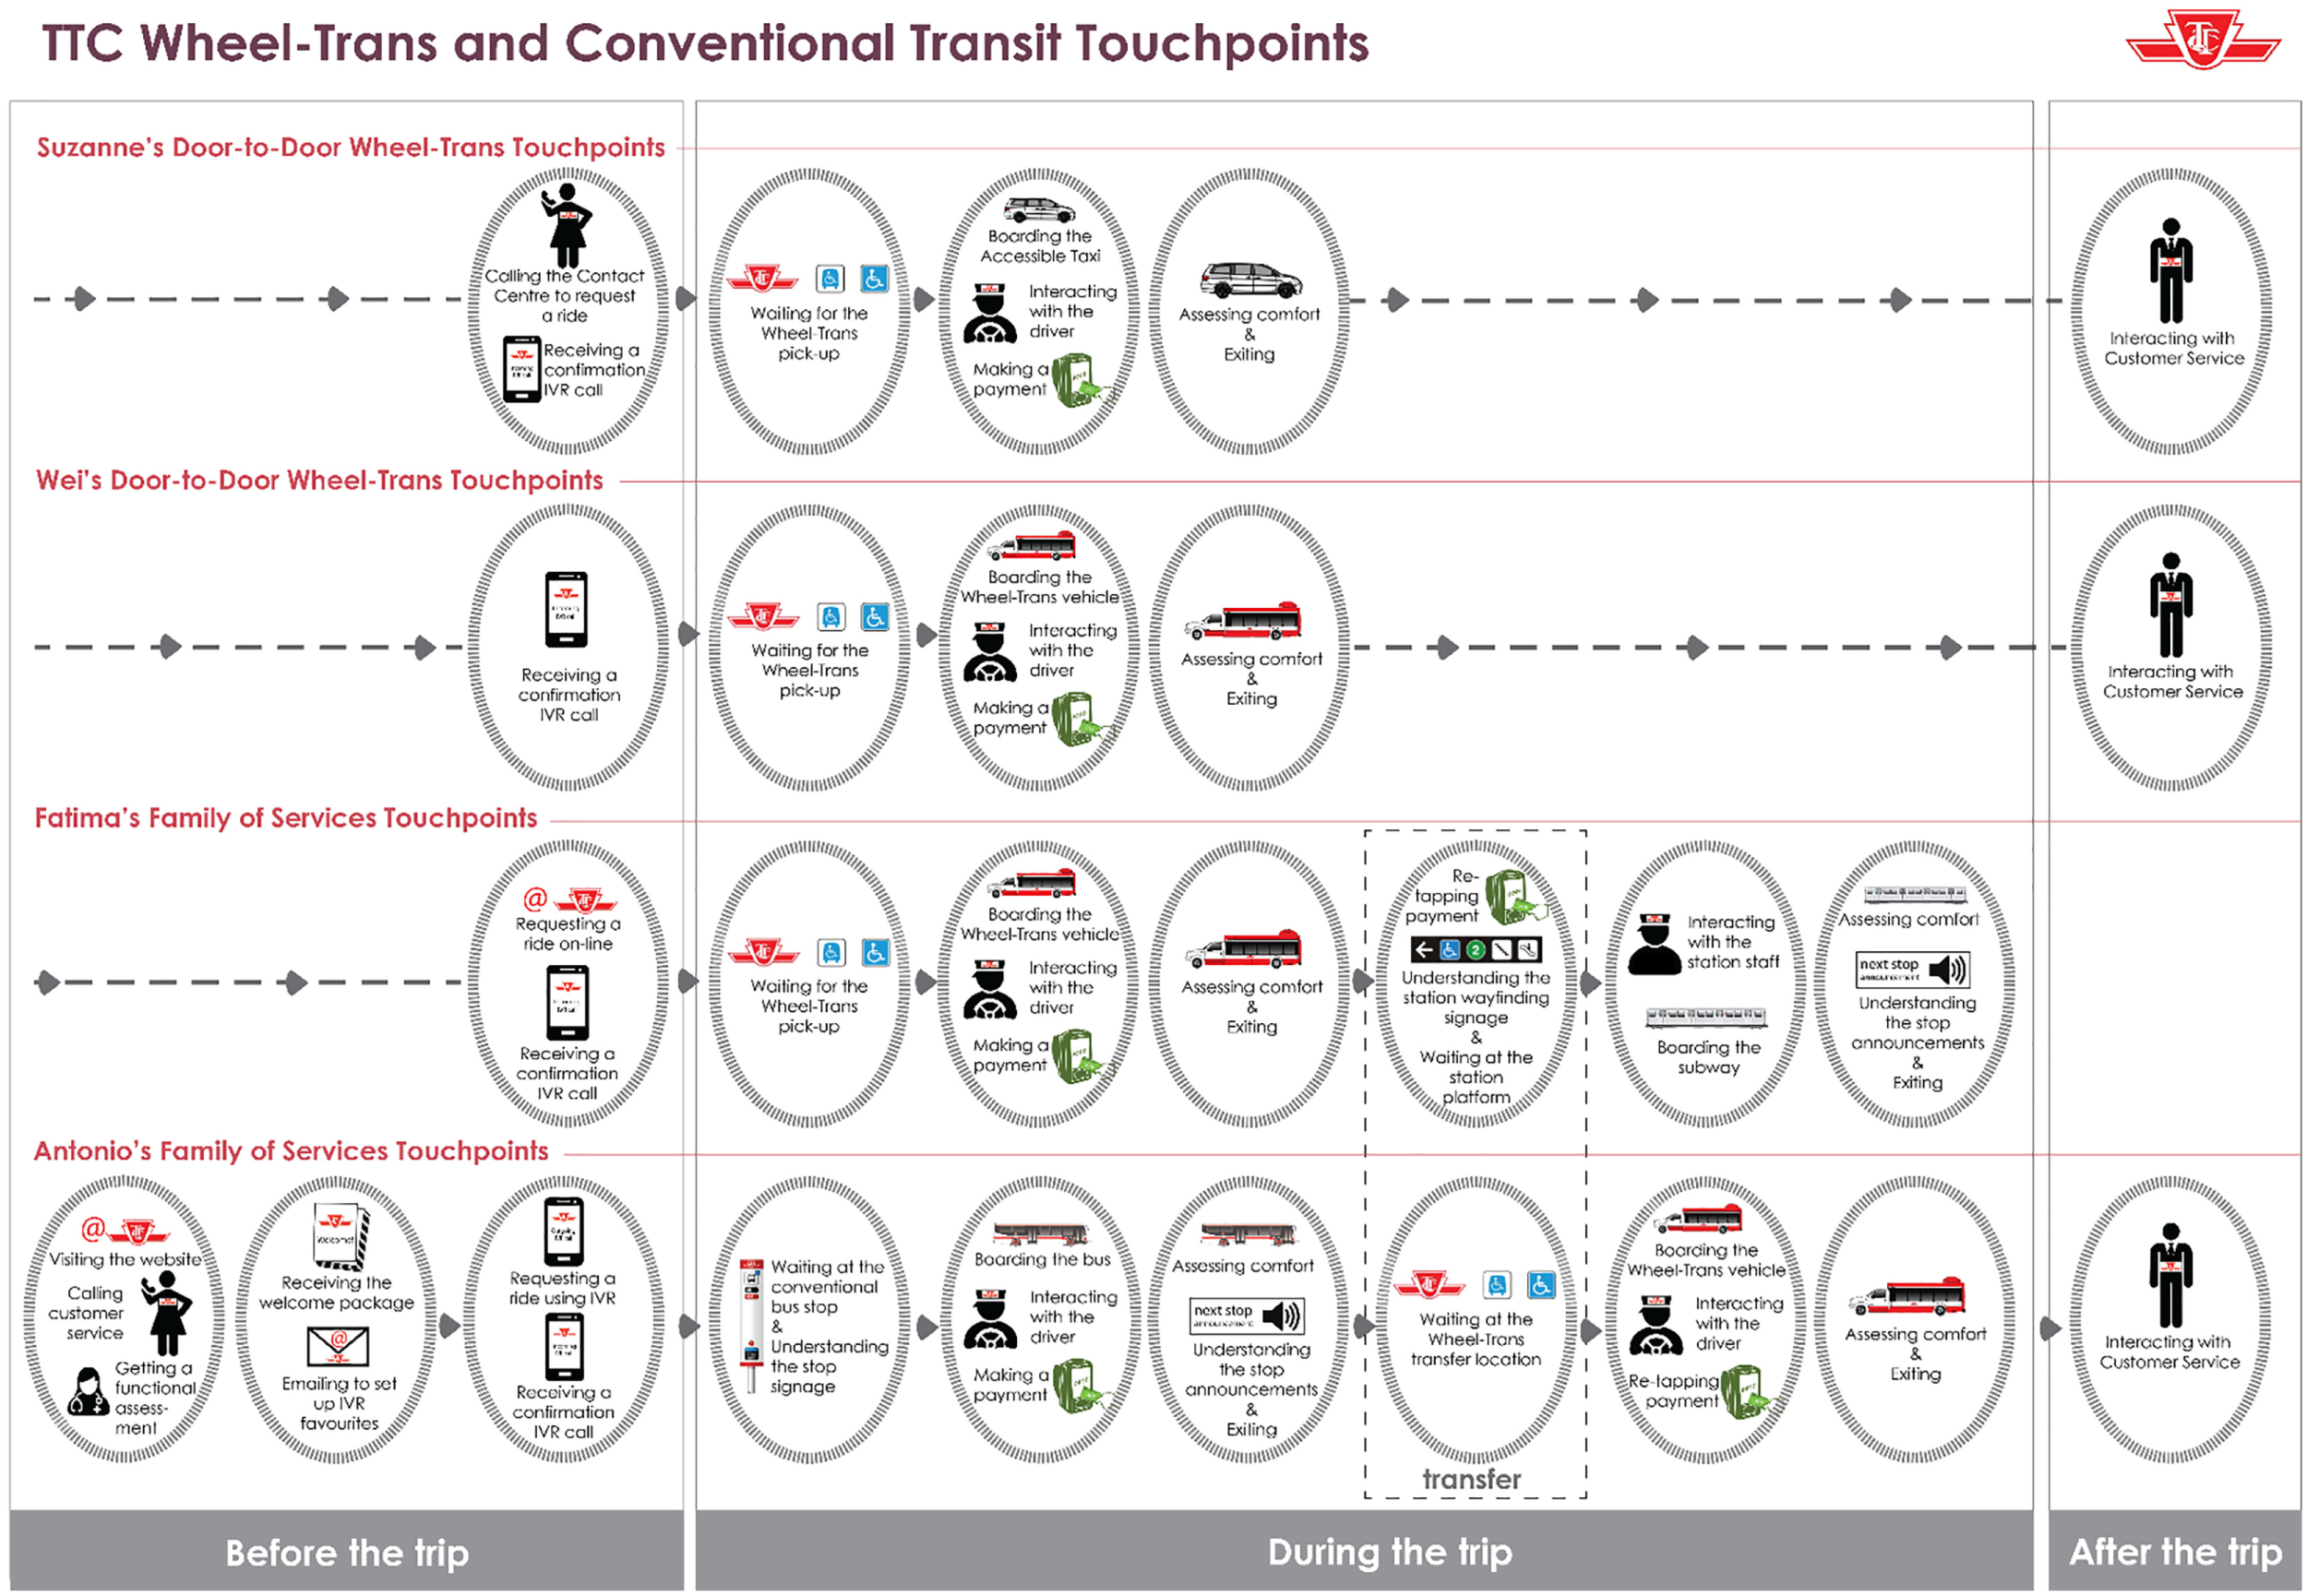
TTC Wheel-Trans and conventional transit touchpoints.
Developing Customer Profiles
Based on the analysis of the existing customer data, it became clear that different segments are present among Wheel-Trans customers. This will be true of any transit agency, and previous studies have identified common transit market customer segments (9, 14, 15). Customer segmentation analysis allows researchers to develop a deeper understanding of who their customers are ( 5 ) through assessing their needs, emotions, characteristics, and behavior. For example, for conventional transit service this may include identifying captive, choice, and captive-by-choice users based on assessing vehicle access and income ( 9 ). Whereas customer segments identify and describe a group of transit users, customer profiles identify a customer that is representative of a specific user segment. Therefore, a customer profile can be based on many personal and travel characteristics including age, mode use, or travel frequency, among other attributes ( 15 ). Although every customer will have a unique trip experience, for the purpose of developing a limited selection of CJMs it is necessary to identify customer profiles that will be representative of a specific customer segment.
To better assess the experiences of Wheel-Trans customers, the authors developed four example customer profiles. Profiles (or “personas” as they are commonly referred to in literature on user-design) are used here as this method presents a way to bring people’s needs to the forefront of designing and planning how individuals interact with products and services ( 16 ). Although the profiles are fictional on an individual level, they are objective representations of customers with similar behavioral characteristics, habits, and experiences (16, 17). The profiles presented in Table 2 are based on customer characteristics identified through assessing the database of Wheel-Trans customers and represent customers who have characteristics common to many Wheel-Trans users. They are, however, not customer segments, but rather descriptions of fictional Wheel-Trans personas that exhibit characteristics similar to many actual customers. The CJMs presented in step five are built based on these customer profiles.
Customer Profiles
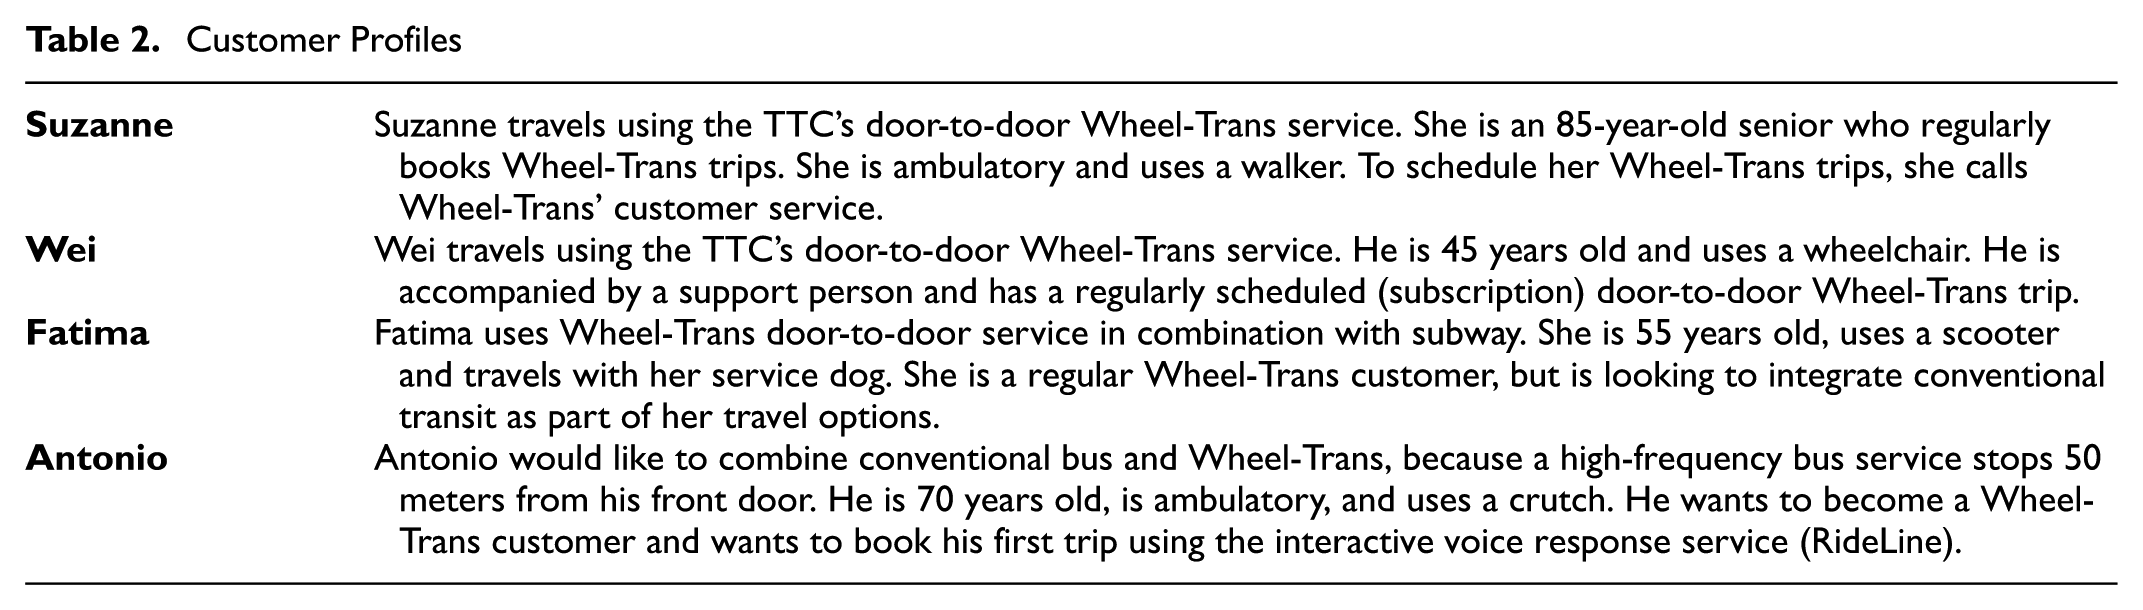
The above customer profiles were selected to highlight characteristics attributed to both ambulatory customers and those who use wheelchairs and scooters (non-ambulatory). Although it is known that approximately two-thirds of all Wheel-Trans customers are ambulatory, it remains important to assess the experiences of both ambulatory and non-ambulatory customers. The same is true for age; although the majority are retirees, younger customers’ experiences must also be assessed. The profiles also allow the authors to distinguish between the experiences of customers who use only door-to-door services and those who use Wheel-Trans to connect to subway stations and bus stops. Customer surveys and interviews reveal that many customers combine specialized transit trips with conventional fixed-route transit services. Yet, without access to customers’ individual smart card (PRESTO) payment data, it is unknown what proportion of customers travel using a combination of modes.
Using the above customer profiles, it became possible to connect customer data collected through the TTC Wheel-Trans Customer Satisfaction Survey to a particular user persona. For example, information about emotions or experiences when calling customer service to schedule a trip were applied to the profile for “Suzanne”, because she books her trips by phone. Similarly, comments about elevators at subway stations were applied to the profile for “Fatima” as she is a subway user. The profiles are intended to represent particular aspects of individual Wheel-Trans customers, even if not every aspect of the profile represents a single actual customer. Specifically, the benefit of using a customer profile such as Antonio’s is not only to understand the experiences of a person who uses a crutch, lives near a high-frequency bus route, and books using the IVR system, but also to understand Wheel-Trans users’ experiences with any of the three mentioned variables.
During this phase it also became important to connect the previously developed touchpoints that each of the characters would interact with before, during, and after the trip journey phase. Figure 2 illustrates at which point during a journey the customer profiles for Suzanne, Wei, Fatima, and Antonio interact with a TTC service.
Building Exploratory Customer Journey Maps
During the development of the exploratory CJMs, it is important to consider that this is an initial step. In a later step, during the development of the confirmatory CJMs, customer questions, comments, and emotions will be verified with in-person semi-structured interviews. Nevertheless, the process of understanding customers’ levels of emotion during this phase is helpful for assessing expectations at different touchpoints.
In order to develop exploratory CJMs, the authors assessed the verbatim comments derived from the customer satisfaction surveys and, when possible, assigned the comments to one of the customer profiles. This method is similar to a method presented by Rosenbaum et al. which combined customer feedback and research with the CJM experience ( 11 ). Figure 3 shows a blank CJM specifically designed for the purposes of this study, as suggested by Chen and Chou ( 6 ), on which to express scenarios related to the customer journey experience. The horizontal axis represents the pre-service, service, and post-service experiences that are connected to a touchpoint, and the vertical axis represents the emotions that a customer experiences in relation to each of the touchpoints. In the section titled “Thoughts and questions” at the top of Figure 3, it is recommended to place verbatim customer comments collected through surveys as well as thoughts and questions that a customer could experience throughout the journey. The section on emotional experience functions similarly to a scale, in which questions or comments that are related to higher levels of customer emotions or anxiety are ranked higher on the scale than comments or questions that are more reflective of customer observations. For example, among Wheel-Trans customers, some stated they were unsure whether operators could help them carry a bag. Although this is an important question for some customers, it does not usually cause customers to experience anxiety or high negative emotions. Alternatively, questions about on-time behavior tend to be higher on the scale, because many customers use Wheel-Trans to travel to medical appointments and fear late arrivals. Other high-anxiety questions often have to do with personal safety, such as whether the operator would help the customer safely board and alight, as well as accessibility, such as the availability and functionality of accessibility features at bus stops and subway stations. Although specific service factors that have to do with accessibility are often related to higher anxiety experiences, the service factors that appear to be most related to overall customer satisfaction are often very similar to those of conventional transit users. For example, safety, information, and on-time performance are often mentioned in verbatim comments, which is similar to the findings of studies of conventional transit users ( 18 – 20 ).
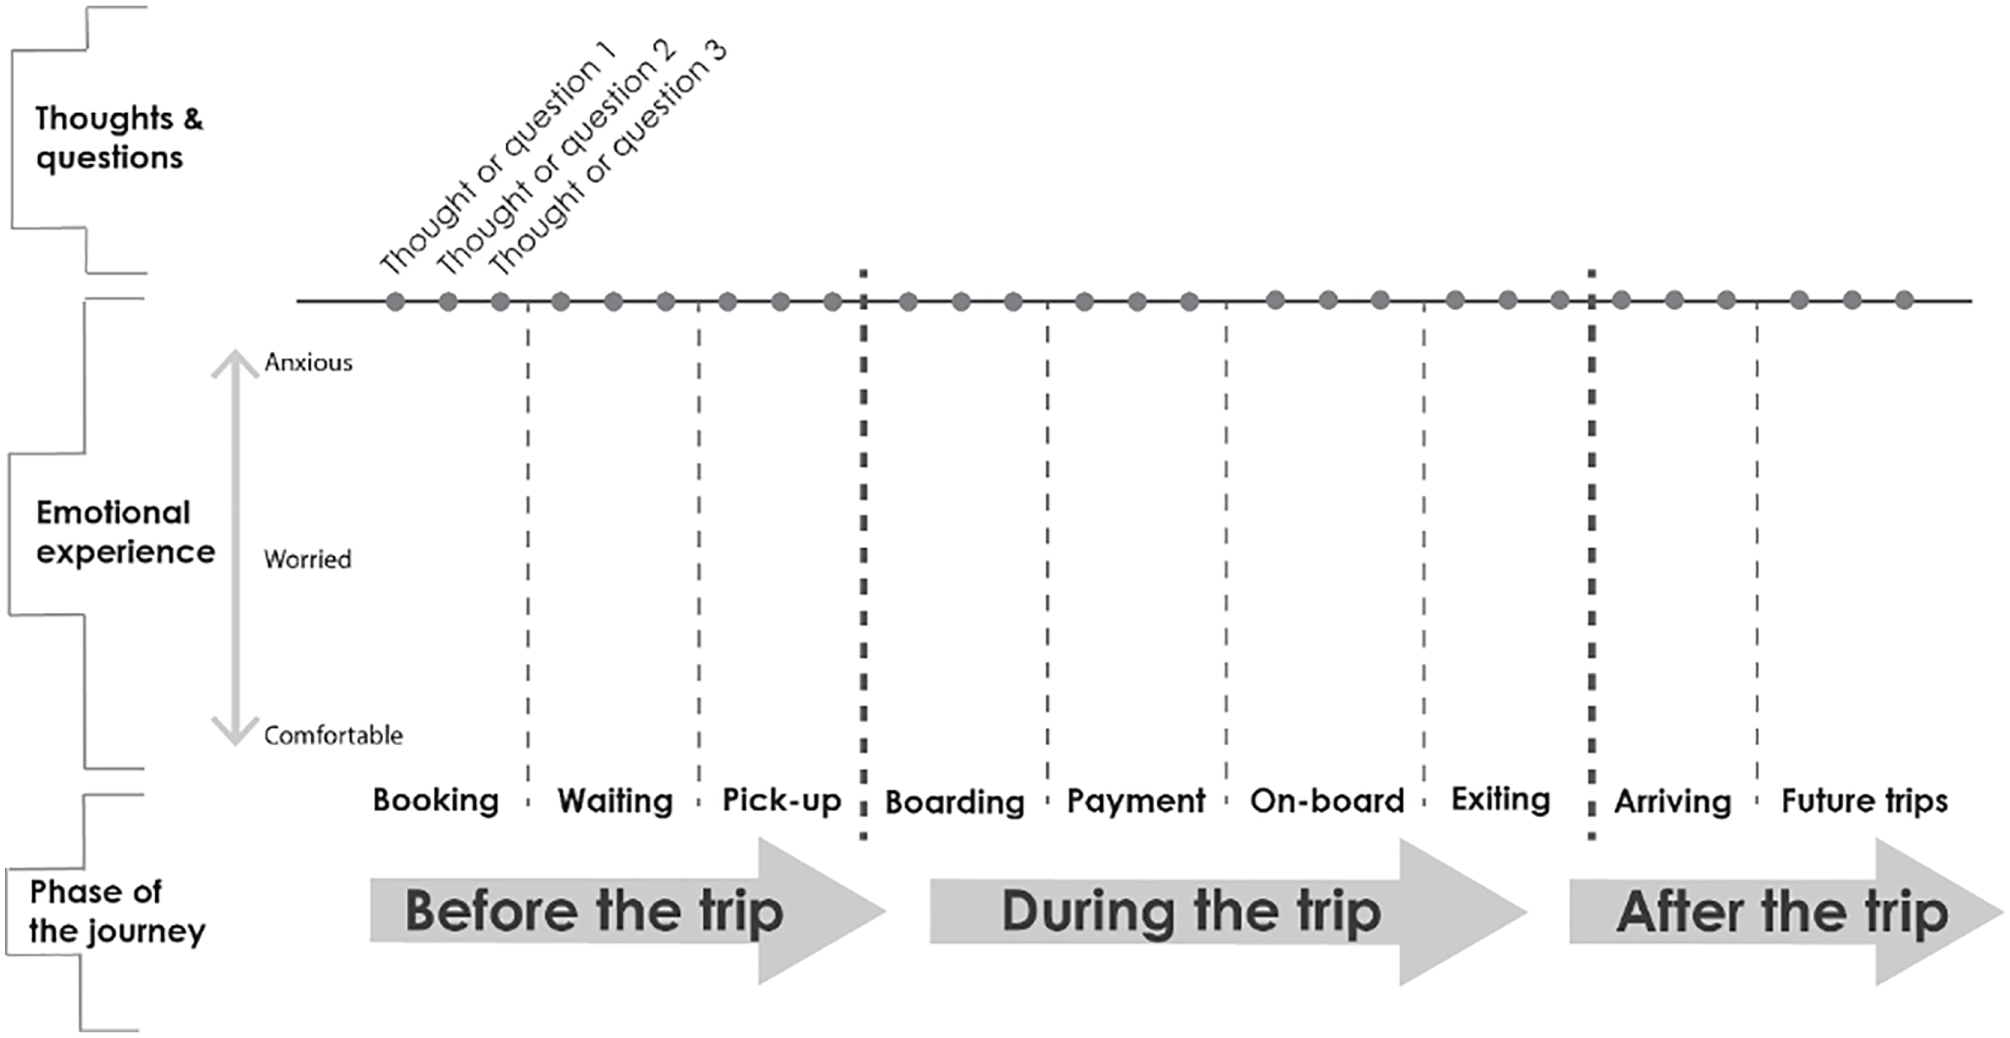
Customer journey map framework.
In this analysis, the authors developed individual exploratory CJMs for each of the customer profiles, as a visual depiction of the events and emotions that customers experience ( 11 ). Using verbatim comments as well as the results of the customer satisfaction surveys, a level of emotion was assigned to each phase of the journey. For example, according to the results of the 2017 TTC Wheel-Trans Customer Satisfaction Survey, many customers were not satisfied with the length of time spent waiting on hold or the length of time it took to resolve an inquiry when they called customer service. One customer commented that “Telephone calls take a very long to be answered and get disconnected automatically sometimes.” An associated question that could be added onto the exploratory CJM, therefore, is “How long is the waiting period on the phone?”. As the verbatim comment suggests that there is a chance for the customer’s call to be disconnected, the level of emotion may be mid-level, with the customer being neither fully comfortable nor anxious. Another customer’s experience with the phoning customer service was expressed with the following comment: “I don’t know what they’re talking about when I call. I don’t know what the voice is talking about. It’s too complicated.” This confusion is likely linked to a more emotional customer experience, and therefore should be represented on the exploratory CJM accordingly.
Another verbatim comment from a different Wheel-Transit customer regarding the Wheel-Trans pick-up process was that “Wheel-Trans Drivers should be able to call the passenger to notify that they are there instead of waiting around if they are early.” With this comment in mind, an associated question that could be included on the exploratory CJM would be, for example, “Will the operator call me or ring my doorbell upon arrival?” With regard to on-board experience, one customer commented that “I find it difficult when buses lurch and jolt, especially if I don’t have a seat,” and thereby expressing some discomfort with the experience. Alternatively, and with regard to alighting, one customer commented that “My last wheel-trans trip was a van but it was not accessible. It did not have a ramp…. I slipped on the side of the van coming out and hurt my leg badly…”. This comment shows a higher level of anxiety compared with the comments about interactions with the customer service representatives, the pick-up process, and on-board experience and, therefore, should be represented on the exploratory CJM accordingly.
Engaging in Semi-Structured Interviews
Once the exploratory CJMs were developed, the authors set out to verify the preliminary findings by engaging directly with Wheel-Trans customers. Individual semi-structured interviews are qualitative methods that allow researchers to ask interviewees a set of pre-determined open-ended questions about a specific theme ( 21 ). This qualitative method has been found to be effective for collecting information about interviewees’ emotions and personal experiences ( 22 ). To collect information about Wheel-Trans customer journey experience, the interviews were structured to ask customers about their experiences with the paratransit and, when relevant, the conventional transit service before, during, and after the trip, and be reflective of different touchpoints. Specifically, to prepare for the interviews with a group of TTC Wheel-Trans customers, a set of questions was developed aligned with the touchpoints presented in Figure 2, and which functioned as a basic checklist, as recommended by Berg ( 23 ).
Once the semi-structured interview questions were designed, the nine TTC staff members who would conduct the interviews participated in a one-hour training session about the interviewing process to ensure for a consistent data collection process. For example, during the interviews with the TTC’s Wheel-Trans customers, interviewers were instructed to ask: “In general, what kind of thoughts and questions do you have when you are ____”. The blank was accordingly filled in with different trip phases, touchpoints, and attributes such as “booking a trip,”“on-board the vehicle,”“making a payment,” and so forth. In most cases interviewees were able to provide responses without prompts. However, when respondents did not have an immediate response, interviewers held up signs with a list of terms related to the TTC’s customer charter to elicit conversation. Each interviewer had a card with the same service quality attributes listed, but the order was changed on every card in order to avoid bias. Then, interviewers were instructed to ask participants, “When you think about that question or thought, how do you feel?” To collect responses consistently, interviewers held a sheet of paper with an image of a large thermometer that indicated a 5-point scale ranging from comfortable (1) to anxious (5) (the thermometer is also depicted in Figures 4–7). Once interviewees indicated their level of emotion on the scale, interviewers recorded the emotion in the interview notes.
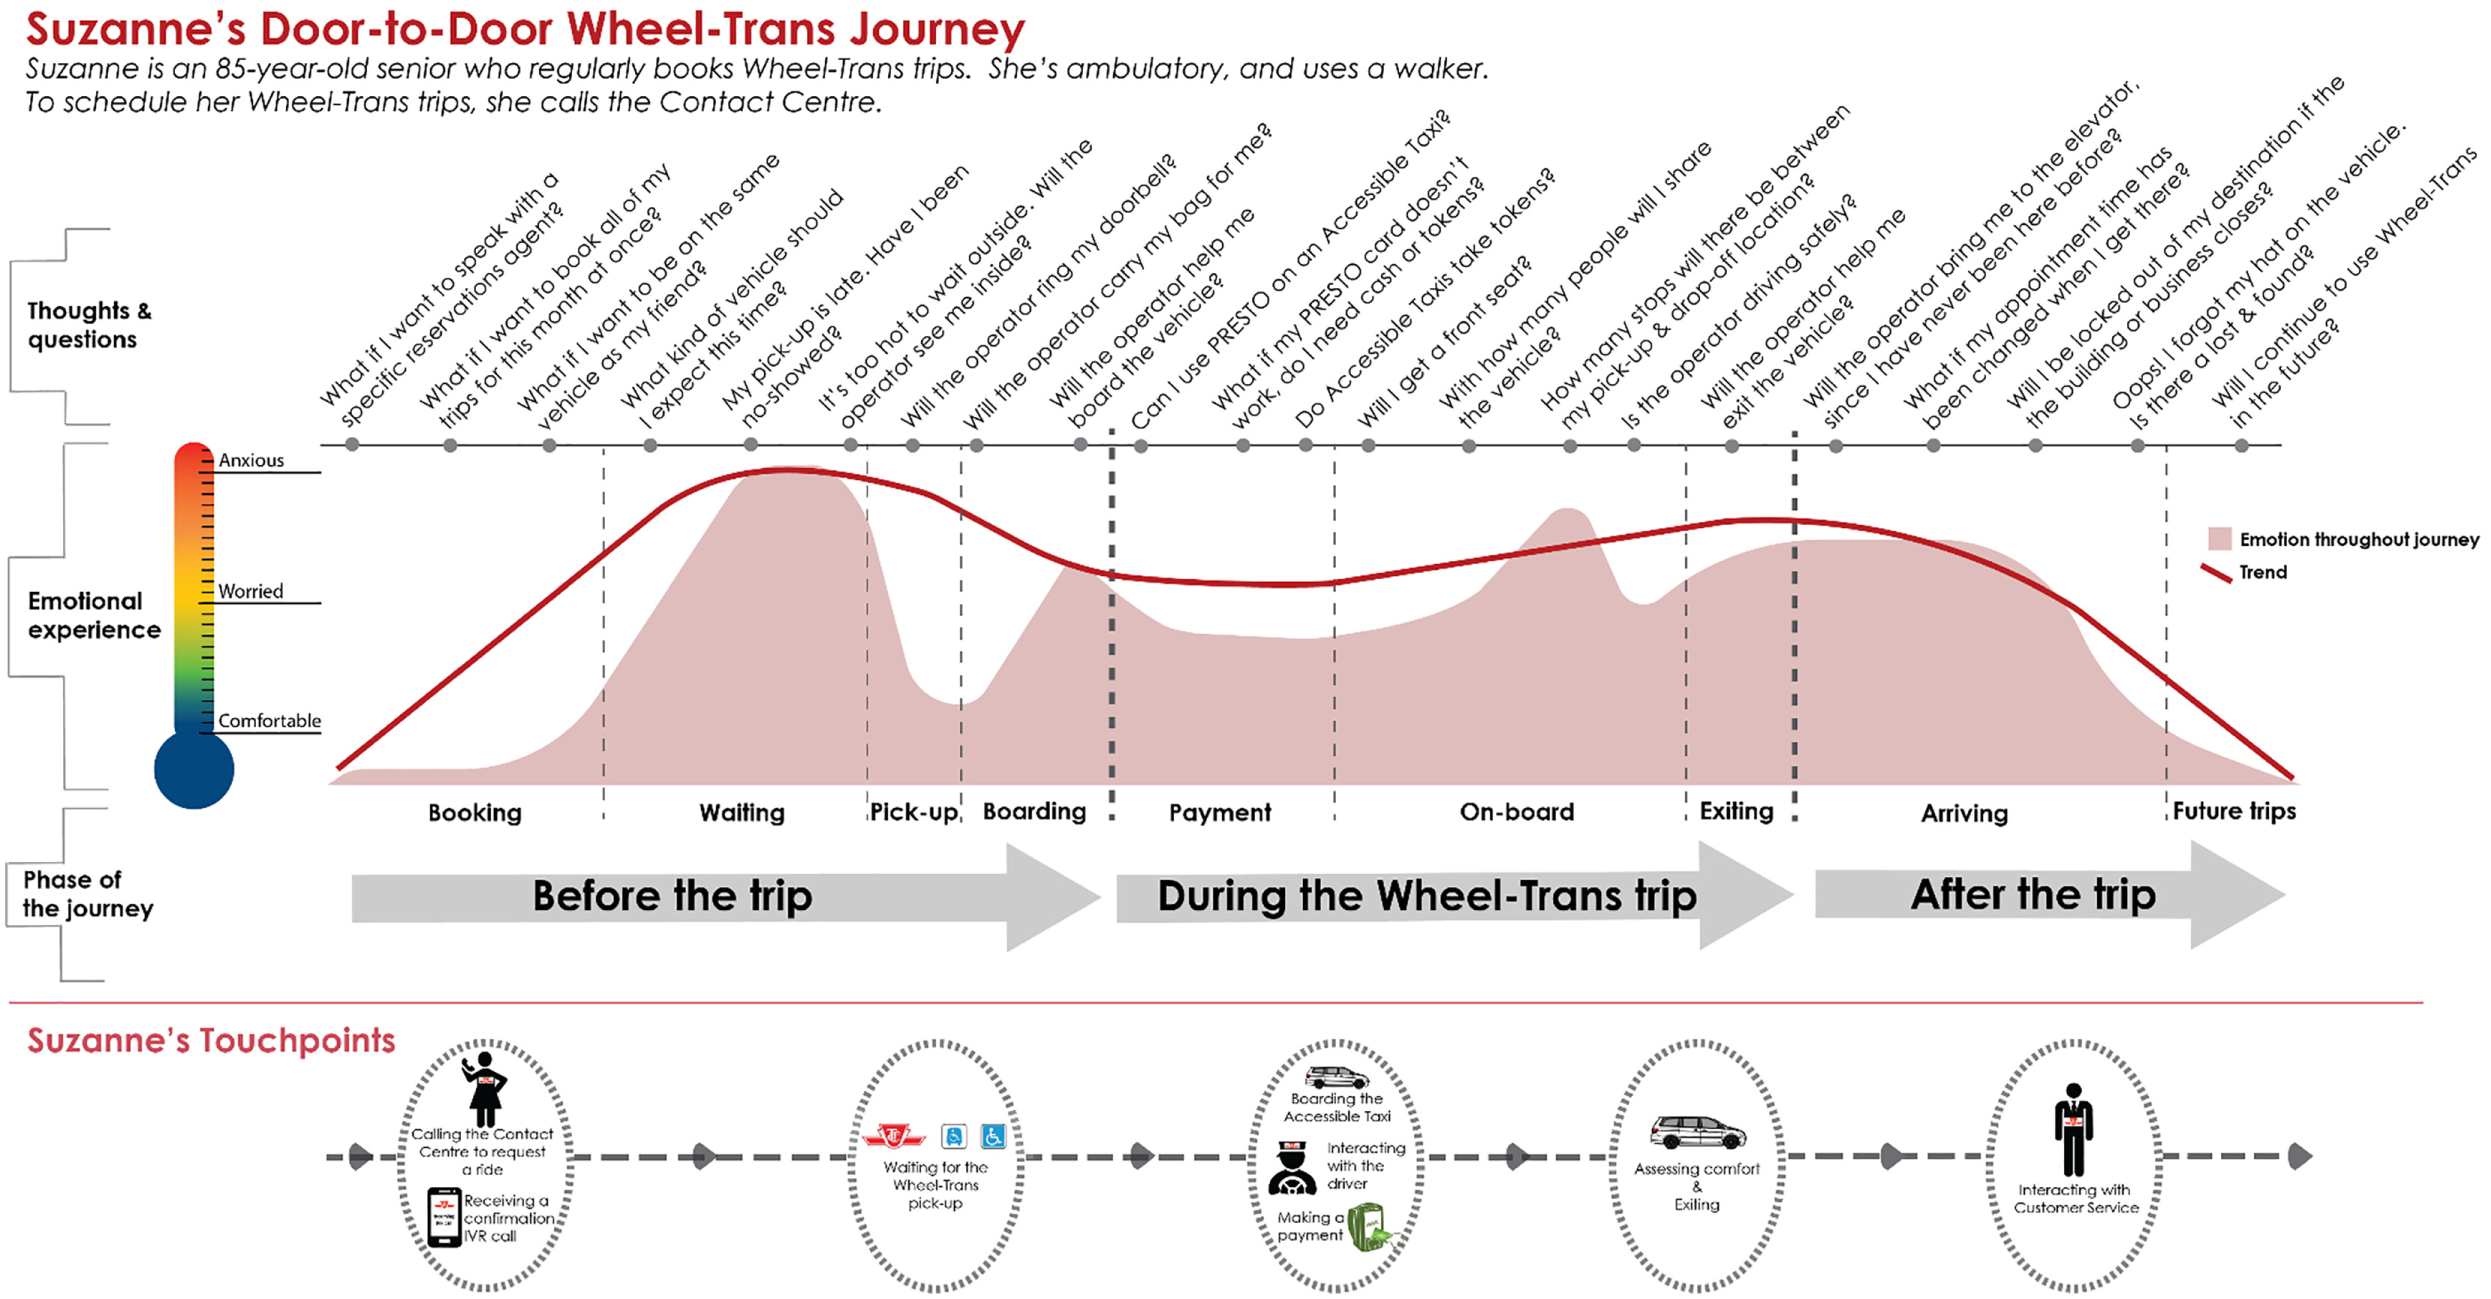
Suzanne’s customer journey map.
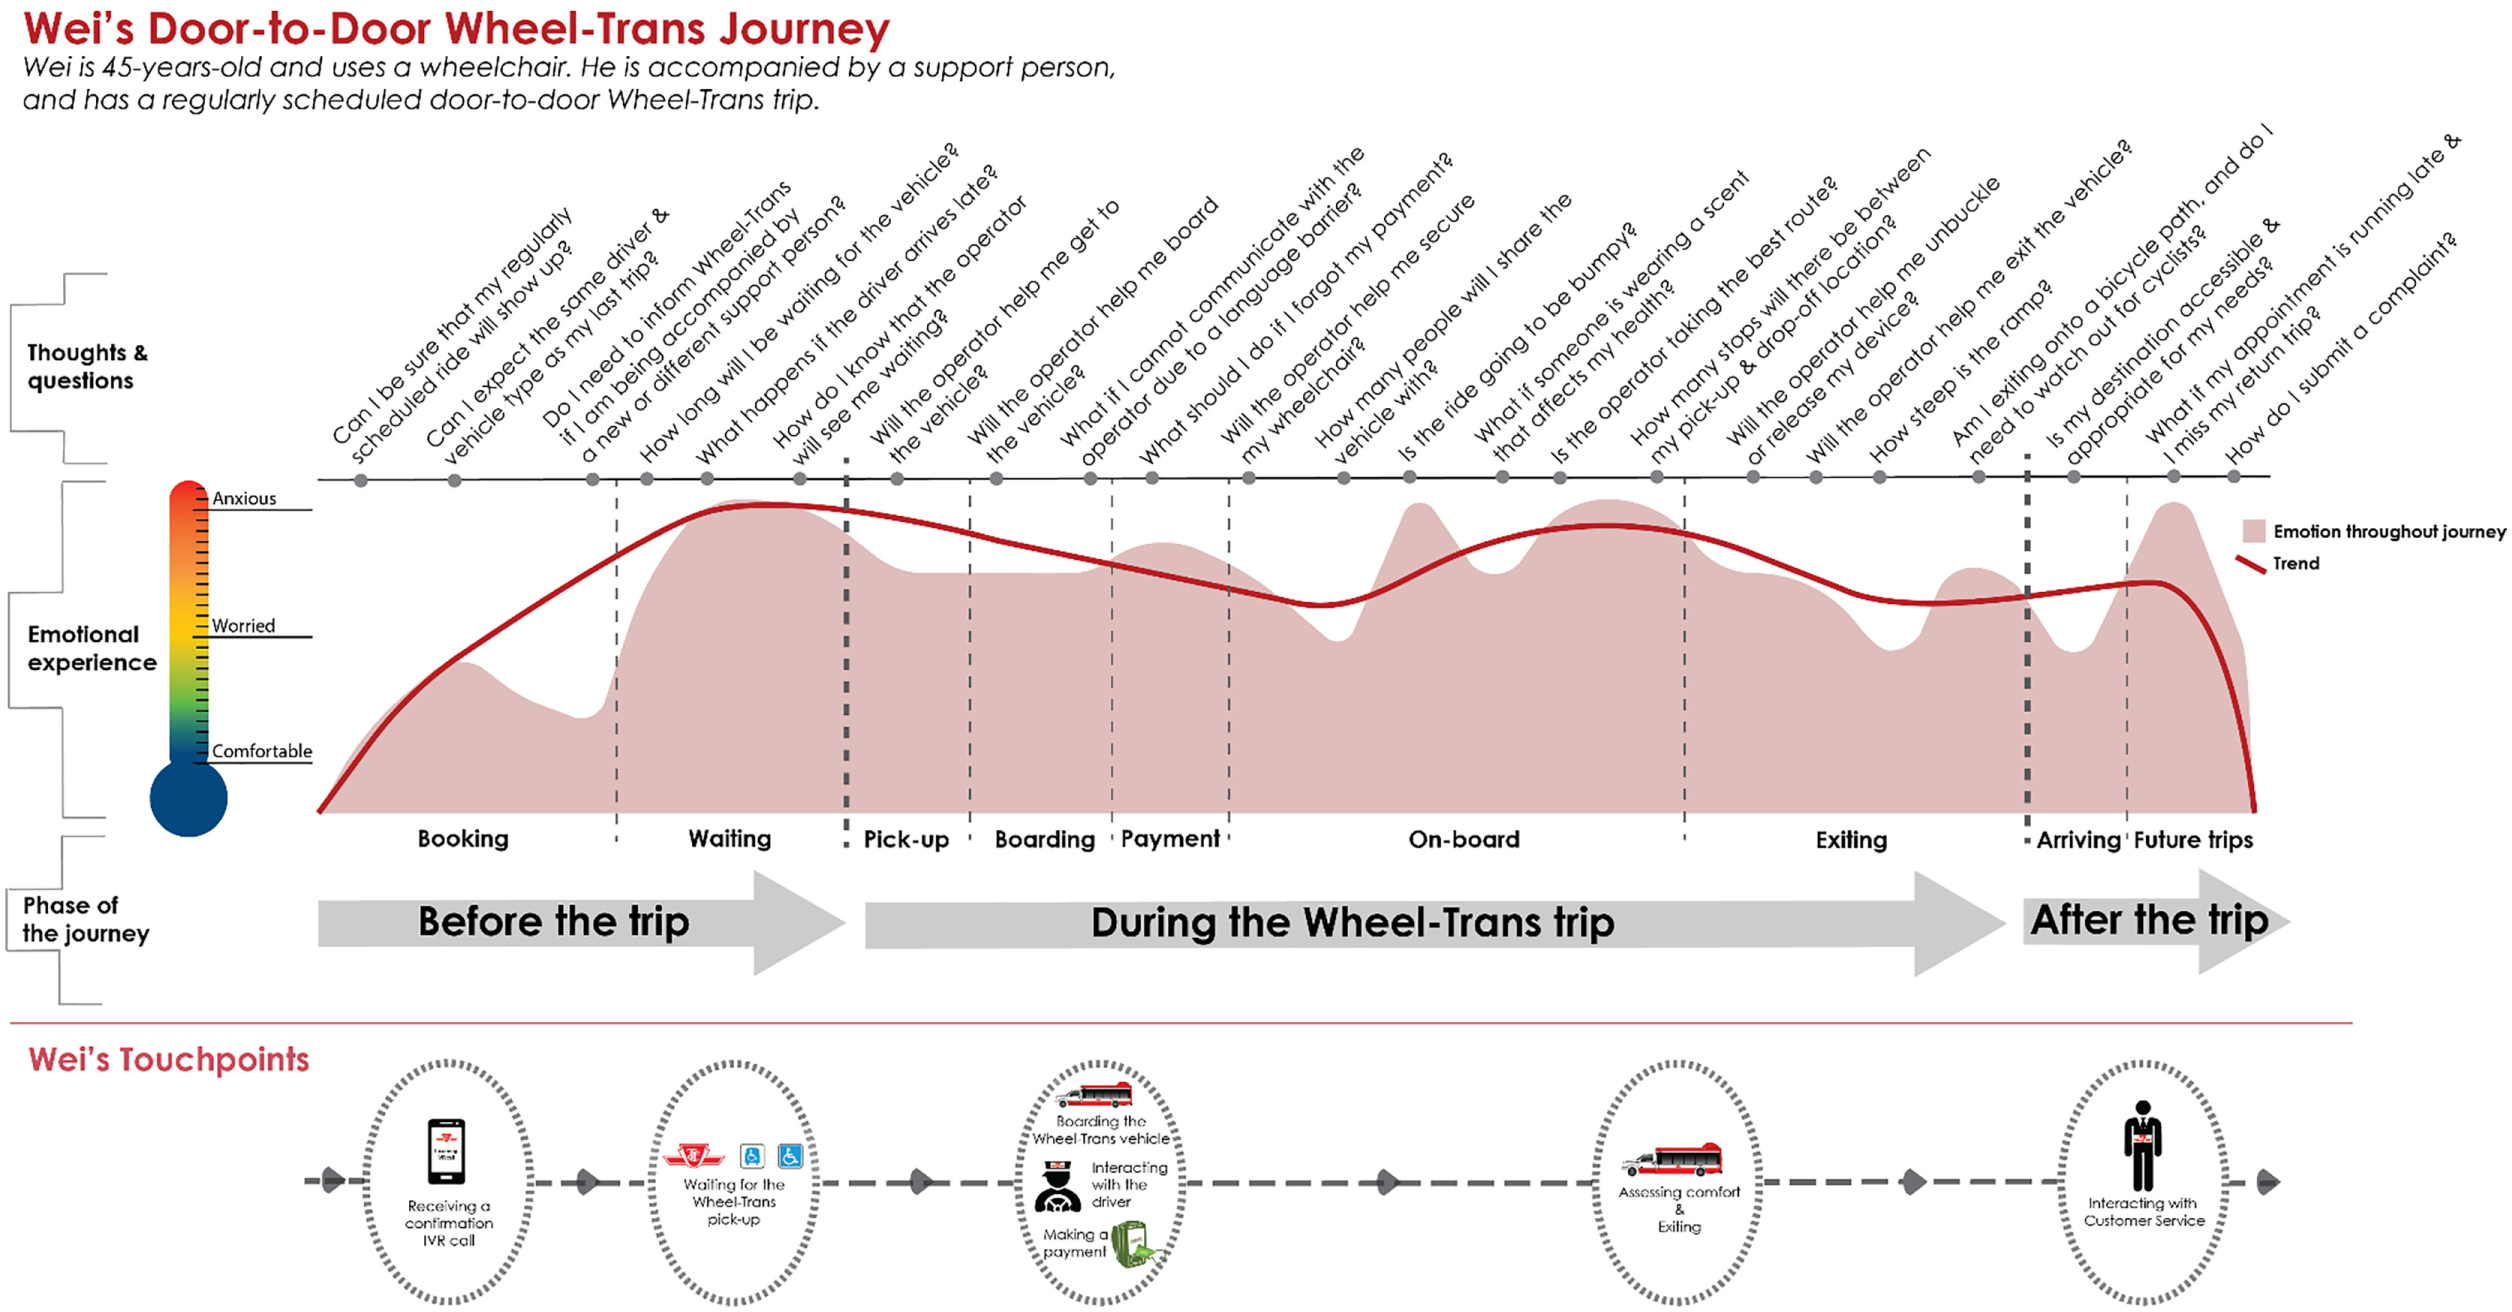
Wei’s customer journey map.
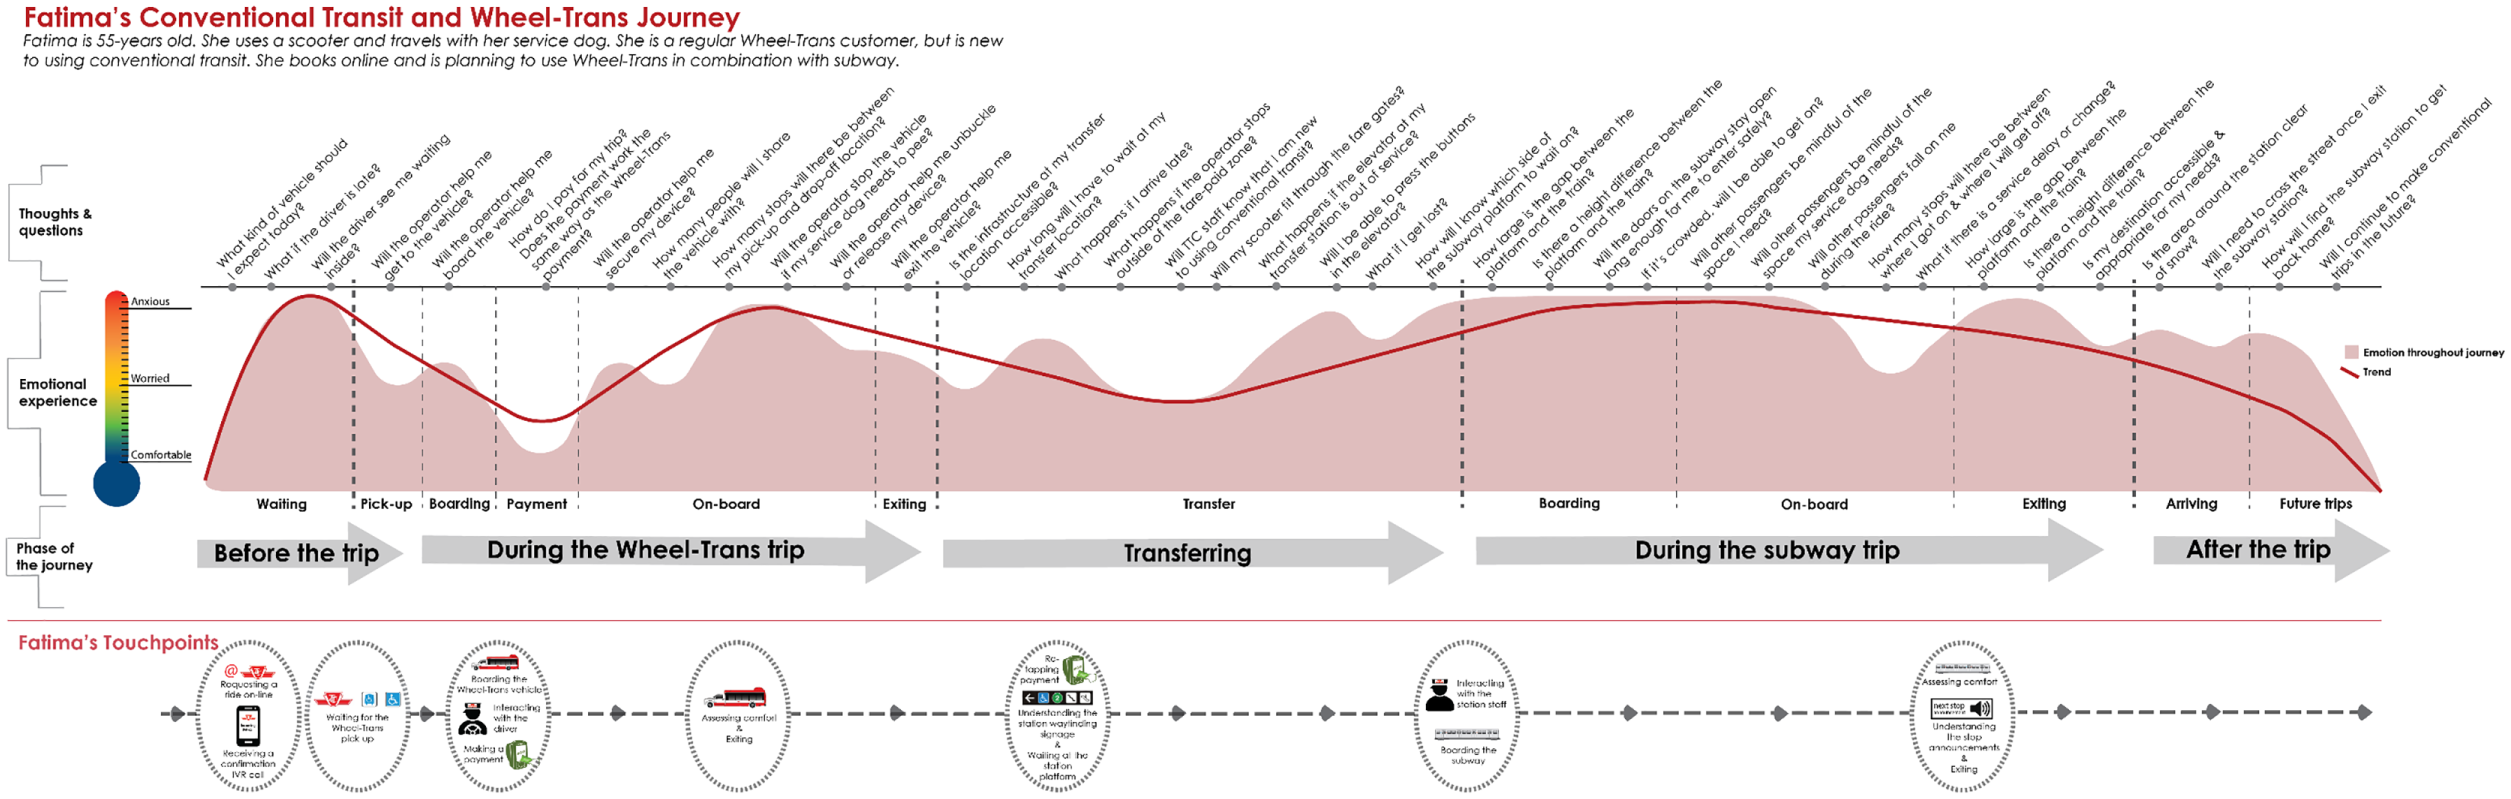
Fatima’s customer journey map.
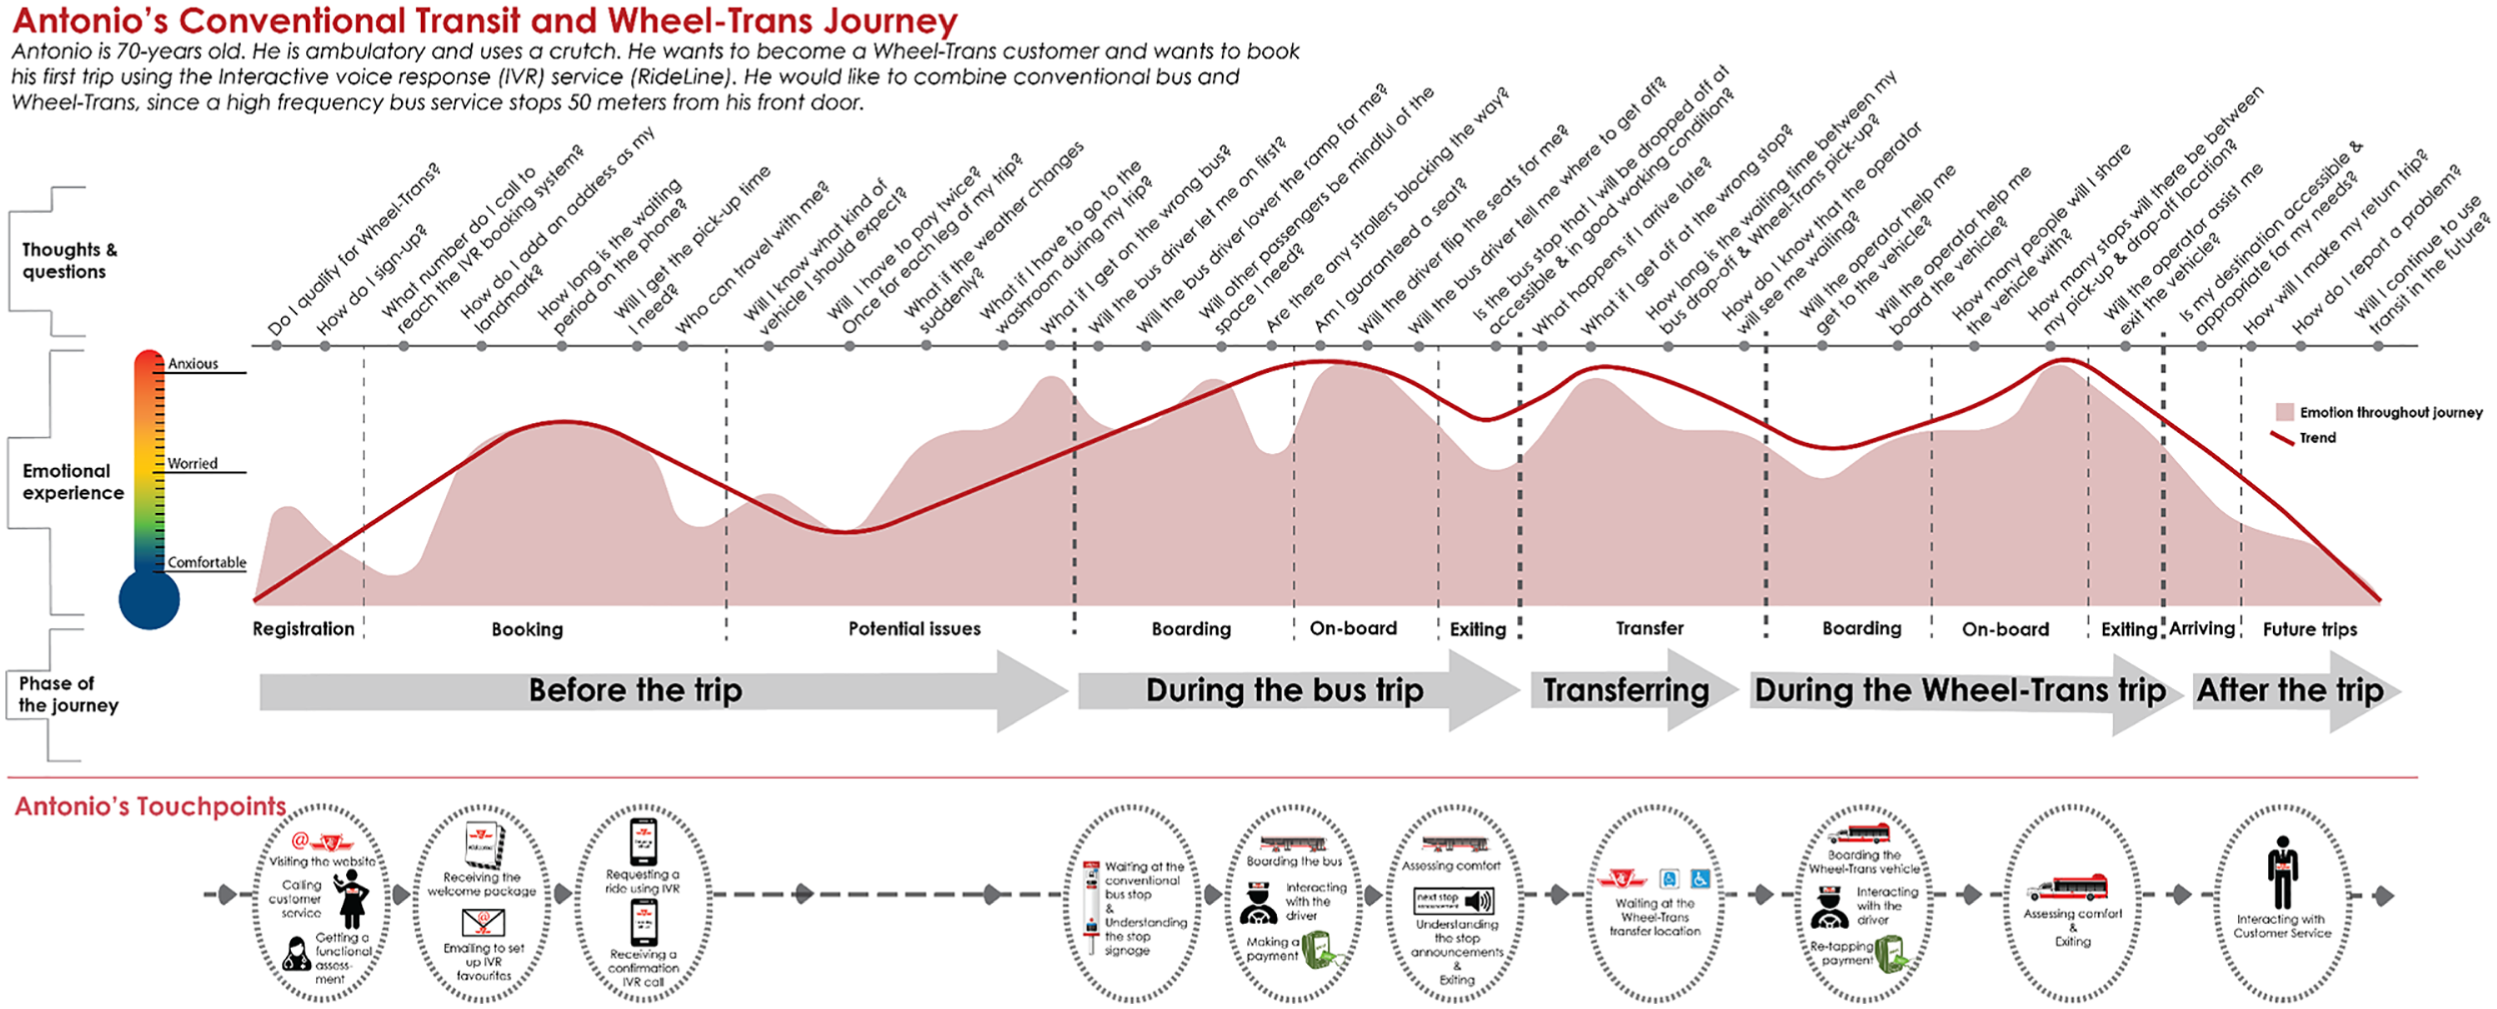
Antonio’s customer journey map.
Interviews were held in a large conference room at a TTC facility in February 2018. Participating interviewees were all members of the TTC’s ACAT. Ten interviewees participated in the interviews, of which eight were Wheel-Trans customers who personally identify as having a disability, and two were support staff working directly with Wheel-Trans customers on a daily basis. Of the eight customers, six identified as women and two as men, and both support staff as women. The gender distribution was similar for the participating staff, of which three were male and six were female. The age range of interviewees was 30–78 years old, and interviewers were mostly in their 30s and 40s. Although none of the interviewers used mobility devices themselves or openly identified as having a disability, all interviewees except for the support staff used a mobility device such as a walker, wheelchair, or scooter, and one participant was also accompanied by a service dog. The ratio of interviewees to interviewers was one to one, except for one group that had one interviewer for two interviewees. Groups of two interviewees and one or two interviewers were made randomly based on where ACAT members were sitting when they entered the room. In each group, one interviewer would ask questions, and the second would manually write down to interview notes verbatim. Small groups of two were selected instead of individual interviews because, according to many authors, the interaction and discussion between group members tends to generate richer information compared with the sum of individual input ( 24 – 27 ). Interviews lasted approximately 90 minutes.
Realizing Confirmatory Customer Journey Maps
Interview notes were collected from all participating staff directly following the interviews and used as the basis for coding and analyzing the data. Interviewees’ verbatim words, thoughts, and questions were then assigned to one of the four profiles based on relevance. In many cases the verbatim notes from the interviews were very similar to those that had been included in the exploratory CJMs. In these cases, the line representing emotion on the CJM was adjusted (when necessary) to be representative of the emotional score an individual assigned to the associated question or thought. In other words, the shaded curve in the CJMs represents where on the five-point scale the emotions associated with a specific comment or question were experienced. The trend line represents how customer emotions change from one touchpoint to another. The most significant change between the exploratory and confirmatory CJMs was the amount of thoughts and questions. Because the interviews allowed participants to elaborate on their experiences, additional points were added in the confirmatory maps. The results are presented in Figures 4–7, and the touchpoints are included in the figures for ease of interpretation.
Discussion
As a method to analyze and visualize customer information from multiple data sources, CJMs can be used to assess gaps in customers’ experience ( 6 ) and gain a holistic understanding about where changes to a service will really make a difference to customers’ experiences, and therefore also to their overall satisfaction. The gaps, in which negative customer emotions tend to be high, are likely to require attention from the agency by either improvements to customer service or changes in operational and/or customer policies. Specifically, in many cases the gaps show when and where customers tend to be the most anxious, and CJMs can serve as very valuable training tools for staff. The visualizations provide key insights into where staff need to be prepared to demonstrate increased patience and use more de-escalation techniques. As a result of the CJMs presented in this study, 21 Wheel-Trans policies were refined and updated with the goal of improving the emotional experiences of customers with regard to specific touchpoints, especially where customers experience high negative emotions. For example, during the customer interviews, several customers expressed concern about not understanding how long they are expected to wait for their scheduled ride to show-up. This concern is directly associated with the Late Cancellation and No-Show policy which outlines the responsibilities of both the agency and the customer with regards to pick-up time. In the CJMs depicted above, the high emotions that the customers experience directly before scheduled pick-ups suggest that customer education is needed about how Wheel-Trans applies this policy. Another policy has to do with customers’ expectation about vehicle size and type. For example, customers traveling with a non-folding wheelchair or scooter often experience high emotions because they are uncertain if there will be enough space to easily board the vehicle. The Vehicle Exception Policy sets out to clearly define “the guidelines and rules for when a customer requires a specific vehicle type due to the nature of their disability” ( 28 ) and provides information about the conditions under which a Wheel-Trans customer can expect a certain vehicle type. This policy change thus aims to remove the uncertainty that often results in customers experiencing a feeling of anxiousness. Another example is the updated Carry-on Items policy, which clarifies the number and size of items allowed to be carried on a vehicle, as well as whose responsibility it is to carry the items to and from the vehicle. These policy changes provide a framework that sheds light onto what a customer can expect when using Wheel-Trans services, and thereby help minimize uncertainty and emotional customer experiences. Although the purpose of this paper is not to discuss the application of CJM to policies in detail, it should be clear that the process described above is an example of how agencies could apply the lessons learned from CJMs to develop improved customer experience policies.
A similar methodology and framework could also be used to understand conventional transit customers’ experiences and emotions during their interactions with conventional transit services. For example, CJM profiles for customers who only use conventional transit could be based on customer segments that represent customers’ captivity to transit, mode use, trip purpose, transfers, and frequency of usage. For transit customers with disabilities who do not use the paratransit system, it is expected that the resulting CJMs would be similar to those representing paratransit customers traveling on conventional transit. Overall, CJMs can be used as a tool to help transit agencies communicate the needs and desires of their customer base to stakeholders (including employees) in an effective manner. CJMs can humanize large amounts of data by connecting customer experience statistics and customer feedback to a particular profile. TTC executives were interested in the big-picture overview that is be provided by the results of the CJMs, and many front-line staff would benefit from deeper understanding customer emotions at specific touchpoints. Accordingly, once the CJMs have been finalized, it is important to communicate the results internally among TTC staff and to external stakeholders. This would likely result in customer service staff, vehicle operators, and staff who work in subway stations benefiting from better understanding customers’ thoughts and questions when engaging directly with them. The results of the CJMs presented in this study were not only presented to TTC staff and transit authorities from neighboring regions, but also communicated externally to Wheel-Trans customers at various public meetings and engagement sessions. Communicating the agency’s customer engagement in a digestible, transparent, and clear manner is one ideal way to gain the trust of both staff and customers.
Conclusion
This paper demonstrated how transit agencies can use CJMs to gain a better understanding of paratransit customers’ experiences. Accompanying averages and trends with stories and experiences from real customers in a CJM is a prevailing way to communicate how user experiences can relate to many aspects of the business, and is especially valuable for understanding paratransit users’ unique trip experiences. Visualizing paratransit customers’ experiences, emotions, thoughts, and questions can be helpful for understanding their needs and how they interact with transit services. The study provides a five-step mixed-method approach which includes semi-structured interviews and customer data that peer-agencies can follow in order to extract useful customer information from their customer bases.
The results demonstrate how practitioners working in the field of conventional transit and paratransit can use existing customer data in combination with interviews to collect detailed information and insight about important nuances regarding customers’ experience while interacting with transit services. The findings are helpful for practitioners because they provide a real-life example of how to execute and analyze CJMs in transit and how to apply the lessons learned from CJMs to the process of developing improved customer experience policies. The process of developing CJMs through customer engagement allowed the authors to develop a vision as to how policies could be developed, improved, and implemented to best meet customers’ needs. Whereas executives are likely to be interested in the big-picture overview that can be provided by mapping customers’ experiences, many front-line staff are likely to benefit from understanding how customers’ experiences are related to their emotions, and how their emotions change throughout their transit experiences. Informing all levels of the business about customer experience is likely to improve interactions with customers and result in higher levels of overall customer satisfaction for transit users.
Footnotes
Acknowledgements
The authors would also like to thank the members of the TTC Advisory Committee on Accessible Transit (ACAT) for participating in this study. Their input was pivotal for gaining a better understanding of Wheel-Trans users’ customer experience in Toronto. We would also like to thank the members of the Wheel-Trans Transformation Program for their support as well as Eve Wiggins, Lynn Middleton and the staff at Wheel-Trans for their support and feedback. We would also like to thank Stantec Consulting for introducing the members of the research team, as well as the three anonymous reviewers for their helpful comments. The ideas and findings presented in this paper represent the authors’ views in an academic exercise.
Author Contributions
The authors confirm contribution to the paper as follows: Study conception and design: van Lierop, D.; Data collection: van Lierop, D., Eftekhari, J., O’Hara, A., & Grinspun, Y.; Analysis and interpretation of results: van Lierop, D., Eftekhari, J., O’Hara, A., & Grinspun, Y.; Draft manuscript preparation: van Lierop, D., Eftekhari, J. All authors reviewed the results and approved the final version of the manuscript.
The Public Transportation Group (AP000) peer-reviewed this paper (19-00156).