
Abstract
This paper presents the findings of a study that investigated travelers’ transport mode-choice behavior in the context of medium- and long-distance trips, with special attention given to attributes of train access modes. The goal of the paper is to provide greater insight into the contribution of both access and main travel-mode attributes to the travelers’ decision to use the car or the train for medium- and long-distance trips. Based on data collected through a stated choice experiment, a mixed logit model is estimated to identify the contributions of all included attributes. In total, 32 attributes were included in the experiment describing the main transport modes, train and car, and the access modes: bicycle, bus, and drop-off/car. Based on a fractional factorial design, the attributes and corresponding levels were combined into 81 different mode-choice situations. The stated choice experiment was included in an online questionnaire that was distributed among members of a marketing panel. Panel members were invited to choose the preferred travel-mode for a medium- and long-distance trip given a detailed description of both main and access modes. Each member evaluated nine choice situations. In total, 415 panel members completed the questionnaire. Combined, panel members evaluated 3,735 choice situations. The mixed logit model analysis shows that time and cost-related attributes significantly contribute to the attractiveness of transport modes. However, these effects differ considerably between the investigated modes. Conversely, safety-related attributes, chance of delay, and transfer time from access mode to train platform play a minor role.
The introduction of the car in the late 1800s and the increase in car ownership changed the spatial structure of urban settlements considerably ( 1 ). People were no longer forced to live close to their work or to any other activity (e.g., social, leisure, and shopping). One of the consequences of living some distance away was that people started to make longer-distance trips. The most frequently used transport mode to make medium- and long-distance trips in the Netherlands is the car, followed by the train ( 2 ). In many cases both transport modes are considered by travelers when making a choice. Van Exel and Rietveld found that 45% of the train travelers on a major corridor in the Netherlands have a car in their choice set, whereas 47% of car travelers have public transport in theirs ( 3 ).
Looking at the use of cars, the growth of the population in and around cities is currently causing major problems such as congestion, pollution, and parking problems ( 4 ). The accessibility of urban locations is worsening, and the livability of residents in cities is under pressure. To solve the problems caused by increased car use, transportation planners are diligently looking for opportunities to stimulate travelers to change from the car to more sustainable transport modes. For medium- and long-distance trips in the Netherlands, the train is considered a viable alternative to the car ( 2 , 3 ). To encourage car drivers to change to the train, the service provided by the train has to approach the level of service provided by cars ( 5 , 6 ). In this context, the mode of access to and egress from train stations is acknowledged as an essential part of the train service resulting in higher use of public transport ( 7 ). Detailed insights regarding the role of access and egress modes in travelers’ mode-choice decisions are still limited. This is especially true when looking at the competition between car and train and considering attributes besides travel time and cost ( 7 , 8 ).
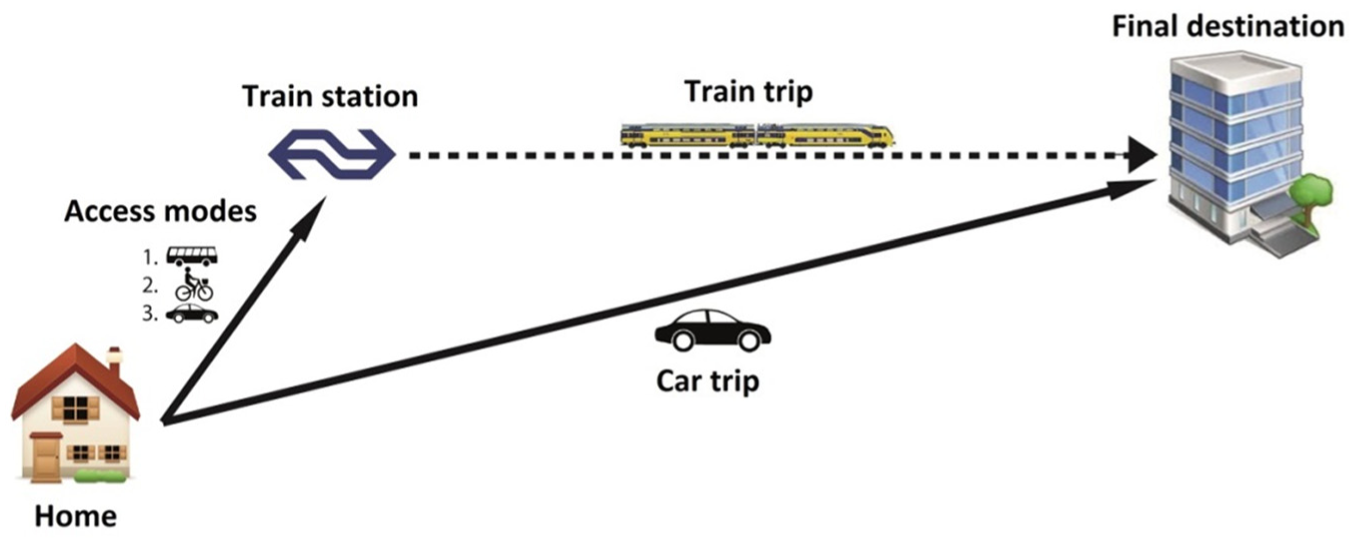
The aim of this study is to provide more insight into the factors that contribute to travelers’ mode-choice decisions for medium- and long-distance trips with special attention paid to the competition between the transport modes of car and train. In the context of the Netherlands, medium- and long-distance trips cover a distance of approximately 50 km or more, mostly between major cities ( 2 ). In the current study, special attention is paid to the role played by the various attributes of train access modes in travelers’ mode-choice decisions. In the Netherlands, the train is a feasible alternative to the car when considering medium- and long-distance trips (Figure 1). A train journey can be subdivided into different parts that all need to be considered when exploring travelers’ transport mode-choice decisions, as it is not a simple door to door form of transport. Rietveld stated that “the market potential of railways services depends on the quality of the total chain from residence to place of activity” ( 9 ). In this study, the focus is on the access mode because it is an essential element in the competitive position of the train ( 9 ). Changing the mode of access to stations is also seen as an effective way to improve public transport access to low-wage jobs ( 7 ).
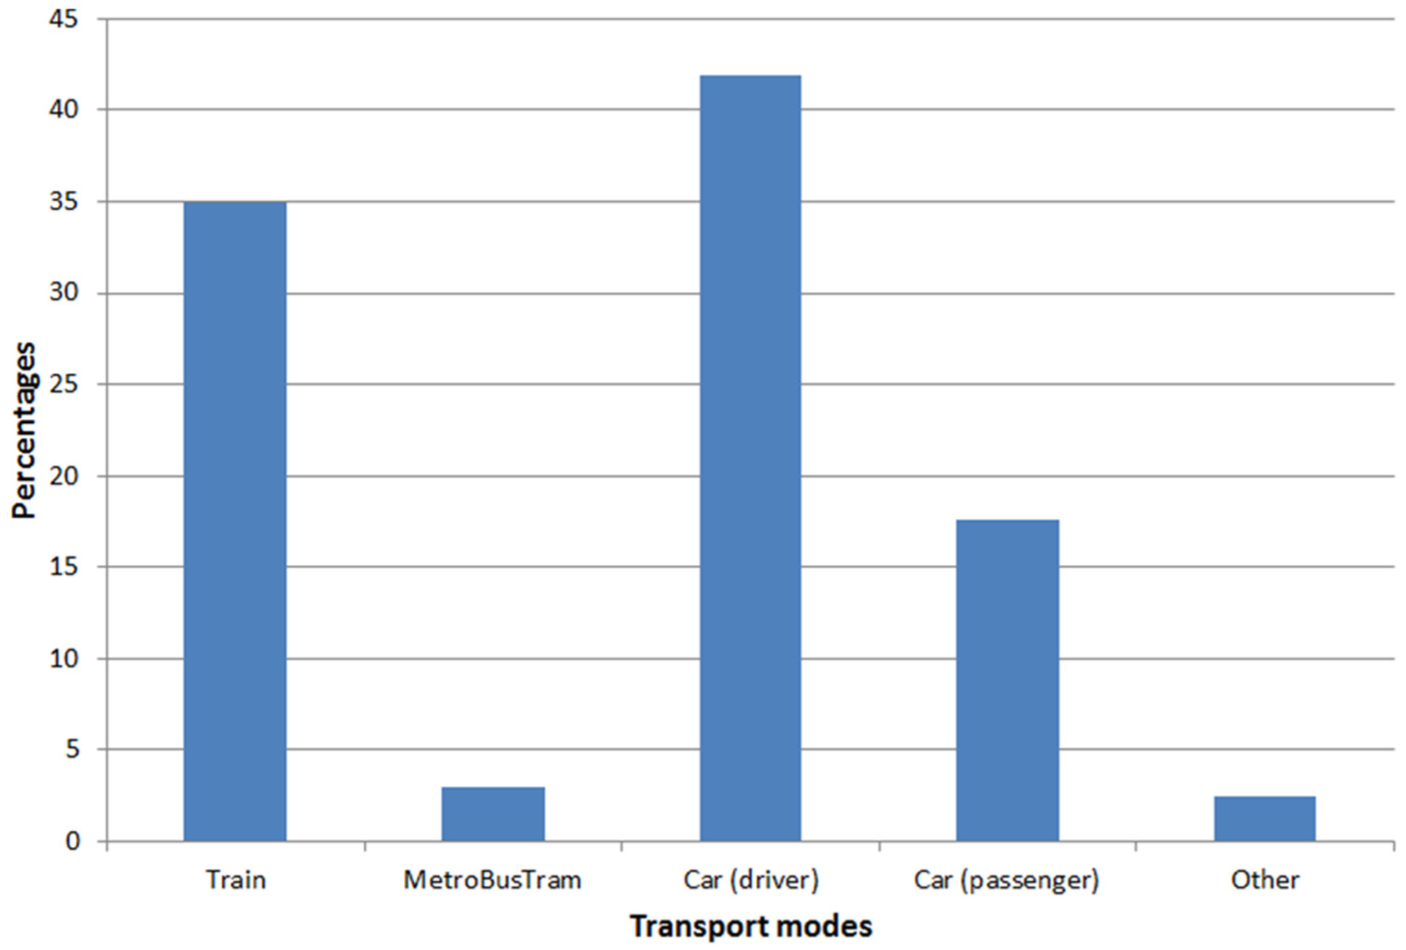
Transport mode share: medium- and long-distance trips in the Netherlands ( 2 ).
In the Netherlands, the bike is the most frequently used train access mode followed by walking and public transport (Figure 2). Figure 2 shows that, with 11%, the car (driver and passenger) also plays a considerable role as an access mode.
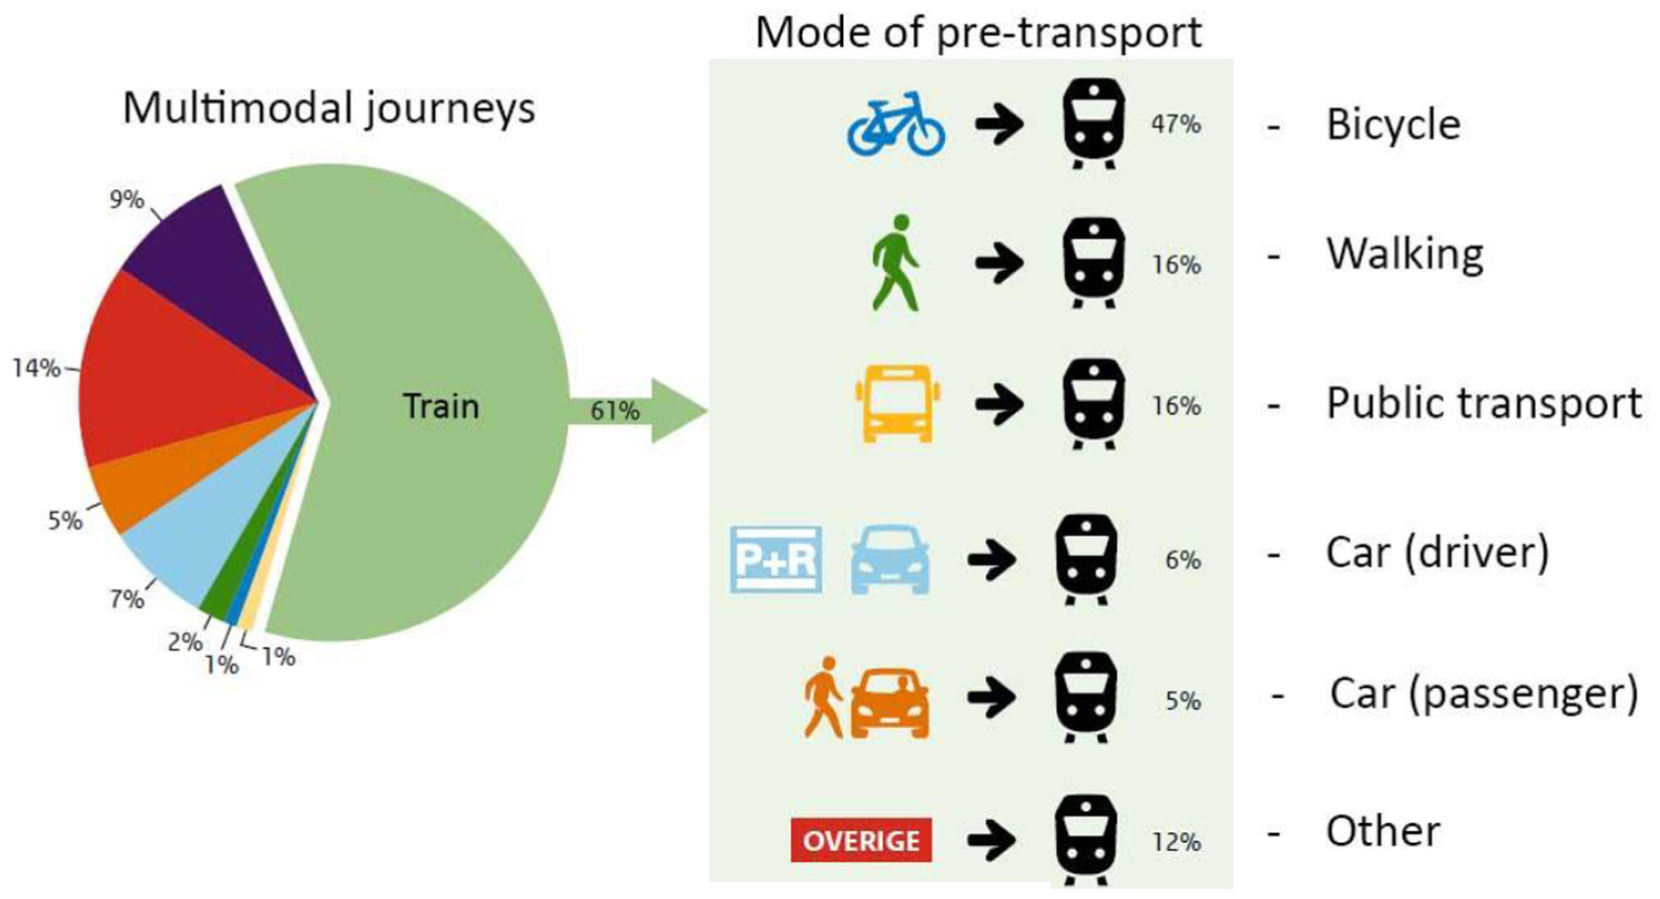
Access mode use in the Netherlands ( 10 ).
The remainder of the paper is organized as follows. First, a brief overview of previous studies is given to clarify the background of the current study. In the section that follows that, the adopted research approach is outlined. Next, the data collection methods are presented including a brief description of the research sample. The subsequent section illustrates the experiences of the respondents regarding traveling over medium- and long-distances and their use of transport modes. After this, the results of the model analyses are presented. The paper closes with conclusions, and makes some recommendations for transportation planners, and suggestions for future research.
Literature
In the past, several studies regarding the characteristics of access journeys to public transport in general and trains in particular have been carried out. Based on these studies, an overview of insights regarding the adopted research focuses and included attributes is presented. Regarding the research focus a distinction can be made between studies dealing with travelers’ mode-choice behavior in general, studies exploring customer satisfaction with public transport services, and those dealing specifically with train journeys.
In the first types of study, researchers are looking for attributes that influence travelers’ choices mostly between car, public transport, bike, and walking. Some studies extend the set of choice alternatives with carpool and telecommuting ( 11 ). Others specifically focus on the competition between car and train ( 3 , 5 ). Goel and Tiwari investigated factors that contribute to the choice of access mode (walk, cycle, cycle rickshaw, auto rickshaw, motorized two-wheeler, bus, and car) of metro users in Delhi ( 12 ). They found that trip length, vehicle ownership, location of metro station, and population density are significantly associated with the choice of access mode. Such studies investigate a variety of attributes covering physical environment, transport modes, trip-maker and trip characteristics, and psychological factors. Most studies are based on revealed choice behavior. Almost all studies use a general specification of the public transport access mode, for example, by including walk and bike as access modes ( 3 ) or distance to public transport service ( 5 ). Brands et al. argued that mode-choice models do not sufficiently consider the car and bike as access modes to public transport ( 8 ). They investigated travelers’ public transport route choices with all kinds of single-mode and multimodal travel options without paying attention to the attributes of the various access modes.
The second group of studies mainly focuses on attributes that make public transport more attractive. For example, Redman et al. investigated various public transport quality attributes that might inspire car drivers to use public transport more often ( 6 ). Based on an extensive literature review, they concluded that attributes such as reduced fare promotions will attract car drivers but that other attributes related to accessibility, reliability, and mobility provision will keep the car drivers using public transport. An alternative approach is presented by Dell’Olio et al. who investigated the effect of variables on public transport users’ desired quality of service ( 13 ). Based on a stated choice experiment they found that waiting time at the bus stop, cleanliness of the vehicle, and comfort of the buses are the most valued variables. Variables such as driver kindness, bus occupancy, and journey time were found to be less valued. More recently, Mouwen investigated customers’ satisfaction with public transport services ( 14 ). Based on an extensive data set containing the satisfaction scores of urban and regional Dutch public transport users, he concluded that the service attributes of on-time performance, travel speed, and service frequency are the most significant in determining customer satisfaction levels. A study by Salas evaluated non-motorized access ratings in relation to increasing non-motorized access to commuter rail stations ( 15 ). He found that only providing bike-lanes and sidewalks is not sufficient to improve a station’s access rating. Attention also has to be paid to the connectivity of bike and pedestrian routes, the quality of facilities maintenance, and policies affecting non-motorized transportation projects. This topic was also investigated by Chowdhury et al.: they looked at how the ease of access to terminals influences public transport users’ attitudes ( 16 ). Based on the reactions of public transport users, they concluded that ease of access to terminals and accessibility to various destinations has a significant effect on users’ ridership satisfaction.
The final group of studies focuses on travelers’ train use and the access of train stations. Some studies investigate customer satisfaction with a train journey in combination with train access mode. Givoni and Rietveld investigated the contribution of several attributes (price/quality ratio, overall station evaluation, connection with public transport, and car and bicycle parking) on a traveler’s perception of train station access ( 17 ). They found that the quality of the station and the access/egress facilities have a significant effect on the general perception of traveling by train. In addition, Brons et al. ( 18 ) related the number of daily trips made by rail with more or less the same characteristics as used by Givoni and Rietveld ( 17 ). They found that the quality of the access to the station is an important element in explaining rail use. Another very interesting finding of the study was that improving the journey to the station seems to be more important than facilitating a smooth connection between access and main mode through better parking facilities.
Looking at approaches and findings in previous studies, it appears that only limited attention has been paid to attributes of different access (bicycle, bus, and car/drop-off) and main transport modes (train and car). Several researchers acknowledged that detailed insights into the contribution of access modes to the attractiveness of public transport are essential ( 5 , 6 , 8 , 15 , 17 ). Therefore, a more detailed investigation into individual attributes was adopted as the main topic of the current study.
Research Approach
To get insight into travelers’ preferences regarding different attributes of both access and main transport modes for medium- and long-distance trips, a stated choice experiment was developed. A stated choice experiment provides a much better opportunity to investigate the competition between car and train than a revealed choice experiment ( 19 ). Potential travelers can be confronted with many more details of both alternatives even when they rarely use these. In the experiment four different transport mode combinations were included, namely bus–train, bicycle–train, drop-off/car–train, and solo car (Figure 3). The figure was also included in the questionnaire to clarify the choice options.
Four different combinations of transport modes ( 20 ).
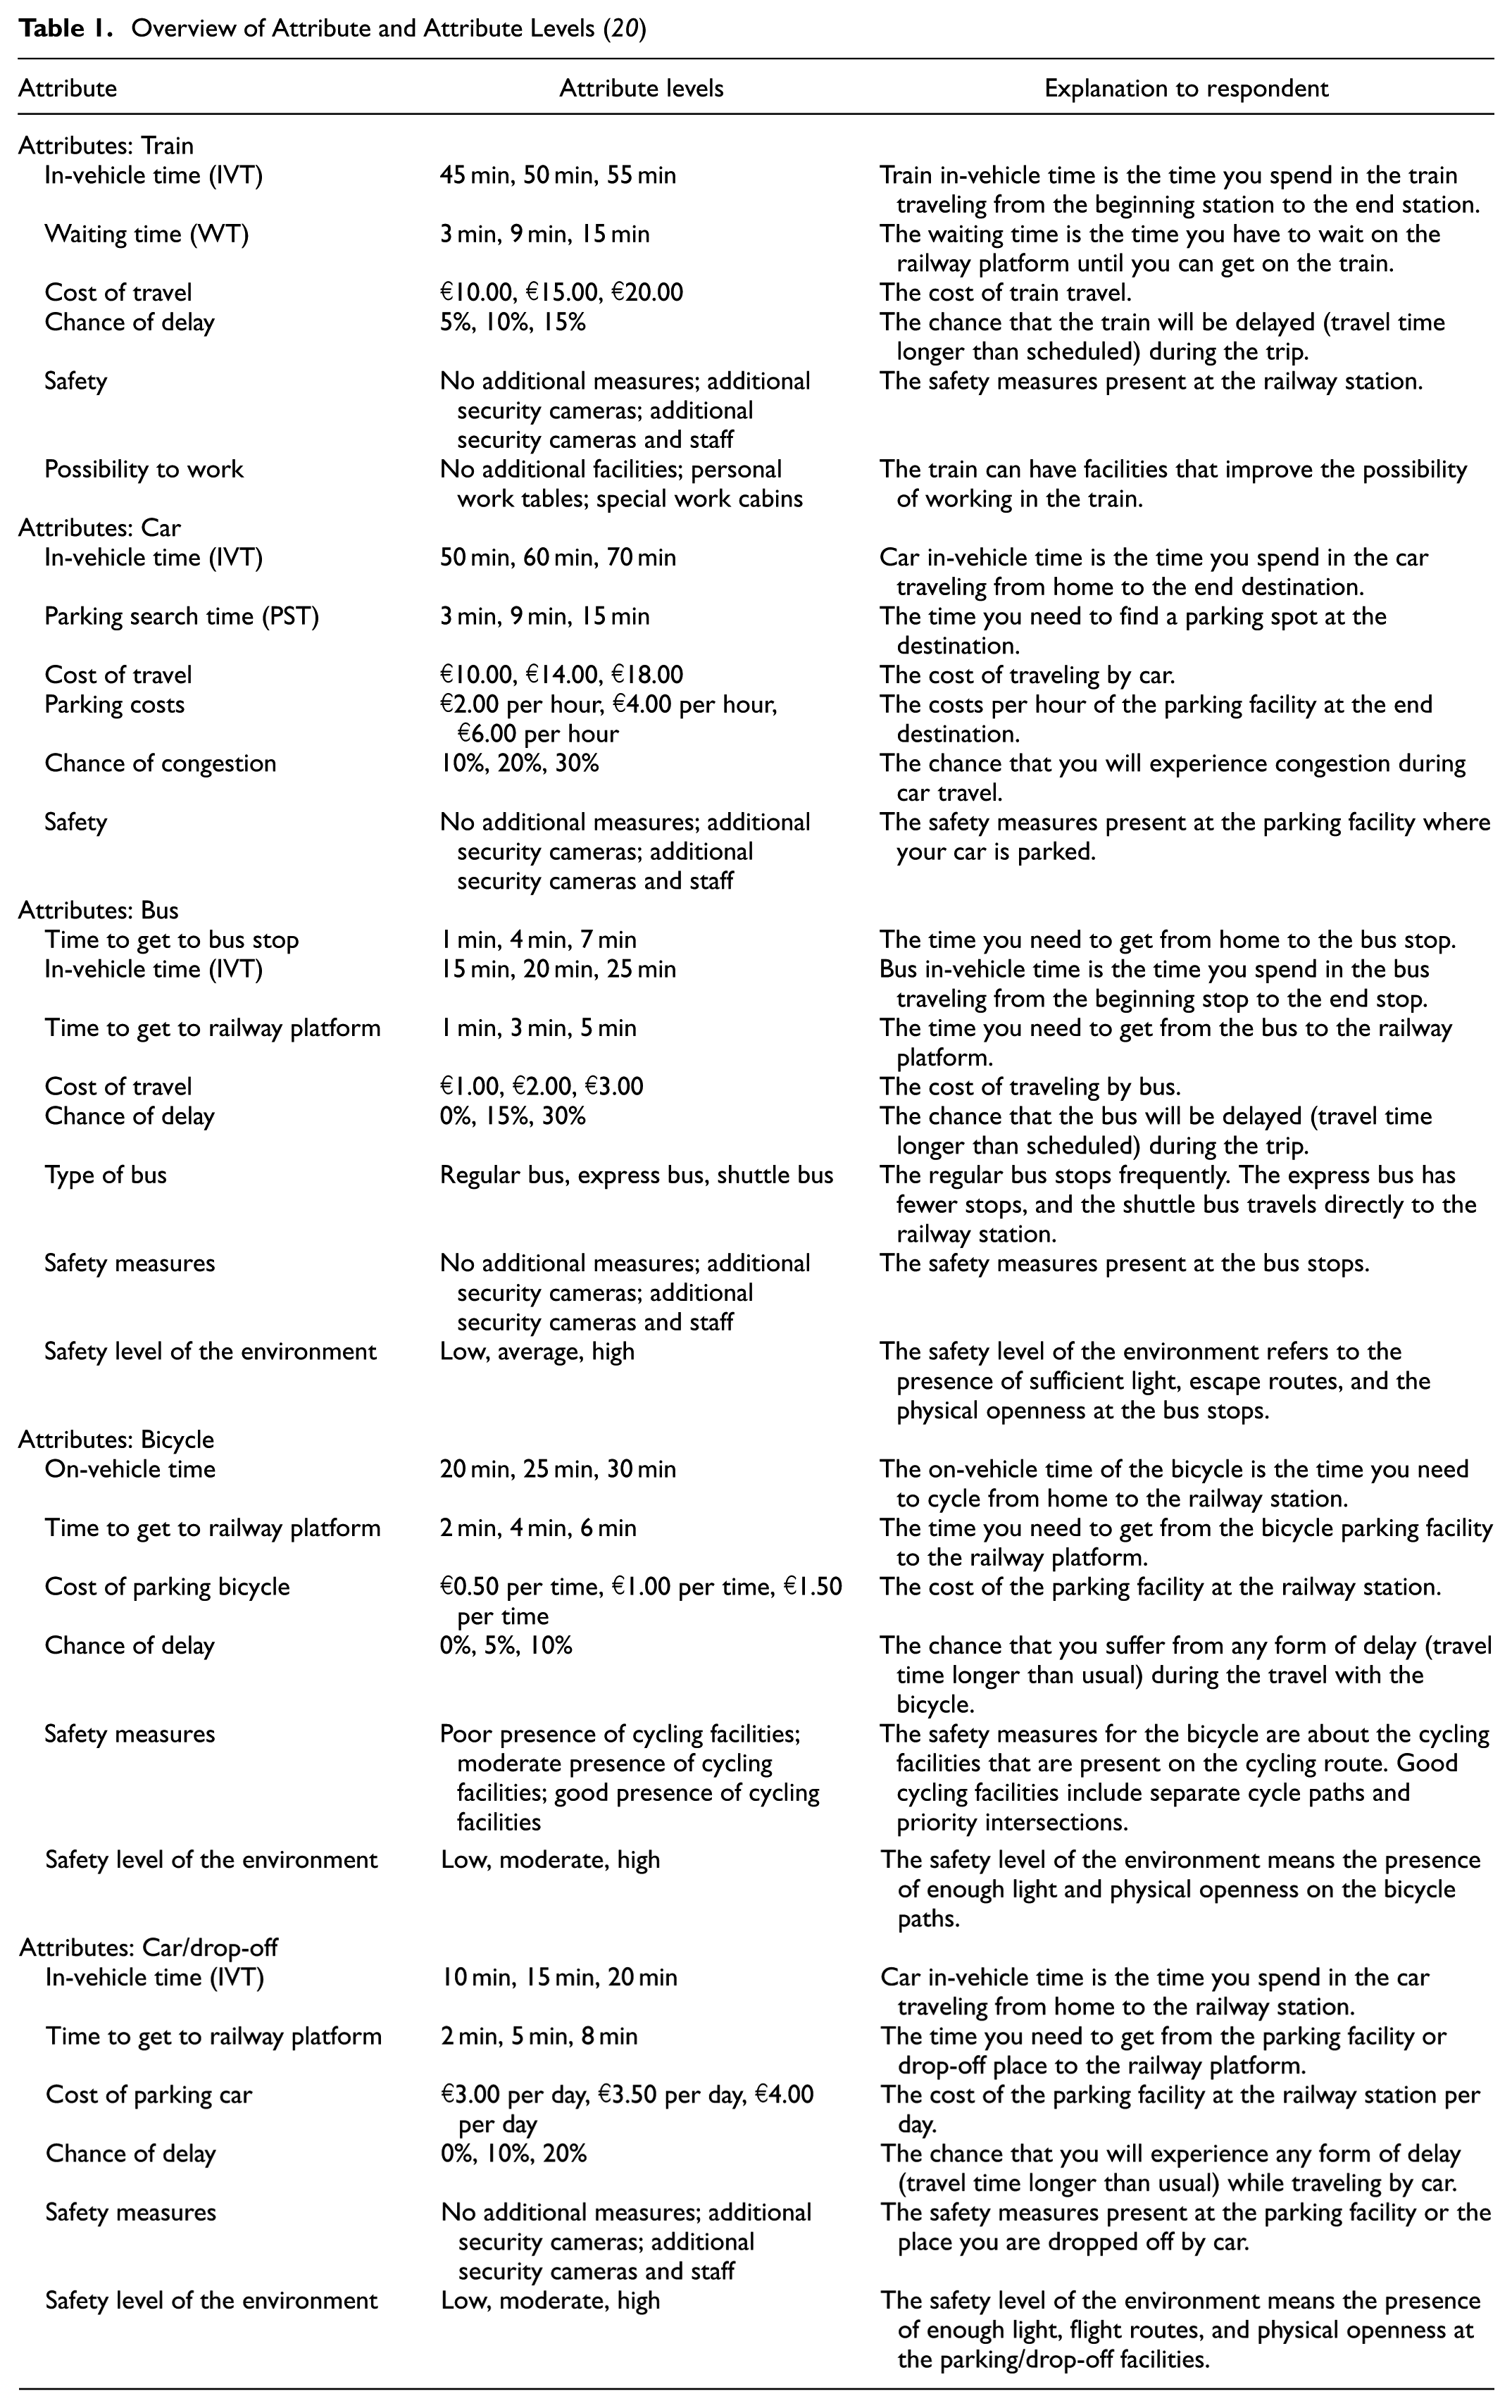
For each separate mode various attributes were selected to represent the appearance of the separate transport (access) modes. The selection was based on the findings in the literature review and, for each transport mode, covers the travel time and costs, connected safety measures and levels, and chance of delay. In addition, some mode specific attributes were selected such as walking time to bus stop (bus) and cost of parking (bicycle and car). Finally, one attribute was specified to represent the connectivity between the various access modes and the train. In total, 32 attributes were included in the stated choice experiment. Table 1 gives an overview of the selected attributes and their corresponding attribute levels. The table contains a short description of each attribute that was also included in the questionnaire. The levels of the travel time attributes set were based on a valid situation for an average trip between a respondent’s home location surrounding Eindhoven and one of the cities in the Netherlands for which car and train are competing options.
Overview of Attribute and Attribute Levels ( 20 )
The attribute levels were combined into choice situations using a fractional factorial design of 332 ( 19 , p. 115 onwards). In total, 81 different choice situations were generated. One example of a choice situation is presented in Figure 4. Respondents were invited to indicate what (combination of) transport mode they preferred when traveling from their home location in the vicinity of Eindhoven to one of the major cities in the Netherlands (see next section for included cities). There were no specific travel characteristics specified such as travel purpose, travel day, or travel party. Each respondent was invited to evaluate nine different choice situations.
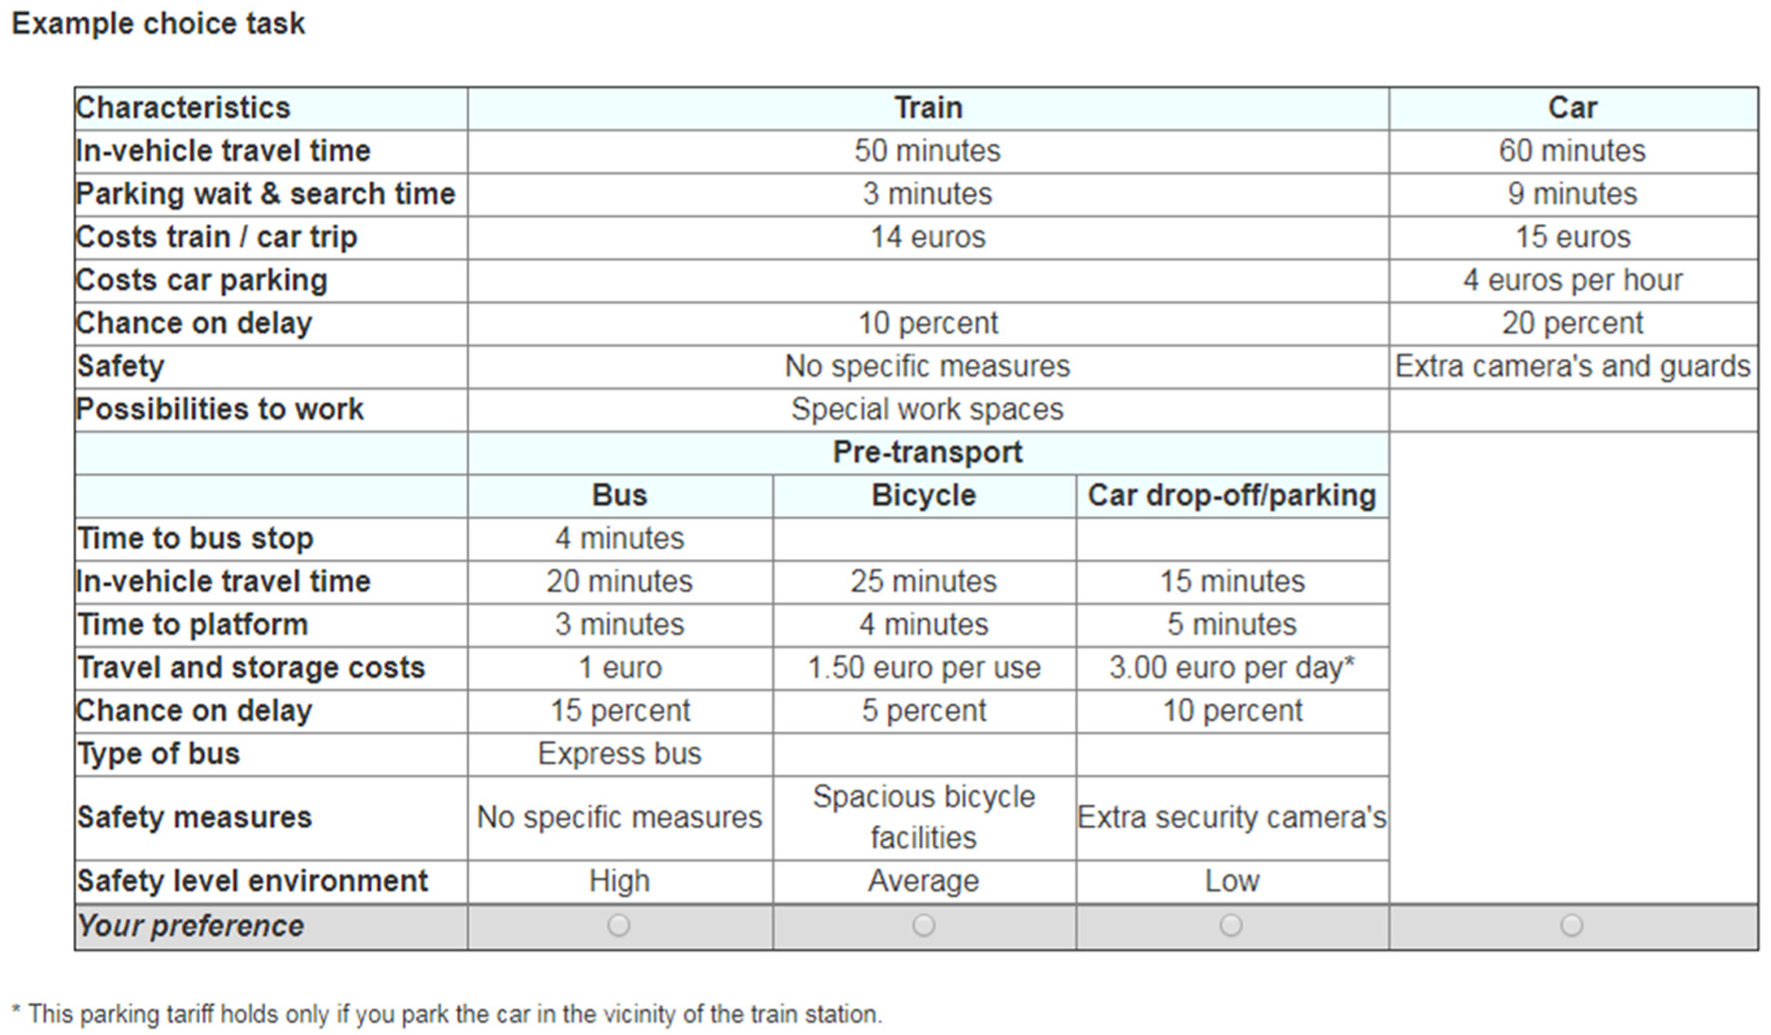
Example transport mode-choice task.
Data Collection
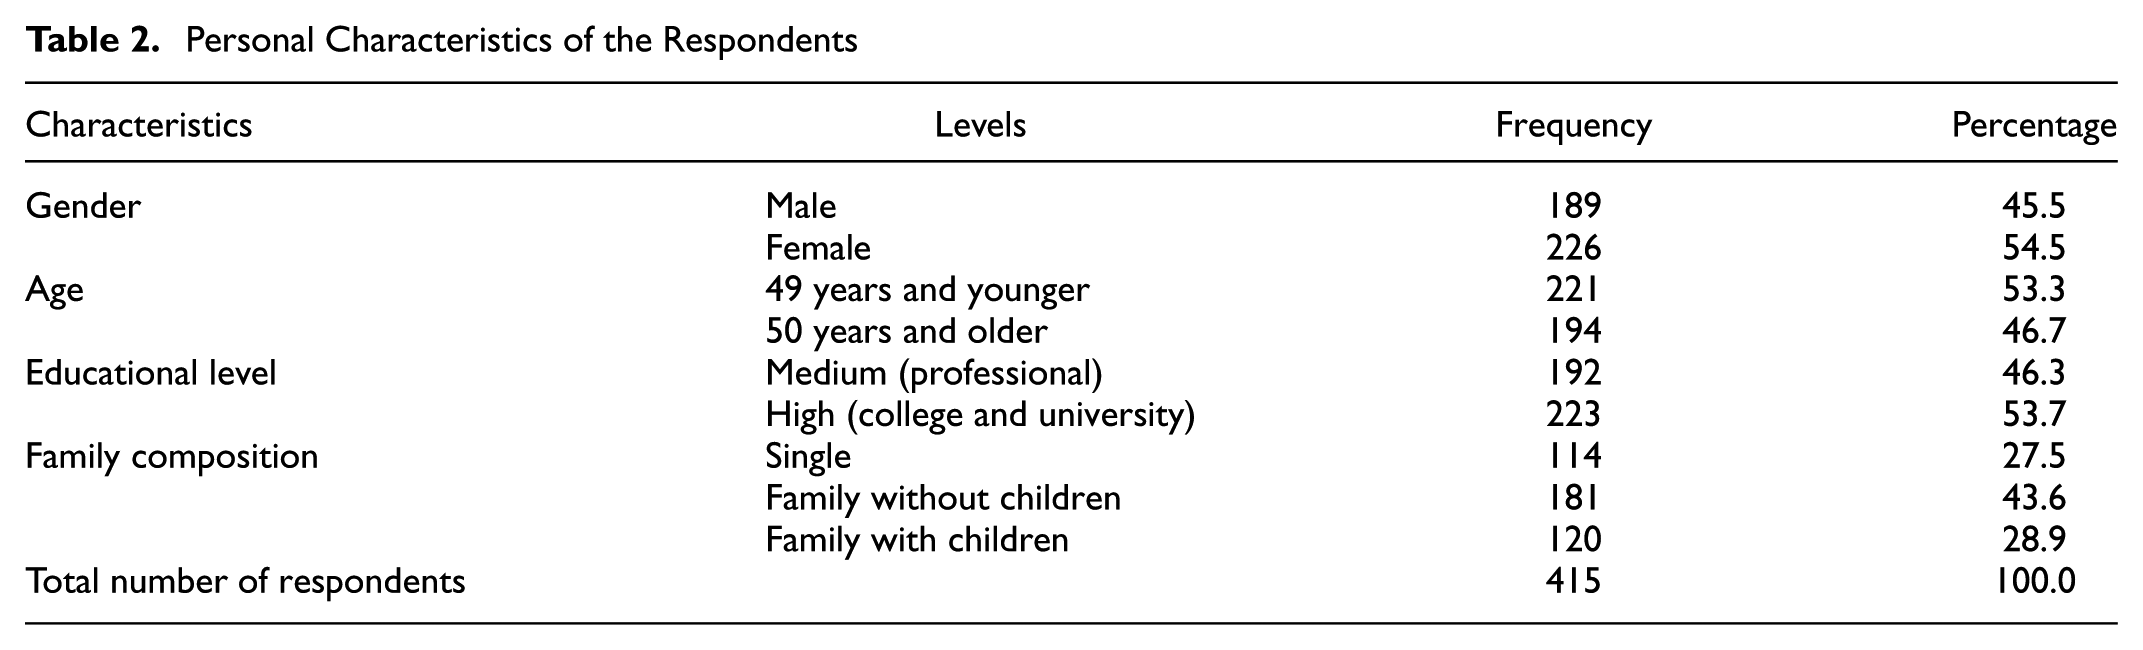
The data collection took place in the spring of 2015. The respondents that participated in this study were recruited from the panel of PanelClix Online Market Research (www.panelclix.co.uk). Because of the setting of the stated choice experiment, only panel members living in Eindhoven or in the vicinity of Eindhoven were invited to participate (for spatial distribution, see Figure 5). In total, 415 respondents completed the questionnaire. Certain personal details of the respondents are presented in Table 2. The table shows that the sample is very diverse with an acceptable respondent distribution across all distinct levels.
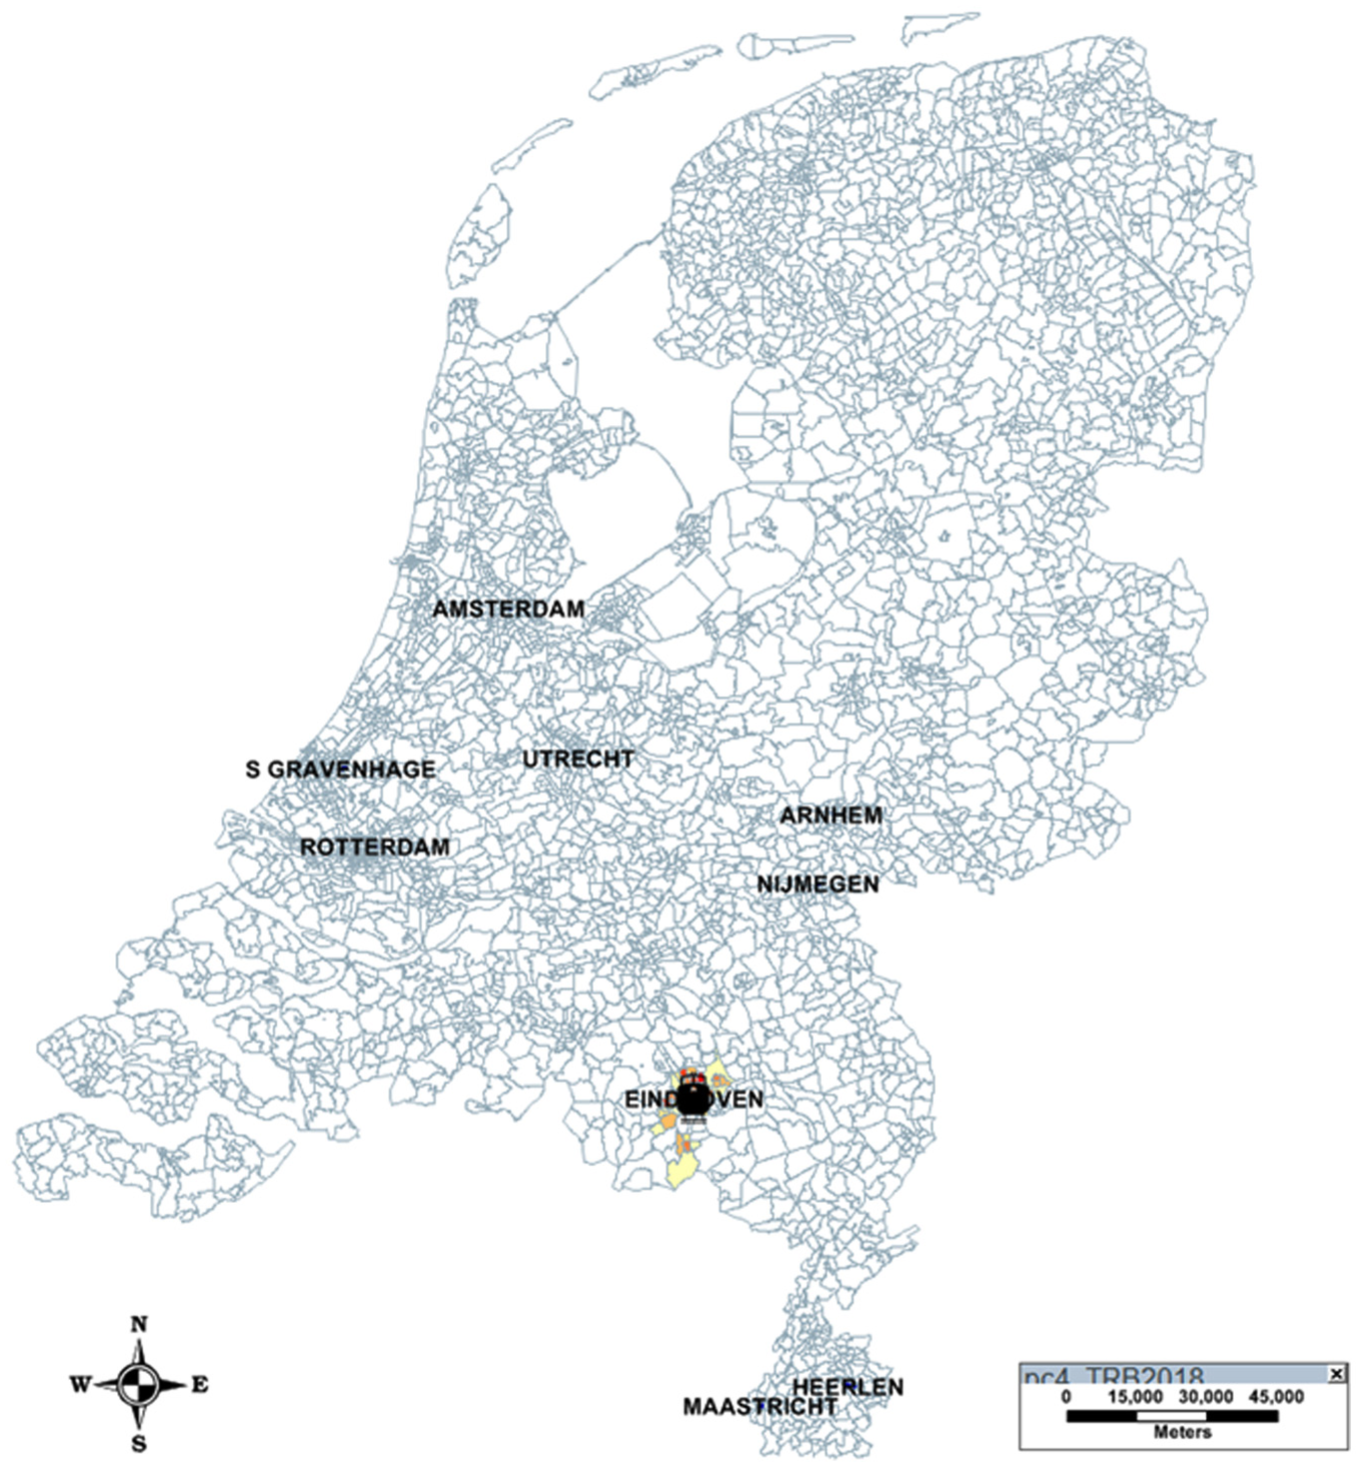
The spatial distribution of respondents and major cities in the Netherlands.
Personal Characteristics of the Respondents
Descriptive Analyses
The first part of the questionnaire was set up to gain greater insight into the respondents’ experiences of traveling from Eindhoven to major cities in the Netherlands (Figure 5). In total, eight cities were included in the questionnaire: Utrecht (by car 90 km from Eindhoven), Amsterdam (130 km), Nijmegen (70 km), Arnhem (80 km), Heerlen (90 km), Maastricht (90 km), Rotterdam (110 km), and ’s-Gravenhage (140 km).
These questions were also included to prepare the respondent for the stated choice part in which they had to assume that they were going to make a trip from their home location in Eindhoven or surroundings to a major city in the Netherlands. In this paper two major insights are highlighted: the respondents’ visit frequency to major cities and the mode used when a respondent visits a major city. Regarding visit frequency, the respondents were asked to indicate for the aforementioned eight cities how often they have visited each (1 = Never, 2 = Sometimes, 3 = Often, 4 = Very often). For presentation purposes, the numbers connected to the answer categories are summed, creating a form of “visiting index.” The values of the index range between 8 (none of the eight cities have been visited) and 32 (all eight cities have been visited “Very often”). Subsequently, the indices are classified into categories for which a higher category means more experience visiting a major city. Figure 6 shows the percentages of respondents assigned to each category. There was no respondent that had “Never” visited all of the included cities (value 8). There was only one respondent who frequently visited all eight cities (value 32). From Figure 6 it can be concluded that all respondents have some experience of visiting at least one of the major cities in the Netherlands. This makes it easier for the respondent to understand the provided choice situation in the stated choice experiment.
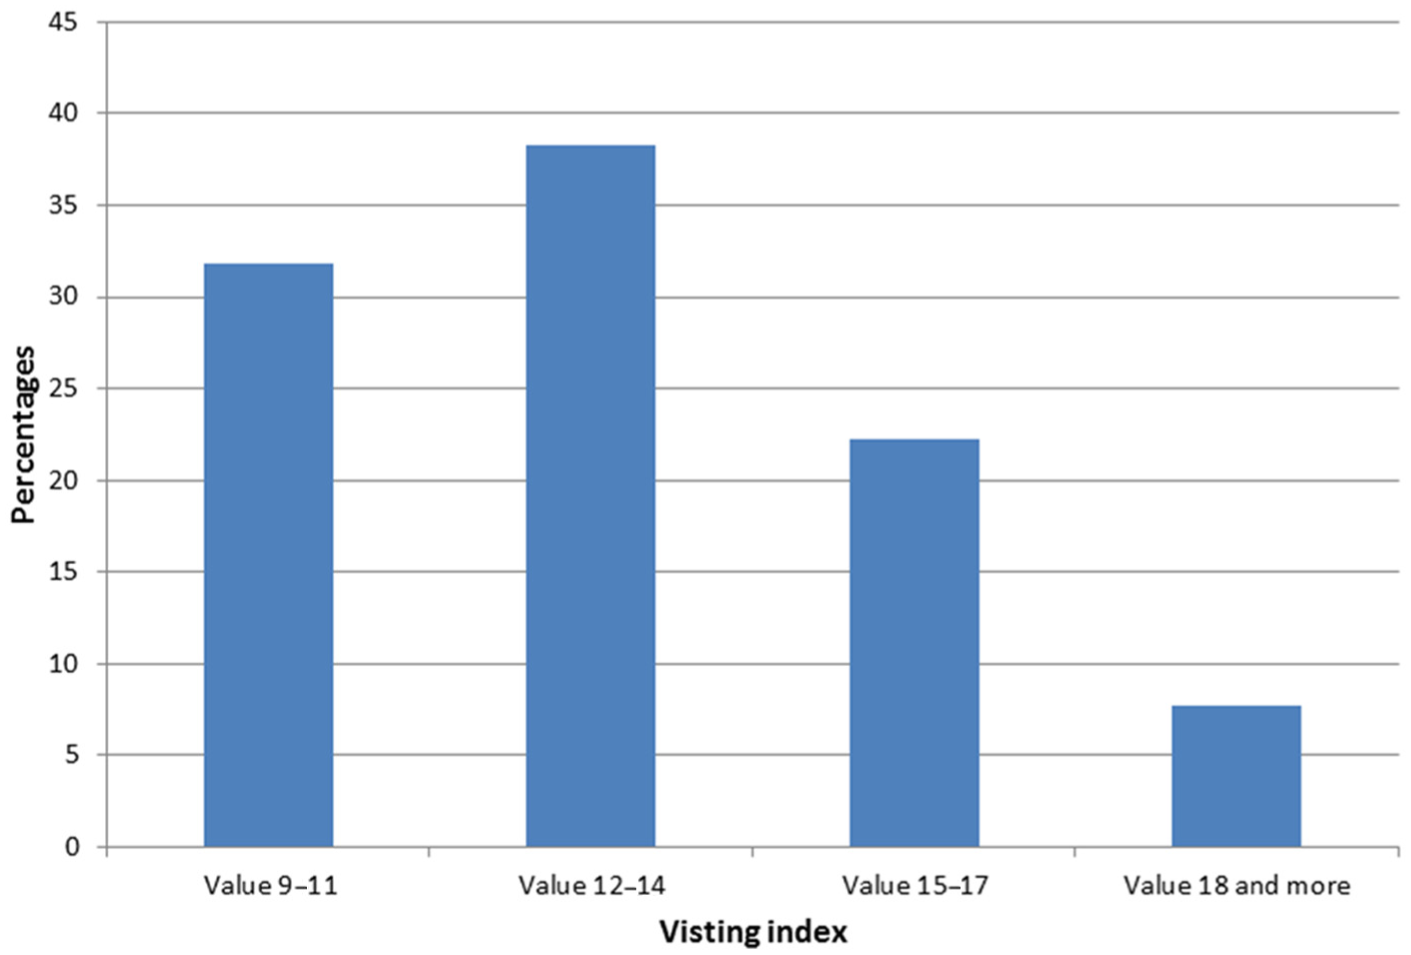
Sample visiting index values (n = 415).
Regarding the transport mode used when visiting a city, a distinction is made between the use of car, train, and other (including taxi, electric bike, and express bus). Figure 7 shows the percentages for respondents who have visited a city at least “Sometimes” (indicated by N). It is possible that the sum of the percentages exceeds 100% because some respondents indicated that they use various transport modes. From the figure, it can be concluded that for certain cities (e.g., Utrecht and Amsterdam) the majority of the respondents use the train when visiting the city. In the case of the other cities it is clear that the car is preferred but that the train attracts a considerable share.
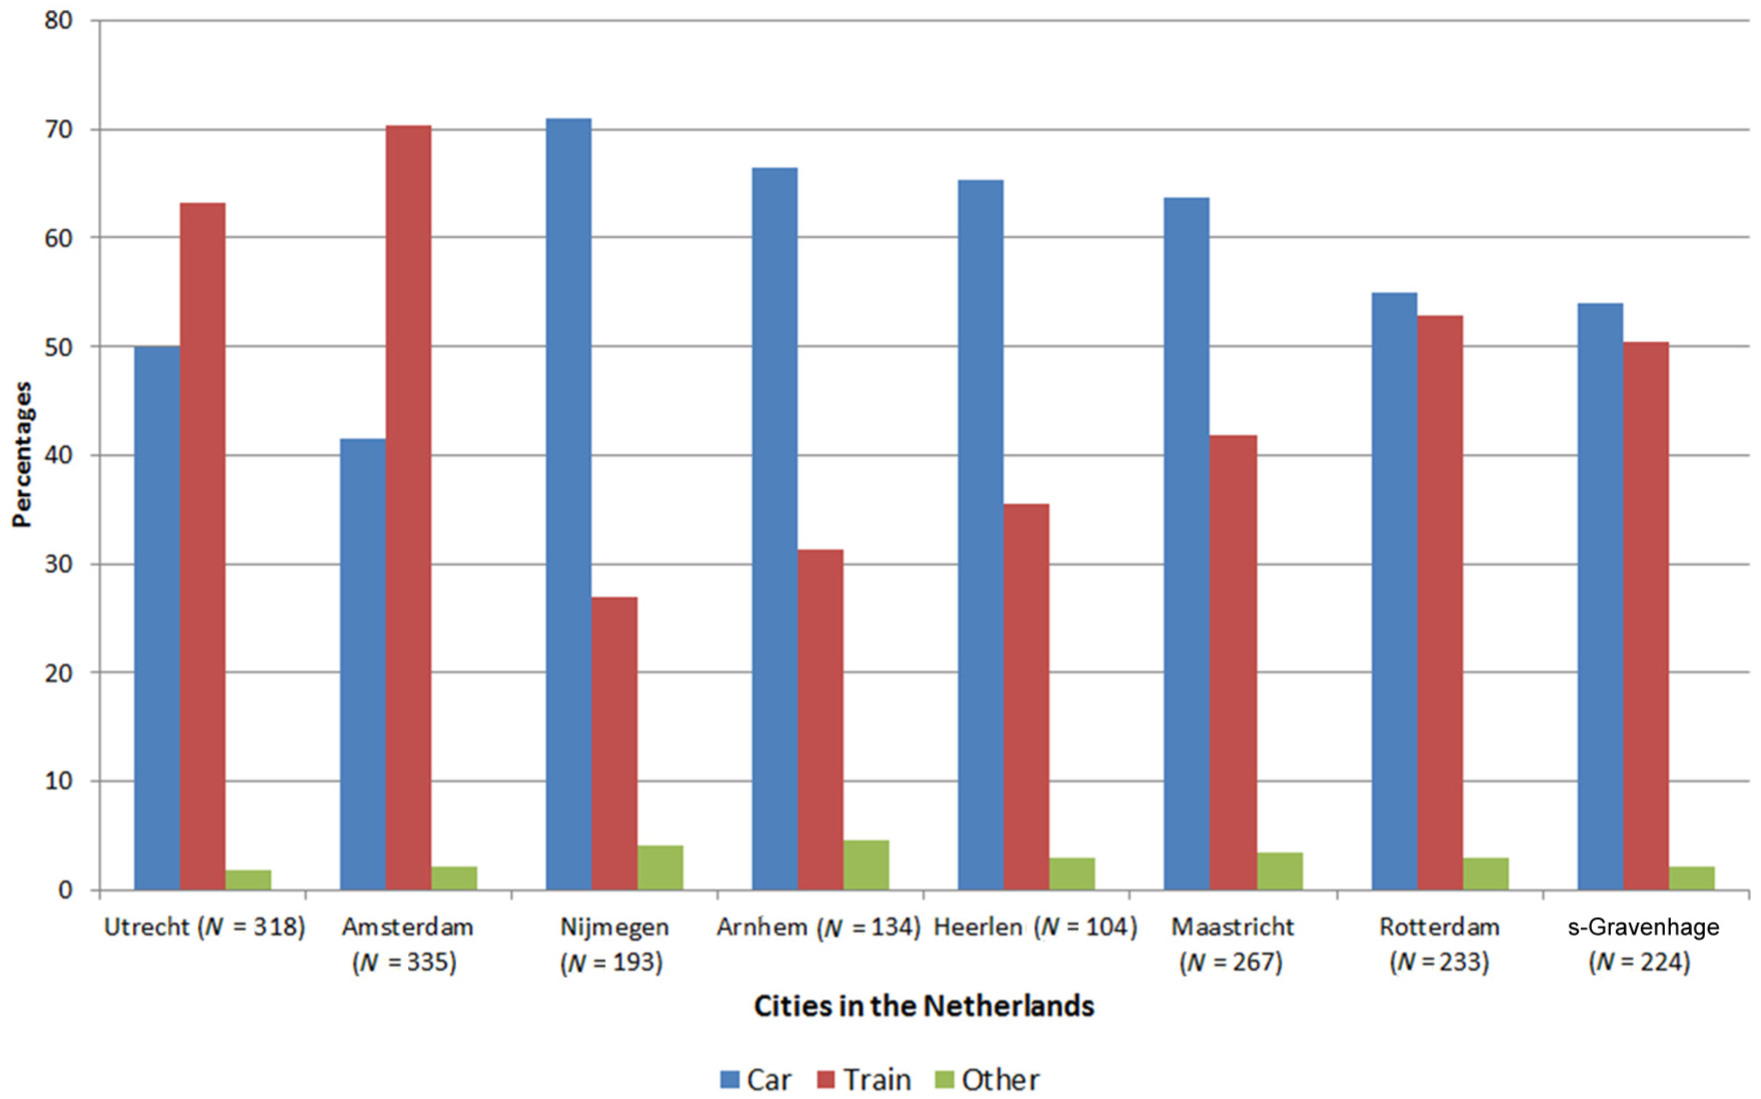
Transport mode use to major cities in the Netherlands.
Model Analysis
The individual choices were investigated using a mixed logit (ML) model with panel effects. This model takes into account random taste variation in the population of decision makers and the fact that a decision maker can make more than one decision. In the current experiment each respondent evaluated nine choice situations. The model was flexible enough to completely relax the independence and identically distribute the error structure of the standard multinomial logit (MNL) model ( 21 ). Several examples show that ML models perform better than the standard MNL models ( 22 , 23 ).
The 415 respondents evaluated a combined total of 3,735 choice situations. The software package NLOGIT 5.0 ( 24 ) was used to estimate the model parameters. To represent the effects of the attribute levels on the probability of a certain transport mode (combination), effect coding was used. In the current paper, the model with linear effects only is presented because it appeared to be the best performing model. A model with both linear and non-linear effects showed no increase in performance. The same was true for a model with context effects (effects based on age, gender, education, etc.) This means that the estimated parameter represents the part-worth utility of the first attribute level (see Table 1). The part-worth utility of the second level is always equal to 0, and the part-worth utility of the third level is equal to −1 × the estimated parameter. In addition, only parameters for the standard deviations of the access mode specific constants were included in the model to look for taste variation.
The estimated model was tested against the model with all coefficients equal to 0 (null model) using the log-likelihood ratio statistic (LRS). The LRS-value indicates that the estimated model performs significantly better than the null model (for details see Table 3). The model is also perfectly able to manage back forecasting the observed choices (see McFadden’s Rho squared values).
Parameter Estimates of Mixed Logit Model, Linear Effects Only
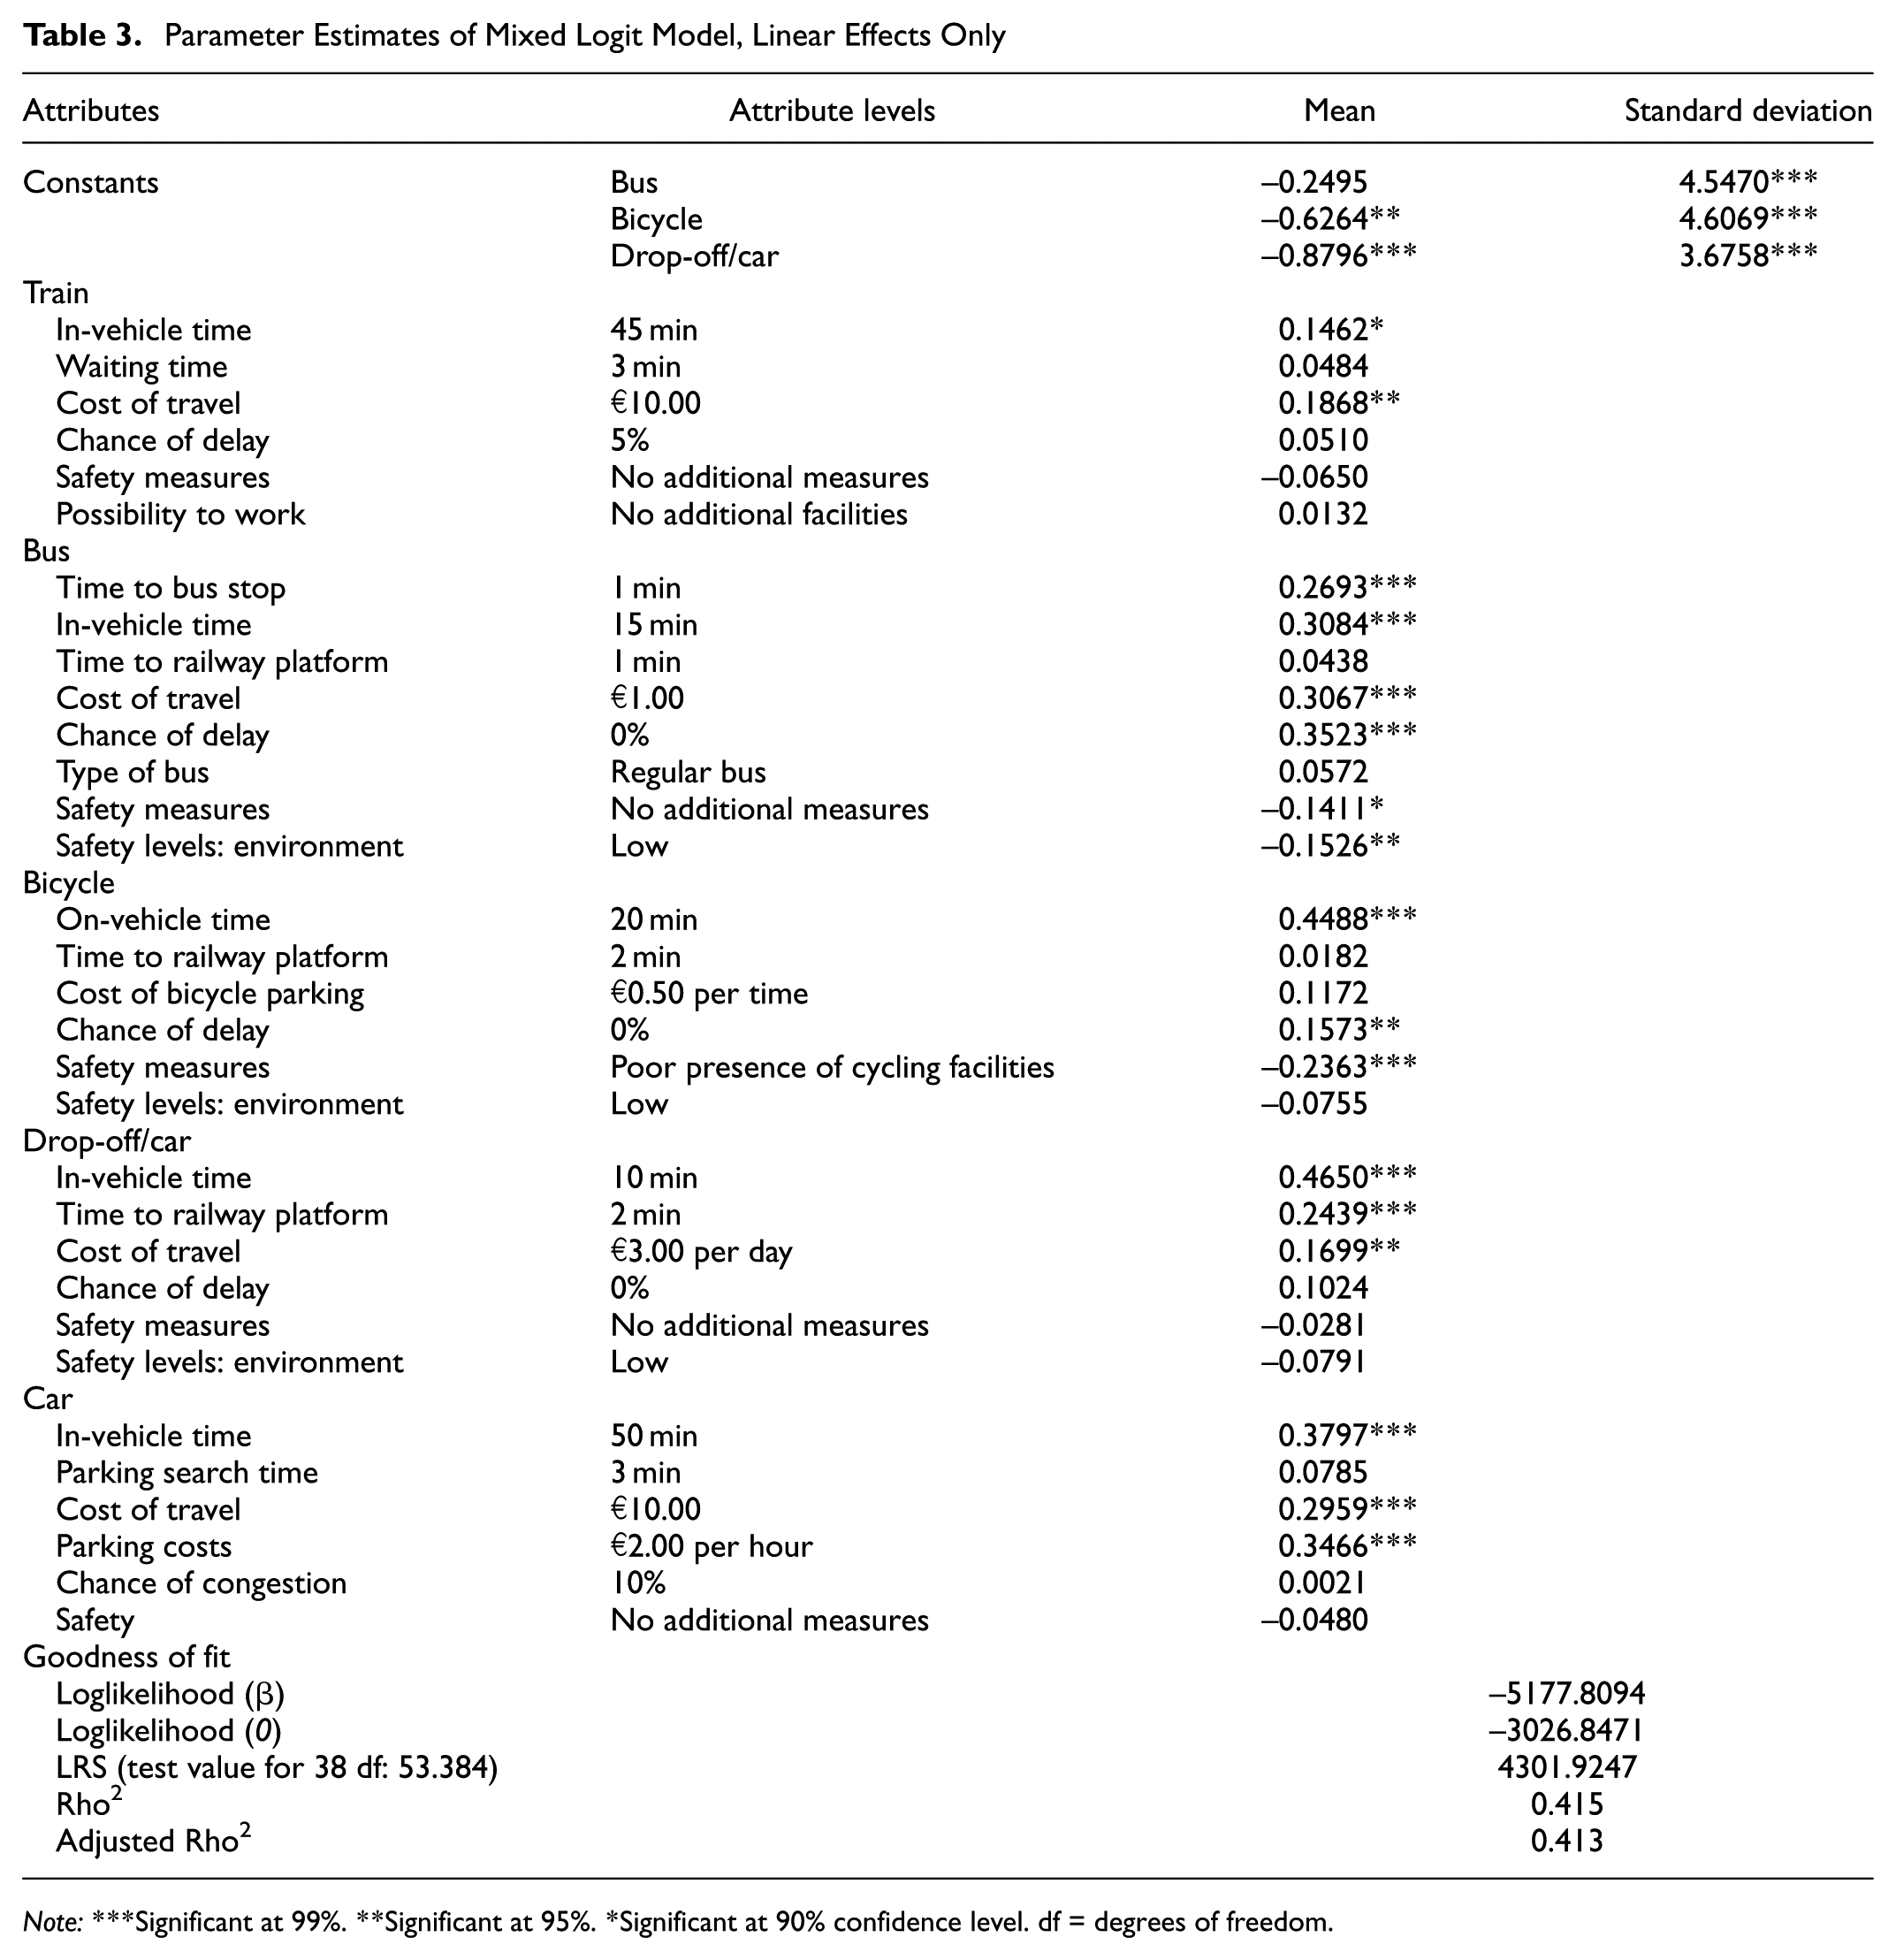
Note: ***Significant at 99%. **Significant at 95%. *Significant at 90% confidence level. df = degrees of freedom.
Looking in more detail at the estimated parameters, it appears that several attributes significantly contribute to the total utility of the included transport mode alternatives. A positive sign means that the total utility increases, which means that the probability of the alternative increases. A negative value means that the total utility decreases. The parameters of the alternative specific constants show that, if no other attributes are considered, respondents prefer the car over the train with any of the access modes. However, the significant parameters for the standard deviations show that there are taste variations between respondents (heterogeneity).
The attractiveness of the train increases when the travel time decreases (e.g., from 55 min to 45 min). The same is true for a decrease in travel costs (e.g., from €20.00 to €10.00). The attractiveness of the train is intensified when the parameters of the train access modes (bus, bicycle, and drop-off/car) are positive. In the case of the bus, the attractiveness of the train increases when walking time to the bus stop is short (approximately 1 min), in-vehicle time is brief (approximately 15 min), cost of travel is low (approximately €1.00), the chance of a delay is small (approximately 0%), safety measures are present, and the environment safety-level is high. The following attributes of the bicycle contribute to the attractiveness of the bike itself and, in addition, to the attractivity of the train significantly: on-vehicle time, chance on delay, and safety measures. The following drop-off/car attributes contribute to the attractiveness of the drop-off car and train alternative: in-vehicle time, time to railway platform, and cost of travel. The attractiveness of the car is significantly related to in-vehicle time, cost of travel, and parking costs.
The comparison between the contributions of all attributes can best be presented by the range in part-worth utility that an attribute covers (see Figure 8). It appears that the attribute in-vehicle time of the access mode drop-off/car has the highest contribution to this transport mode context, followed by on-/in-vehicle times of bikes and cars. The limited effect of in-vehicle time for the train, and the safety measures and safety levels of the bus is remarkable.
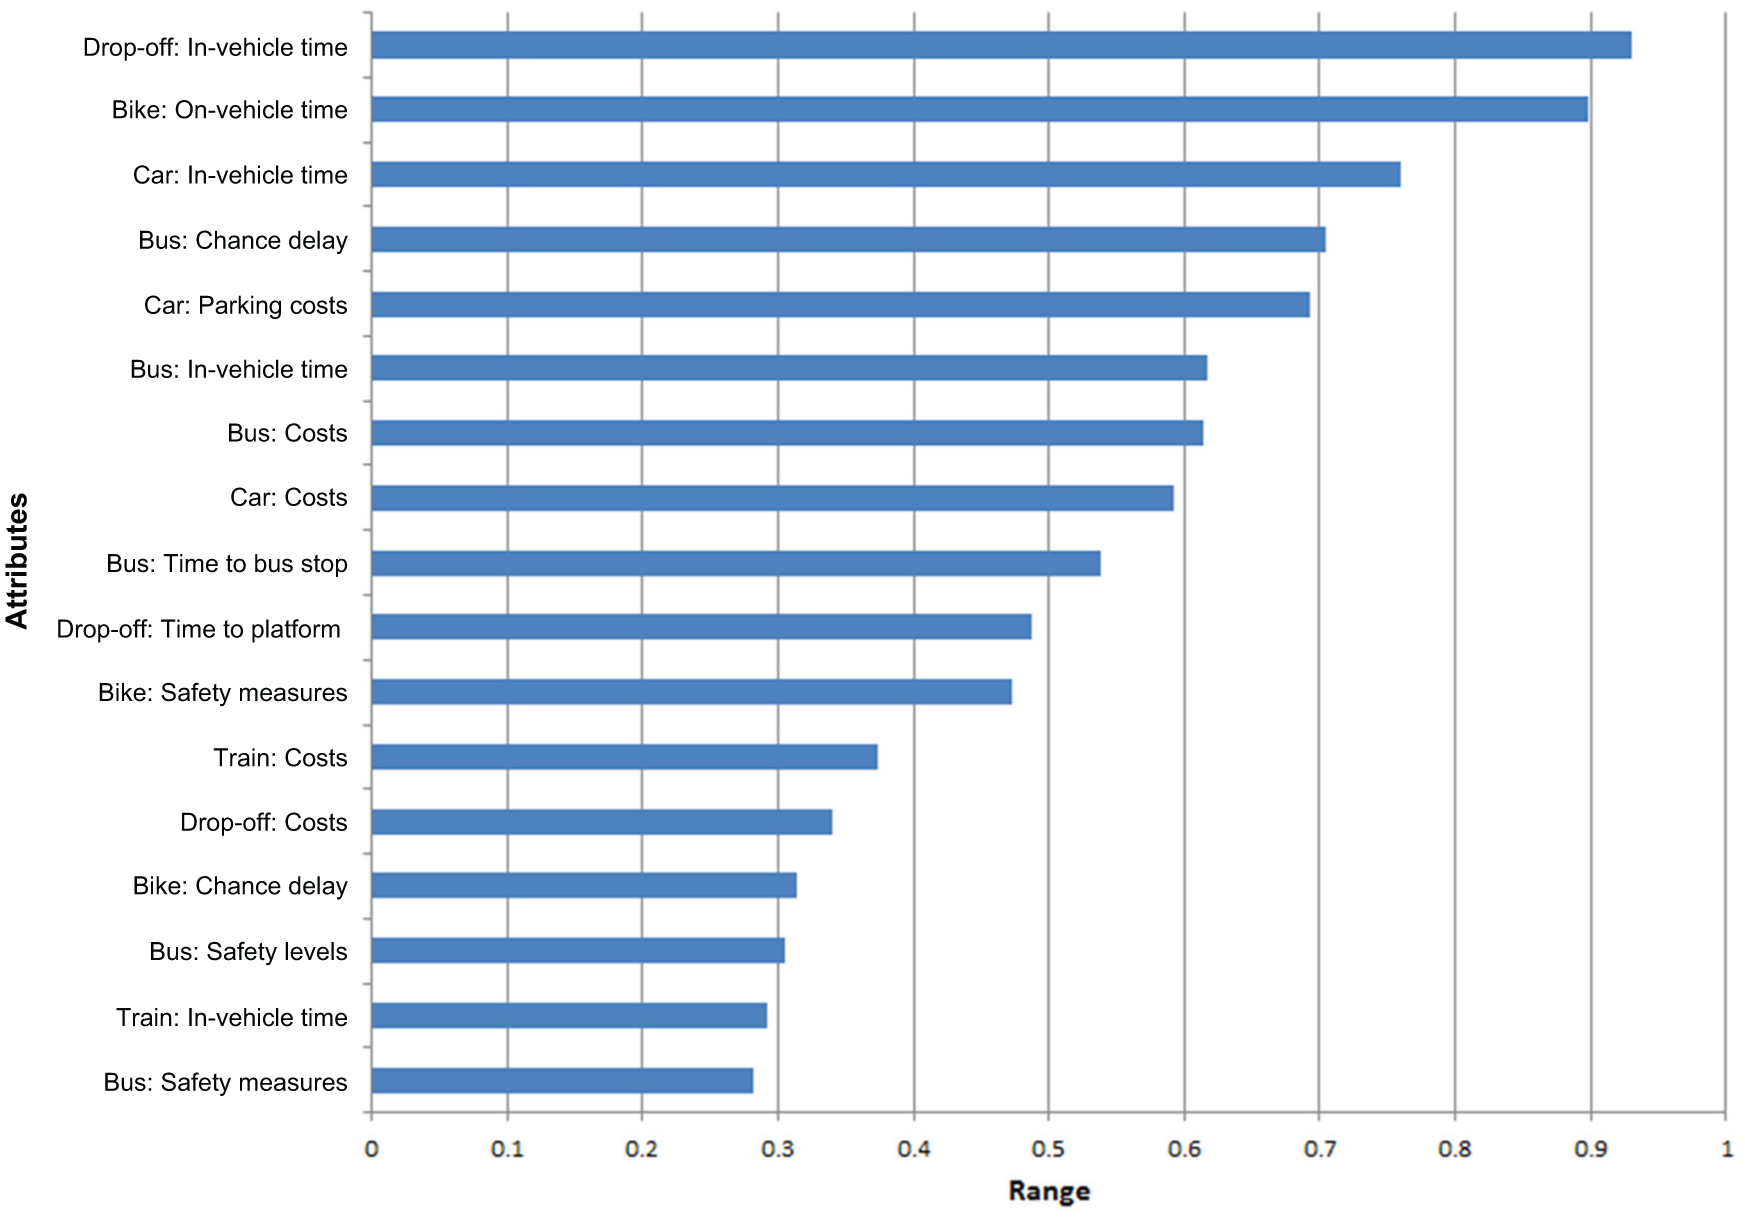
Range in part-worth utilities (only the significant parameters are illustrated).
Conclusions
This study was initiated because of the limited availability of insights into the influence of train access modes on the competitive position of trains versus the car. A stated choice experiment was set up to investigate various attributes of train access modes in more detail. The results of the model estimation showed that diverse attributes of train access modes play a role when travelers compare the train and car. The model estimation results show that there are considerable differences in the effects of these attributes. The most influential attributes are related to in-vehicle travel time and travel costs, including parking costs. In the context of the access modes, bus and bicycle safety measures play an influential role. The insights of this study can be used to set up a strategy to motivate car drivers to switch from car use to the train for medium- and long-distance trips. The focus of improvement plans should be on cost reduction, travel time and delay minimization, and safety measures. The insights could also be used to improve the access modes for train users by offering fast and safe routes for bicyclists. This is especially relevant in the context of transit-oriented development in which the focus is on stimulating sustainable transport use by developing optimal urban development and public transport conditions.
The study included some limitations that would be worth exploring in the near future. As mentioned before, the stated choice experiment did not include travel purpose, travel day, or travel party. These kinds of trip characteristics could also contribute to travelers’ transport mode decisions because of differences in time pressure, levels of crowdedness in trains, congestion on roads, and traveling with, for example, children. For each trip characteristic, the challenge is to find sufficient respondents who are familiar with the tradeoff between train and car. Even though a large set of attributes was used, other attributes might be considered in the future covering, for example, dynamic information provision and smart navigation possibilities. Finally, it is important to validate the findings from this study with real-world data to identify whether the stated preferences are in line with revealed preferences.
Footnotes
Acknowledgements
The authors thank Wim Schaefer and Koen Sanders of the Construction Management & Engineering group of the Eindhoven University of Technology for their contribution to the research.
Author Contributions
The authors confirm contribution to the paper as follows: study conception and design: PvdW, JvdW; data collection: PvdW, JvdW; analysis and interpretation of results: PvdW, JvdW; draft manuscript preparation: PvdW. All authors reviewed the results and approved the final version of the manuscript.
The Standing Committee on Transportation Demand Management (ABE50) peer-reviewed this paper (18-01017).