
Abstract
The skid resistance of a pavement surface is an important characteristic that influences traffic safety. Previous studies have shown that skid resistance varies with temperature. However, relatively limited work has been carried out to study the effect of temperature on skid resistance in hot climates. Recent developments in computing and computational methods have encouraged researchers to analyze the mechanics of the tire-pavement interaction phenomenon. The aim of this paper is to develop a thermo-mechanical tire pavement interaction model that would allow more robust and realistic modeling of skid resistance using the Finite Element (FE) method. The results of this model were validated using field tests that were performed in the State of Qatar. Consequently, the validated FE model was used to quantify the effect of factors such as speed, inflation pressure, wheel load, and ambient temperature on the skid resistance/braking distance. The developed model and analysis methods are expected to be valuable for road engineers to evaluate the skid resistance and braking distance for pavement management and performance prediction purposes.
The skid resistance of an asphalt pavement is an important characteristic that influences driving safety conditions. Research studies show that there is a relationship between low skid resistance of a pavement surface and traffic accidents ( 1 ). Moreover, the accident risk may increase dramatically when the friction numbers decrease below certain thresholds ( 2 ). Therefore, it is important for road researchers to understand the fundamental mechanisms of tire-pavement interaction.
Studies have shown that the skid resistance is significantly influenced by various pavement surface characteristics ( 3 ). It has also been demonstrated through experimental and mathematical modeling that temperature and tire related factors such as load, speed, and inflation pressure also influence skid resistance ( 4 – 6 ). It was observed that skid resistance decreases with an increase in temperature ( 7 , 8 ). This relationship can be rationalized by the fact that temperature-dependent viscoelastic properties of tire rubber have a significant influence on its hysteretic friction. The lack of proper consideration of the effect of temperature on skid resistance measurements would lead to erroneous maintenance management decisions and pavement performance predictions.
To properly assess the surface condition of a pavement, highway agencies and authorities around the world conduct regular skid resistance measurements. One of the popular ways to measure skid resistance is by the use of continuous friction measuring equipment (CFME). This is because CFMEs are designed to test the friction around 10%–20% slip condition, which is similar to that used in vehicles equipped with anti-lock braking systems (ABS) ( 9 ). GripTester is one such device that measures the longitudinal friction along the wheel track and operates at a 15% fixed slip ratio. The device has the capability for skid testing at a wide range of speeds (from 5 to 130 km/h) ( 10 ). Although the GripTester could provide reliable data, uncertainties related to temperature and vehicle speed variations exist. To handle these uncertainties, statistical based approaches are often adopted by road agencies. The challenge with these approaches, however, is that they tend to ignore the fundamental mechanisms involved in skid resistance and are only valid for the section(s) where they were calibrated. Moreover, several field tests are needed to obtain such statistical-based transfer functions, which require enormous time and resources, apart from temperature-related uncertainties.
Recent developments in computational methods and computing power have allowed researchers to develop and analyze complex tire-pavement interaction models using the Finite Element (FE) method. Such models, on validation, can help pavement engineers and authorities evaluate several scenarios for the selection of pavement materials. In general, FE simulations of the tire-pavement interaction include three main aspects, namely, modeling of pavement roughness and structure, modeling of tire structure and modeling of tire-pavement contacts ( 11 ). Tanner ( 12 ) presented a numerical model for the solution of the frictional contact problems for the tire-pavement interaction. Davis ( 13 ) proposed a numerical model primarily to study tire mechanical properties. Johnson et al. ( 14 ) used a FE model to simulate the tire loading. In recent years, Cho et al. ( 15 ) presented a tire-pavement interaction model using FE tools. The majority of these models simulated the pavement sub model as a rigid flat plate, which does not reflect a real field situation.
Wollny et al. ( 16 ) proposed an inelastic pavement layered structure in their coupled tire-pavement interaction FE model. However, the pavement surface texture was not considered in this model. Ong and Fwa ( 17 – 20 ) presented a FE model where a pavement with grooved surfaces was considered to study skid resistance. However, the major limitation of their model is the use of non-rotating tire sub model. Based on the above review of models, it can be seen that very few studies have evaluated the effect of temperature primarily because of the complexity of a thermo-mechanical tire-pavement interaction mechanism.
Recently, researchers ( 21 – 23 ) used an innovative staggered interaction FE model to determine the temperature developments for a rolling/skidding tire by considering actual pavement surface morphologies (obtained on the basis of computed tomography imaging scans). However, these models were developed for normal temperature conditions and real size test tires like PIARC, ASTM, and Goodyear and so forth. As mentioned earlier, in this research program, GripTester measurements were carried out under field conditions in Qatar. To the best of the authors’ knowledge, a thermo-mechanical model to study the tire-pavement interaction mechanism in hot weather is still not available to researchers. Therefore, the aim of this paper is to develop such a model for skid resistance evaluation using a GripTester, and to validate the FE model on the basis of field tests.
Scope of Study
The aim of this study is to develop a thermo-mechanical tire-pavement interaction model and to validate the model using actual field tests. The model would then be used to:
propose a mechanics-based methodology to transfer the skid resistance measurement from a GripTester tire to a passenger car tire;
analyze safety aspects (i.e., braking distance) related to skid resistance;
evaluate the influence of temperature on skid resistance and pavement safety aspects; and
evaluate the influence of the pavement roughness characteristics on skid resistance and pavement safety aspects.
Description of the FE Model
Numerical Modeling of Pavement Structure
The asphalt pavement section was designed and constructed in line with Qatar Construction Specifications (QCS), which essentially adopt the Marshall mix design method. Pen 60–70 base bitumen and gabbro were used in the asphalt mixtures of the surface course of the pavement section. The asphalt specimens were extracted from the aforementioned section and later used to capture surface morphologies and internal structures with a laser profilometer and an X-ray tomographer. The output images were then imported into Simpleware software ( 24 ). The image segmentation and filtering technique available in Simpleware were used to distinguish the three phases of the mixture namely air voids, aggregates, and asphalt binder. Once the post-segmentation process was completed, the microstructure FE meshes for the pavement surface were generated with aggregates modeled as an elastic material and asphalt binder as a viscoelastic material, as shown in Figure 1.
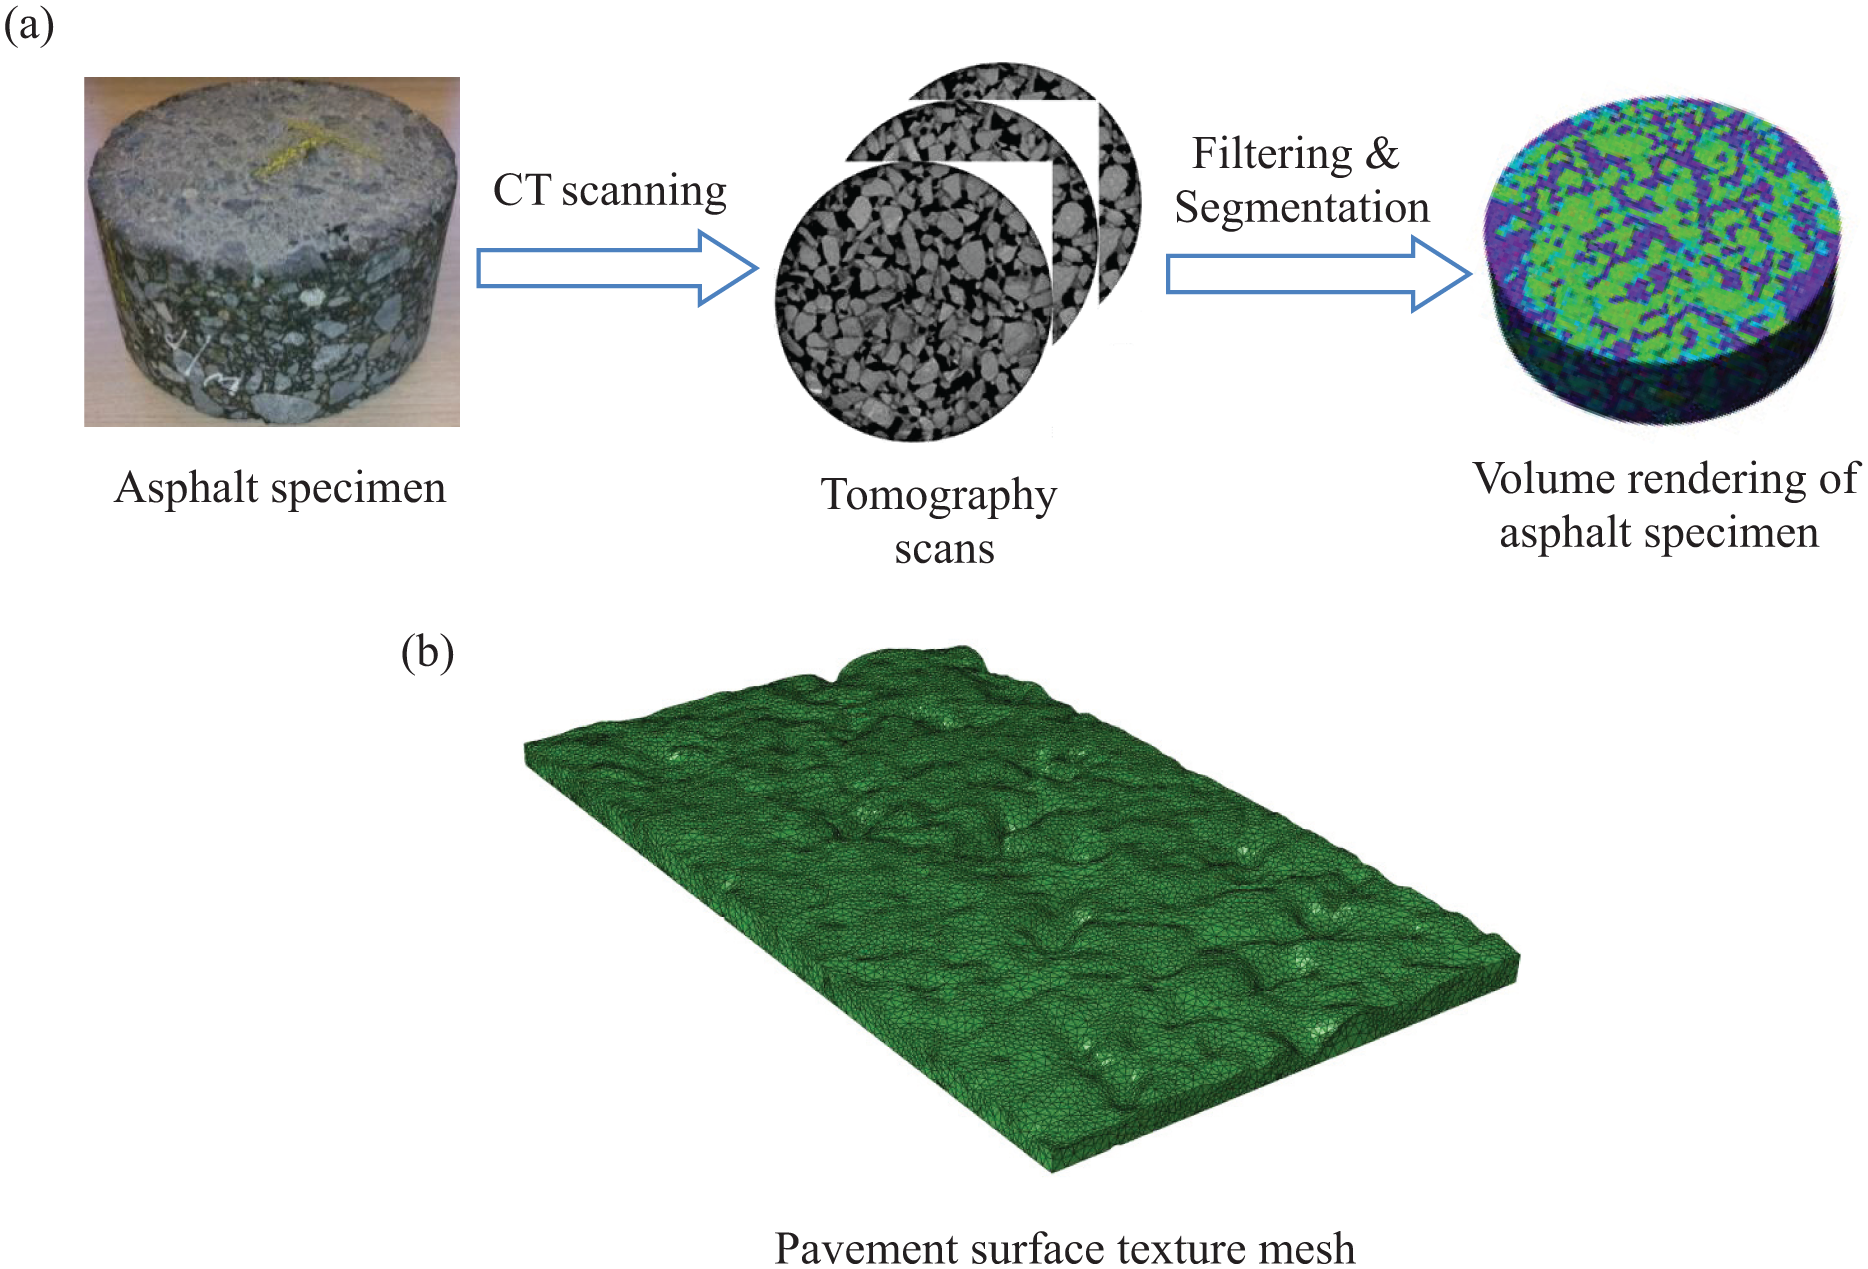
Generation of asphalt surface FE mesh: (a) procedure to obtain asphalt surface morphology and (b) resulting FE asphalt surface meshes from Simpleware.
Numerical Modeling of Tire Structure
Recent advances in computational methods and computing power bring the modeling of the tire-pavement interaction to a new level of accuracy accounting for the tire cross-section geometry and other components ( 25 – 27 ). The standard GripTester tire (ASTM E 1844) was simulated using the commercial software Abaqus ( 28 ) and an in-house software at TU Delft. The geometrical details of the GripTester tire can be found ASTM E 1844 procedure.
The modeling of the GripTester tire starts with the development of a 2D FE mesh of its cross section as obtained from ASTM E 1844. By revolving the 2D FE mesh, the 3D FE mesh of the tire body and tread are generated. As the contact section of the tire with the pavement is the tread surface, it is not necessary to mesh the tire body and tread with the same mesh density. At the last step, the whole tire model is completed by assembling the tire body and tread parts together using surface-surface constraint. The developed FE tire mesh is illustrated in Figure 2.
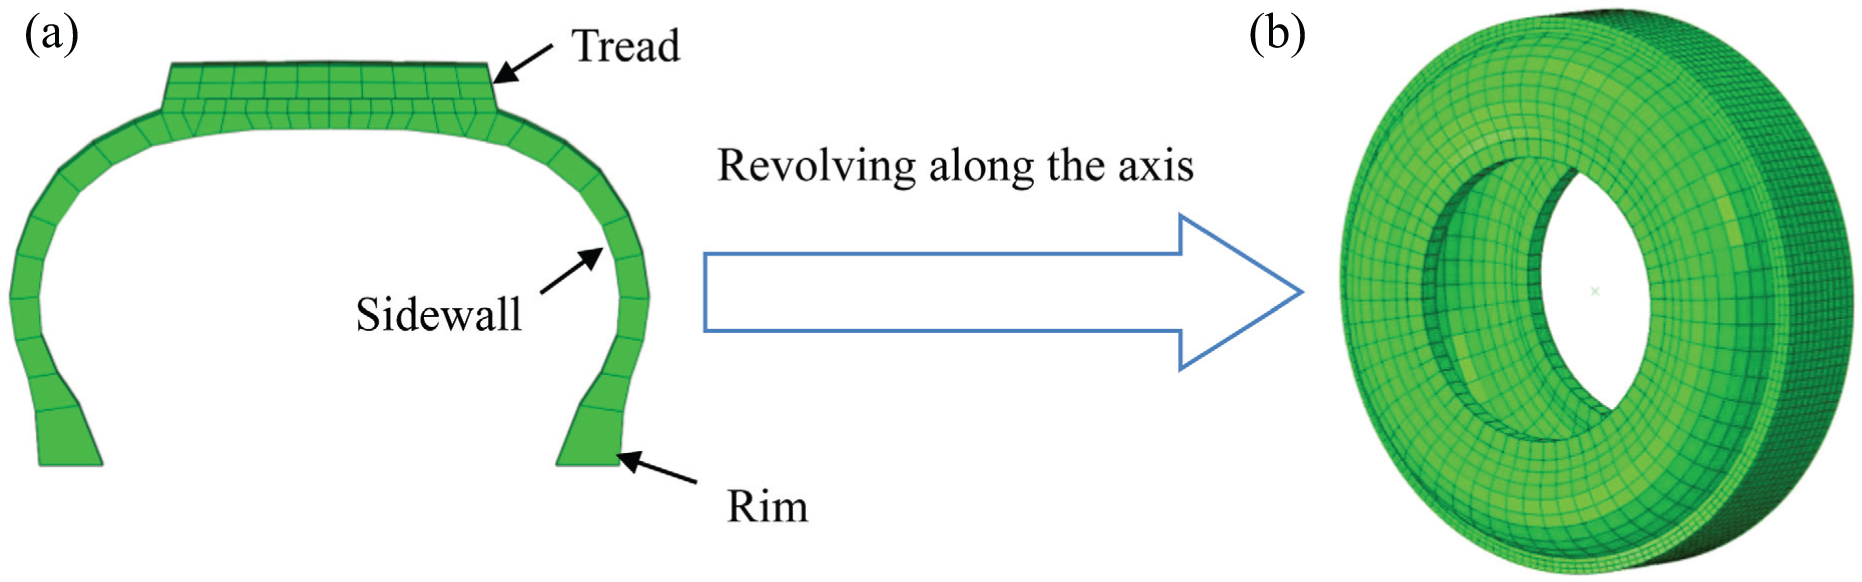
GripTester tire structure: (a) cross-section view of Goodyear tire and (b) 3-D view of Goodyear tire mesh.
It is generally believed that the hysteresis energy loss as the tire rotates under the weight of the vehicle is the main cause of energy loss associated with skid resistance. To obtain the dissipation energy, it is necessary to model the tire rubber as a viscoelastic material. The rheological material characteristics of the tire rubber are obtained by means of Dynamic Shear Rheometer (DSR) tests. The details of the test procedure can be found in a previous paper ( 29 ). Furthermore, static load-deflection tests were performed to obtain the stiffness characteristics of the GripTester tire, as shown in Figure 3a. The comparison of the aspect ratio of the tire footprints between static load-deflection test and FE footprint prediction at a load of 150, 200, 300 and 400 N, respectively, is shown in Figure 3b.
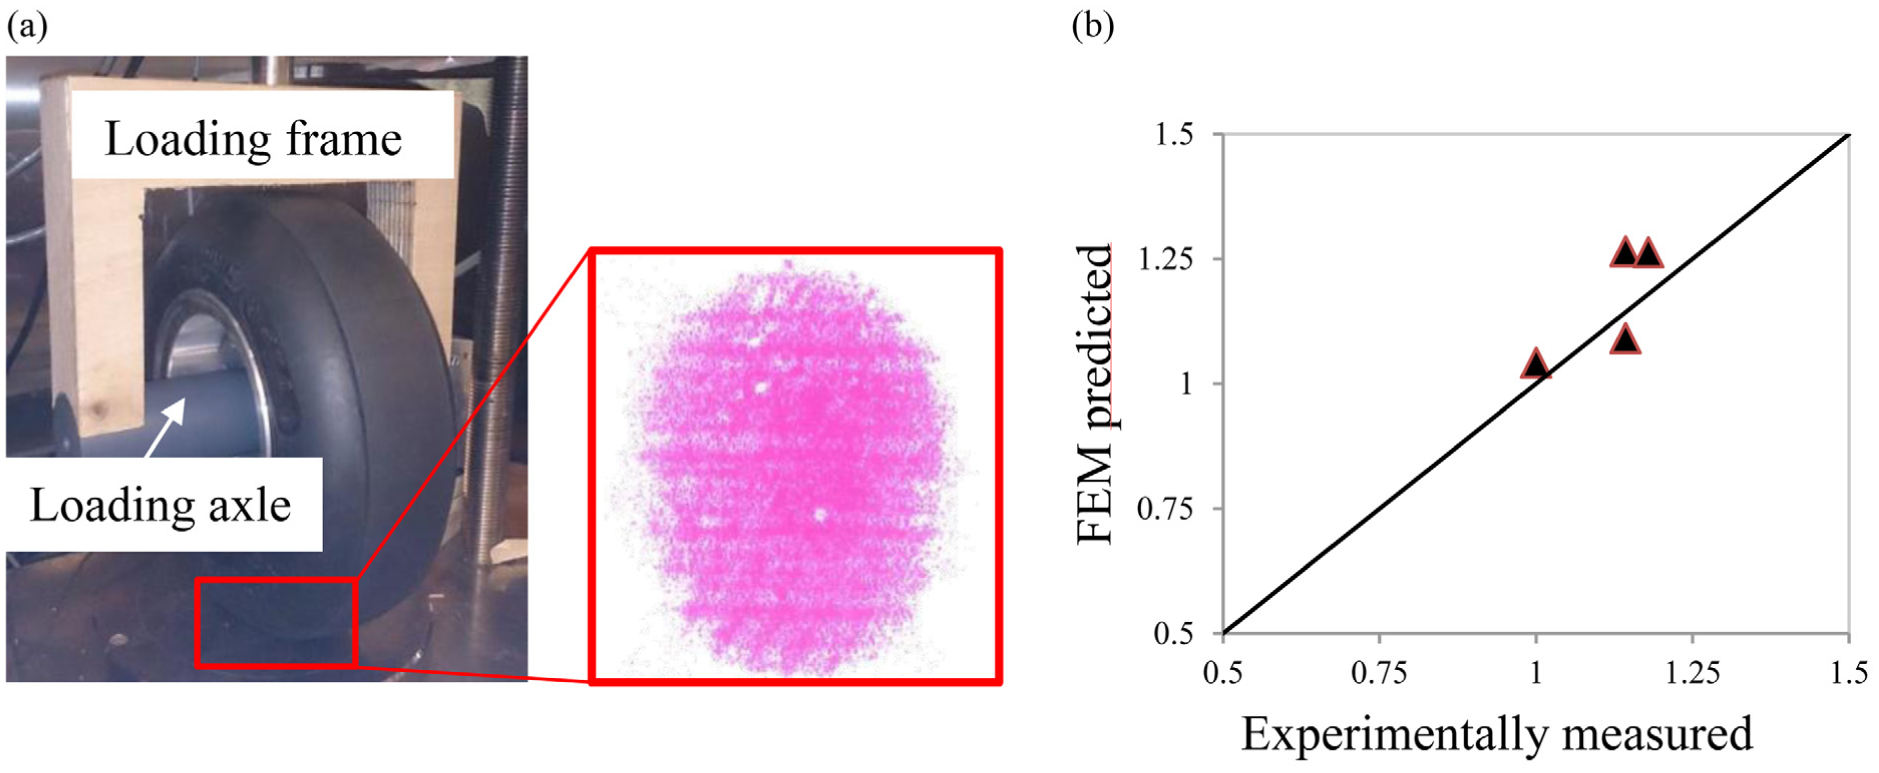
Validation of the FE GripTester: (a) static-load test to obtain the footprint and (b) comparison of the aspect ratio of the foot prints between FE predicted results and test results.
Description of the Tire-Pavement Interaction Model
To properly model the interfacial interaction between a tire and the underlying road surface in the context of a large deformation framework, the use of a robust 3D contact algorithm that handles contact problems is necessary. Therefore, the so-called surface-to-surface contact algorithm, originally developed by Puso and Laursen ( 30 , 31 ), is implemented at the tire-pavement interaction interface. The modeling and the development of the tire-pavement interaction model can be broadly divided into two steps:
In the first step, static analysis of the developed 3D FE model of the GripTester tire rolling over smooth pavement is carried out. To do the rolling simulation, a steady-state analysis is invoked with the application of Arbitrary Lagrangian Eulerian (ALE) formulation ( 32 ).
In the second step, the history of stresses, strains, and displacements retained from the first step is imported. In the analysis, the FE test tire is forced to roll or slip at the desired speed on a FE mesh of an asphalt pavement surface, as shown in Figure 4. Due to the roughness of the textured pavement surface, the contact pressure that develops at the tire–pavement interface changes with the rolling or slipping of the tire. The output (stresses and strains) of the tire in this analysis is then exported for the computation of skid resistance. This will be discussed in the next section.
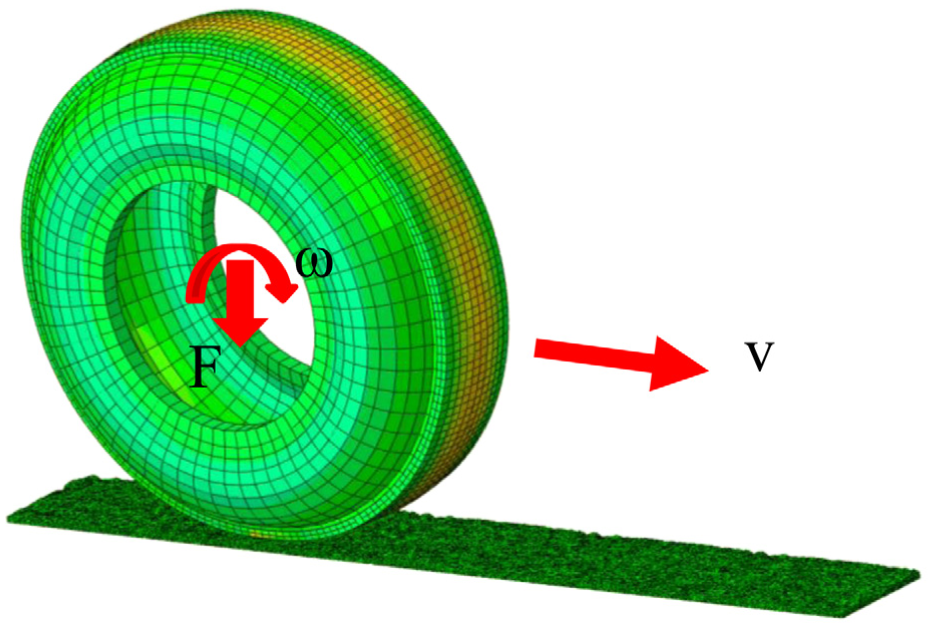
Coupled tire-pavement model.
Computation of Skid Resistance
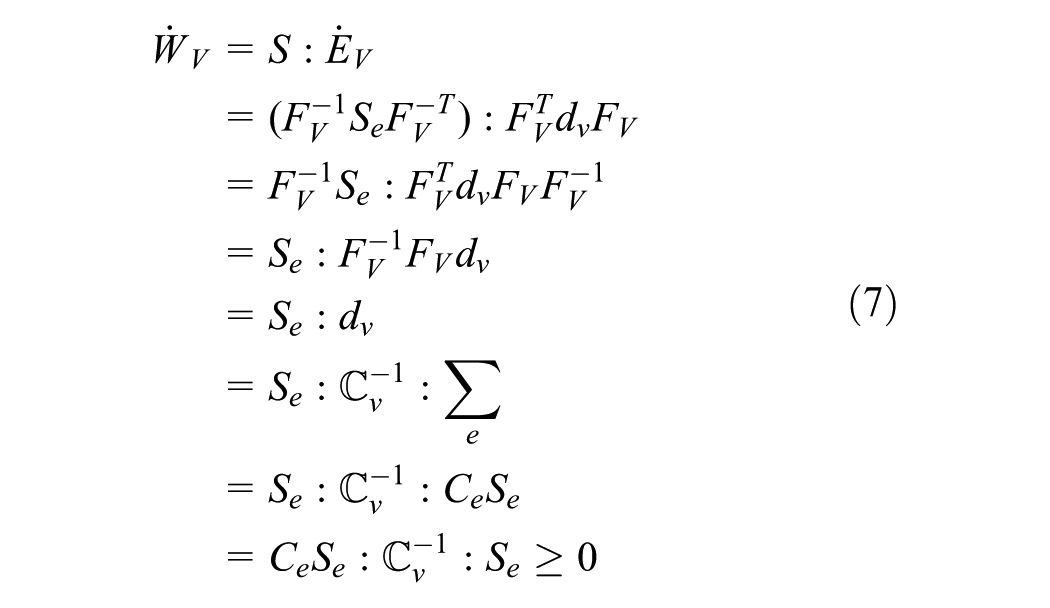
A detailed description of the computation procedure can be found in Srirangam et al. ( 22 ). However, for ease of understanding, a brief description is presented in this section. In this approach, the skid resistance is calculated based on the theory of hysteresis energy dissipation (Equations 1 to 11). The stresses and strains obtained from Step 2 in the previous section are used to compute the energy dissipation in a separate module. The dissipation losses at each Gauss point of all the cross-section elements are computed from the circumferential strain cycles of the deformation analysis. The strain cycles and the linearized viscoelastic model are then used to calculate the energy loss in each circumferential ring of elements. The energy loss is summed for all rings to give a total energy loss. Six total stress and six viscous strain components are extracted at each Gauss point of every element in each circumferential group to calculate the energy loss.
The multiplicative decomposition concept was used to derive energy dissipation rates shown in Figure 5. The total deformation of a Maxwell component can be split into its elastic and viscous part as follows:

Here
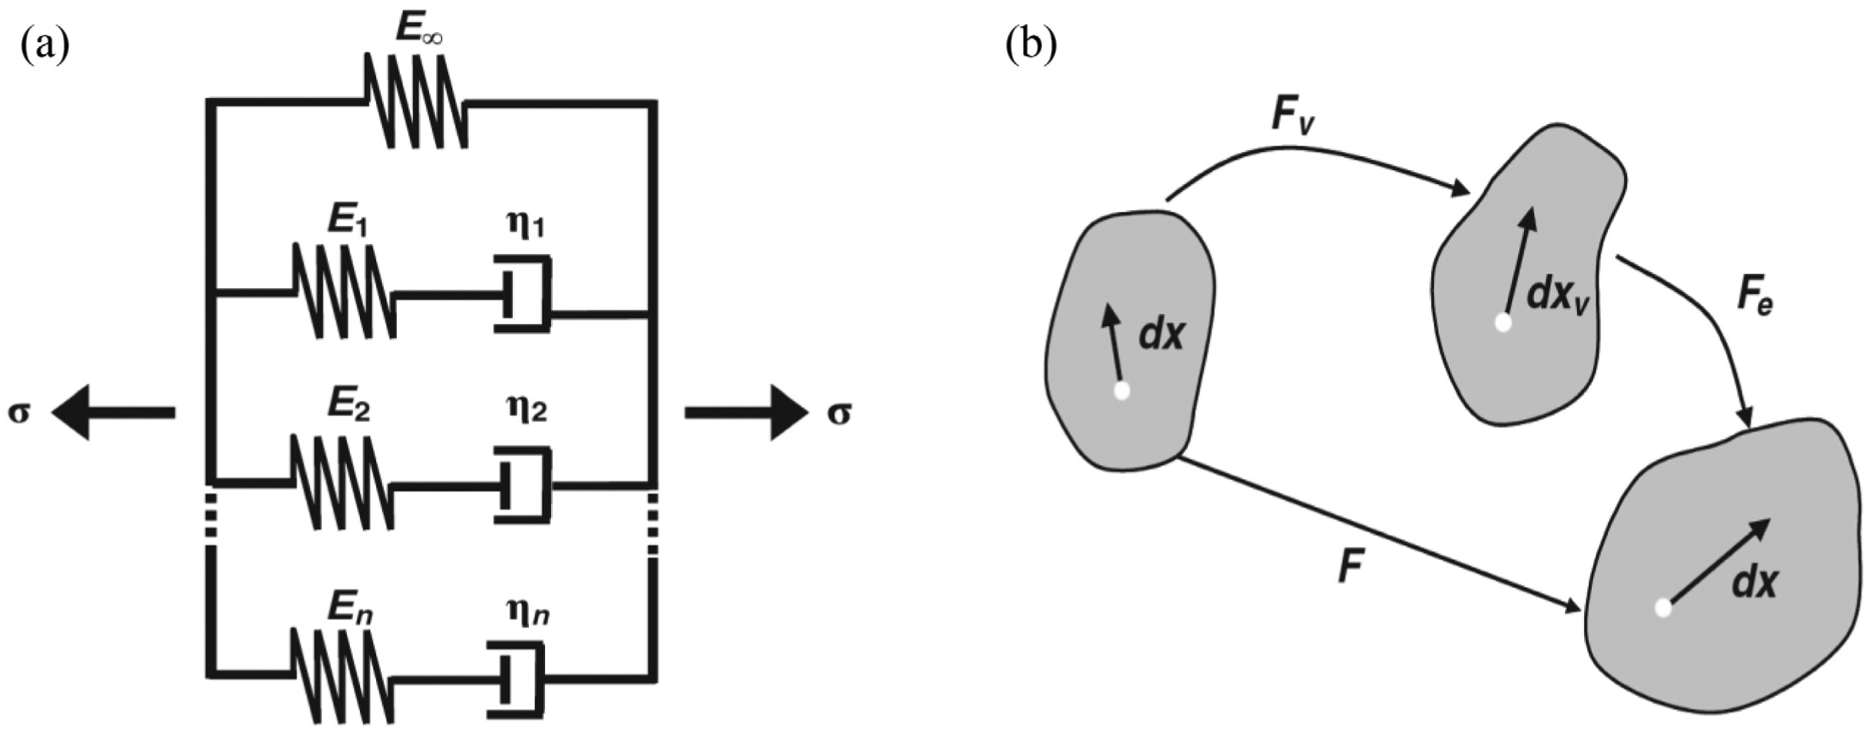
(a) One-dimensional schematic diagram of viscoelastic material model and (b) multiplicative decomposition of deformation gradient.
The Lagrange–Green strain is defined as a function of the right Cauchy–Green deformation tensor
Here
The viscous Lagrange–Green strain in the reference configuration is derived via a pull-back operation over the viscous deformation gradient:
Consequently, the viscous Lagrange–Green strain rate in the reference configuration is defined as:
where

with

where
The viscous work itself can be calculated via the following incremental formula:

The energy loss

The contraction of the stress tensor and strain tensor is integrated over one tire revolution to obtain the dissipated energy. Dissipated energy:

where
Then the skid resistance of a given tire is computed by:

where
Field Tests and Model Validation
Field tests were carried out to validate the developed FE model by collecting the necessary information such as temperature in the tire cross section, vehicle speed, ambient temperature and pavement temperature. A new temperature measurement system was developed to calibrate the FE model. This system contains small thermal sensors which were embedded into the test tire at various prescribed locations. A cabinet containing a data-logger was used to collect the temperature information from the sensors and transmit it wirelessly to a WiFi-enabled laptop placed in the skid resistance-measuring device. The detailed description of the instrumentation is beyond the scope of this study.
Field Tests
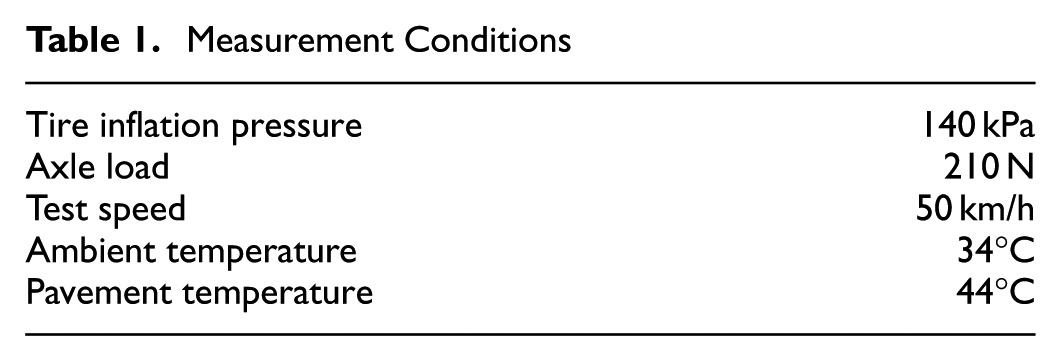
The field tests were carried out on a pavement that consists of three different sections in Qatar. The difference between the sections consists of the asphalt binder type and mixture design in the wearing course. The test procedure and data collection were carried out in accordance with the European Technical Specification CEN/TS 15901-7. Figure 6 shows a GripTester with the temperature measurement system installed on the test tire. The temperature measuring cabinet was installed on the wheel rim. Then, the tire was mounted and firmly anchored to the stub axle. The horizontal drag force and vertical load were measured by two strain gauges to determine the friction number. The operating and temperature conditions for the field test are summarized in Table 1.
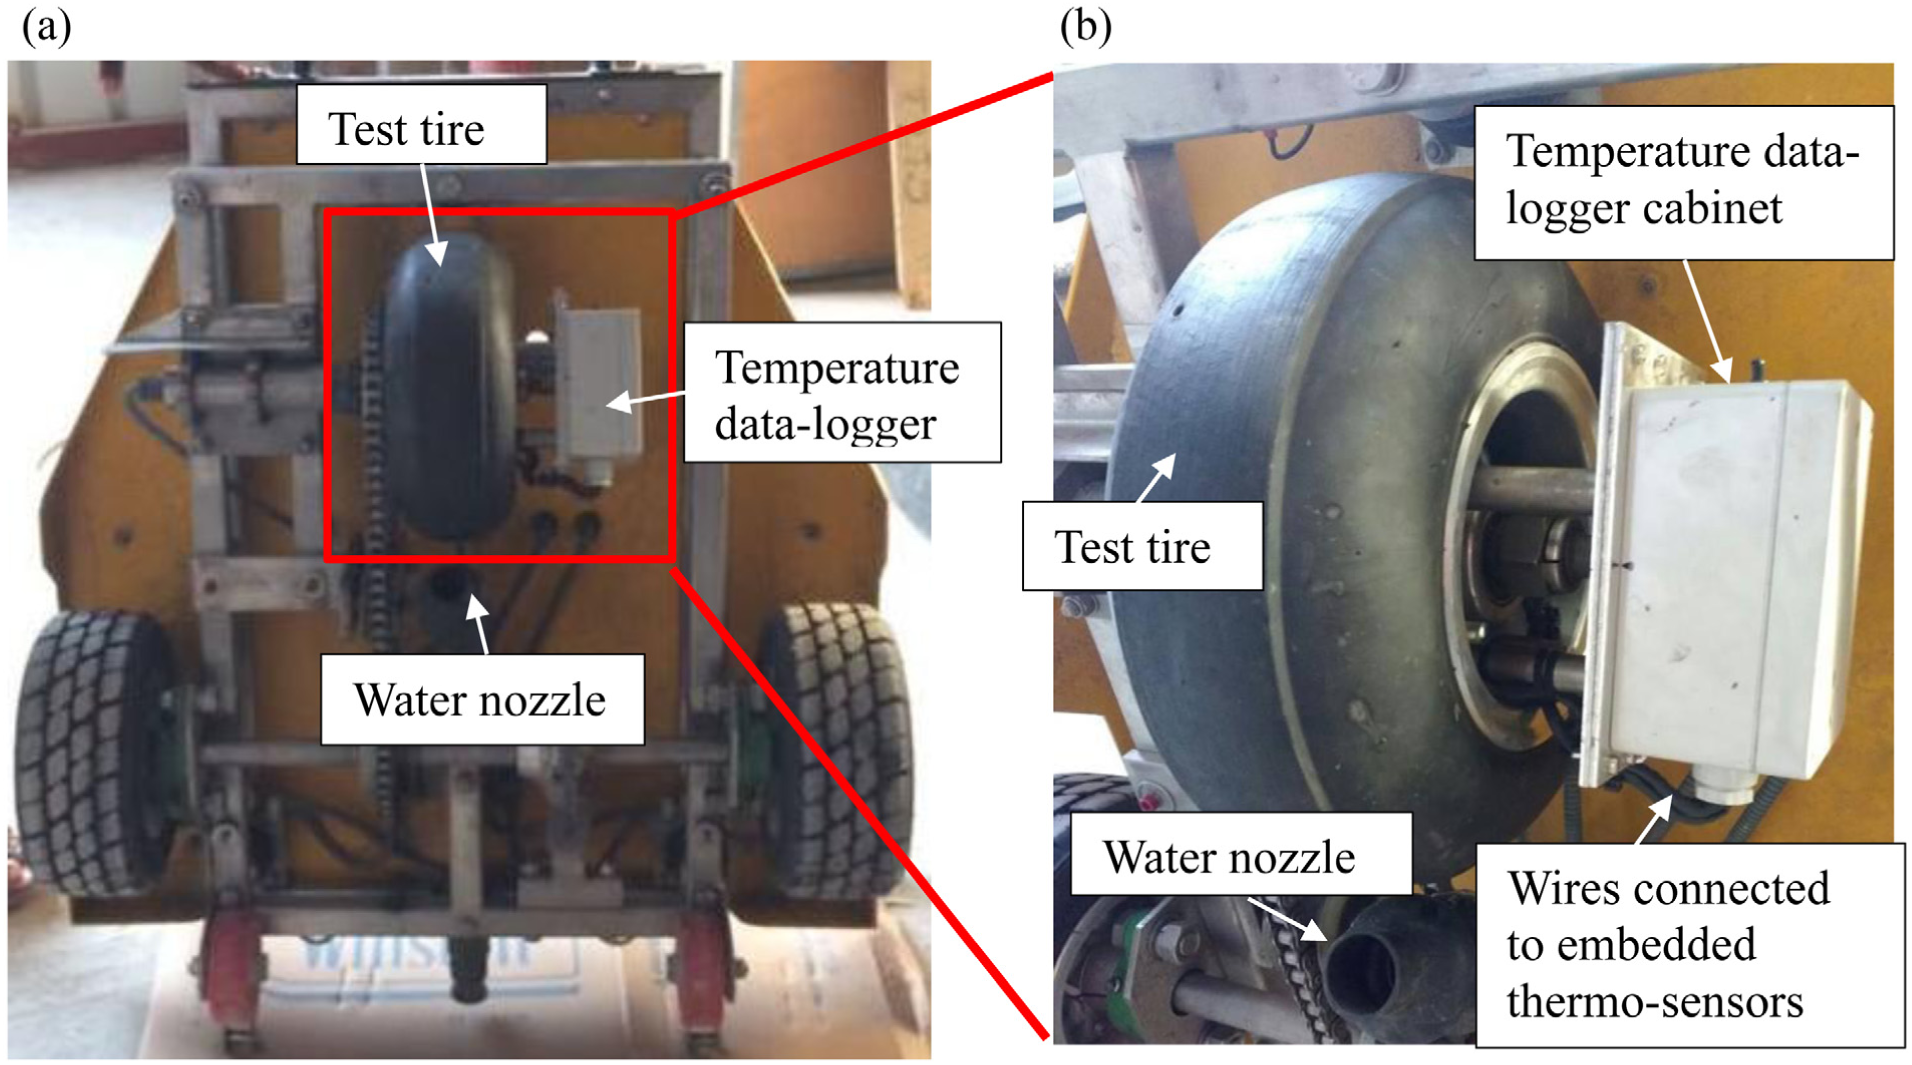
GripTester: (a) components of a GripTester and (b) zoom-in view of instrumented GripTester tire.
Measurement Conditions
The skid measurements were recorded at 5m intervals. Figure 7 shows that the friction number was mostly in the range of 0.2 to 0.3 with an average value of 0.24. Some high values were recorded as indicated in the data spikes at the points of transition from one section to another or because of other irregularities of the pavement. It is noted that the recorded values are below acceptable skid resistance limits ( 33 ).
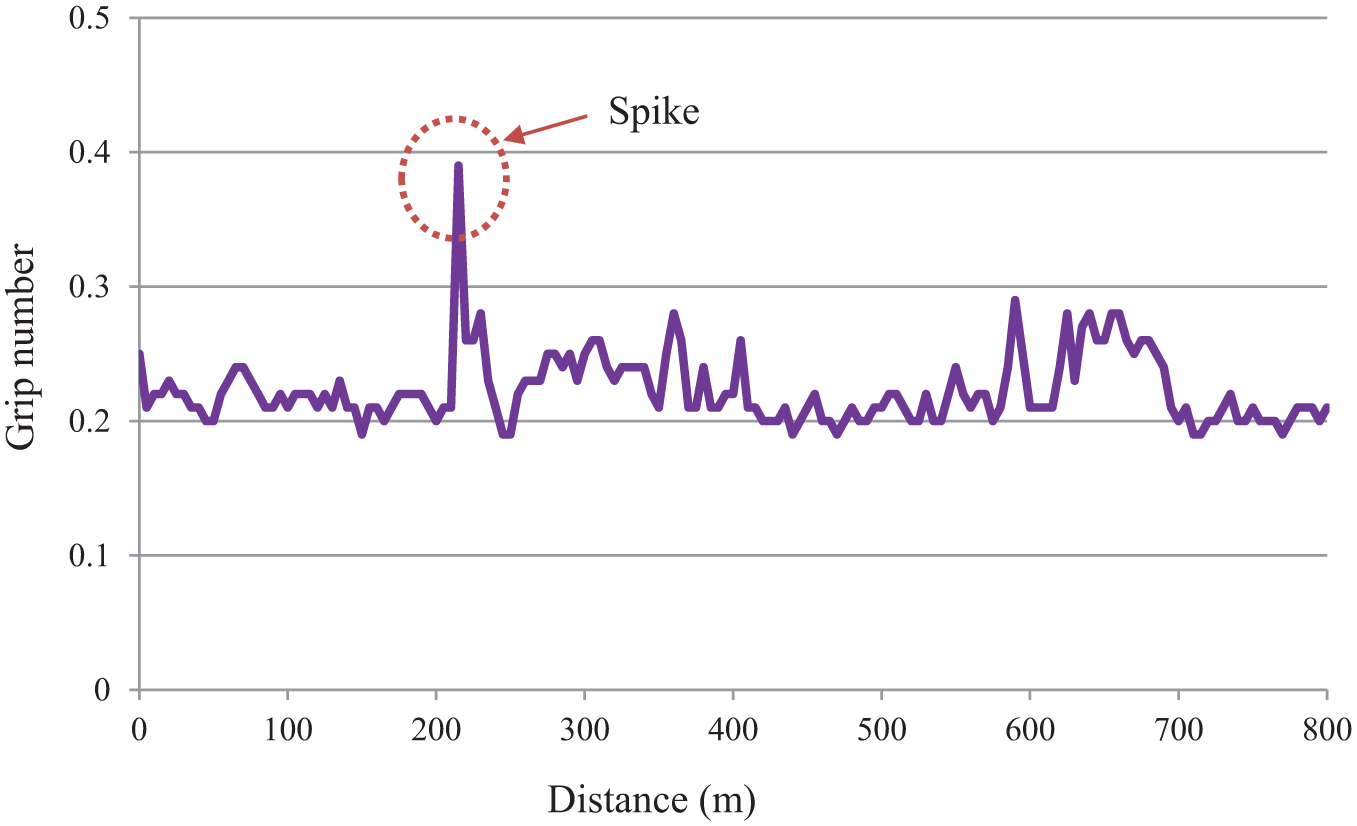
An example of GripTester measurements.
Model Validation
The validation of the FE GripTester tire-pavement interaction model was achieved by evaluating the skid resistance at three different pavement sections (A, B, and C respectively) from the same road mentioned previously. Figure 8 shows a comparison of the predicted model results against the experimental data. The difference between the simulation results and experimental data for sections A, B, and C are 0.05 (17%), 0.05 (16%), and 0.07 (25%), respectively.
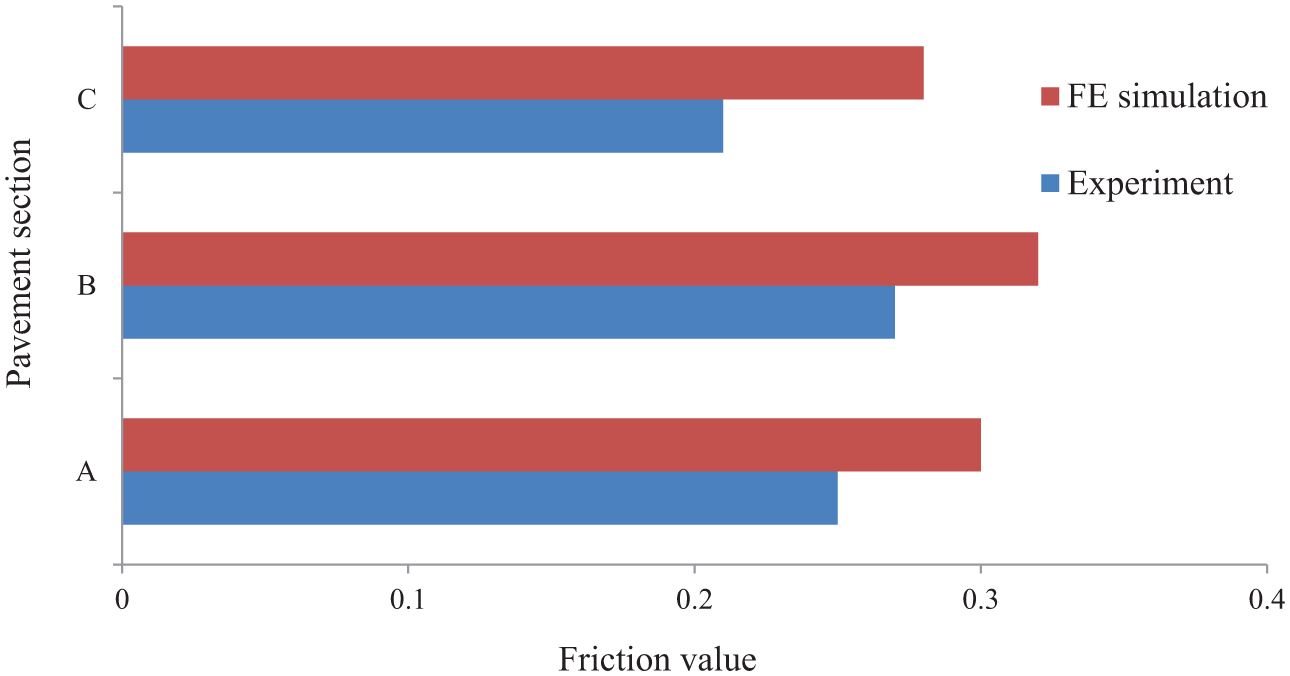
A comparison of GripTester measurements and FE results.
The model was also able to predict the development of temperature correctly. On average, the temperature recorded inside the tire material was 40°C whereas the model predicted a temperature of 43°C. This shows a good agreement between the measured and predicted temperatures, considering the unavoidable variations of field conditions and possible measurement errors.
Braking Distance Calculations from PIARC Tire
To predict the friction values of a real scale tire (PIARC tire) based on test results obtained from GripTester, the following steps were taken:
The developed model was used to simulate the interaction between the GripTester and the pavement surface accounting for the surrounding temperature conditions. Friction and temperature development profiles were recorded as outputs from the simulation.
The surrounding temperature conditions were kept the same as in Step 1, and the Grip tire was replaced by the PIARC tire.
The PIARC tire was run at a prescribed maximum speed of Vi (120 km/h) and the speed was gradually reduced in smaller steps to a prescribed lower limit (20 km/h) by repeating the above-mentioned steps. A relationship between the coefficient of friction and the speed was established which was utilized as an input for the following step.
To carry out braking simulation, the PIARC tire was rolled over a plain pavement where the tire-pavement interaction interface was provided with the friction law according to the earlier obtained friction-speed relationship. This simulation was carried out under various conditions to study the tire-pavement interaction mechanisms.
Results and Discussion
In a field measurement, slight variations in the operating conditions (test speed, inflation pressure, water flow volume etc.) are to be expected. Furthermore, if the measurements are conducted at different times of the day, the ambient temperature during the test does not remain constant. These variations may result in an unreliable interpretation of skid resistance data. The FE model was used to study the effect of the variation in speed and ambient temperature on friction number.
Influence of Test Speed and Ambient Temperature on GripTester Results
In order evaluate the effect of speed on the friction number, test speeds of the GripTester were varied between 40 and 100 km/h with an interval of 20 km/h as shown in Figure 9a. Results show that the friction number decreases from 0.3 to 0.23 (21%) with an increase of test speed from 40 to 100 km/h. This can be attributed to the fact that the increase in speed causes less energy dissipation.
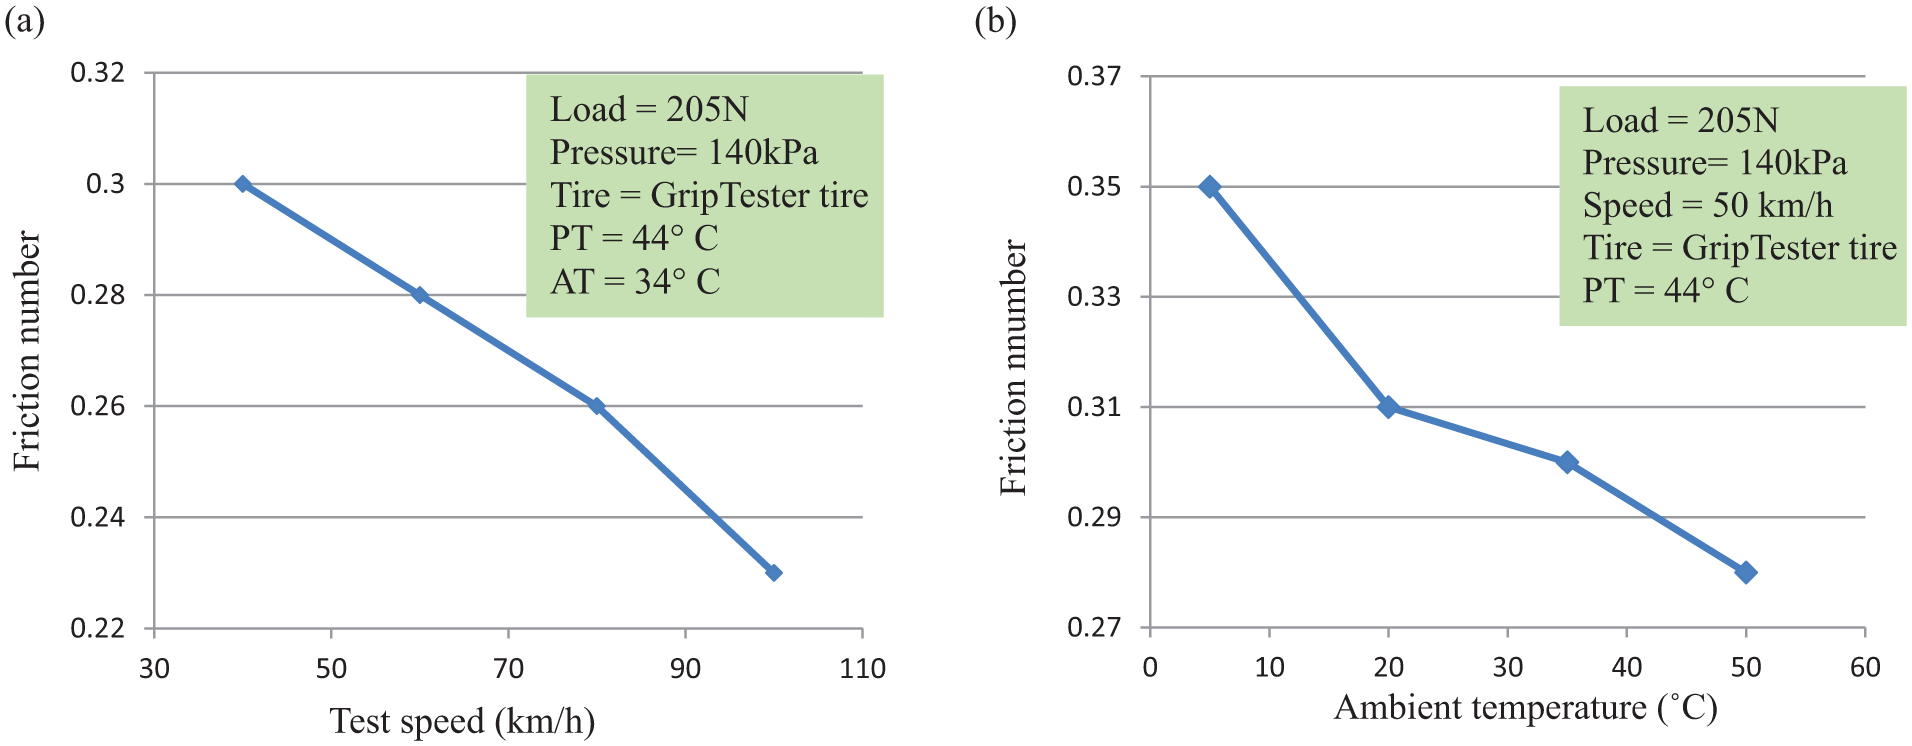
Results of influential factors on the friction number: (a) test speed and (b) ambient temperature.
The effect of ambient temperatures from 5 to 50°C on skid resistance are shown in Figure 9b. The results show that an increase in ambient temperature will cause a decrease in friction number. This is because higher ambient temperature increases the overall tire temperature, which lowers the material’s mechanical properties. This leads to the decrease of energy dissipation and therefore, lower friction number. Such analysis is useful in obtaining correction factors of friction measurements accounting for temperature variations.
Influence of Vehicle Operating Parameters on Pavement Safety
In the earlier section, a methodology was proposed to predict the friction of a PIARC test tire, based on field test results obtained from a GripTester. It is expected that a PIARC tire would better represent a passenger car tire in terms of geometrical attributes and operating conditions. In this subsection, further analysis will be carried out based on the friction obtained by a PIARC tire.
As discussed in earlier sections, the skid resistance is influenced by many factors and thus the available braking distance is also affected by these variations. Since the interpretation of the results is a lot easier in terms of the braking distances, the effects of vehicle speed, inflation pressure, wheel load and ambient temperature on the skid resistance and braking distance will be discussed. It was observed that the developed model is able to compute the braking distance directly; a further post process analysis is not needed.
Effect of Inflation Pressure on the Skid Resistance/Braking Distance
Various inflation pressures: 100, 140, 170, and 250 kPa were considered to evaluate the effect of tire pressure on skid resistance. The results are shown in Figure 10a. Under the prescribed conditions, results show that the skid resistance decreased from 0.3 to 0.26 (13%) with an increase of inflation pressure from 100 to 250 kPa. This effect can be attributed to a decrease of contact surface with an increase in pressure.
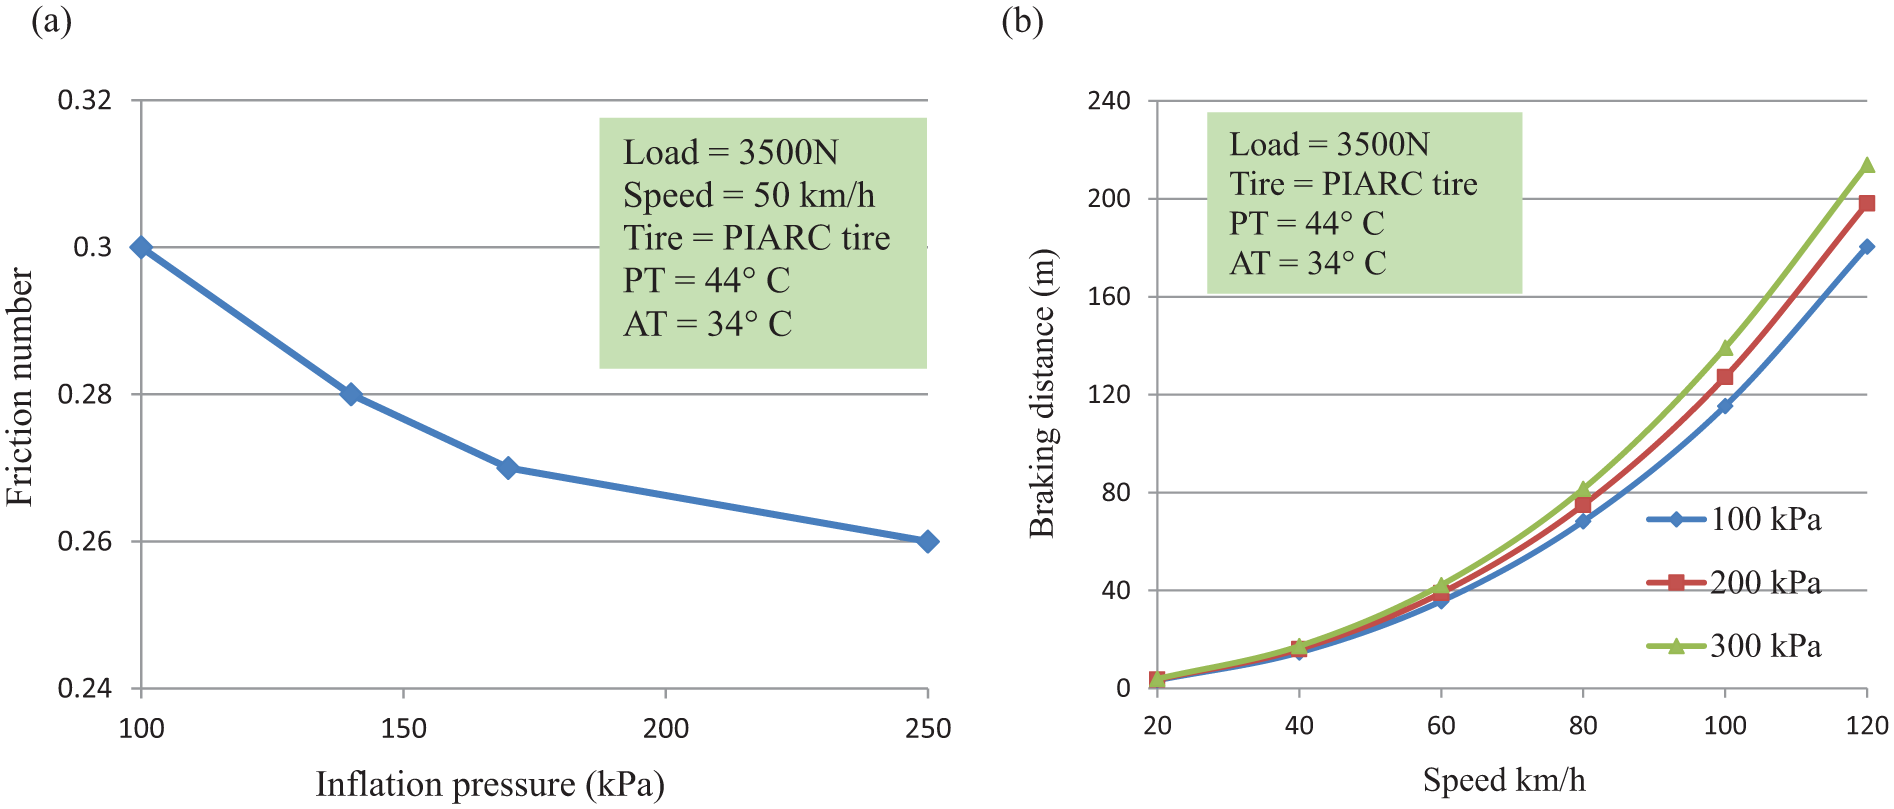
Results of effect of inflation pressure on (a) the skid resistance and (b) the braking distance.
Figure 10b shows that the braking distances increase with an increase in inflation pressure; however, their rates of increment depend on the slipping condition of the vehicle. The braking distance is calculated at a speed range from 20 to 120 km/h for three different inflation pressures: 100, 200, and 300 kPa. The percentage decrease in braking distance was observed to be 18% at a speed of 120 km/h, when the tire inflation pressure changed from 100 to 300 kPa. This highlights the importance of maintaining proper inflation pressure in the tire.
Effect of Vehicle Loading on the Skid Resistance/Braking Distance
The wheel load was varied from 3000 to 6000 N at an interval of 1000 N. The results are shown in Figure 11a. It can be observed that as the tire load increases, the skid resistance increased from 0.28 to 0.3 (7%) indicating that the effect of load is not significant. This result can be attributed to the higher deformation of the tire body caused by increasing tire load, which increases the energy losses and ultimately causes an increase in the friction force.
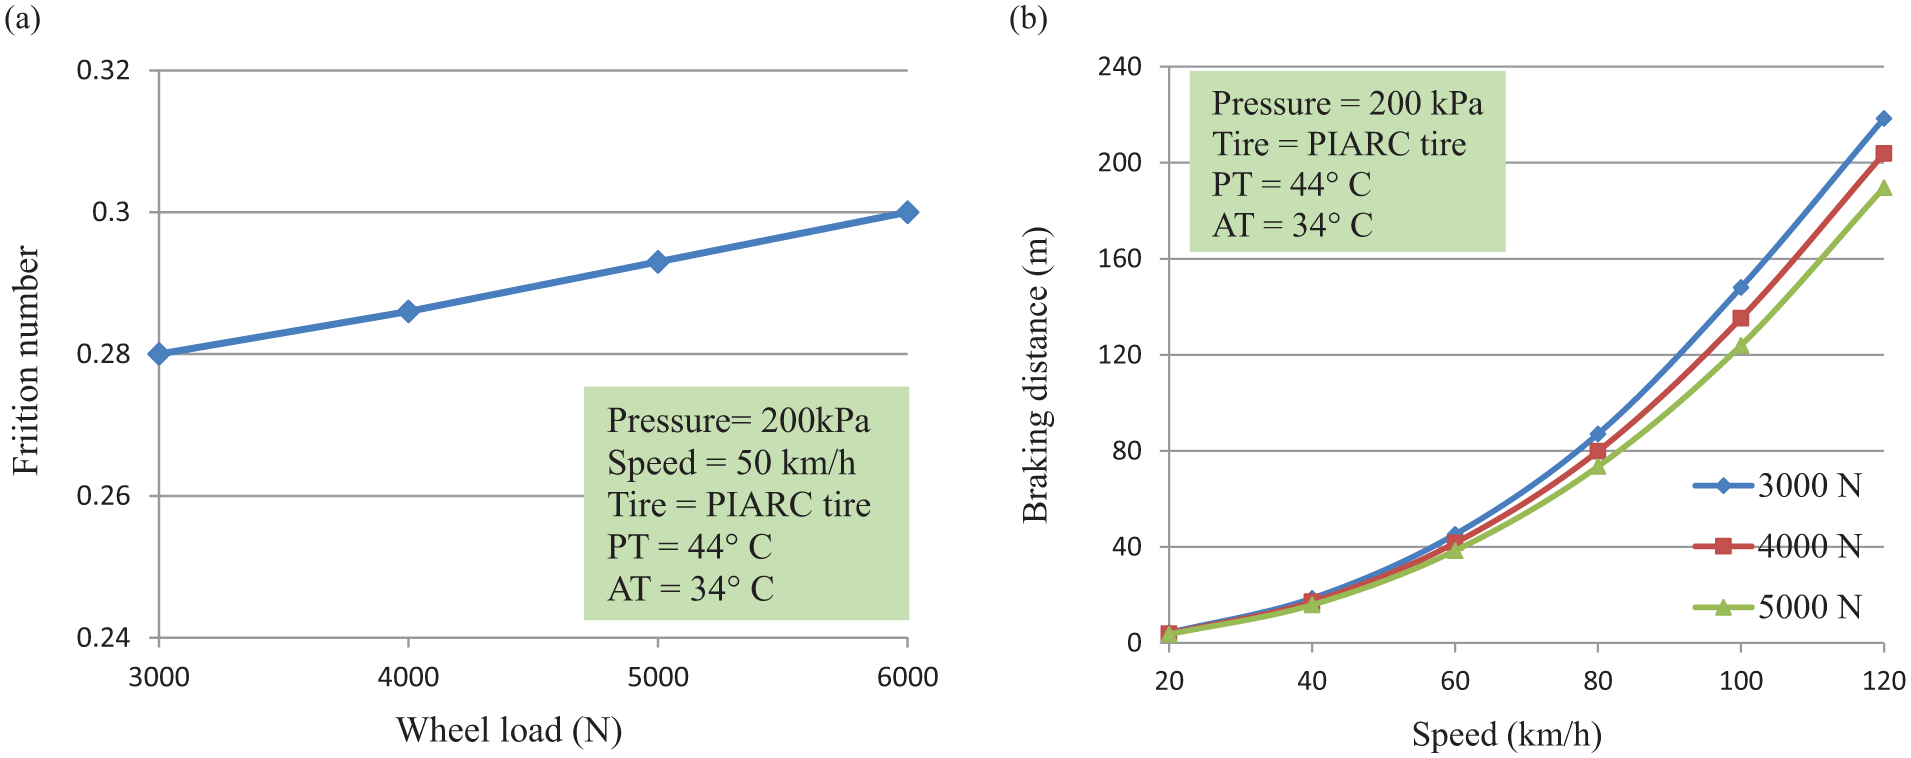
Results of effect of wheel load on (a) the skid resistance and (b) the braking distance.
Figure 11b shows the effect of wheel loads on the braking distance. Wheel loads ranging from 3000 to 5000 N were considered. The plots show that the braking distance decreases with the increase of the wheel load. At the speed of 120 km/h, the predicted braking distance decreases from 218 to 189 m (15%) with an increase of wheel load from 3000 to 5000 N.
Effect of Ambient Temperature on the Braking Distance
Figure 12 shows the effect of ambient temperatures on the braking distance. The results show that at constant load, inflation pressure, and speed, the values of braking distance increase with an increase in the ambient temperature. An increase of the braking distance from 224 to 175 m (28%) was observed for an increasing ambient temperature from 10 to 50°C.
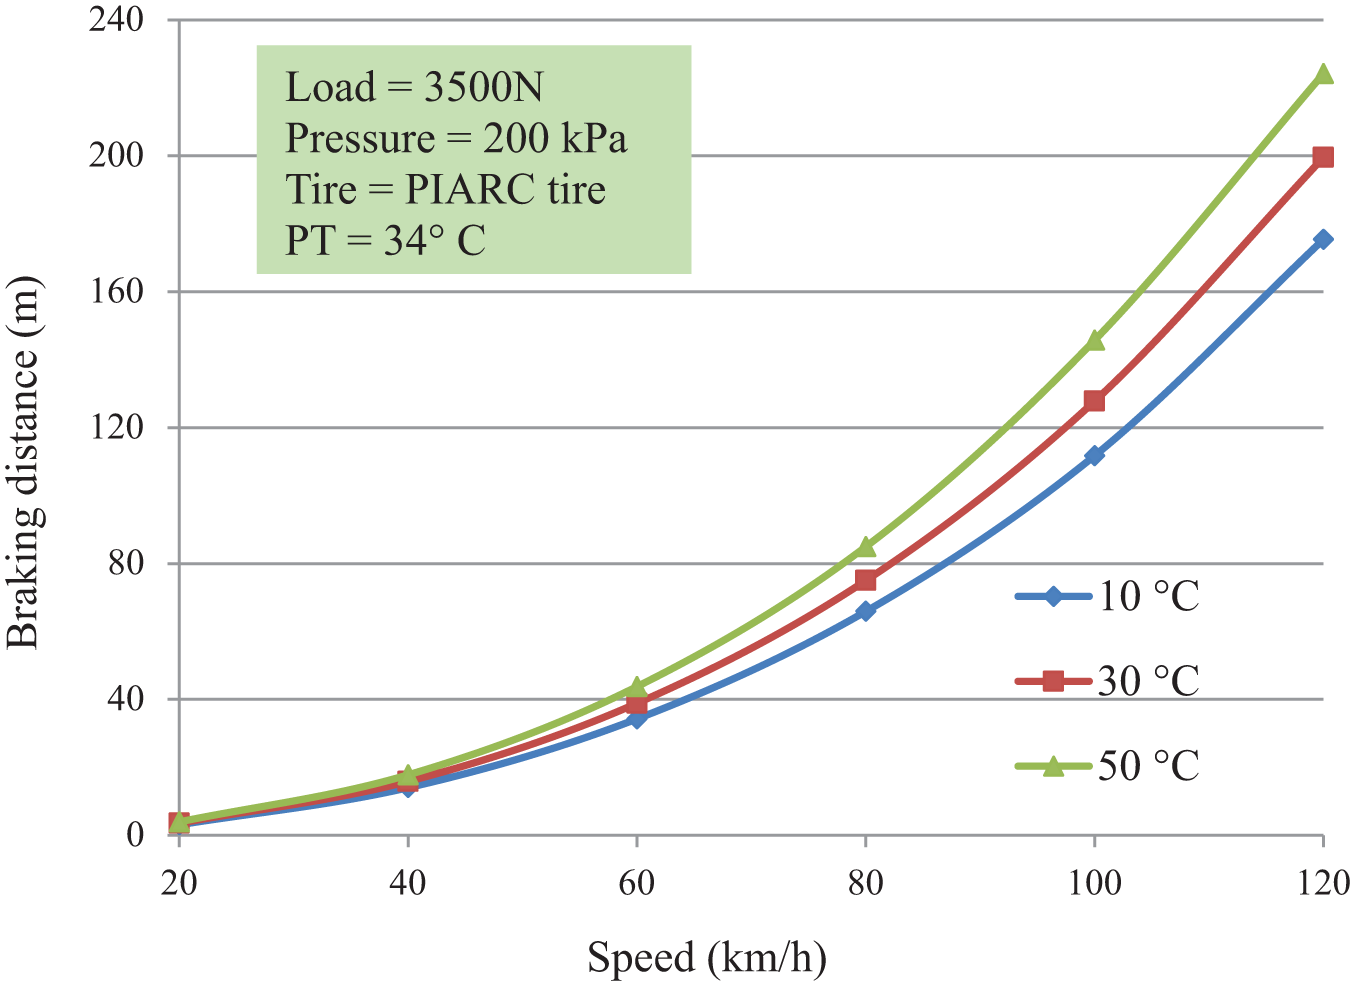
Results of effect of temperature on the braking distance.
Effect of MPD on the Braking Distance
Figure 13 demonstrates the effect of MPD on the braking distance. Three pavement surfaces with different MPD values of 0.45, 0.65, and 1.1 mm were obtained by magnifying the scales of the pavement mesh. The results were compared with the current pavement surface. It can be clearly seen that braking distances increase with decreasing MPD. The results show that for a given speed of 120 km/h, braking distance reduces from 198 to 79 m for the MPDs considered. Specifically, the difference between the braking distances for MPD values of 0.45 and 0.65 mm is 6%, while that for MPD values of 0.65 and 1.1 mm is 17%. This may be attributed to the fact that a contact between the rubber tire and many macro-asperity contact regions of the pavement surface will result in hysteresis energy loss leading to higher skid resistance. It implies that proper maintenance for better pavement roughness could significantly reduce the braking distance. Such findings could be important for the road authorities to enable them make maintenance/rehabilitation planning.
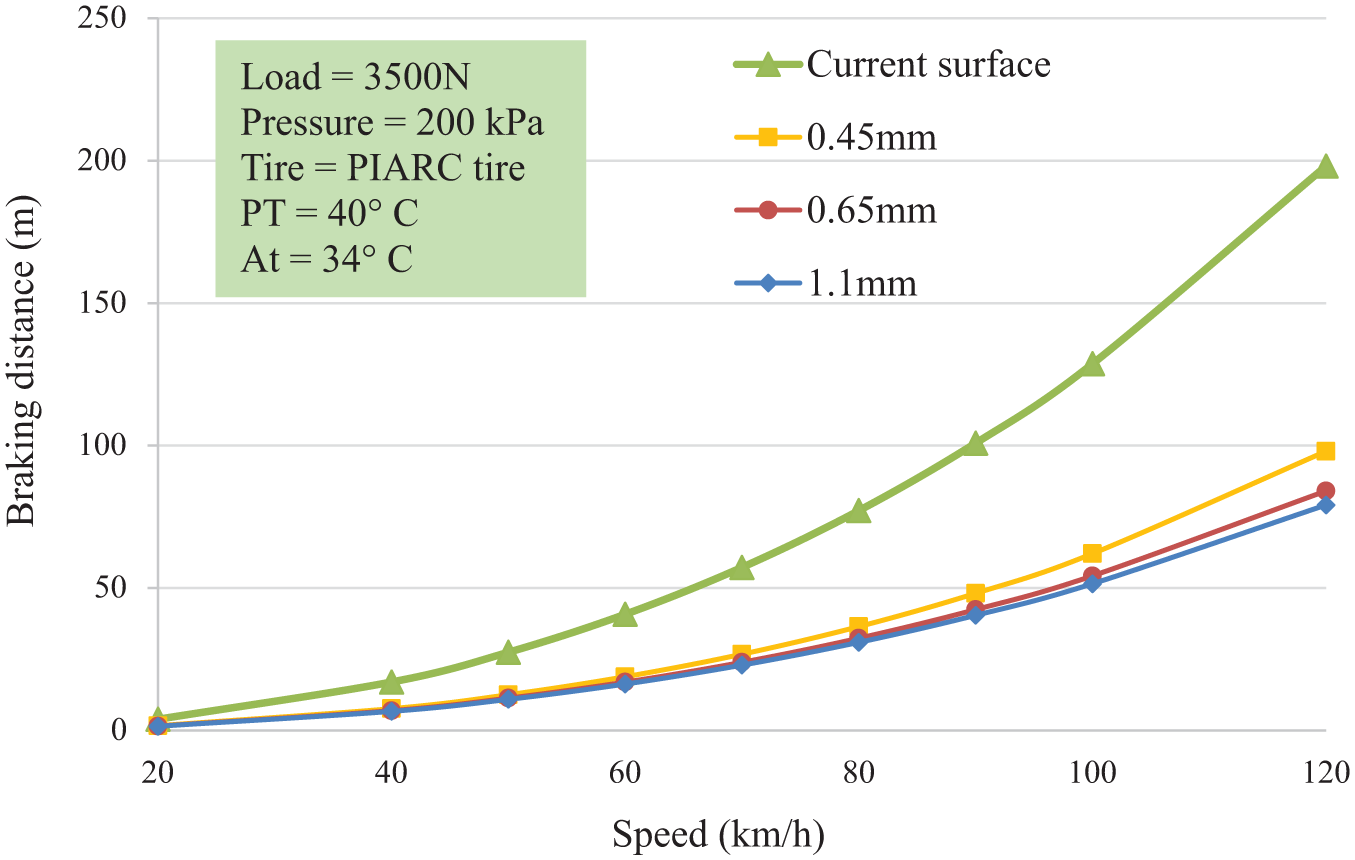
Results of effect of MPD on the braking distance.
On the basis of Figures 9–12, it can be concluded that the skid resistance/braking distance at the chosen section is lower than the acceptable limits in Europe and the USA. The pronounced role of the temperature can be clearly seen in these plots. The findings of this study indicate that failure to maintain tire pressures and adhere to speed limits increase the accident risk even more as the temperature increases. Figure 13 implies that maintainence of the pavement roughness is of great importance in terms of braking distance.
Conclusions
This paper presents the development and application of a FE thermo-mechanical tire pavement interaction model. This model simulates the condition of a GripTester tire running over an asphalt pavement surface obtained from a test section. The model was validated using field measurements carried out in Qatar. The model capabilities were illustrated by analyzing the effects of variations of speed, tire inflation pressure, static wheel load and temperature on the skid resistance/braking distance. It was demonstrated that the model can be used to develop correction factors for the effects of temperature on friction measurements. In addition, the paper presented a finite element approach to evaluate skid resistance obtained using different tire sizes and configurations. The results showed that different tires would result in different friction values for the same surface under the same vehicle operating conditions.
Based on both field data and FE analysis, it was concluded that the rise in temperature could have a significant influence on reducing skid resistance and increasing braking distance. This reduction in skid resistance is a potential safety risk for vehicles traveling on pavement surfaces with elevated temperatures. The results also demonstrated that braking distance could be improved with better surface roughness. This information could be vital to road agencies to develop maintenance/rehabilitation strategies.
Footnotes
Acknowledgements
This publication was made possible by an NPRP award (NPRP No. 7-482-2-184: Thermo-Mechanical Tire-Pavement Interaction: Computational Modeling and Field Measurements) from the Qatar National Research Fund (QNRF-a member of The Qatar Foundation).
Author Contributions
The authors confirm contribution to the paper as follows: study conception and design: Kumar Anupam, Tianchi Tang, Athanasios Scarpas and Eyad Masad; data collection: Reginald Kogbara; analysis and interpretation of results: Tianchi Tang, Kumar Anupam and Cor Kasbergen; draft manuscript preparation: Tianchi Tang. All authors reviewed the results and approved the final version of the manuscript.
The Standing Committee on Pavement Surface Properties and Vehicle Interaction (AFD90) peer-reviewed this paper (18-04085).The statements made here are solely the responsibility of the authors.