
Abstract
ZOAB (Zeer Open Asphalt Beton) is the most widely used asphalt mixture in the Netherlands. As a type of open asphalt mixture, it is known to suffer from raveling distress. In order to analyze the propensity of raveling, micromechanical models are considered effective. However, most of the research work about micromechanical models has focused on dense asphalt mixture and the application of these models on ZOAB mixes has not been paid adequate attention. Therefore, in this research study, the performance of various micromechanical models for predicting mechanical properties of ZOAB was evaluated. The predicted results were compared with the measured values from a dynamic uniaxial compression test. The analysis results showed that none of the applied micromechanical models could obtain acceptable predicted results of the dynamic Young’s modulus and phase angle of ZOAB. On one hand, the Dilute model, the Mori-Tanaka model, the generalized self-consistent model and the Lielens’ model provided lower values of dynamic Young’s modulus and higher values of phase angle, whereas, for the self-consistent model, the predicted results of dynamic Young’s modulus were higher, and the values of phase angle were lower. On the other hand, the shapes of the predicted master curves of both dynamic modulus and phase angle of ZOAB could not match well with the experimental results. The further research on the differential scheme method showed that at lower frequencies the predicted mechanical properties of ZOAB mixes by the applied micromechanical models could not be improved even by following this scheme.
In the Netherlands, ZOAB (Zeer Open Asphalt Beton) is the most commonly used road surfacing material ( 1 ). It is a kind of porous asphalt mixture, which provides a significant noise reduction and a good skid resistance. Due to these advantages, more than 70% of the major roads in the Netherlands have been surfaced with ZOAB and this percentage is still increasing ( 1 ).
However, due to the high air voids content characteristic, ZOAB always suffers from a particular distress known as raveling ( 2 ), which occurs as individual aggregate particles separated from the pavement surface. The propensity of raveling for a given ZOAB mix can be analyzed on the basis of the stresses and strains information of its individual phases ( 3 ).
In the recent past, computational models based on finite element methods (FEM) and/or discrete element methods (DEM) have been proposed as a means to obtain the stresses and/or strains at mix component level of ZOAB mixes ( 4 ). Although FEM/DEM based models are able to handle complex compositions and almost realistic mix component material properties, they require the development of very large FEM meshes (usually by means of post-processing of the results of CT scans) and very large-scale computational facilities ( 4 ).
Homogenization methods offer an attractive alternative to the above issues. By means of a homogenization technique, the effective micromechanical properties of a mix are determined from the properties of its different phases, which further allows the calculation of the stress/strain field of the different phases based on the applied loading condition ( 5 ). This information, in combination with appropriate laboratory tests, can be utilized to evaluate the propensity of a given ZOAB mix for raveling.
On the basis of the homogenization theory, micromechanical models, i.e., the Dilute model ( 6 ), the Mori-Tanaka (MT) model ( 7 ), the self-consistent (SC) model ( 8 ), the generalized self-consistent (GSC) model ( 9 ), the Lielens’ model ( 10 ), etc., have been developed by different researchers. Micromechanical models do not only consider the mechanical properties of the constituents but also take the geometrical characteristics into consideration. The determination of the effective properties of a mix by these models does not require the calibration factor from laboratory tests. This is a significant advantage over general homogenization methods. Since micromechanical models were initially developed for elastic materials, these models are not directly applicable to asphaltic materials. Several researchers ( 11 – 18 ) have tried to extend these models for asphalt pavements by considering viscoelasticity with limited success.
Researchers ( 11 ) presented the predicted shear modulus of asphalt mastic by the Composite Spheres model ( 12 ) and the GSC model. They pointed out that these models generally underestimate the measured results and it was explained that these models were not developed to account for stiffening effects beyond volume filling. Other researchers ( 13 ) have also investigated the capabilities of the Composite Spheres model, the GSC model, and the generalized Nielsen’s model ( 14 ) for estimating the properties of mastic. Their study showed that the predicted results agree with the experimental data only for mixes with low volume concentrations of filler. They also pointed out that the particle interactions, potential physicochemical reinforcement between bitumen and filler, and irregular particle shape and texture roughness may account for the inaccurate prediction for a mix with a high volume concentration of inclusions. In the later studies, researchers ( 15 ) examined various mastic types with different volume concentrations of filler at sub-zero temperatures. It was concluded that the SC model performs better than the Dilute model, the MT model and the GSC model. The limitation of their work is that it was performed at low temperatures, so the conclusions are only valid in sub-zero temperature conditions. On the other hand, other researchers ( 16 , 17 ) who conducted their experiments on densely filled mixes concluded that the GSC model is more applicable than the MT model. They also proposed that the MT model can predict better results if the “volume fractions” of inclusions are replaced by the “effective volume fractions.” However, they observed that the acceptable results are only valid for tensile creep tests, and not for the dynamic tests, especially those which are performed at high temperatures. Recently, researchers ( 18 ) evaluated the currently available micromechanical models for the prediction of asphalt mastic shear modulus and it was found that none of them can accurately capture the temperature- and frequency- related stiffening of mastic.
As described in the above paragraphs, it can be concluded that with the increased use of ZOAB, it is of vital importance for pavement engineers to investigate the stresses/strains of individual phases in ZOAB mixes. For this purpose, the micromechanical models are more effective and accessible in comparison with the FEM/DEM. However, although research studies have been conducted on predicting the mechanical properties of asphalt materials by various micromechanical models, there are no commonly accepted models within the pavement engineering community. Moreover, most of the research activities related to the micromechanical modeling focus on the dense asphalt materials, and not much attention has been paid to evaluating the performance of ZOAB.
Objective and Scope
Therefore, the aim of this paper is to compare various micromechanical models in predicting the mechanical properties of ZOAB-type mixes on the basis of laboratory tests.
The scope of the proposed study includes:
Determination of viscoelastic behavior of ZOAB over a wide range of frequency from a dynamic uniaxial compression test.
Prediction of viscoelastic properties of ZOAB using five commonly used micromechanical models, i.e., the Dilute model, the MT model, the SC model, the GSC model, and the Lielens’ model.
Frequency/temperature sensitivity analysis to evaluate the performance of various micromechanical models in predicting the mechanical properties of ZOAB.
Study of the performance of these micromechanical models by following the differential scheme method in which the constituents are included in steps rather than concurrently.
Background Knowledge
Homogenization Theory
Homogenization theory was developed to evaluate the effective properties of a mix given the properties of its constituents. In this theory, a representative volume element (RVE) which represents the overall mechanical response of the mix is chosen. In an RVE, the volume fraction of each phase (i.e., mastic, aggregate, and air void), obviously sums up to unity, as

where fmas is the volume fraction of the mastic phase; fagg and fvoid are the volume fractions of the aggregate phase and the air void phase, respectively.
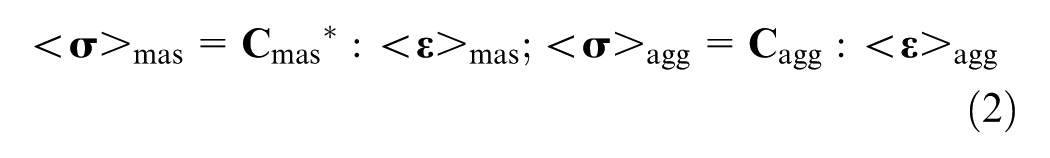
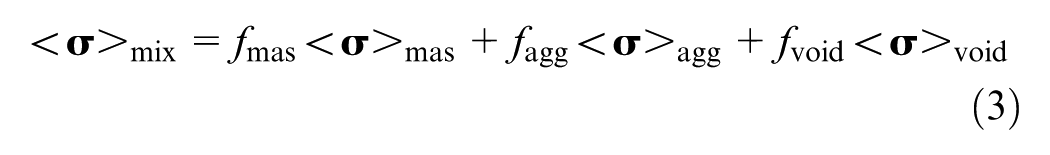
In an RVE, the constitutive relationship between the average stress and average strain of each phase is shown in Equation 2, where the average stress and strain of each phase can be further related to the average stress and strain of the mix by Equations 3 and 4.

where
<
<
<
<
On the basis of the relationship between <

In order to enable the calculation of
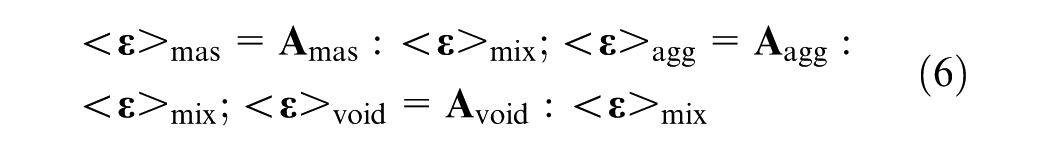
where

where
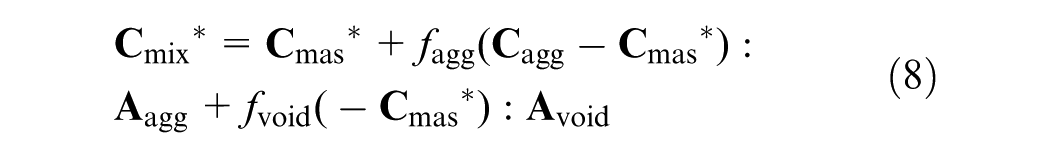
Once the strain localization tensor of each phase is known, the value of
Micromechanical Models
As described in the earlier section, the value of
Dilute Model
In the Dilute model, the interactions between inclusions are supposed to be negligible and thus ignored, also, inclusions are assumed to be embedded in an infinite matrix. Based on these assumptions, the strain localization tensors of the aggregate phase and the air void phase for the Dilute model,
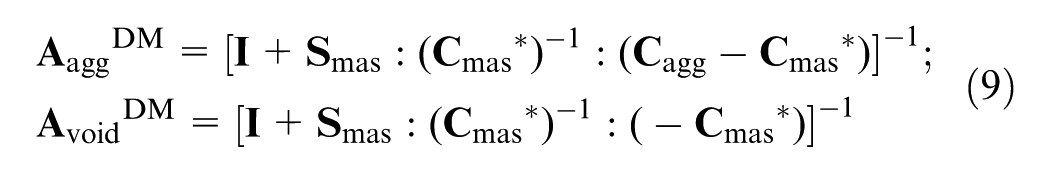
where
Mori-Tanaka Model
The MT model assumes that each inclusion is surrounded by the matrix with a uniform averaged strain. As a comparison with the Dilute model, this model takes the interactions between inclusions into consideration. Therefore, it is applicable for mixes with a higher volume fraction of inclusions. In the MT model, the strain localization tensors of the aggregate phase and the air void phase,
Self-Consistent Model
In the SC model, each inclusion is assumed to be embedded into an infinite media which has the same properties with the mix itself and the strain localization tensors of the aggregate phase and the air void phase,
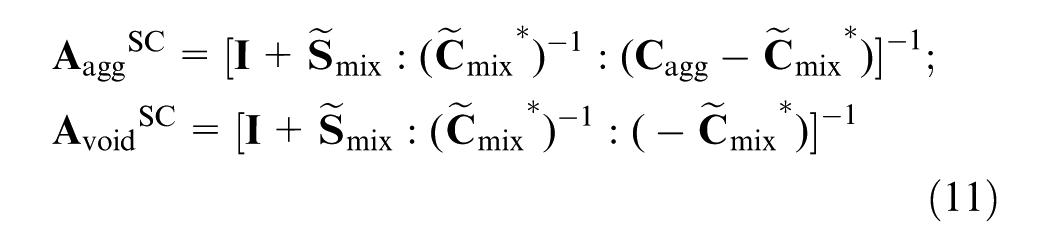
where
Since inclusions are assumed to be embedded into the mix itself in the SC model, the effective stiffness tensor is also required. Thus, the explicit expression of the mix stiffness cannot be obtained directly, and Equation 11 needs to be solved by an iterative procedure.
Generalized Self-Consistent Model
The GSC model is similar to the SC model; however, it further adds a spherical annulus of matrix material out of inclusions. For a two-phase mix, Christensen and Lo ( 9 ) proposed the following solution for the effective shear modulus of the mix μmix*
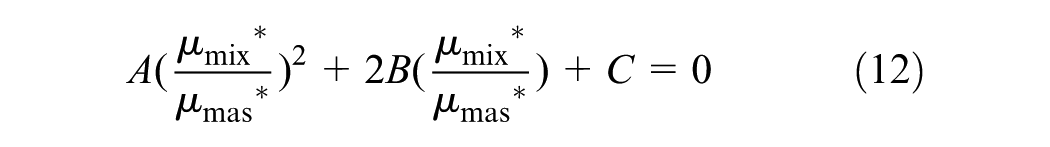
where μmas* is the shear modulus of the mastic phase; and the values of A, B and C are related to the mechanical properties and volume fraction of each phase. The detailed formulations of these parameters can be found elsewhere ( 9 ). The solution for the effective bulk modulus of the GSC model corresponds to that of the Composite Sphere model ( 20 ).
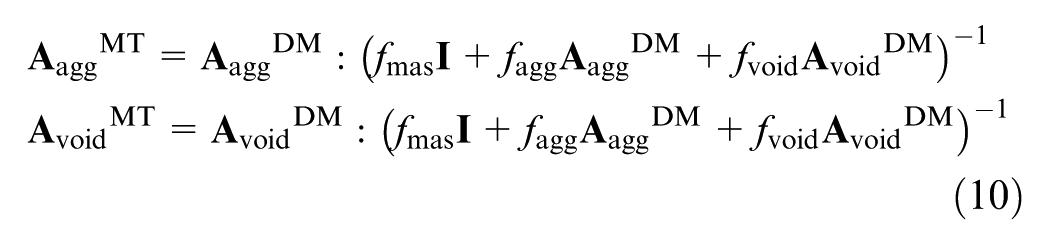
For a three-phase mix, the solution to the GSC model is too cumbersome to be solved analytically ( 21 ). In order to employ the classical two-phase GSC model for a three-phase mix, researchers ( 17 ) normally divided the prediction procedure into two steps: i) either the aggregate phase or the air void phase is added into the mastic phase; ii) the other phase is added into the composite solution of step 1 by using the same expressions. It is highlighted here that in this research study all the orders of phase additions were considered which will be described in the later section titled “Upscaling by Various Micromechanical Models”.
Lielens’ Model
The Lielens’ model considers interpolation in the lower bound and the upper bound of the strain localization tensor. The lower bound is calculated in the case where the stiff phase is embedded into the soft phase. For this case, the strain localization tensor of the aggregate phase,

The other case in which the soft phase is embedded into the stiff phase yields the upper bound and the strain localization tensor of the aggregate phase,

where
With interpolating
where
The interpolation factor aagg is related to the volume fraction of the aggregate phase and is calculated by

It is noted here that Equations 13–17 were used to obtain
Differential Scheme
Many research studies (
13
,
15
,
18
) have pointed out that the above micromechanical models are not suitable for a mix with higher volume faction of inclusions. In order to improve the accuracy of the predicted results for dense inclusions, the Differential Scheme (DS) approach (
22
,
23
) was proposed. In this approach, inclusions are added in steps and for each step the value of
where
fmas(i) is the value of fmas in step i; and
Δfagg(i+1) and Δfvoid(i+1) are the increments of fagg and fvoid in step i+1, respectively.
In this research work, after the sensitivity analysis about the effect of different calculation steps on the predicted results, a total of 50 steps were finally conducted to calculate the value of
Material and Testing Procedure
Materials and Specimen Preparation
Material Properties
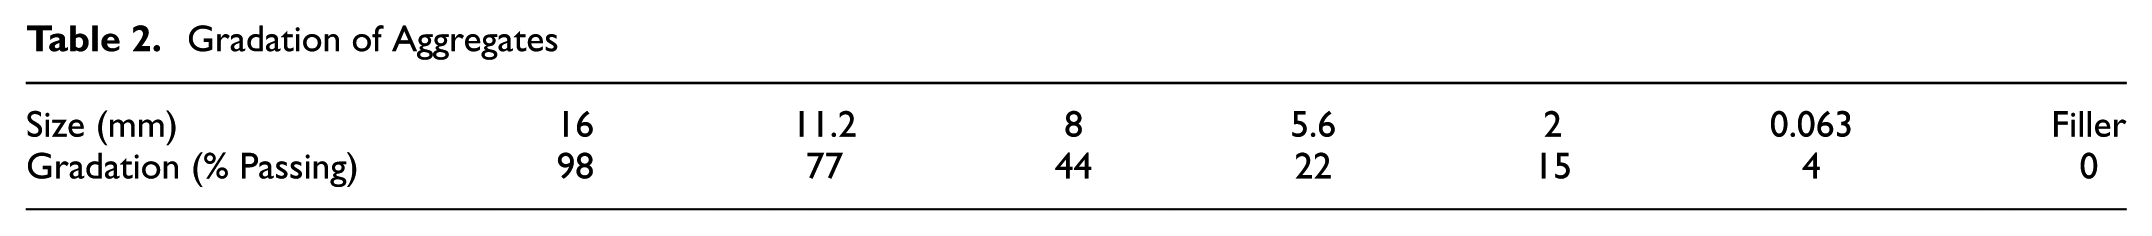
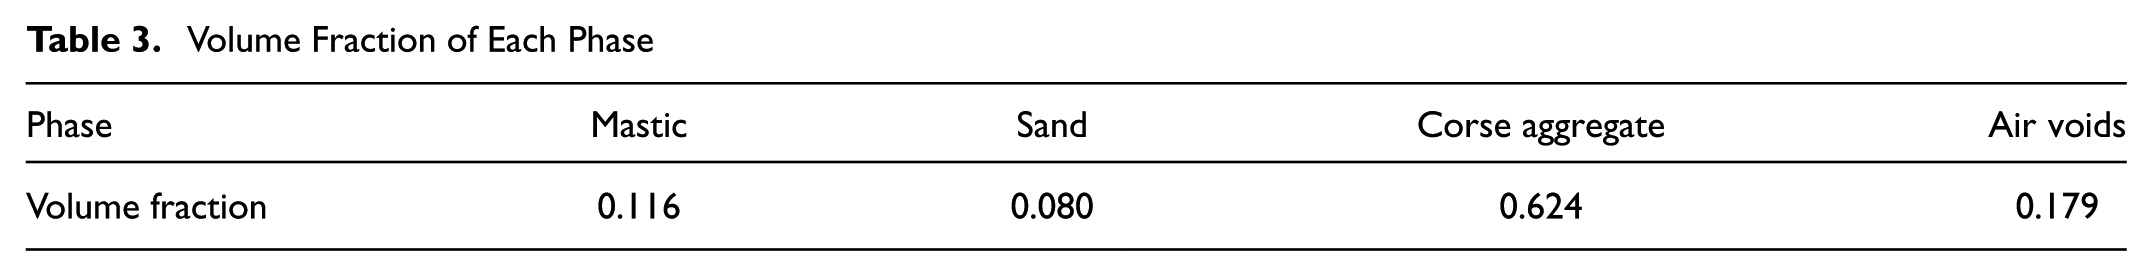
The material properties for making ZOAB specimens are shown in Table 1, and the corresponding aggregate gradation is shown in Table 2. Since mastic is broadly accepted as the basic functional matrix within asphalt mixture ( 25 ), in this research ZOAB was considered as a three-phase mix of the aggregate phase (excluding filler) and the air void phase embedding into the mastic phase. On the basis of the properties of each phase and the composition of ZOAB, the volume fraction of each phase, as shown in Table 3, was calculated.
Properties of Different Materials
Gradation of Aggregates
Volume Fraction of Each Phase
Specimen Preparation of Mortar
The mortar column specimens were prepared according to the past research work carried out at TU Delft ( 26 ). The dimension of the specimens can be found in Figure a. The maximum particle size of mortar was chosen to be 2 mm as suggested by authors ( 25 ).
Specimen Preparation of ZOAB
According to the AASHTO T 342-11 standard method ( 27 ), specimens for the measurement of dynamic modulus of asphalt mixtures were prepared. The initial specimen, the size of which was 170 mm in height and 150 mm in diameter, was compacted using a gyratory compactor. This specimen was further cored and cut to the test specimen with a height of 150 mm and diameter of 100 mm.
Laboratory Tests
DSR Test
Frequency sweep tests were conducted by using dynamic shear rheology (DSR) to measure the shear modulus of mastic and mortar. The parallel-plate configuration was applied to test mastic specimens, while mortar specimens were tested by using the so-called “Bitumen Column Configuration” ( 28 ), Figure 1b and c . The cylindrical mortar specimens were fixed at the bottom and torsional forces were applied at the upper fixture. All the tests were performed in a frequency range of 50 Hz to 0.1 Hz, at four different temperatures, –10°C, 4°C, 21°C and 37°C with 20 uε–5000 uε of strain amplitudes (depending upon the test temperature).
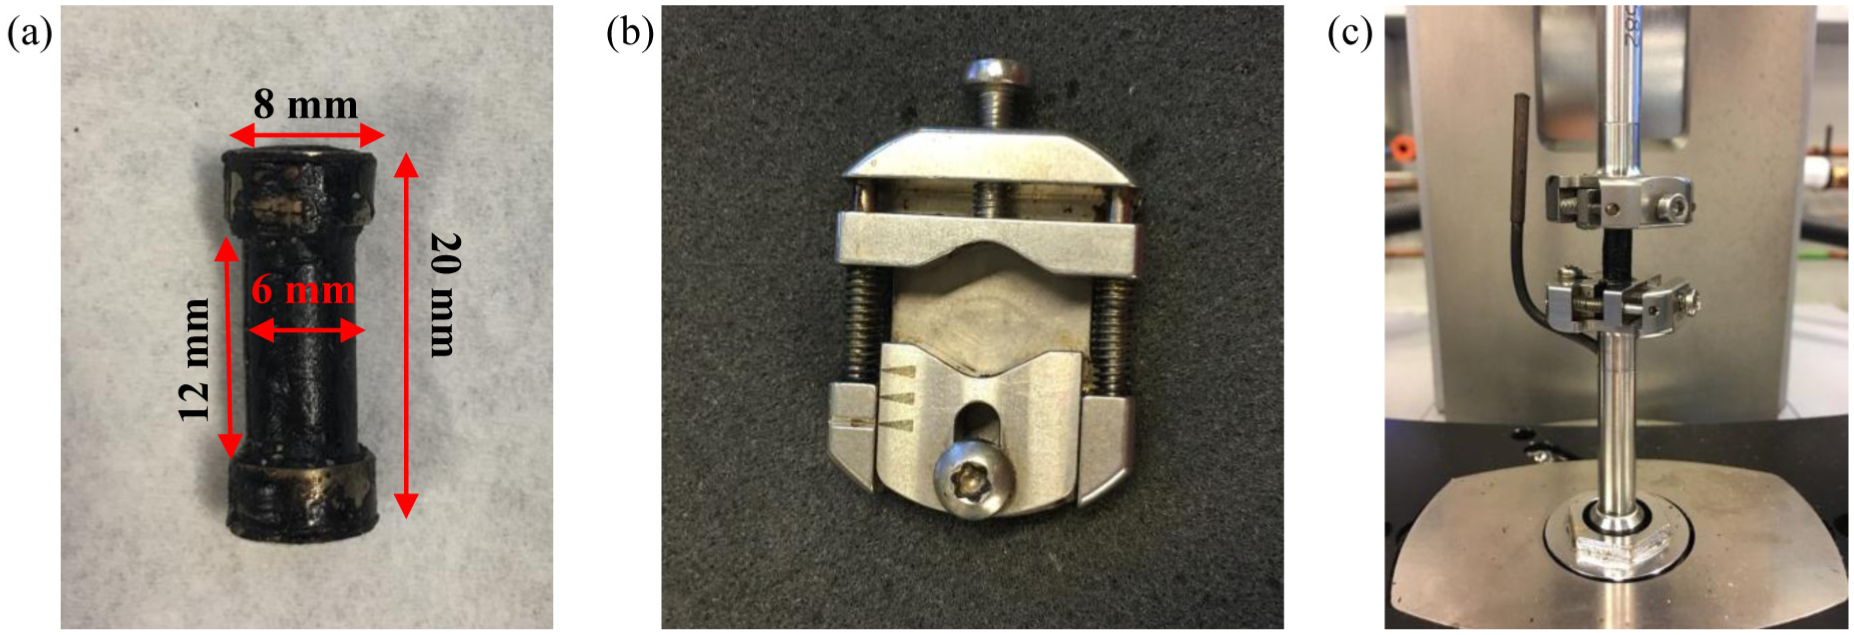
DSR setup for mortar tests: (a) specimen, (b) fixture, and (c) configuration.
Uniaxial Compression Test
The Young’s modulus of ZOAB was measured under dynamic uniaxial compression load by universal testing machine (UTM) at different frequencies and temperatures. In accordance with the AASHTO T 342-11 standard method ( 27 ), four temperatures, –10°C, 4°C, 21°C and 37°C, were applied during the test and for each temperature, six different frequencies, which were 20 Hz, 10 Hz, 5 Hz, 1 Hz, 0.5 Hz and 0.1 Hz, were performed. The load applied on the specimen was under stress-controlled mode and three linear variable differential transformers (LVDT) were installed to measure the displacements of the specimen. The obtained results and analyses will be discussed in the following section.
Results and Discussion
The tests performed provided us with a background for investigating different aspects of the performances of various micromechanical models. In general, to represent the data in a frequency spectrum, dynamic modulus/phase angle master curves were obtained according to the Time-Temperature Superposition Principle (TTSP) at a reference temperature (Tr) of 21°C. These curves were prepared on the basis of three samples per test that was conducted.
Comparison of Viscoelastic Behavior of Mastic, Mortar, and ZOAB
It is expected that the major part of the viscoelastic characteristic of mortar and ZOAB comes from the mastic phase. That is why it is logical to study the behavior at the mastic scale and compare it with the similar plots at the mortar- and mix- scale.
The master curves of mastic, mortar, and ZOAB are plotted in Figure 2. The dynamic Young’s moduli of mastic (|E*|mas), mortar (|E*|mor), and ZOAB (|E*|mix) are shown in Figure 2a. The values of |E*|mas and |E*|mor were calculated in accordance with the relationship between the Young’s modulus and the shear modulus (in elasticity). It is noted here that the Poisson’s ratios of mastic and mortar are assumed to be 0.495 and 0.35, respectively ( 29 – 31 ).
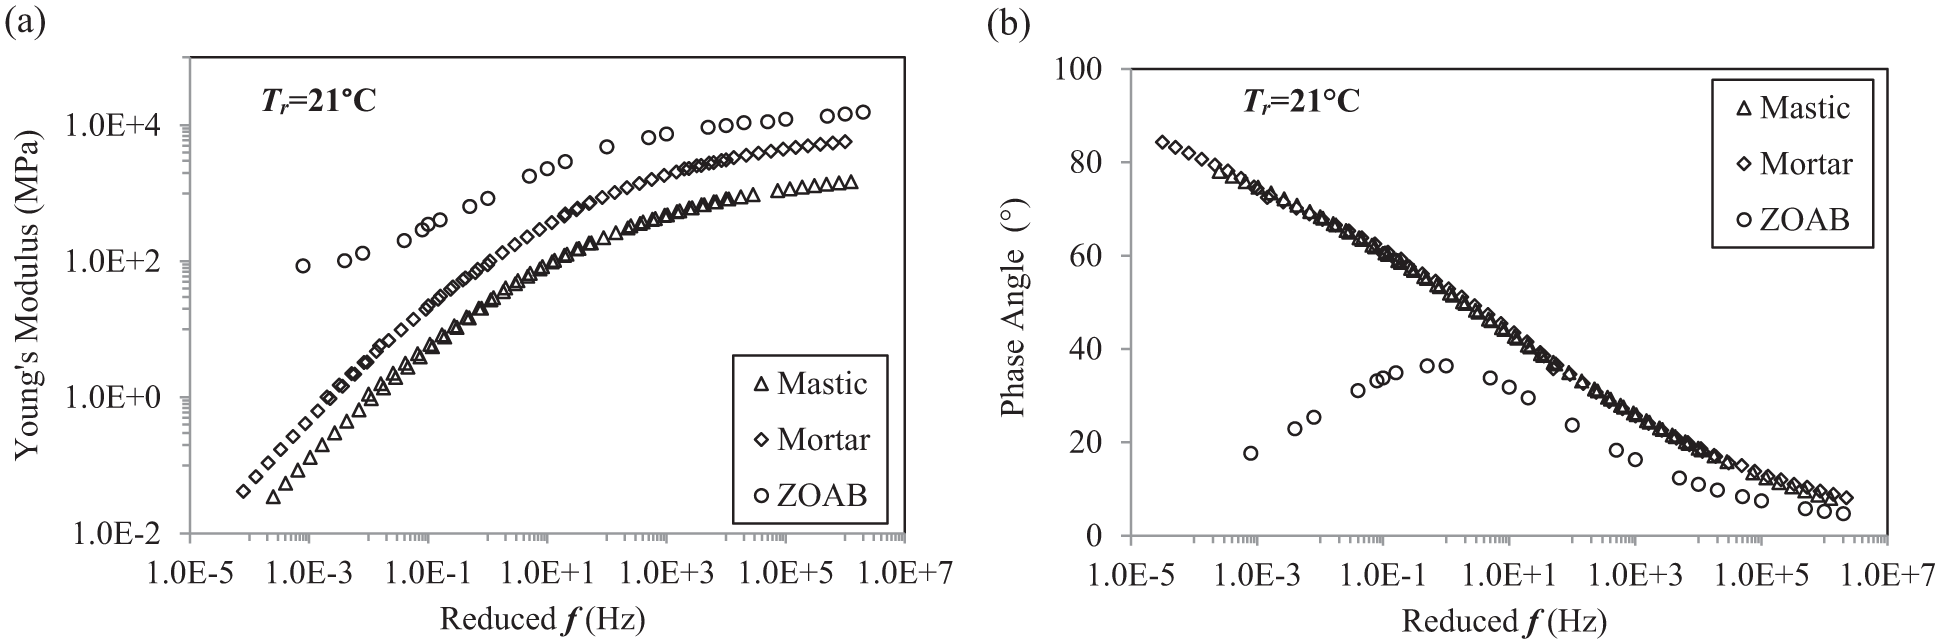
Experimental results of mastic, mortar, and ZOAB for (a) Young’s modulus, and (b) phase angle.
Figure 2b shows the master curves of phase angles of mastic (δmas), mortar (δmor), and ZOAB (δmix). The values of δmas and δmor were obtained directly from DSR tests and the calculation of δmix was carried out in accordance with AASHTO T 342-11 standard ( 27 ).
As shown in Figure 2a and b , it can be observed that the shapes of mastic and mortar curves are similar for both |E*| and δ. This can be interpreted by the fact that there is no solid body (aggregates, sand, etc.) packing in mortar, thus the behavior of mortar is mainly dominated by the mastic phase.
From these figures, it can also be seen that ZOAB shows a similar asymptotic behavior as that of mastic at higher frequencies (>105 Hz) both for |E*|mix and δmix. However, with the decrease in frequencies, both the curves start to differ significantly. While |E*|mas and δmas keep following the same trend with decreasing frequencies, |E*|mix reaches a lower bound of the asymptotic value at around 1 Hz and δmix reaches a peak value before declining again.
Above observations can be hypothesized to the fact that at higher frequencies the effect of aggregate interactions is less pronounced and the behavior of ZOAB is governed by the behavior of mastic. This results in the similar nature for both mix- and mastic- curves. At lower frequencies, mastic keeps on deforming under the applied load, while the interlocked aggregate network of ZOAB limits the deformation beyond a critical frequency (1 Hz in this case). These noticeable differences between the mastic scale and the mix scale are important in assessing the performance of micromechanical models which will be discussed later in the paper.
Upscaling by Various Micromechanical Models
Upscaling from the mastic scale to the mortar scale to the mix scale was implemented in this research work. As an intermediate check to judge the performance of micromechanical models, the obtained results of mortar (by upscaling mastic to mortar) were compared against the experimental data, which will be discussed in the following subsection.
Upscaling Results of the Mortar Scale
On the basis of the volume fractions and mechanical properties of mastic and sand (see Tables 1 and 3), different micromechanical models were utilized to predict |E*|mor and δmor. Figure 3a and b show the comparison of the predicted |E*|mor and δmor against the experimental data (labeled as “Test”) respectively. With the exception of the SC model, in general, the predicted results are in good agreement with the experimental results.
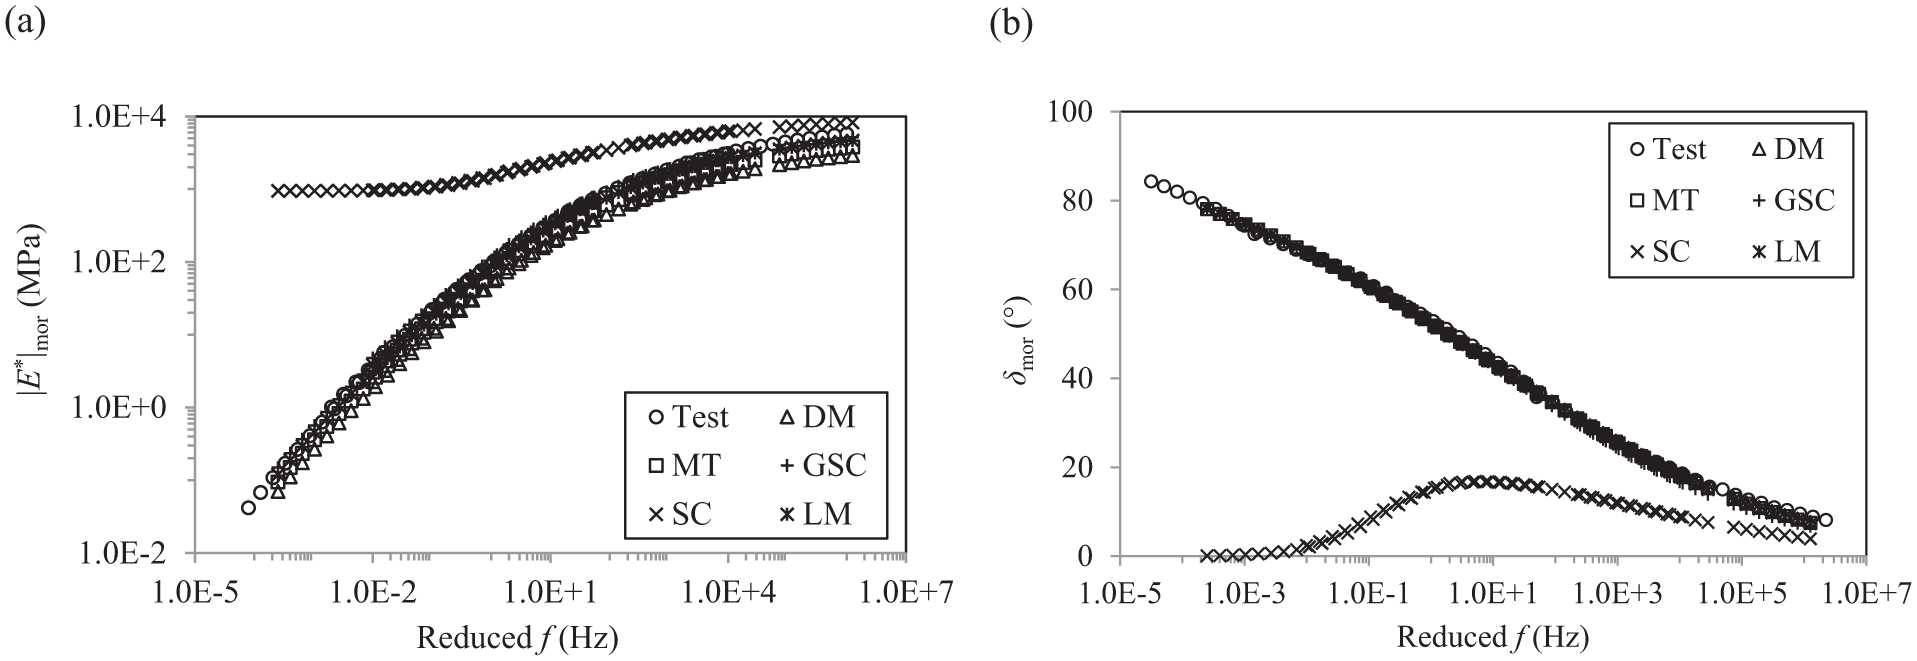
Predicted results of mortar properties: (a) dynamic Young’s modulus, and (b) phase angle.
Upscaling Results of the Mix Scale
Comparisons between the predicted results of |E*|mix and δmix with the experimental data (labeled as “Test”) are shown in Figure 4. In these figures, “GSC 1” represents the case in which aggregates are added in the first step and “GSC 2” represents the case in which air voids are added in the first step, as described in earlier section.
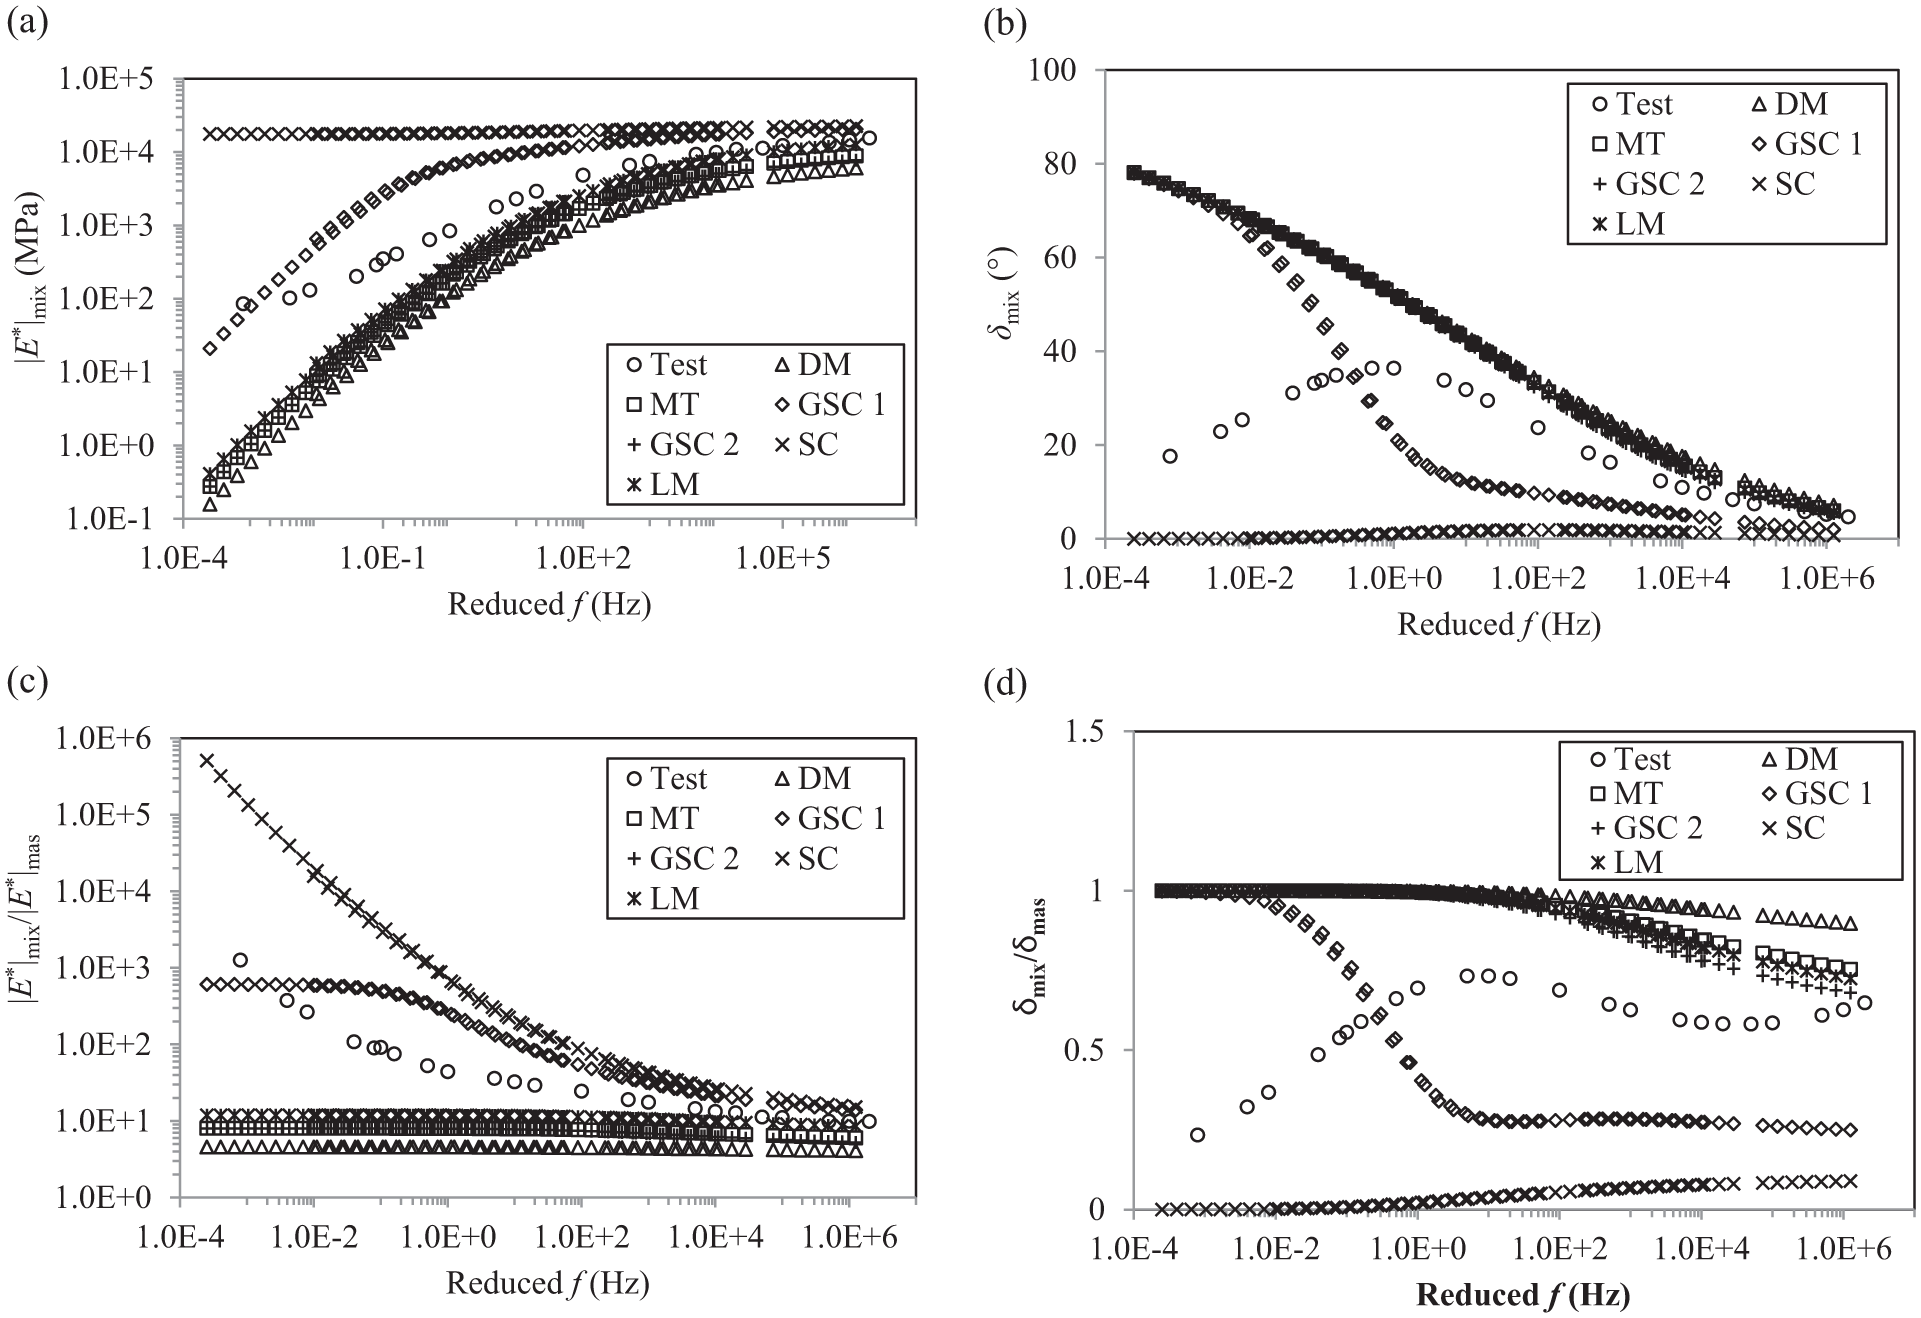
Predicted results of ZOAB properties: (a) dynamic Young’s modulus, (b) phase angle, (c) ratio of the dynamic modulus of ZOAB to mastic, and (d) ratio of the phase angle of ZOAB to mastic.
As shown in Figure 4a and b , with the exception of the SC model and the “GSC 1” model, all models underestimate |E*|mix and overestimate δmix. Corresponding figures also show that the Dilute model (“DM”) results in the lowest values of |E*|mix while the SC model predicts the highest. It can also be observed that the Lielens’ model (“LM”) performs better particularly at high frequencies and produces |E*|mix and δmix values closer to the experimental data. Figure 4c and d show a comparison of the predicted |E*|mix/|E*|mas and δmix/δmas against the experimental data. These plots show that generally the values of predicted |E*|mix/|E*|mas and δmix/δmas almost remain constant in the whole frequency range, whereas the experimental results of |E*|mix/|E*|mas increase and the values of δmix/δmas decrease with the decrease of frequency. Overall, it can be concluded that none of the models can predict acceptable results of ZOAB properties at lower frequencies.
The above observations indicate that better performances of micromechanical models can be obtained in mortar- against mix- scale. It can be associated with the fact that these models were primarily developed to account for the stiffening effect caused by the embedded inclusions in a mix with minimal particle interactions. In other words, these models tend to be applicable for dispersed suspensions, the behavior of which is dominated by the matrix phase. Since mortar is expected to be a dispersed suspension while for ZOAB, particularly at lower frequencies, a dispersed suspension is not expected because of the packing aggregates, the predicted results by these models are acceptable for mortar but for ZOAB they are inaccurate.
In order to address the above issue, researchers ( 24 , 32 ) have proposed that micromechanical models based upon the DS can provide better predictions of mechanical properties of asphalt mixes, which is expected to avoid the interactions between aggregate particles. In the following section, the applicability of this scheme will be judged in the context of ZOAB mixes.
Predicted Results based on the Differential Scheme
The predicted results of |E*|mix and δmix on the basis of the DS approach are shown in Figure 5a–f. In order to understand the difference between the DS approach and the non-DS approach, the plots from the non-DS approach (Figure 4) are plotted against predictions by the DS approach in the same figures. It can be observed that with the exception of the “GSC 2” model, the performance of all the models improves significantly especially at higher frequencies. However, it is also observed that the DS approach does not change the shape of the curve but more or less has a scaling effect. At lower frequencies, even the DS approach fails to predict |E*|mix and δmix accurately. The failure of the DS can be attributed to the fact that it does not change the fundamental theory of the micromechanical models.
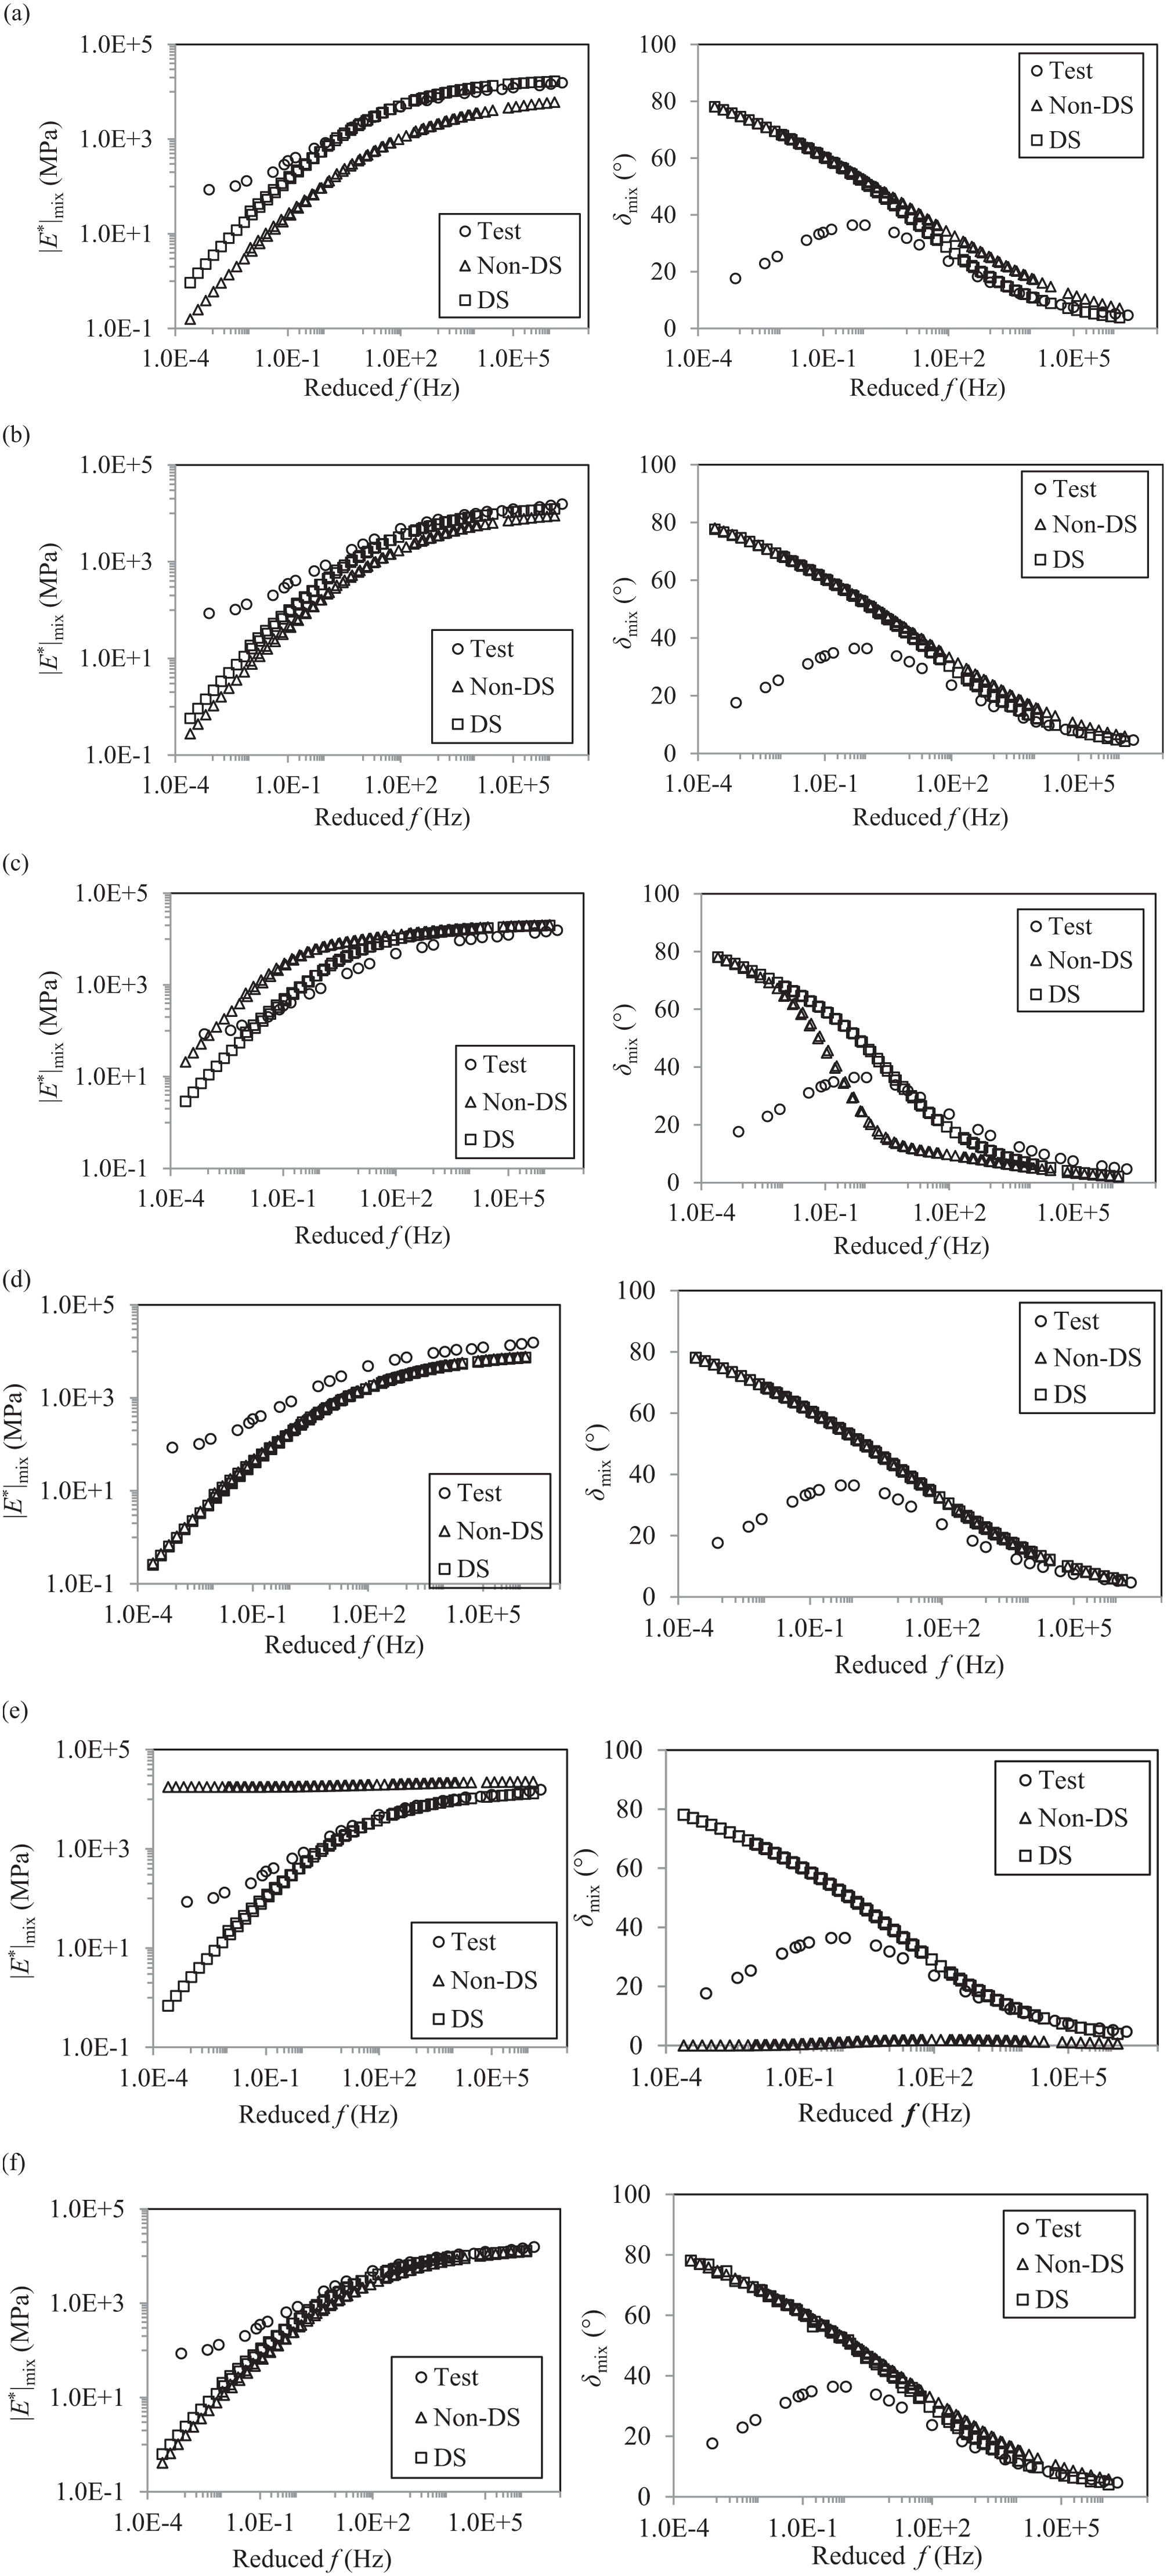
Effect of the differential scheme on the performance of micromechanical models: (a) Dilute, (b) MT, (c) GSC 1, (d) GSC 2, (e) SC, and (f) Lielens’.
In general, it can be concluded that there is a need for more robust models/methodologies which take into account the aggregate interactions in a better way.
Conclusion
ZOAB is a commonly used mix on the major road network of the Netherlands. Despite several advantages of ZOAB over dense asphalt mixtures, the mix is known to suffer from raveling distress during its design life. One way to study the raveling propensity of a given mix is by utilizing micromechanics-based models. Although many research attempts have been made to study such models for various mixes, not much attention has been paid to study the suitability of such models for ZOAB-type mixes. Therefore, this paper examined and presented the performance of various commonly utilized micromechanical models in estimating the mechanical properties of ZOAB. The following general conclusions can be made:
None of the applied micromechanical models could adequately predict the mechanical properties of ZOAB, particularly at low frequencies. This can be related to the fact that these models are applicable for a dispersed suspension with minimal particle interactions.
At lower frequencies, the performance of the models did not improve after the introduction of the differential scheme, whereas, the predicted results were better at higher frequencies. This can be attributed to the fact that this scheme does not change the fundamental theory of the micromechanical models.
In order to improve the performance of micromechanical models for ZOAB mixes, factors which reflect the effect of the packing aggregates more adequately should be introduced.
Recommendation for Future Research
Since all the micromechanical models that were considered in this study failed to predict the mechanical properties of ZOAB mixes, there is a need for more robust models/methodology which take into account the interactions between the packing aggregates in a better way.
Footnotes
Author Contributions
The authors confirm contribution to the paper as follows: study conception and design: Athanasios Scarpas, Kumar Anupam, Hong Zhang; data collection: Hong Zhang; analysis and interpretation of results: Hong Zhang, Kumar Anupam, Athanasios Scarpas, Cor Kasbergen; draft manuscript preparation: Kumar Anupam, Hong Zhang. All authors reviewed and the results and approved the final version of the manuscript.
The Standing Committee on Structural Requirements of Asphalt Mixtures (AFK50) peer-reviewed this paper (18-03275).