
Abstract
Within the pavement engineering community, open graded mixes (OGM) are regarded as mixes capable of reducing noise and improving wet skid resistance. However, during their design life, these asphalt mixes are known to suffer from a particular distress type known as raveling. This results in a premature failure of a road network. In order to study the propensity of OGM to raveling, homogenization-based approaches are considered to be accessible and effective. One of the most widely accepted homogenization models for asphalt concrete is proposed by Christensen et al. Several studies related to homogenization techniques have been conducted in the past; however, to the best of the authors’ knowledge not a lot of attention has been paid to the study of OGM by means of homogenization models. The other limitation of the Christensen model is that some parameters are difficult to physically understand. Under the above realization, the objective of the paper is twofold: (1) to propose a modification of the Christensen model for OGM; and (2) to verify the modified model’s capability in predicting the mechanical properties of OGM. In general, it was found that once the proposed factor is calibrated for a given OGM by laboratory tests the obtained results are accurate.
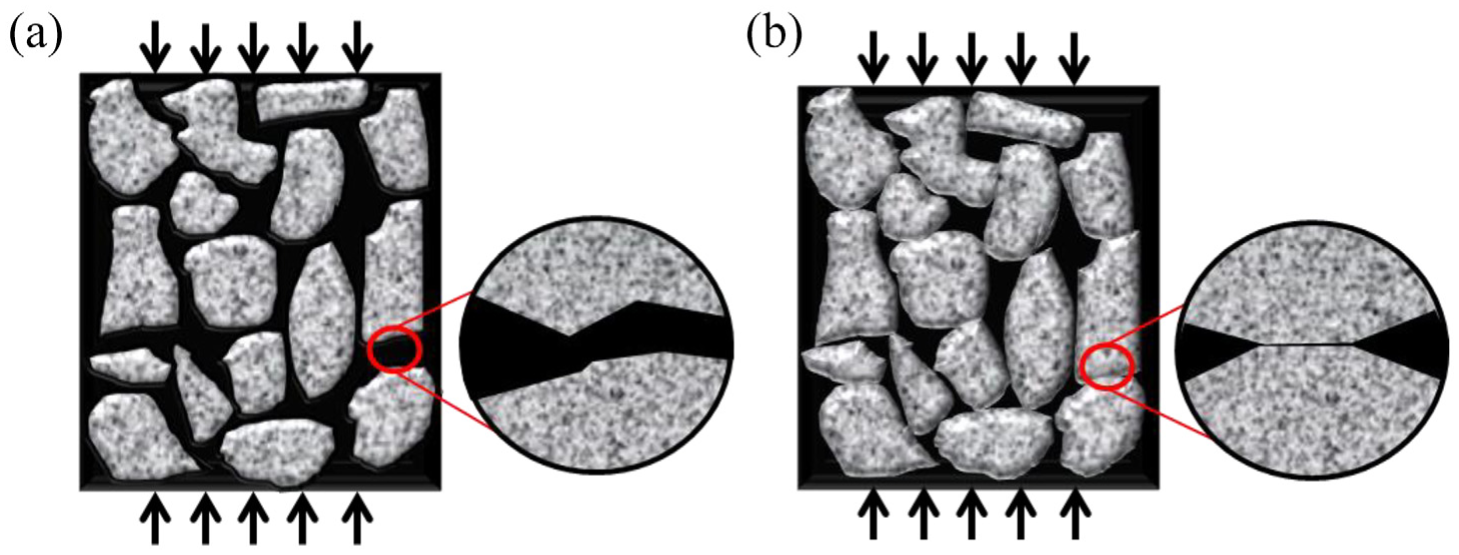
Open graded mixes (OGM) are increasingly used because of their effectiveness in reducing noise caused by tire–pavement interaction and improving skid resistance, especially during wet seasons ( 1 ). However, because of the high air voids characteristic, OGM always suffer from a particular distress known as raveling, which occurs as individual aggregate particles dislodge from the pavement surface ( 2 ). Normally, there are two types of damage modes for raveling distress: cohesive damage and adhesive damage (Figure 1) ( 2 ). Cohesive damage is the failure of mastic properties, whereas adhesive damage is the loss of bond between aggregate particles and mastic.
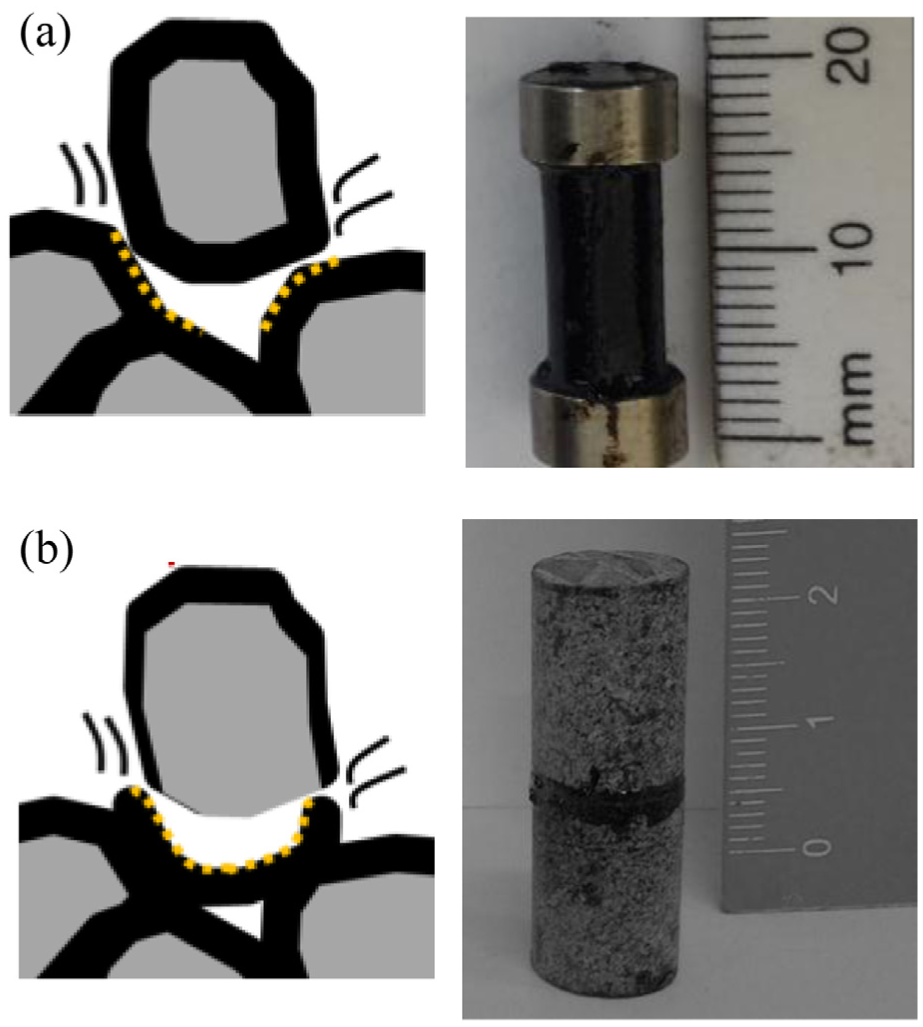
Two types of damage modes of raveling distress. (a) Cohesive damage; (b) Adhesive damage.
The methods proposed by researchers ( 3 ) at the Delft University of Technology to evaluate the characteristics of cohesive damage and adhesive damage in the laboratory are shown in Figure 1). A mastic column, the size of which is 6 mm in diameter and 12 mm in height, and a stone column, which consists of two stone columns and a mastic sample (8 mm in diameter and 2 mm in thickness) between them, are used to perform dynamic shear stress or strain to obtain fatigue life curves for analyzing cohesive damage and adhesive damage, respectively.
Although the characteristics of cohesive damage and adhesive damage can be evaluated by laboratory tests, the occurrences of these two damage modes in the field are affected by various factors, such as repetition of loads, moisture, temperature, and so forth ( 4 ). Therefore, it is a big challenge to analyze the propensity of these two phenomena during the service life of OGM pavement.
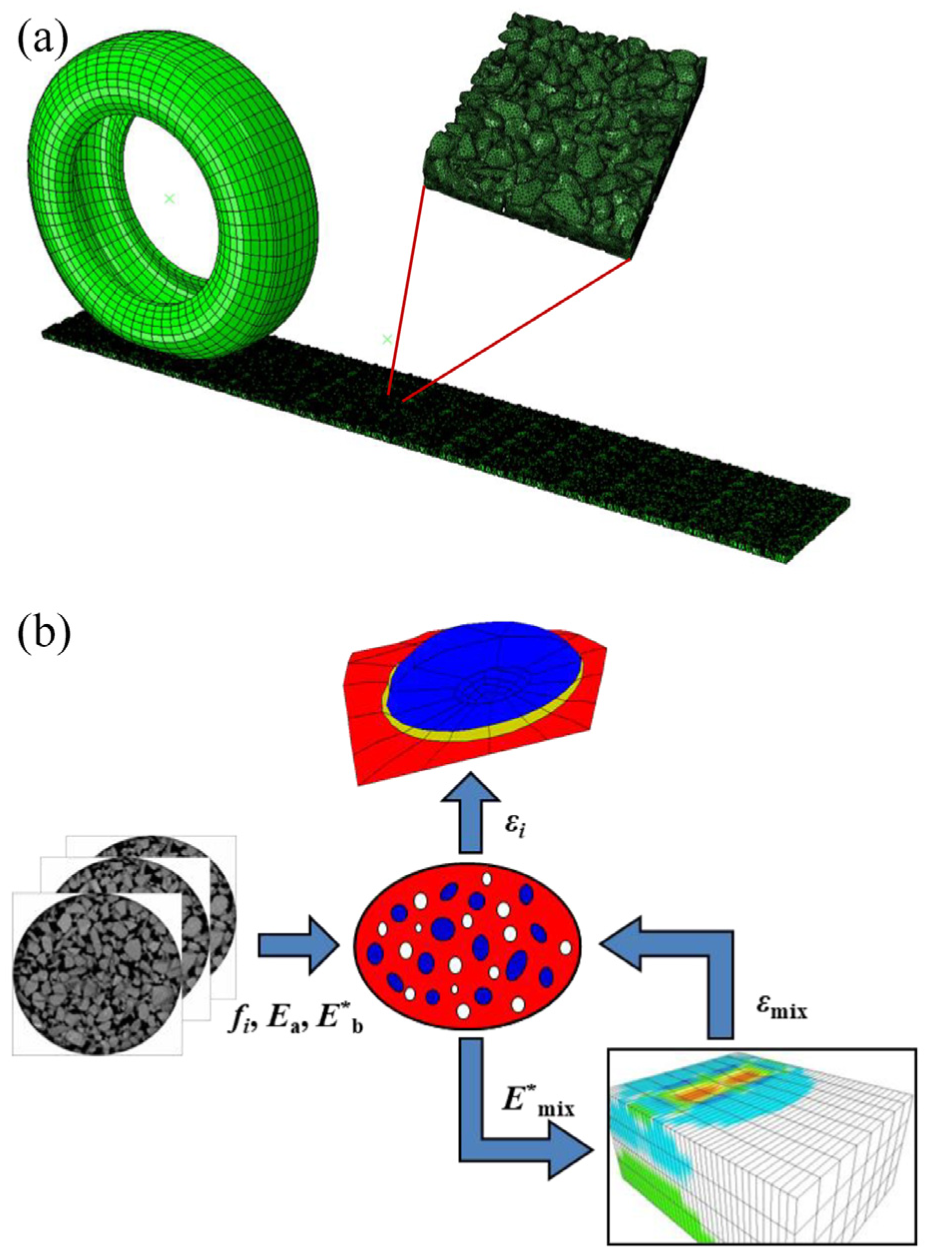
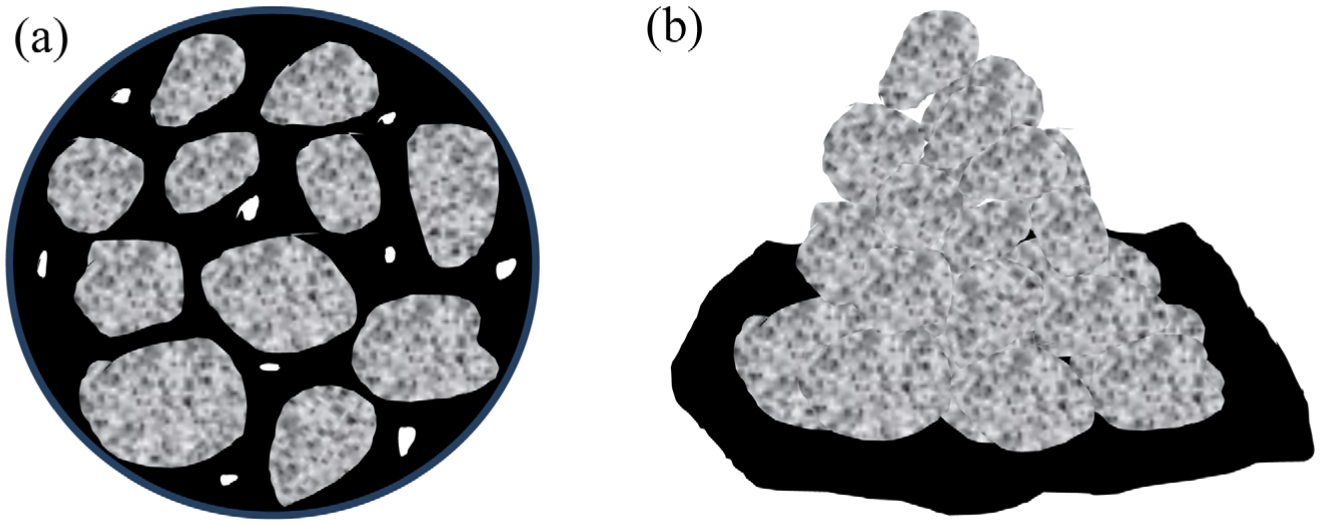
In the recent past, computational models based on finite element methods (FEM) and/or discrete element methods (DEM) have been proposed as a mean to obtain the stresses and/or strains at mix component level of OGM, which are further used to analyze the raveling damage ( 5 , 6 ). Although FEM/DEM-based models are able to handle complex compositions and almost realistic mix component material properties, they require the development of very large FEM meshes (usually by means of post-processing of the results of CT scans) and very large-scale computational facilities. For example, for a specimen of 60 mm in height and 150 mm in diameter, about 6.8 million elements are needed to carry out a reliable analysis and a running time of several days (Figure 2a) ( 6 ). Computational tools and facilities of such scale are not typically available in engineering practice.
Different approaches for OGM analysis. (a) FEM approach; (b) Homogenization approach.
Homogenization methods ( 7 ) offer an attractive alternative to the above issues (Figure 2b). By means of a homogenization technique, the effective micromechanical properties of the composite are determined from the properties of its different phases, which further allows the calculation of the stress/strain field of the different phases based on the applied loading conditions. This information, in combination with the laboratory tests mentioned above for evaluating the characteristics of cohesive damage and adhesive damage, can be utilized to investigate the propensity of a given OGM for raveling.
On the basis of the homogenization theory, many models have been developed for estimating the mechanical properties of asphalt mixes ( 8 ). Among these models, the Hirsch model is one of the most commonly used semi-empirical models because of its similarity and requirement of few constituent properties ( 8 ). It was originally developed by Hirsch ( 9 ) to investigate the modulus of concrete as determined by the moduli of cement and aggregate particles. In the Hirsch model, different phases are assumed to be in a combination of parallel and series arrangements. The modulus of the composite is controlled by the volume fractions and the moduli of all its phases. Further, Christensen et al. ( 10 ) modified the original Hirsch model to make it applicable for asphalt concrete, and the Christensen model has been independently evaluated by several researchers ( 11 , 12 ) with generally good results.
From the above analysis, it can be concluded that in comparison with the FEM and DEM methods, the homogenization approach is a more accessible and effective way for obtaining the mechanical properties of OGM. It can also be summarized that the Hirsch model, which relates the properties of each phase to the overall properties of mixes, is a simple but effective homogenization model. Based on this realization, the objective and research scopes will be proposed in the following section.
Objective and Research Scopes
The objective of this paper is to outline the homogenization methodology for estimating the mechanical properties of OGM via the Hirsh model.
The scopes of the proposed study include:
To modify the expression of the Christensen model and propose an aggregates organization factor to describe the frequency/temperature-dependent contribution of the aggregate phase to the overall behavior of OGM.
To determine and validate the expression for the aggregates organization factor from laboratory tests of OGM.
To analyze the contribution made by each phase to the modulus of OGM based on the modified expression of the Christensen model.
Background Knowledge
Application of the Hirsch Model on Asphalt Mixes
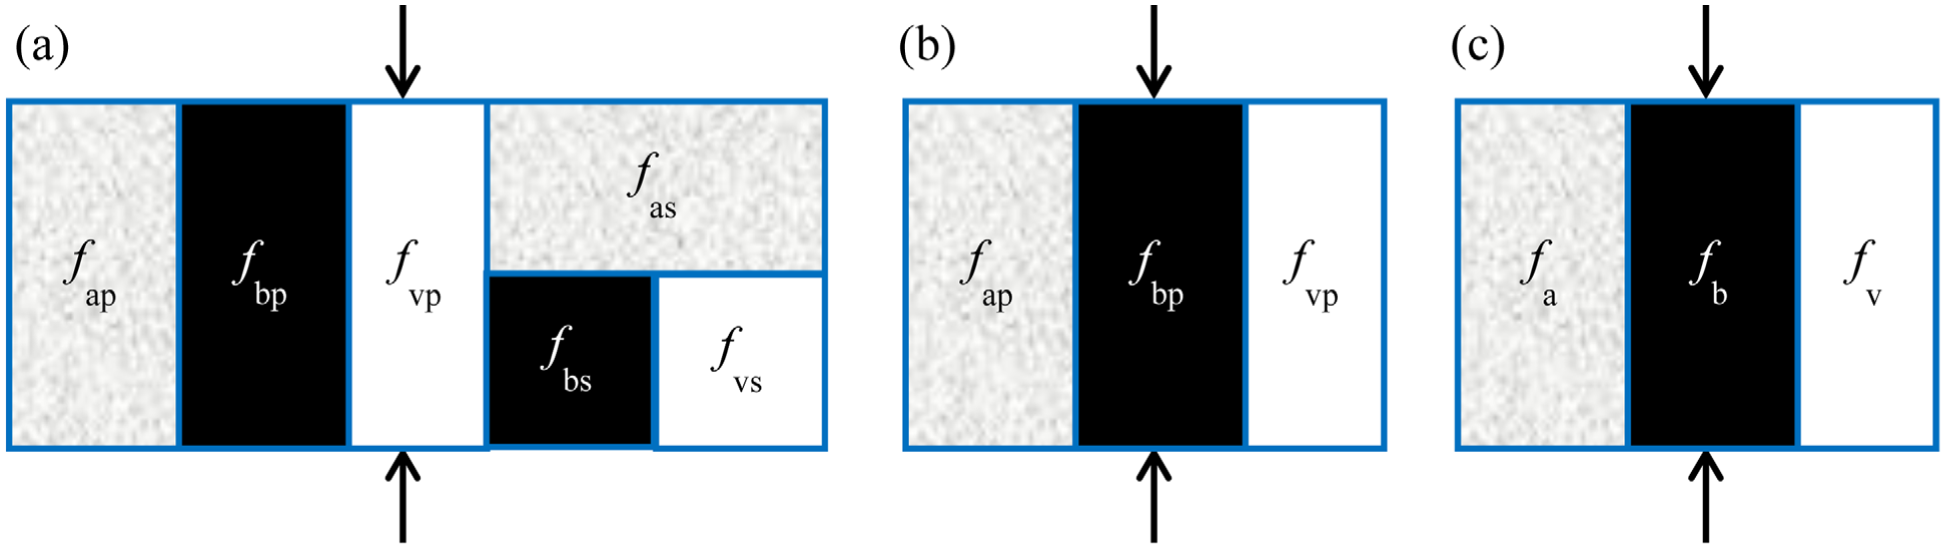
On the basis of the research needs described earlier, descriptions about some of the aspects related to the Hirsch model will be presented in this section. In the early research of Christensen et al. ( 10 ), various phase arrangements were proposed to modify the original Hirsch model to make it applicable for asphalt mixes. After thorough investigation of several proposed versions of the modified Hirsh model, the researchers came to a conclusion that the version in which the parallel and series sub-units composed of asphalt binder, aggregates, and air voids are arranged in parallel provided the most accurate predicted results of the modulus of asphalt concrete (Figure 3a).
In this version, the dynamic Young’s modulus of an asphalt mix |E*|mix is obtained from the volume fractions and moduli of asphalt binder, aggregates and air voids, Equation 1.
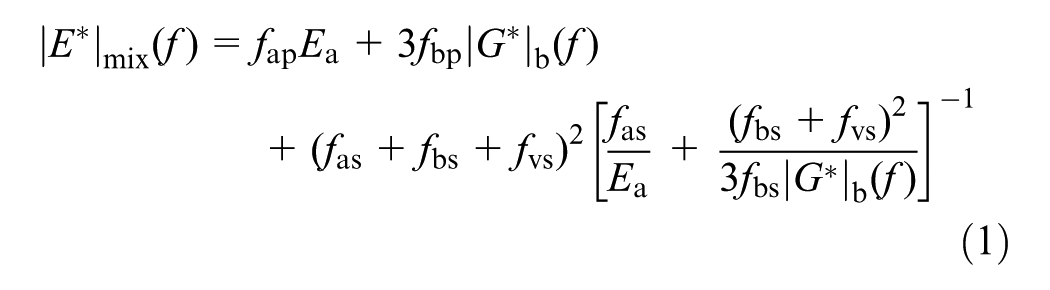
where the subscripts p and s represent the parallel portion and the series portion, respectively; fa and Ea are the volume fraction and Young’s modulus of the aggregate phase, respectively; fb and |G*|b are the volume fraction and the dynamic shear modulus of the asphalt binder phase, respectively; and fv is the volume fraction of the air voids phase.
However, it was observed that the effects of the series sub-unit on the estimated modulus of an asphalt mix are much less significant than the effects of the parallel sub-unit ( 13 ), which indicates that the characteristics of an asphalt mix are similar to a parallel arrangement of individual phases. Under this realization, the authors ( 13 ) further simplified the original Christensen model to a simple parallel arrangement, as shown in Figure 3b, Equation 2.

where fap, fbp, Ea and |G*|b are described in Equation 1.
Equation 2 has two unknown parameters fap, fbp, which makes it difficult to be determined by using laboratory/field tests. Researchers ( 10 ) have proposed further simplification to solve this issue by introducing factors such as contact factor Pc.
Contact Factor Pc
Pc is the share of the parallel component of the total volume of the composite and therefore varies between 0 and 1. As can be seen from Equation 2, if the parallel part occupies the same proportion in each phase, Equation 2 can be further reduced to the following equation, Equation 3.

where fa, fb, Ea and |G*|b are described in Equation 1. However, it is highlighted here that the underlying assumption is that the value of Pc does not change with different phases but remains the same for all the phases of the composite.
It is obvious that Pc is one of the critical parameters in the calculation of |E*|mix. As the behavior of asphalt concrete depends on frequency/temperature, the relative proportions of the series part and parallel part are also frequency/temperature dependent. As proposed by the researchers ( 10 ), the values of Pc can be determined from the laboratory tests. The researchers concluded that the proposed factor Pc is frequency/temperature sensitive, as expected.
In line with the above research work, researchers ( 10 , 13 ) showed that in general a good agreement exists between the predicted results of the Christensen model and the laboratory tests. However, to the best of the authors’ knowledge, it can be stated that the physical representation of Pc is difficult. In their pioneering studies, researchers ( 10 ) hypothesized that Pc represents the aggregate contact factor and interpreted it as the contribution from the portion of aggregate particles in intimate contact with each other. They also noted that high values of Pc at high frequencies/low temperatures indicate more contact among aggregate particles. However, this interpretation does not comply with the physical situation where fewer aggregate particles are expected to be in intimate contact at high frequencies/low temperatures (Figure 4a). This behavior is expected because of the existence of stiff asphalt binder at high frequencies/low temperatures. Similarly, at low frequencies/high temperatures when the modulus of asphalt binder is soft, it is expected that the aggregate would find it easier to move, which will result in more pronounced contact (Figure 4b).
Aggregate contacts at different frequencies/temperatures. (a) High frequency/low temperature; (b) Low frequency/high temperature.
Based on the above analysis, it can be concluded that the interpretation of Pc does not consider the aggregate contact interaction aptly. Thus, in the following section, a modified expression for the Christensen model will be proposed.
Modified Expression of the Christensen Model
As mentioned above, the effects of the series element in the Christensen model on the estimated modulus of asphalt concrete are negligible as compared with the effects of the parallel element. Therefore, in the revised arrangement, it is proposed that the total volume of asphalt binder, aggregates, and air voids are arranged in parallel (Figure 3c). This arrangement is the same as the arrangement proposed by the original researchers ( 13 ) except that in the revised arrangement the part of the volume is replaced by the total volume. The relationship between |E*|mix and the properties of individual phases is shown in Equation 4.

where fa, fb, Ea and |G*|b are described in Equation 1.
The authors proposed to modify Equation 4 by introducing a factor Pa, which describes the contribution to |E*|mix from the arrangement of aggregate particles at different frequency/temperature conditions, Equation 5. A detailed description about Pa will be presented in the following subsection.

where fa, fb, Ea and |G*|b are described in Equation 1.
Aggregates Organization Factor, Pa
An asphalt mix has a higher value of fa than fb. Moreover, the value of Ea is also much higher than |G*|b. Therefore, the contributions made by the aggregate phase to the modulus of the asphalt mix are expected to be higher than other phases. If a non-frequency/temperature-dependent factor was introduced for evaluating the contribution from the aggregate phase to the overall response of the mix, |E*|mix would also be primarily frequency/temperature independent. This can be clearly deduced from Equation 5, where the aggregate phase contribution (PafaEa) becomes temperature/frequency independent as a result of the temperature/frequency-independent Pa.
In order to physically understand the concept of Pa, if hypothetically two extreme conditions of low temperatures (or high frequencies) and high temperatures (or low frequencies) are considered, then in the case of low temperatures the asphalt binder would be stiff and it would be able to bond the particles together well (Figure 5a), whereas, at high temperatures, the binder would be too soft to bind the particles (Figure 5b). In the former case, the whole structure will act together in the load-bearing capacity; on the contrary, in the latter case, the asphalt binder will not take part in the load-bearing capacity and the mix would slowly collapse.
Organization of aggregates at different frequencies/temperatures. (a) High frequency/low temperature; (b) Low frequency/high temperature
From the above discussions, it can be stated that the introduction of the factor, Pa, is logical and meaningful. It is also expected to capture the frequency/temperature-dependent contribution of the aggregate phase in predicting |E*|mix. Pa, which is termed the “aggregates organization factor,” has been determined and validated by the laboratory tests in this study. The description of the sample preparation, laboratory tests, test results and analysis will be presented in the later sections.
Material Properties
Two OGM specimens and one dense asphalt concrete (DAC) specimen, denoted as “OGM-1,”“OGM-2,” and “DAC”, were prepared. Specimen OGM-1 was utilized for carrying out necessary tests to calibrate the values of Pa, whereas specimens OGM-2 and DAC were used for the subsequent validation of the proposed model. The properties of different used materials are shown in Table 1.
Properties of Materials
These specimens with a height of 150 mm and a diameter of 100 mm were prepared by using a gyratory compactor in accordance with the AASHTO T 342-11 standard method ( 14 ). The laboratory test methods to measure the mechanical properties of these specimens will be introduced in the next section.
Laboratory Tests
Dynamic Shear Rheology Test
The values of |G*|b was measured by using the parallel plate configuration of dynamic shear rheology equipment. Frequency sweep tests were conducted in a frequency range of 50–0.1 Hz, at four different temperatures, –10°C, 4°C, 21°C and 37°C. Two geometrically different asphalt binder specimens 8 mm and 25 mm in diameter, and 2 mm and 1 mm in height, were used.
Uniaxial Compression Test
The values of |E*|mix were measured under cyclic sinusoidal uniaxial compression load by universal testing machine (UTM) at different frequencies and temperatures. In accordance with the AASHTO T 342-11 standard method ( 14 ), four temperatures, –10°C, 4°C, 21°C and 37°C, were applied during the test and for each temperature, six different frequencies, which were 20 Hz, 10 Hz, 5 Hz, 1 Hz, 0.5 Hz, and 0.1 Hz, were performed. The load applied on the specimens was under stress-controlled mode and three linear variable differential transformer sensors were installed to measure their displacements.
Results and Discussion
According to the time–temperature superposition principle, the measured results of |G*|b and the phase angle δb of asphalt binder at different temperatures were shifted to obtain master curves over a large range of frequencies at a reference temperature (Tr) of 21°C (Figure 6a). The plots tend to follow the power law curve in the test frequency range, which is consistent with the results from other research ( 15 ).
Laboratory test results of asphalt binder and OGM-1. (a) Master curve of |G*|b and δb; (b) Master curve of |E*|mix and δmix.
From the UTM tests, the master curves of |E*|mix and phase angle δmix of OGM-1 specimen were obtained at the same reference temperature (Figure 6b). It can be observed that the value of |E*|mix decreases from high frequencies to low frequencies. The plot of |E*|mix reaches a stable plateau at high/low frequencies beyond which there is only a slight change in the value of |E*|mix. This trend further solidifies the hypothesis made regarding Pa in the earlier section that weaker bond characteristics among aggregate particles are expected with decreasing frequencies.
The value of δmix reaches a peak and starts to further decline as a result of the decrease in frequency. This indicates that the mix behaves elastically both at higher and lower frequencies. This behavior can also be explained in terms of Pa where at low temperatures the binder itself starts to behave elastically thus the overall mix response is elastic; on the other hand, at high temperatures Pa is too low to contribute in the load-bearing capacity of the mix, and that is why the bulk of loading is taken over by the aggregates themselves, which are elastic in nature. A laboratory-based approach to determine Pa will be presented in the following paragraphs.
Determination of Pa from Laboratory Tests
Equation 5 can be rearranged in the form of the following equation, Equation 6:
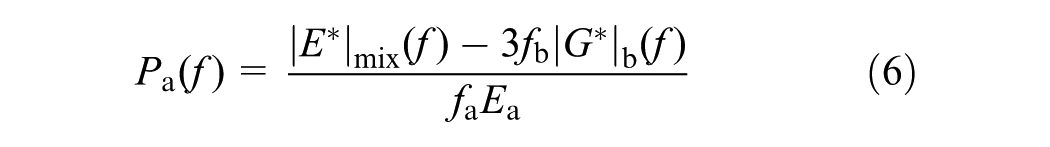
Where fa, fb, Ea and |G*|b are described in Equation 1; the values of fa and fb can be found in Table 1 and the value of Ea is assumed as 53000 MPa.
The values of Pa can be calculated with the mix properties and Equation 6. A typical curve as obtained for specimen OGM-1 is shown in Figure 7. The shape of the plot shows that Pa is indeed a frequency-dependent factor as discussed before. It can also be observed that Pa increases with the increase in frequency and more or less follows a sigmoidal curve for the tested specimen. This in terms of physical meaning implies that the contribution made by the aggregate phase to the modulus of OGM increases with the frequencies.
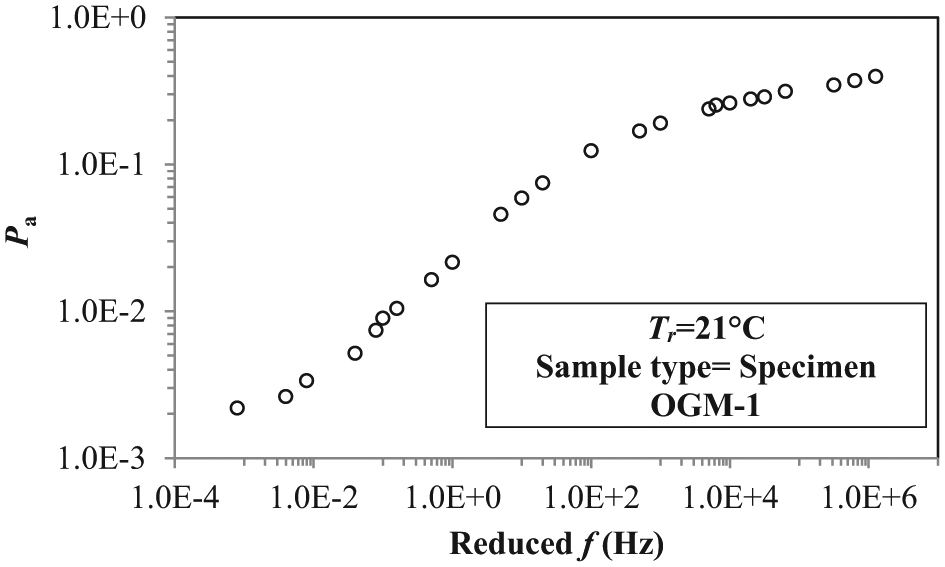
Calculation results of Pa.
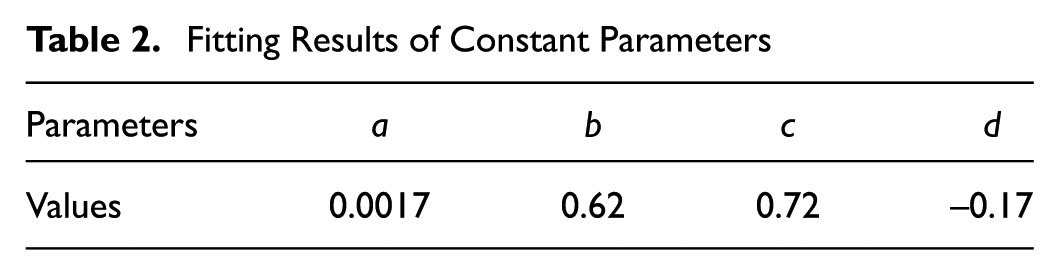
By assuming Pa to follow a sigmoidal curve, Equation 7 can be deduced. It is noted here that Equation 7 is similar in nature to the Pc function as described elsewhere ( 10 ). After fitting the test results in Equation 7, constant parameters of the equation can be obtained, as shown in Table 2.
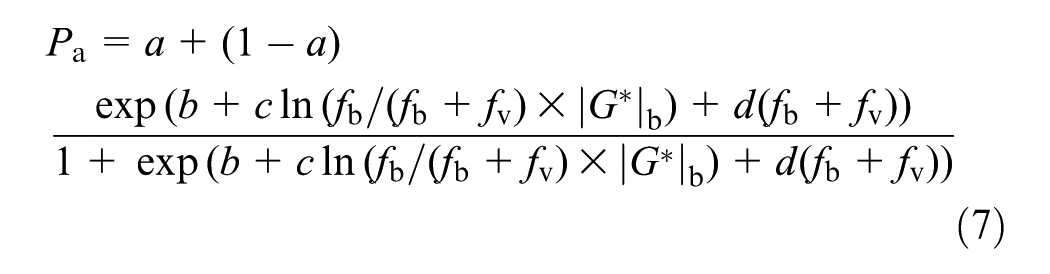
where fa, fb, fv and |G*|b are described in Equation 1.
Fitting Results of Constant Parameters
It is important that the proposed model is validated. In order to judge the suitability of Pa, a two-step validation approach was adopted. In the first step the overall response of the specimen OGM-1 was compared against the predicted results, and in the second step, predictions were made for the specimen OGM-2 and the specimen DAC on the basis of parameters obtained in Table 2.
Validation of the Modified Expression of the Christensen Model
Figure 8, a–c, shows the predicted results of |E*|mix for specimen OGM-1, specimen OGM-2 and specimen DAC, respectively. It can be observed that the predicted results of |E*|mix for specimen OGM-1 are in a good agreement with the laboratory tests, which provides a good check for the calibration procedure.
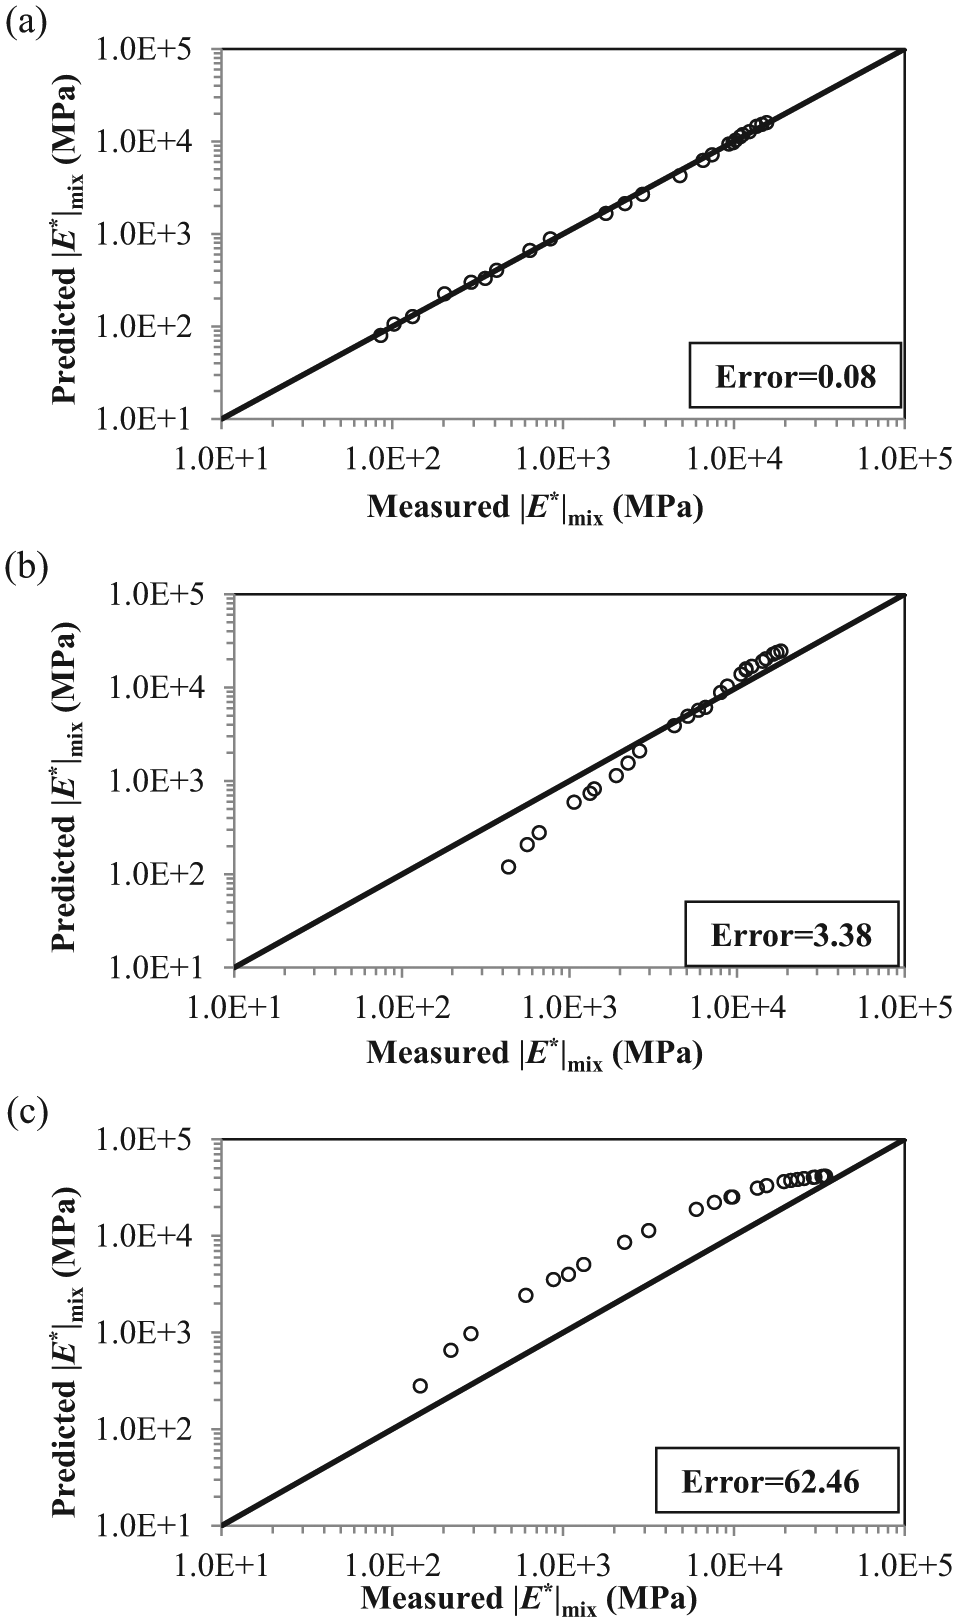
Comparison between predicted results of |E*|mix to the laboratory tests. (a) Specimen OGM-1; (b) Specimen OGM-2; (c) Specimen DAC.
The predicted results of |E*|mix for specimen OGM-2 on the basis of parameters obtained from specimen OGM-1 fit with reasonable accuracy. These differences were already expected because the parameters used for both OGM specimens in Equation 7, although with different properties (see Table 1), are the same. Despite these differences, the predicted and the test results for practical purposes match quite well for OGM.
A deliberate comparison between two altogether different types of mixes was further made to judge the suitability of the proposed model. As one would expect, it is clear that the differences between these two results are substantial (Figure 8c).
Overall, it can be concluded that if the parameters are obtained for one type of mix, the prediction could be made with fair accuracy, and if the type of mix is completely changed then new parameters would need to be calibrated.
Contributions of Each Phase in the |E*|mix Prediction
According to Equation 5, the contribution of the aggregate phase to the total mix modulus is obtained by PafaEa, whereas the contribution of the asphalt binder phase could be obtained by 3fb|G*|b. Figure 9, a and b , shows the plots of the relative contribution of each phase in the overall response of the OGM specimens. It can be seen that both phases are frequency dependent as explained earlier.
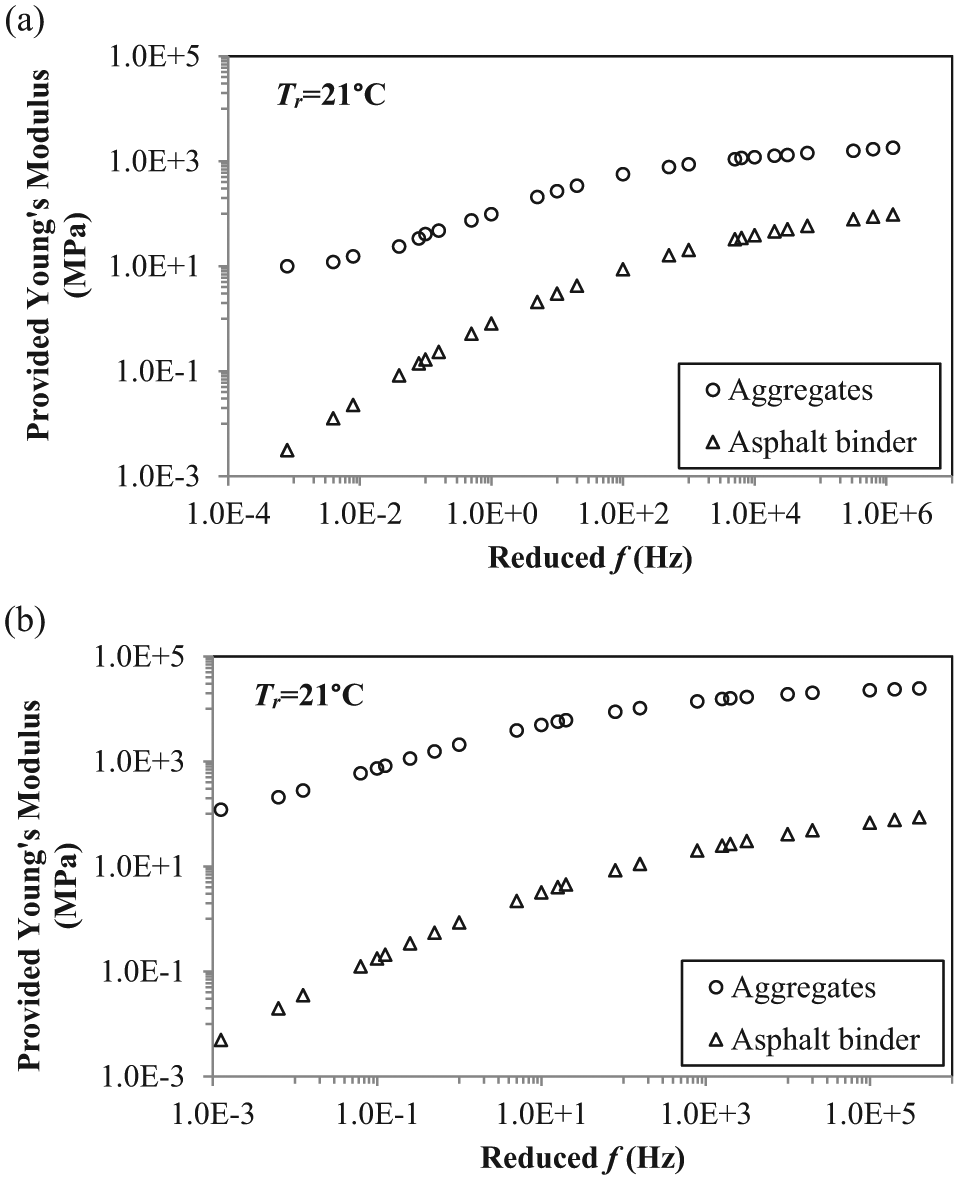
Modulus provided by aggregates and asphalt binder in OGM. (a) Specimen OGM-1; (b) Specimen OGM-2.
As expected it is found that the aggregate phase makes a more significant contribution to the modulus of OGM. It can be further deduced that in OGM the aggregate phase provides the load-bearing capacity while the role of the asphalt binder phase is to bind the aggregate particles together ensuring the structural organization of the composite material.
Conclusions
Homogenization methodology makes the analysis of OGM accessible for determining the propensity of raveling. In order to describe the frequency/temperature-dependent contribution of each phase to the overall response of OGM, the expression of the Christensen model was modified and a temperature/frequency-dependent factor Pa was proposed. A function for calculating Pa was determined and verified against test results. Furthermore, the contributions made by each phase to the modulus of OGM were analyzed. The following conclusions were drawn:
By means of Pa, the effects of the frequency/temperature-dependent contribution of the aggregate phase on the overall mix response can be accounted for, and the modified expression of the Christensen model can produce the shape and values of the frequency/temperature-dependent modulus of asphalt mixes.
The calibrated function for describing Pa can only obtain accurately predicted results of the material which it is calibrated for.
In the whole range of frequencies/temperatures, the contribution made by the aggregate phase to the overall modulus of OGM is much more significant than the contribution of the asphalt binder phase.
Current Research
The basic limitation of the presented work is the need to experimentally determine Pa. In future research, the current work will be extended to enable the prediction of asphalt mix properties exclusively on the basis of the mechanical properties of its constituents.
Footnotes
Author Contributions
The authors confirm contribution to the paper as follows: study conception and design: Athanasios Scarpas, Kumar Anupam, Hong Zhang; data collection: Hong Zhang; analysis and interpretation of results: Hong Zhang, Kumar Anupam, Athanasios Scarpas, Cor Kasbergen; draft manuscript preparation: Kumar Anupam, Hong Zhang. All authors reviewed and the results and approved the final version of the manuscript.
The Standing Committee on Pavement Condition Evaluation (AFD20) peer-reviewed this paper (18-03260).