
Abstract
Demand-responsive transport (DRT) services (collective on-demand services, such as shared ridesourcing and microtransit) offer a collective flexible travel alternative that can potentially complement fixed transit (FT). The combination of an on-demand and line-based service holds the promise of improved mobility and increased service coverage. However, to date, it remains unknown whether DRT services deliver these much anticipated improvements. This study presents an assessment framework to evaluate the performance of DRT and related changes in accessibility, and performs an empirical analysis for a recently introduced DRT service in the Netherlands. The framework includes a performance benchmark between DRT and FT based on the computation of generalized journey times of the DRT rides and the FT alternatives, and can help identify whether DRT is used as a complement or a substitute for FT. The framework covers the spatial and temporal dimensions, and the explicit consideration of rejected trips is an integral part of the evaluation. Results suggest large accessibility improvements for DRT users, especially for some underserved origin–destination pairs.
Reducing car use is high on the agenda for transportation planners, yet the flexibility and convenience that the car provides often makes it a more attractive alternative than traditional fixed transit (FT). To compete with private car use, line-based FT could benefit from embracing new flexible services that have appeared in urban areas so as to improve and complement its services. Specifically, demand-responsive transport (DRT) services (collective on-demand services, such as shared ridesourcing and microtransit) could potentially complement FT in urban areas.
Even though DRT services are not a new innovation (they were recommended for future urban transportation in the sixties [ 1 ]), only recent technological advancements have enabled their real-time large-scale operation. As a result, new urban DRT services have appeared, both in the United States (e.g., Bridj, Lyftline, UberPOOL, Via) and in Europe (such as Abel in Amsterdam, Kutsuplus in Helsinki, Padam in Paris, and Radiobus di Quartiere in Milan). To better understand the utilization of these services and the role they play in relation to FT, a systematic assessment framework is proposed in this study.
Several studies have aimed at helping planners design DRT systems. These studies help estimate the required capacity for a given level of service and the resulting operating costs ( 2 ), or assess whether DRT should substitute FT for a given scenario ( 3 , 4 ). Research has also evaluated via simulation the impact that DRT services would have in real urban networks such as in Hino (Japan) ( 5 ), Lisbon (Portugal) ( 6 ), and New York City (United States) ( 7 ). However, little is known about how these services perform in real settings. A notable exception is Kutsuplus, “apparently the world’s first fully automated, real-time demand-responsive public transport service” ( 8 ), which operated between 2012 and 2015 in Helsinki, and for which a final project report is available. However, despite Kutsuplus being implemented as part of the public transport system, its final report does not include an analysis on the extent to which the new service improved the mobility in comparison to the already existent alternatives.
This study fills this gap by introducing a DRT assessment framework that analyzes the improvement in mobility that a DRT system adds to the transportation network based on empirically observed usage patterns. Current DRT assessment frameworks contemplate the concept of DRT at a high level without including concrete indicators ( 9 ), or focus on key performance indicators (KPIs) that consider DRT in isolation from other modes ( 10 ). In this study, the accessibility gains (i.e., the increased easiness of reaching the required or desired activities [ 11 ]) that DRT granted for the performed trips are examined.
The main objective of this study is to help transportation authorities in assessing the improvement in mobility that DRT users have experienced in relation to the co-existing FT alternatives. After a detailed description of the framework, it is applied to a DRT system in the Netherlands. Based on the observed results, the impacts of DRT as a complement to FT are discussed.
Methodology
The proposed DRT assessment framework covers three aspects. First, it analyzes the DRT system characteristics. Second, it examines DRT operation, involving both DRT usage and performance. Finally, based on the operational characteristics of the system, a series of accessibility indicators are examined. This framework is depicted in Figure 1 and its components are detailed in the subsequent subsections.
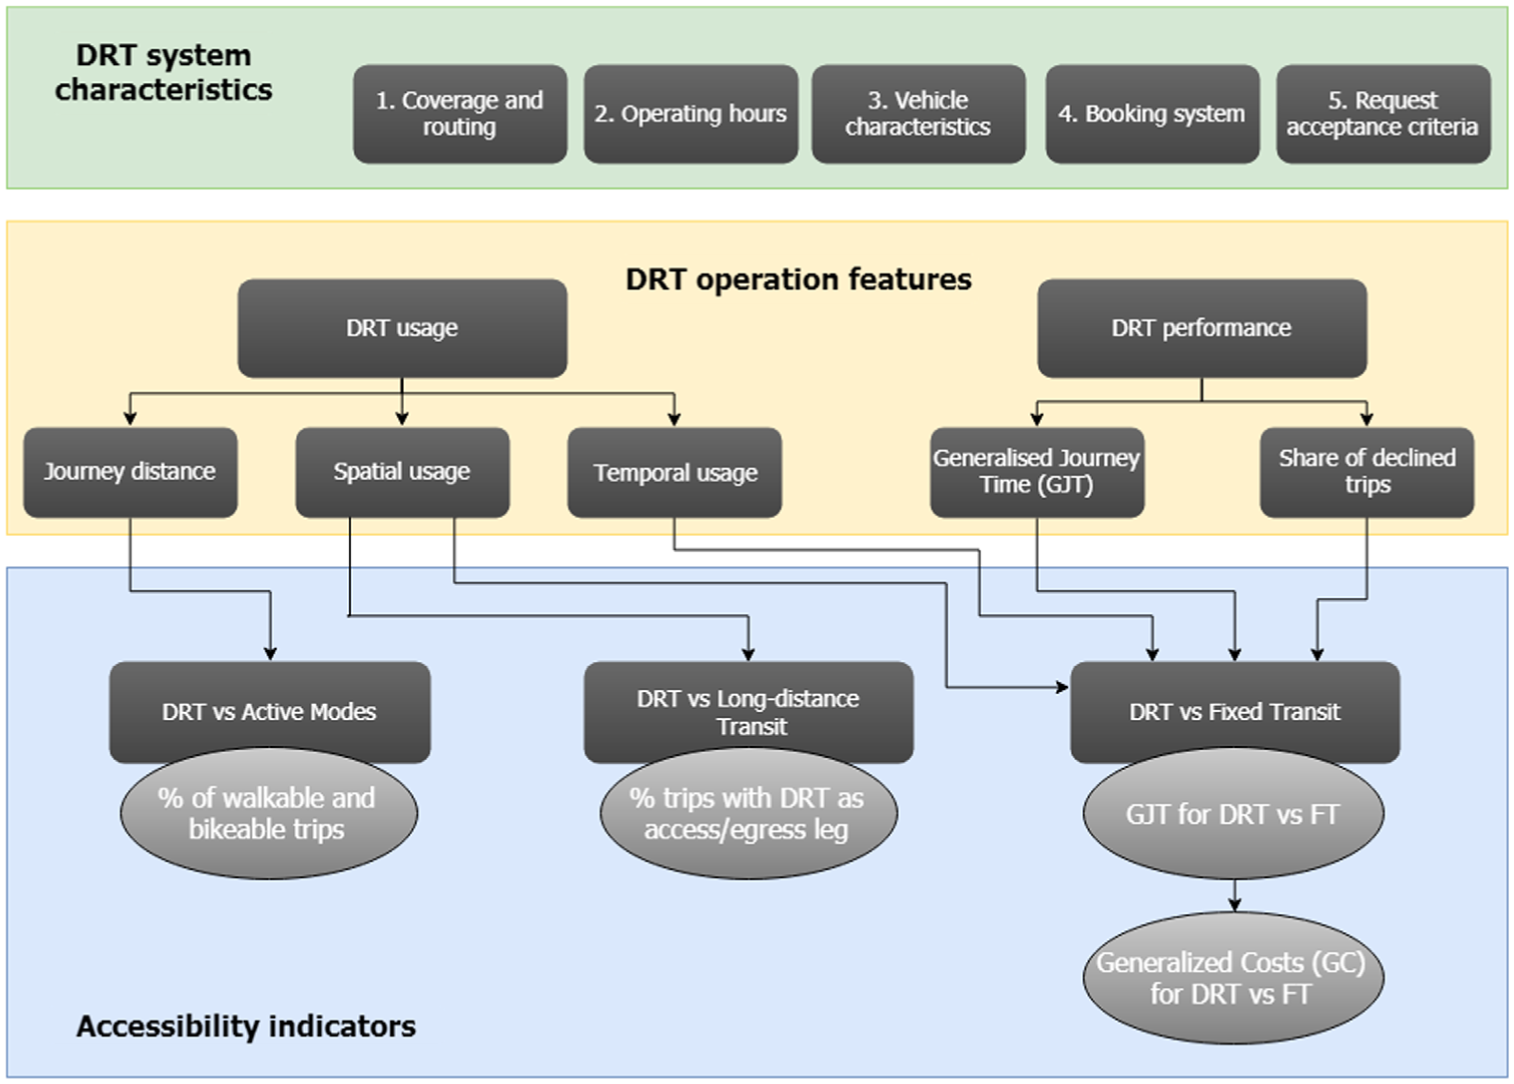
Assessment framework.
DRT System Characteristics
Before analyzing the DRT operation, it is necessary to understand the intrinsic characteristics of the system under consideration (upper box of Figure 1). We highlight five aspects of the DRT system:
Coverage and routing. Defined by the operating area and the degree of flexibility in the operation. The latter can range from a fully flexible door-to-door service, to more rigid configurations in which only partial deviations from a planned route are possible.
Operating hours. Equivalent to the service span considered in FT.
Vehicle characteristics. DRT fleets often consist of minibus vehicles, with previous research suggesting that a vehicle capacity of eight is the preferred vehicle size ( 12 ). Fleet size is also a key design variable of DRT systems as it will determine the different routes that can be covered simultaneously by the system.
Booking system. The system can allow for instant bookings in real-time, require advanced bookings or allow for both options. Traditionally, dial-a-ride schemes relied on telephone reservations, but large-scale real-time DRT systems require Internet connection to perform the bookings in an efficient manner.
Request acceptance criteria. Time required to the pick-up point or vehicle availability are the often-used criteria in deciding whether a request is accepted or rejected.
DRT Operation Features
Because of its inherently dynamic interaction with demand, DRT performance is directly tied to its usage ( 13 ). As such, both aspects are an integral part in DRT operation (see middle box of Figure 1).
DRT Usage
DRT usage is analyzed in terms of demand patterns. Three important aspects can be highlighted: journey distance, spatial usage patterns, and temporal usage patterns. Journey distance can provide insights into the modes that would compete with DRT. For instance, short trips might substitute walking and cycling. The analysis of spatial usage reveals which origins, destinations, and routes are most frequently used. This can shed light on areas with high demand that may not be conveniently served by FT. Lastly, the temporal usage identifies peaks in the operation, both by time of the day and by day of the week. Traditionally, transport demand in general and, in particular, public transport services tend to exhibit two daily peaks following commuting patterns. Since shopping and social trips have been identified as the most recurrent trip purposes for DRT trips ( 14 ), different temporal usage patterns might be expected for DRT.
DRT Operation
Regarding DRT operation, the presented framework considers two aspects: the generalized journey time (GJT) and the share of declined trips. The GJT represents the perceived passenger journey time. It is calculated by multiplying the time of the different segments of the door-to-door journey by different weighting factors so as to transform them into equivalent in-vehicle time (
15
). The different segments to take into account are the walking time (

where
This study also includes the share of declined trips by the operator as a separate element in this assessment since it is an important reliability indicator of the DRT system. A systematic analysis of the declined trips can also help improve the DRT service and search for inequalities in operation (e.g., some zones may have a higher share of declined or less profitable trips and may thus suffer from more recurrent cancellations). Moreover, DRT operators could be penalized when declining trips for which no adequate FT alternative is available.
Accessibility Indicators
Following the analysis of DRT operation, this paper proposes a series of indicators that measure the change in accessibility attributed to the DRT service. These are depicted in the ovals in Figure 1.
DRT vs. Active Modes
DRT can be seen as a competitor of walking and cycling for admissible walking and biking distances. The threshold for admissible walking and cycling distances needs to be adjusted based on the DRT setting, as these values differ by region ( 19 ), as well as by trip purpose and population subgroup ( 20 ). The first accessibility indicator expresses the share of walkable and bikeable trips as follows:


The smaller these shares are, the less the actual DRT usage is competing with active modes. Note that although the former is a subset of the latter, biking is not always a feasible alternative (e.g., lack of a bicycle or cycling knowledge). Including both indicators serves to, depending on the setting, better assess the actual competition of DRT with active modes.
DRT vs. Long-Distance Transit
DRT operation is often restricted to a certain area. For trips that extend beyond these boundaries, DRT can be used as a complementary mode and connect passengers with long-distance transit modes such as train, long-distance bus, or regular bus for the case of DRT acting as a feeder. The second accessibility indicator is thus expressed as:

The larger this share is, the more DRT constitutes a connecting service to long-distance transit.
DRT vs. Fixed Transit
DRT can also be used as the main mode of transport, competing with FT. This is the more general scenario due to the similitudes that DRT and FT exercise. In order to address this key aspect, the assessment framework provides a more complex benchmark against FT, in which two KPIs – the GJT and the generalized costs (GC) – are calculated and compared for DRT and FT.
Following the workflow described in Figure 2, the GJT is calculated for the DRT trips and, if available, for the declined trips. The GJT of DRT is compared with the GJT that the passengers would have experienced if they had traveled using FT. Three parameters are used to calculate the GJT of the FT alternatives: booking time (as the desired start time), and origin and destination locations. Automatic vehicle location data can be used for this purpose. If this information is unavailable, scheduled information from FT journey planners can be used. The GJT ratio (GJTR) of each trip is expressed as:

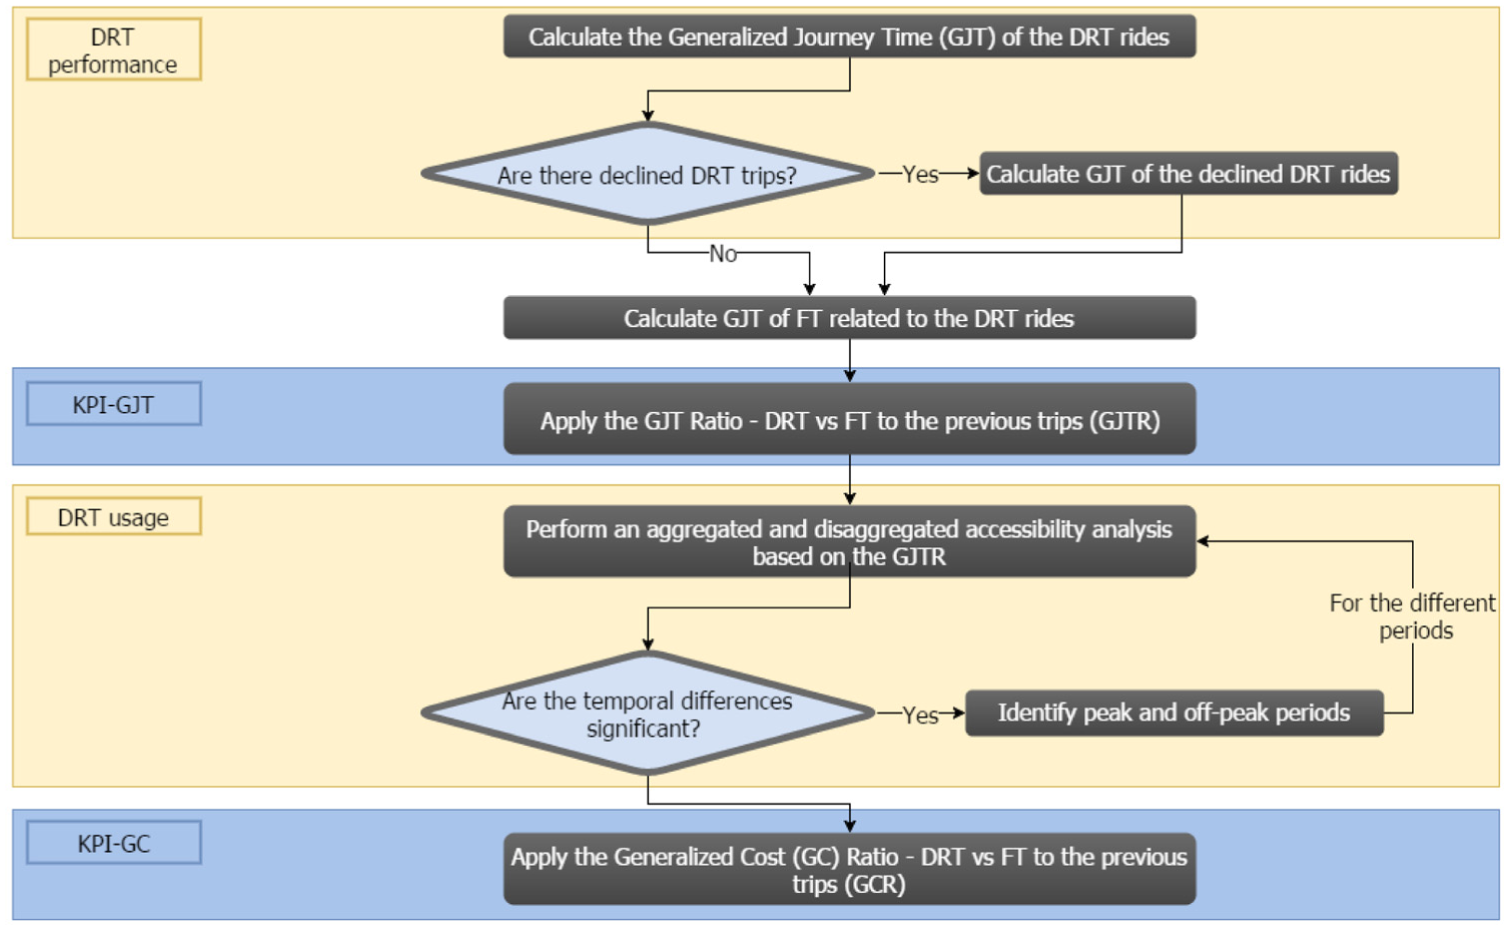
DRT accessibility performance benchmarks against FT.
The GJTR indicator is analyzed by considering its distribution, and performed and declined trips are assessed separately. It is important to note that the median (or the quartiles for a more detailed representation) should be used to assess the distribution rather than rely on the mean due to the asymmetry caused by the ratio calculation.
The GJTR can be further evaluated both spatially and temporally. An aggregated representation of this KPI can identify origin–destination (O-D) connections for which the DRT service has mostly improved the transit provision. A comparison between the number of performed and declined trips for the different O-D pairs can identify whether rejections are more prevalent in certain areas. Moreover, a disaggregated representation can identify connections that are underserved by conventional transit. If significant temporal differences exist (either daily or weekly), the spatial analysis can be performed for different time intervals.
The last step of the comparison between DRT and FT is based on the GC in which the GJT values are multiplied by the corresponding value of time (VoT). The monetarized value of the GC ratio (GCR) indicator is expressed, similarly to the GJTR as:

Whenever the focus is set on the total monetary cost of the passenger instead of on the temporal convenience of both modes, this GC indicator can be used.
Application
Case Study Description
The assessment framework described in the previous section was applied to the DRT pilot “Breng flex,” which operates in the Arnhem-Nijmegen region in the east of the Netherlands. In the following, the Breng flex service in Nijmegen is analyzed. The pilot started in December 2016 and it offers stop-to-stop connection with a total of 255 stops. The service area includes the city of Nijmegen and the neighboring municipalities of Wijchen, Berg en Dal, and Oosterhout, with a total of approximately 200,000 inhabitants. Breng flex is run by Breng, the incumbent local bus operator. With its introduction, two bus lines that linked the municipality of Wijchen, traversed the central parts of Nijmegen and terminated at the northern part of Nijmegen, were simultaneously cancelled. The Breng flex service has a fixed price of €3.50 per person and operates from 06:30 to 24:00 during the weekdays, 08:00 to 24:00 on Saturdays, and 09:00 to 24:00 on Sundays. The fleet comprises five minibuses (maximum of five seats for passengers and two wheelchairs) and four electric cars (maximum of three seats for passengers). Rides can be booked in real-time via a mobile app or a telephone number, and no advance booking option is available. Maximum waiting time is set to 20 min, rides that cannot be served within this time window will not be accepted.
The analyzed data includes the pick-up and drop-off locations for all registered ride requests – both performed and declined trips – between the 16th December 2016 and 18th May 2017. Booking times and expected in-vehicle times were available for the declined trips. Data for the performed trips also included actual in-vehicle time and waiting time. Rides with an unrealistic average travel speed – lower than 10 km/h (6.21 mph) or higher than 70 km/h (43.48 mph) – were not considered in the analysis. For declined trips, requests with the same spatial characteristics that differed by less than 5 min were included only once in the analysis to prevent multiple counts. A total of 4,719 performed trips and 130 declined trips (2.7% of all requests) were considered valid for the analysis.
Results
The average distance of the served DRT trips was 7.05 km (4.38 mi). As no sociodemographic data of the DRT users was available, the average walking and cycling distances in the Netherlands were used as thresholds for these modes, that is, 1.2 km (0.75 mi) for walking trips ( 19 ) and 3.6 km (2.24 mi) for cycling trips ( 21 ). In total, 0.1% and 16.5% of the DRT trips could have been performed on foot and by bike respectively, with the large majority of the rides covering a longer distance than the average active mode trips.
The obtained data do not allow identification of DRT trips that constitute a part of a longer transit trip. In order to have an approximation of the number of trips that could have used Breng flex as the access or egress leg, we identified the number of DRT trips that had one of the six train stations within the case study area as pick-up point (12.3% of the rides) or drop-off point (8.3%). These numbers are upper bounds and suggest that up to 20% of the rides could have been used to access or egress one of the train stations.
The other indicators compared the DRT rides to FT rides. The characteristics of the FT rides that could have substituted the performed and declined DRT rides were obtained by introducing the booking time and the start location and end locations of the DRT rides in the transit Google Maps Directions API ( 22 ). The Google Maps Directions API provides scheduled rather than actual transit data, hence possible deviations from plans in FT operations are not accounted for. As retrieval criterion, we selected the FT trip with “the earliest time at the destination.” However, using this criterion, the option shown for 5% of the performed trips and for 13% of the declined trips (242 and 17 respectively) did not involve any transit, only walking. This is arguably an indication that the existing FT connection for these origins and destination is inadequate, or that the distance covered is rather short. To allow for a fair comparison for which FT values could be attained, these trips were not included in the subsequent comparison of DRT and FT.
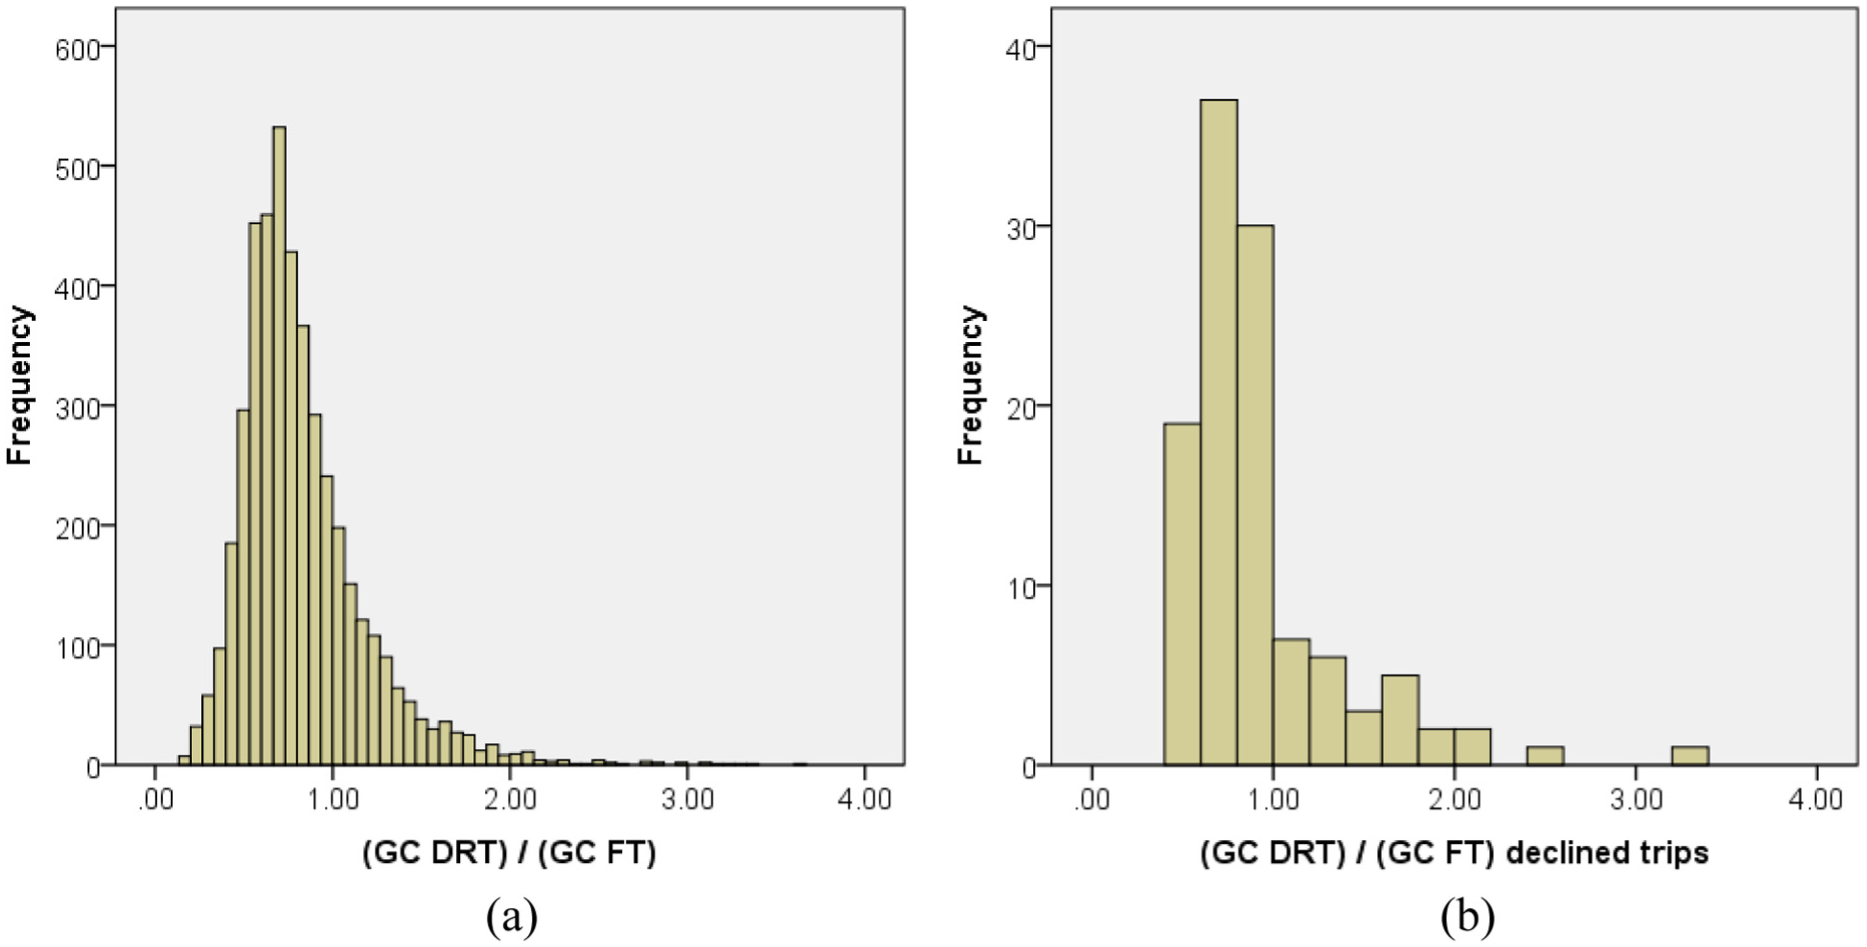
For the previous trips, the GJT for the performed and declined trips were calculated (the factors used being
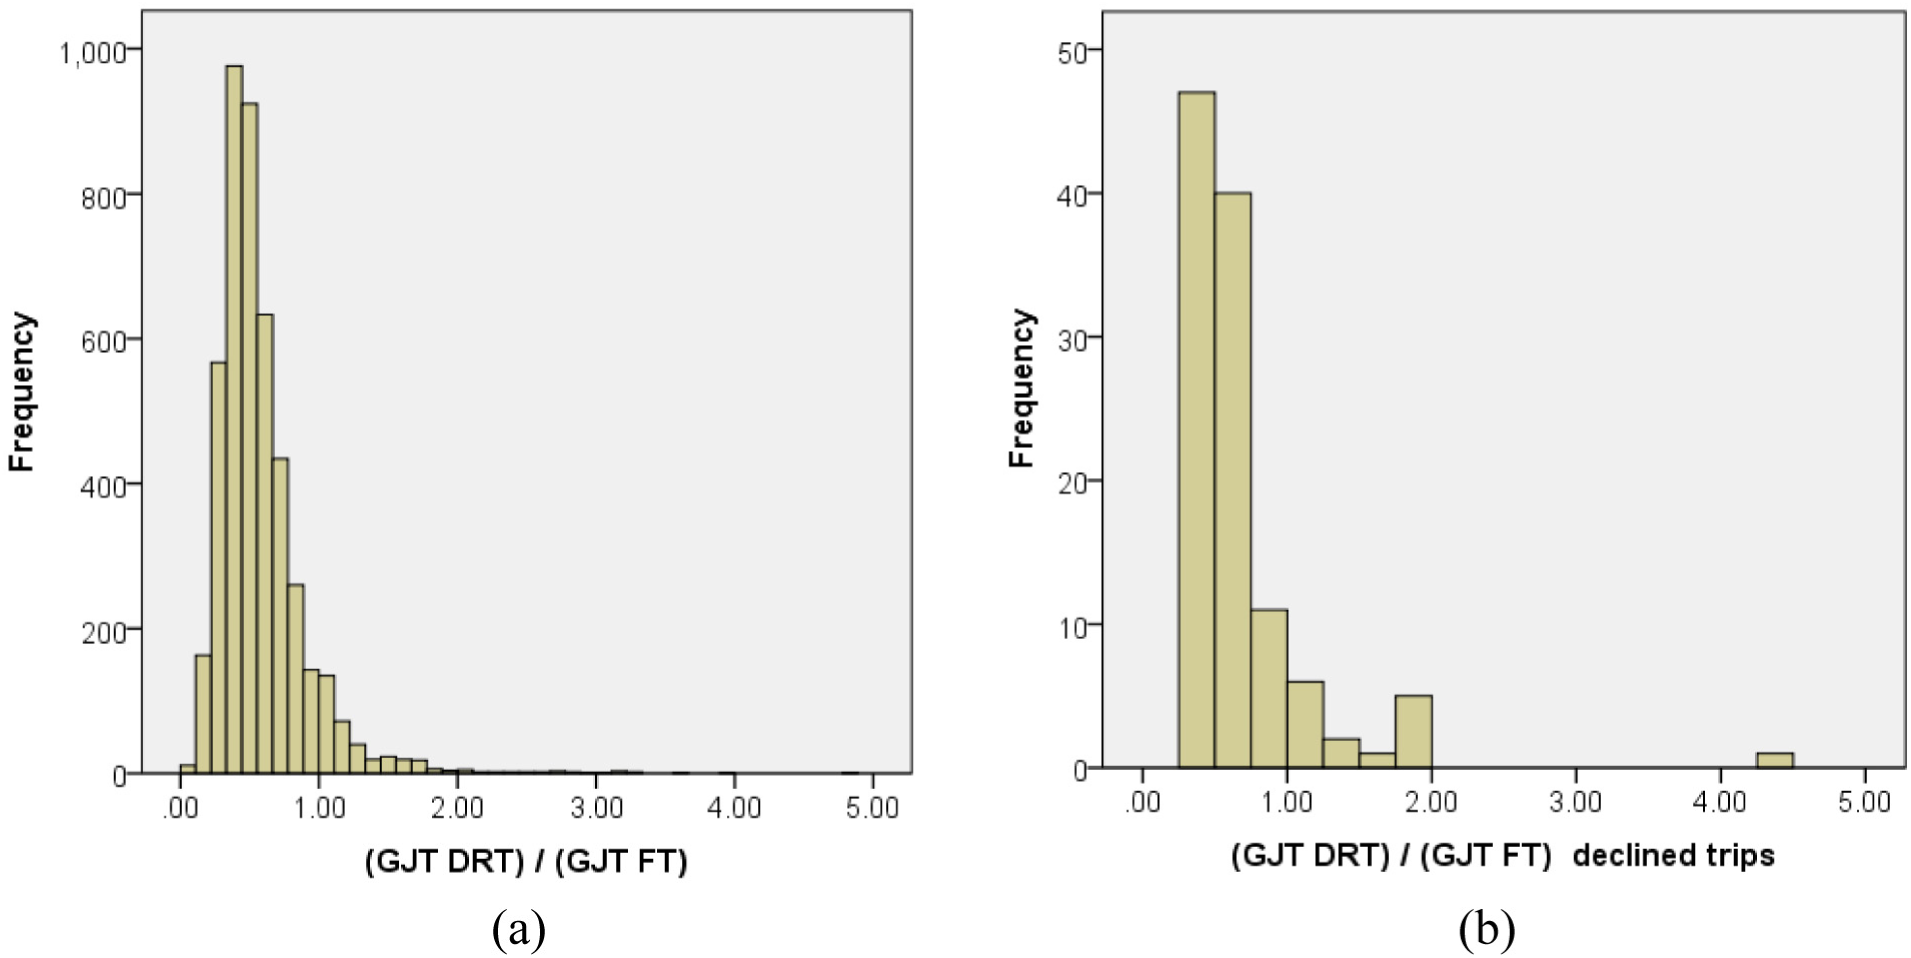
Distribution of the GJTR for DRT in comparison to PT (a) for the performed trips (N = 4,477) and (b) for the declined trips (N = 113).
The distribution of the GJTR is now analyzed spatially, both in an aggregated and in a disaggregated manner. Figure 4 presents the aggregated spatial analysis of the performed trips, with ( a ) the zonal delimitations used (in which Nijmegen has been divided into three parts by following natural water barriers), ( b ) the O-D matrix in hundreds, and ( c ) the median of the GJTR corresponding to each of the O-D pairs. The difference in the number of rides for each of the O-D pairs was partly due to the difference in the population size of the different areas. Moreover, part of the demand between Wijchen and the different areas of Nijmegen might be attributed to users of the two bus lines that were eliminated with the introduction of Breng flex. This fact could also explain why trips from Nijmegen North to Wijchen had the lowest median for the GJTR indicator (the median DRT GJT is 22% of the FT GJT value). Conversely, the O-D pair for which the increases of accessibility provided by DRT in comparison to FT were the lowest was Oosterhout–Oosterhout (GJTR = 0.69). Regarding the declined trips, the low number of occurrences (with no occurrence at all for many of the O-D pairs) did not provide a representative sample to analyze if there were statistical differences between both trip groups and were therefore not included in the shown figures. Importantly, the number of declined trips for each O-D pair correlated with the number of served trips. Thus, there were no spatial disparities in the DRT service availability.
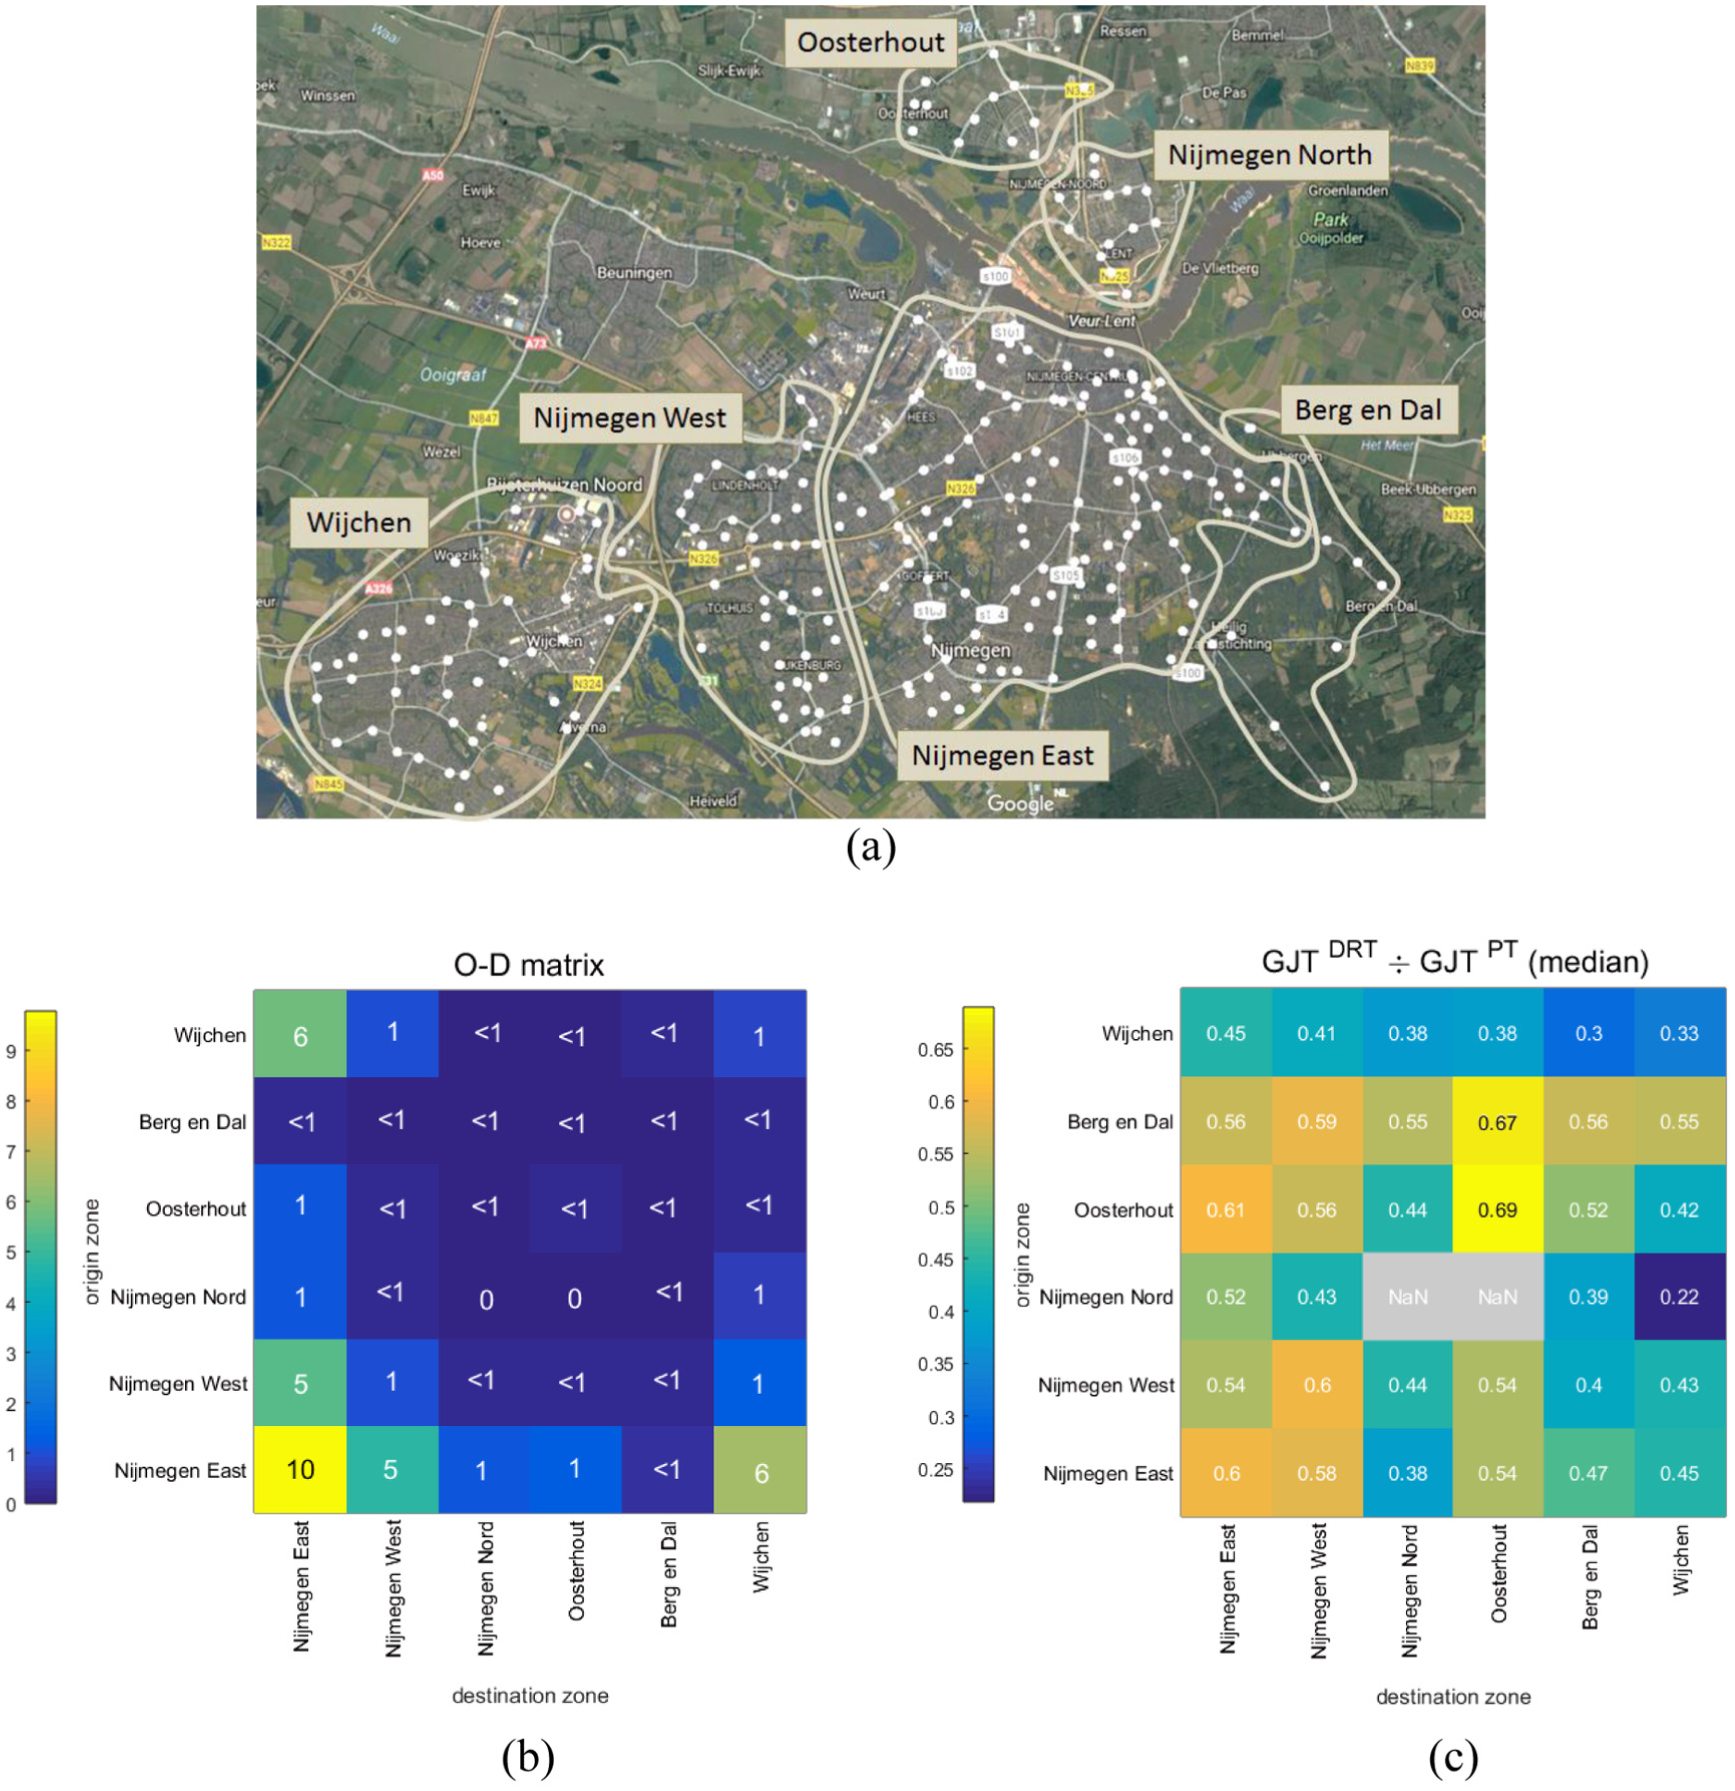
Aggregated spatial analysis of DRT: (a) zonal delimitation; (b) O-D matrix (in hundreds); (c) median of the GJTR for each O-D pair.
The disaggregated spatial analysis is presented geocoded in Figure 5. The performed rides have been distributed across three graphs, ( a ), ( b ), and ( c ), according to their GJTR, whereas declined rides are illustrated in ( d ). Node size is consistent with use frequency, as well as link size and link color intensity. The direction of the trips is represented clockwise. The large majority of the trips for which FT outperformed DRT (GJTR > 1) were radial trips with an end in the center of Nijmegen, whereas recurrent links with a distinctive DRT benefit had a more tangential nature. No distinctive pattern can be observed between performed and declined trips. The large majority of the 255 DRT stops were utilized during the study period, and the stop at “Nijmegen central railway station” was one of the two most recurrently used stops.
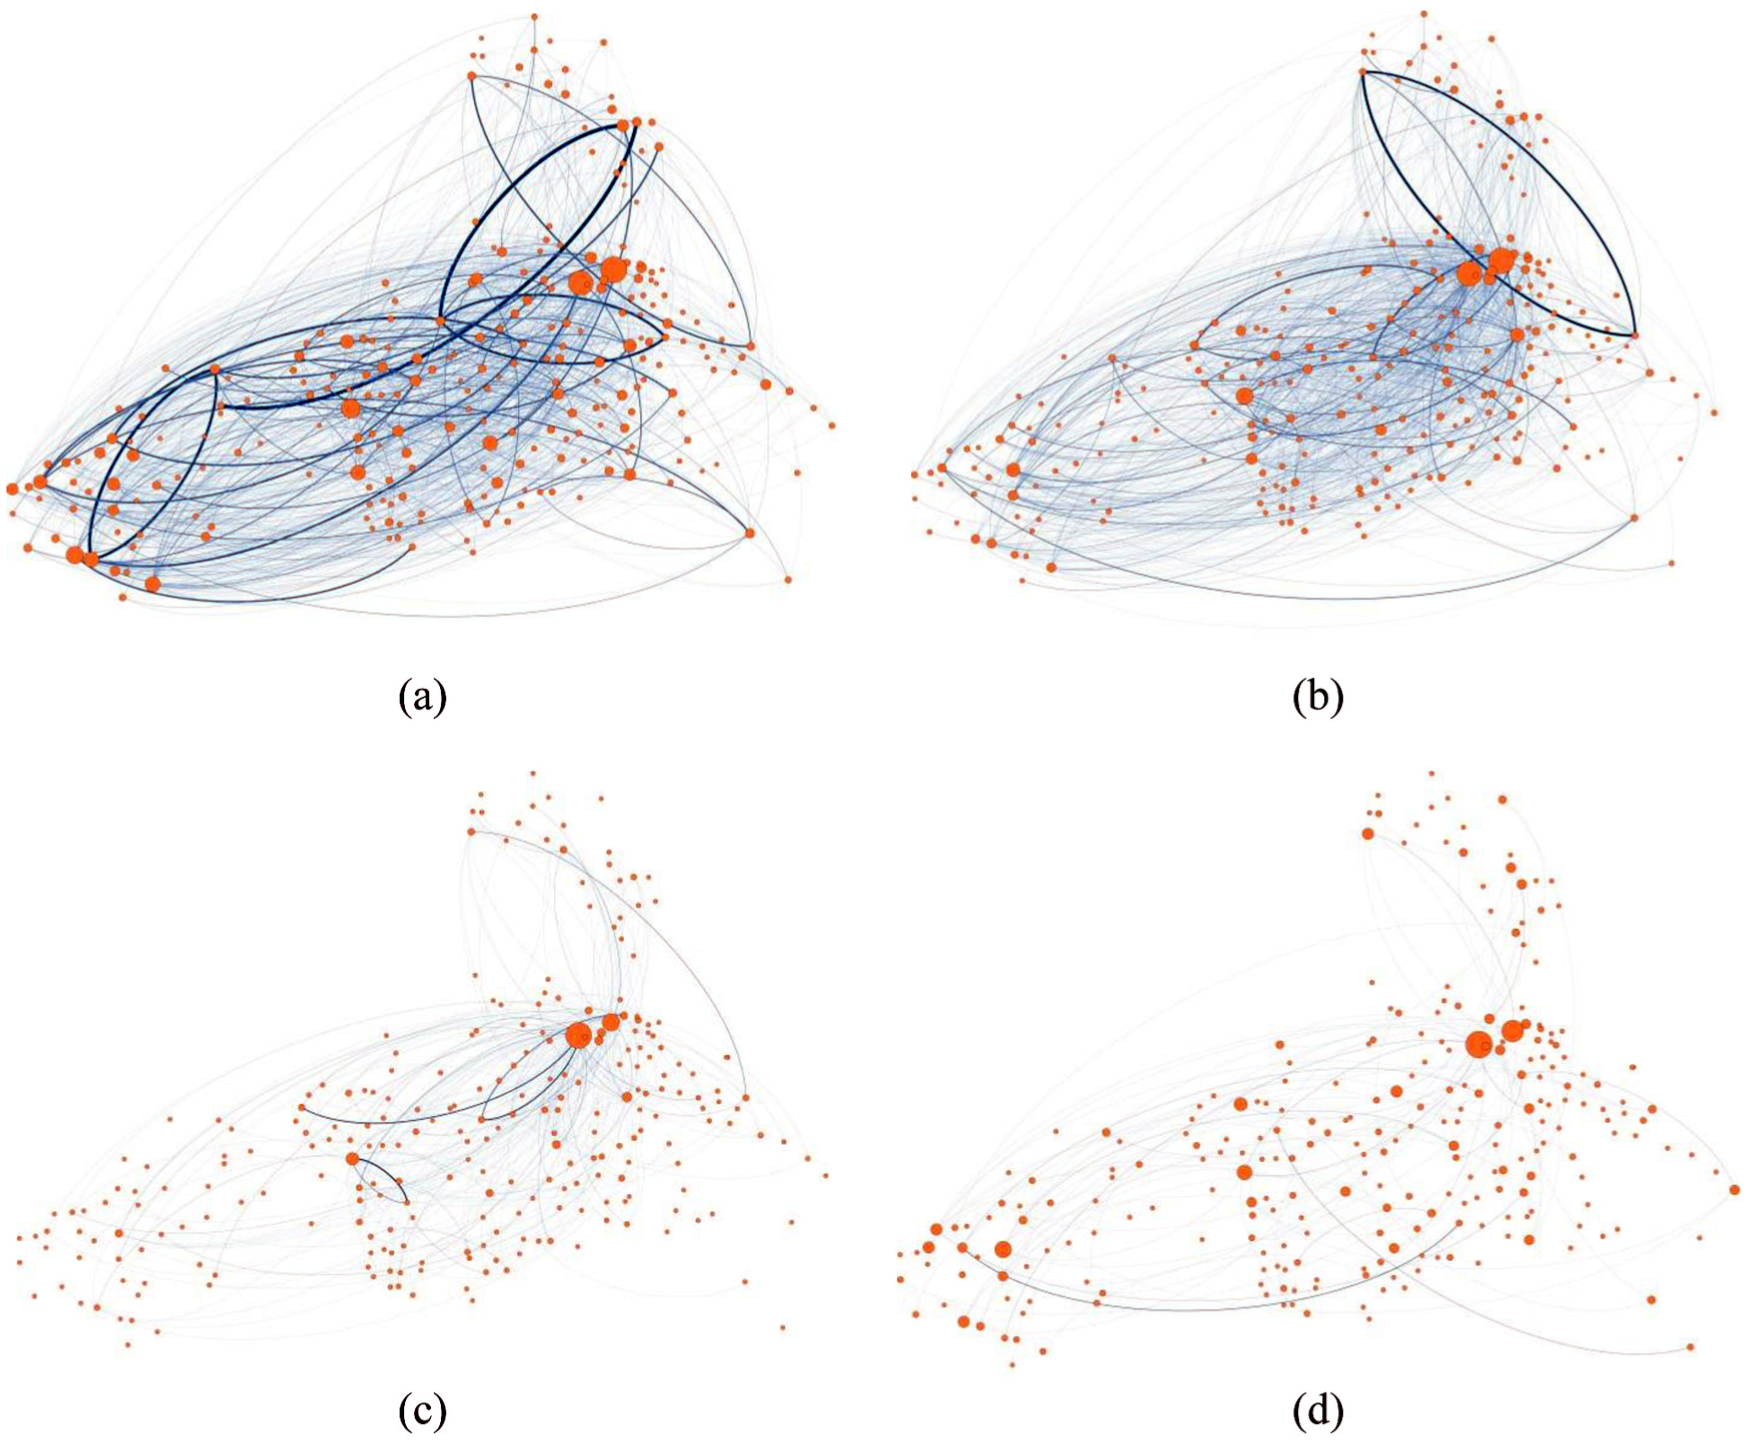
Disaggregated spatial analysis of DRT: (a) performed rides with GJTR < 0.5 (2,206 rides); (b) performed rides with 0.5 < GJTR < 1 (1,905 rides); (c) performed rides with GJTR > 1 (366 rides); (d) declined rides (113 rides). Plotted in Gephi ( 23 ).
The analysis of the evolution of the demand for Breng flex services shows a constant increase in the number of rides since the implementation of the DRT service. The number of trips in the last week quadrupled the trips in the first weeks to its introduction. Due to this large variation in demand volumes, only the data from the last 10 weeks were considered in the search for daily and weekly variations in demand levels. No statistically significant differences were found in the demand on different days of the week (p = 0.113 for one-way ANOVA) but differences in demand levels at different hours of the day were statistically significant (p = 0.001 for one-way ANOVA studying the hourly demand between 09:00 and 21:00). The hourly DRT demand did not show strong commuting peaks as in the case for FT, but smaller peaks still do exist, with the highest demand observed in the afternoon (around 15:00). A spatial representation of the peak period could identify the highest demand areas during this timeslot. Due to space limits, this is not presented in this paper.
The last step described in the assessment framework involves the calculation of the GC of both performed and declined trips. A future modal shift from FT to DRT could arguably be expected if the GCR distribution favors DRT to a large extent. The VoT used for this study (both for DRT and FT) was the VoT calculated in Kouwenhoven et al. ( 24 ) for bus/tram/metro for all trip purposes in the Netherlands, which is €7.39 per hour per person in 2016 terms. The distribution of GCR is represented in Figure 6. The median for the performed trips was 0.75 (0.60 for the 25th percentile and 0.97 for the 75th percentile). For the declined trips, the median was 0.80 (0.63 for the 25th percentile and 0.99 for the 75th percentile). These results show that although DRT outperformed FT for the trips for which passengers opted for DRT, the distributions of the GC were closer to 1 than those of the GJT (Figure 3). This shift is caused by the higher fixed price for DRT than the distance-based FT fare, resulting in a smaller discrepancy in passenger disutility between the services when accounting for the price difference.
Distribution of the GC for DRT in comparison to PT (a) for the performed trips (N = 4,477) and (b) for the declined trips (N = 113).
Discussion
Until recently, the main reasons for introducing DRT services were to substitute FT in low demand areas or to fulfill the needs of specific sectors of the population (mainly the elderly and the disabled). The case study service was also partly introduced based on these grounds (it offers a barrier-free service, and two fixed bus lines were eliminated in conjunction with its introduction). Notwithstanding, it also offers a complementary service to FT, with the objective of improving the mobility offered in the area and to better address passengers’ needs. This additional role of DRT is in line with the Mobility-as-a-Service (MaaS) paradigm, in which “mobility services [are bought] as packages based on consumers’ needs instead of buying the means of transport” ( 25 ), and for which different mobility services complement FT.
Results of the case study show that for 50% of the performed rides, the GJT offered by the DRT alternative was 0.5 or less than the GJT offered by the available FT alternative, showing that large improvements in mobility can be attributed to DRT. Rayle et al. compared the times that performed ridesourcing trips (i.e., trips provided by transportation network companies such as Uber and Lyft) would have taken with FT ( 26 ). In line with the results of this study, they found that “the majority of ridesourcing trips would have taken more than twice as long if made by public transport.” Both results show that, even though these services may be competitors of FT, they improve the offered mobility, with the subsequent economic and social benefits.
Despite the opportunities that DRT provides as a complement to FT, its implementation also brings a series of risks that should not be overlooked. Three main risks are identified. Firstly, for a DRT system to achieve a high degree of efficiency, a relatively large fleet is necessary, as stressed in Kutsuplus’s final report ( 8 ). As a result, the offered DRT service could become a (possibly heavily subsidized) individual taxi service. Secondly, if DRT provides a lower GC than FT, more users may shift from FT to DRT, with the FT revenue seeing a decrease and, in extreme cases, a possible increase in road congestion. An analysis of the incurred GC of both DRT and FT (as performed in this study) could help identify large differences in the costs that passengers incur with both services. Furthermore, FT revenue decrease could lead to the deterioration (or elimination) of the offered FT service, even though DRT may not be capable of absorbing the entire passenger demand. This second risk has been elevated by recent research, which has found that FT users are more prone to use DRT than non-FT users ( 27 ). Finally, DRT services in their current regulatory framework do not guarantee a certain level of service. As a result, the risk of not obtaining the desired ride exists, the importance of which increases if no alternative service (such as FT) is available. The share of declined trips could vary for different O-D pairs, with rides for less convenient/profitable locations being more likely to be declined. Thus, a spatial analysis of the declined rides should be performed together with the spatial analysis of the performed rides, as described in the suggested framework.
The above-mentioned risks can be reduced with an integrated FT–DRT approach. In an integrated FT–DRT network, the ride fee for DRT could be modified so as to obtain the desired split between the demand for DRT and FT. This price adjustment could be regulated based on different attributes. When striving for an equal urban accessibility, DRT price could be calculated as a function of FT accessibility. This would imply that the price for DRT would be higher when a competitive FT alternative exists, and lower otherwise. The accessibility indicators proposed in this study could be used to adjust the DRT price function if this approach is adopted. An alternative price adjustment approach could be based on comfort considerations as more exclusive (and less collective) mobility services provide a higher utility to the passenger. This approach, which is used in the flexible mobility on demand system presented in Atasoy et al., implies that passengers should pay a higher fee for using a premium service that is less capacity-efficient ( 5 ). Whatever the adjusting function is, an integrated FT–DRT approach could increase the opportunities that DRT could bring as a complement to FT and decrease the collateral risks.
Conclusion
There are a wide range of innovative transportation services that have recently appeared in urban areas. However, they are often considered in isolation, and the impacts of their interactions and implications for other modes are largely ignored ( 28 ). This paper presents an assessment framework for evaluating the usage of DRT. A generalized travel cost comparison was proposed as an indicator of changes in accessibility related to the introduction of DRT in relation to the FT alternatives. Moreover, the usage of DRT as the first or last leg in longer FT journeys, and the suitability of the performed rides for walking and cycling were also considered in this assessment. To the authors’ knowledge, this is the first study that has measured the increase in accessibility that the implementation of DRT has granted DRT passengers, in comparison to the FT alternative. An empirical analysis was performed by applying the proposed framework to an urban DRT system in the Netherlands. Results indicate a reduction of over half of the GJTs for half the rides that were performed using the DRT service, in comparison to the FT alternatives. Results also identified areas for which this reduction was the highest, highlighting connections for which FT offers a poor alternative.
Public transport authorities could use the proposed framework for one or more of the following purposes: 1) evaluating the real performance of DRT for the different areas, including the distribution of declined rides; 2) identifying whether DRT is used as a complement of FT due to poor FT connections, or as a substitute for FT due to the higher comfort DRT provides, and 3) assessing the impacts of DRT on improving mobility.
Other than DRT, recent studies have shown that other flexible modes, such as ridesourcing and car-sharing, may also complement public transit ( 29 ). However, even if a series of partnerships between them and transit are already in place, data concerning their usage is necessary to enhance transit planning ( 30 ). The assessment framework provided in this study could be extended to analyze the usage of other flexible modes and better identify opportunities for synergies as opposed to symbiotic relations in which new services gain the most lucrative markets.
In the absence of information on individual characteristics, the shortcomings of this study pertain to the unobserved drivers of user behavior. The analysis of travel behavior under different conditions would allow estimating demand elasticities, the socioeconomic characteristics of DRT riders or differences in perceived times for DRT with respect to FT values. Future studies could include these aspects in their evaluation by incorporating travel survey data. Also, further research is needed to analyze how urban development characteristics and transit-related factors influence DRT usage, as already researched for taxi ridership ( 31 ).
Footnotes
Acknowledgements
This work was funded by NWO (The Organisation for Scientific Research from the Netherlands), as part of the SCRIPTS (Smart Cities Responsive Intelligent Public Transport Services) research project. The authors thank Breng and Arjen van Weert of HAN University for providing the data used for the case study.
Author Contributions
The authors confirm contribution to the paper as follows: study conception and design: MJA-G, OC; data collection: TL; analysis and interpretation of results: MJA-G, OC, TL; draft manuscript preparation: MJA-G, OC. All authors reviewed the results and approved the final version of the manuscript.
The Standing Committee on Public Transportation Planning and Development (AP025) peer-reviewed this paper (18-04555).