
Abstract
Signalized intersections are one of the most common types of bottleneck in urban cycling networks. Gaining knowledge on the macroscopic characteristics of bicycle flow during the queue discharge process is crucial for developing ways to reduce the delay experienced by cyclists at intersections. This paper aims to determine these characteristics (including jam density, shockwave speed, and discharge flow), and to unveil possible relationships between them, particularly whether and to what extent discharge flow is correlated with jam density and shockwave speed (which is of high relevance from a traffic management viewpoint). To this end, the study analyzes high-resolution bicycle trajectories derived from video footage on a one-direction cycle path leading to an intersection in Amsterdam (the Netherlands). Linear regression analysis is used to investigate the relationships between macroscopic variables. The results indicate that jam density, shockwave speed, and discharge flow vary considerably across traffic-signal cycles, which highlights the stochastic nature of bicycle flow. Furthermore, the results show that discharge flow is strongly positively correlated with jam density and shockwave speed. It is hypothesized that there is a causal relationship between these variables, which would imply that traffic engineers can increase discharge flows (thus reducing delay) at signalized intersections if they find effective ways to increase jam densities and shockwave speeds.
Bicycle use is increasing in cities all around the world owing to the advantages that cycling offers to travelers and to the implementation of policies promoting this transportation mode ( 1 ). Although this trend has important benefits for society from the environmental, accessibility, and public health viewpoints ( 2 ), it also comes with challenges, such as safety issues and congestion at bottlenecks. One of the most common types of bottleneck in urban cycling networks is the signalized intersection, where bicycle flow is interrupted (so cyclists need to stand in a queue) during red-signal phases. Long queues may not dissolve completely during one green-signal phase, thus some cyclists may need to wait for more than one red-signal phase to access an intersection. In order to mitigate this problem, it is necessary to maximize the queue outflow during green-signal phases. Some cities are currently testing innovative street-layout concepts and/or bicycle traffic management measures to achieve this goal ( 3 ). For that, knowledge concerning the characteristics of bicycle flows and, more specifically, the characteristics of the bicycle queue-formation and discharge processes, is crucial. Key characteristics (from a macroscopic perspective) are jam density, shockwave speed, and queue discharge flow. The jam density of a standing-still queue can be defined as the average number of cyclists per unit of space, and is an outcome of the queue-formation process. Knowing typical jam density values one can estimate queue lengths. When the traffic light turns green, a shockwave between two traffic states (i.e., cyclists who are standing still, and cyclists who are starting to move) emerges. The speed at which this shockwave propagates upstream, which is determined by the gaps cyclists keep when they start to move, is called shockwave speed (or wave speed). Knowing typical wave speed values one can estimate the time that any cyclist will start moving given its location within the queue. The queue discharge flow (or simply discharge flow) is generally defined as the average number of cyclists that pass the stop line per unit of time. Importantly, the discharge flow determines the delay experienced by cyclists at the intersection (given the red- and green-phase lengths, and a certain demand profile).
Although knowledge concerning the characteristics of the queue discharge process is very important for the development of effective ways to reduce the delay and discomfort experienced by cyclists at intersections, currently there is only a partial understanding of these characteristics. To the authors’ knowledge, empirical measurements of wave speeds in bicycle queues have not been reported in the literature. And although several studies present empirical measurements of jam density and discharge flow, the reported values vary considerably: jam densities range between 0.27 and 0.65 bicycles/
The main objective of this study is to determine the macroscopic characteristics of bicycle flow during the queue discharge process at signalized intersections (including jam density, wave speed, and discharge flow) based on empirical data, and to unveil possible relationships between these characteristics, particularly whether and to what extent discharge flow is correlated with jam density and wave speed. As mentioned above, discharge flow is a very relevant macroscopic variable from a traffic management viewpoint, as it determines the delay experienced by cyclists at an intersection. For this purpose, the study analyzes bicycle trajectories on a one-way cycle path leading to a signalized intersection in Amsterdam (the Netherlands). The trajectories were derived from top-view video images. Jam density, wave speed, discharge flow, and critical density were measured for 57 queue discharge periods. Linear regression analysis was used to investigate the relationships between these macroscopic flow characteristics. Thus this paper takes into account and investigates the theoretical relationship
The rest of this paper is structured as follows. The next section describes the site and explains the procedure used to derive the trajectory data, followed by a description of the methods used to calculate the macroscopic variables and explore the relationships between them. The results of the analysis are then presented and their possible implications for traffic management discussed. The final section contains the conclusions of this study.
Data Collection
Bicycle trajectories along a cycle path leading to a signalized intersection in Amsterdam were derived from top-view video images. The cycle path is 2 m wide and unidirectional; it is segregated from car traffic and is used by both bicycles and scooters. Traffic demand in this path is relatively high in peak hours. Access to the intersection is regulated by a traffic light. In order to obtain the video footage, a 10-m pole with two video cameras on top ( 21 ) was placed next to it. The camera views can be seen in Figure 1, a and b . The front camera recorded the last 9 m of the cycle path upstream of the stop line, whereas the back camera recorded the previous 11 m (there is some overlap between the two camera views). Therefore, the two cameras combined covered 20 m of cycle path upstream of the traffic light. The frame rate varied between 5 and 10 fps during the recordings.
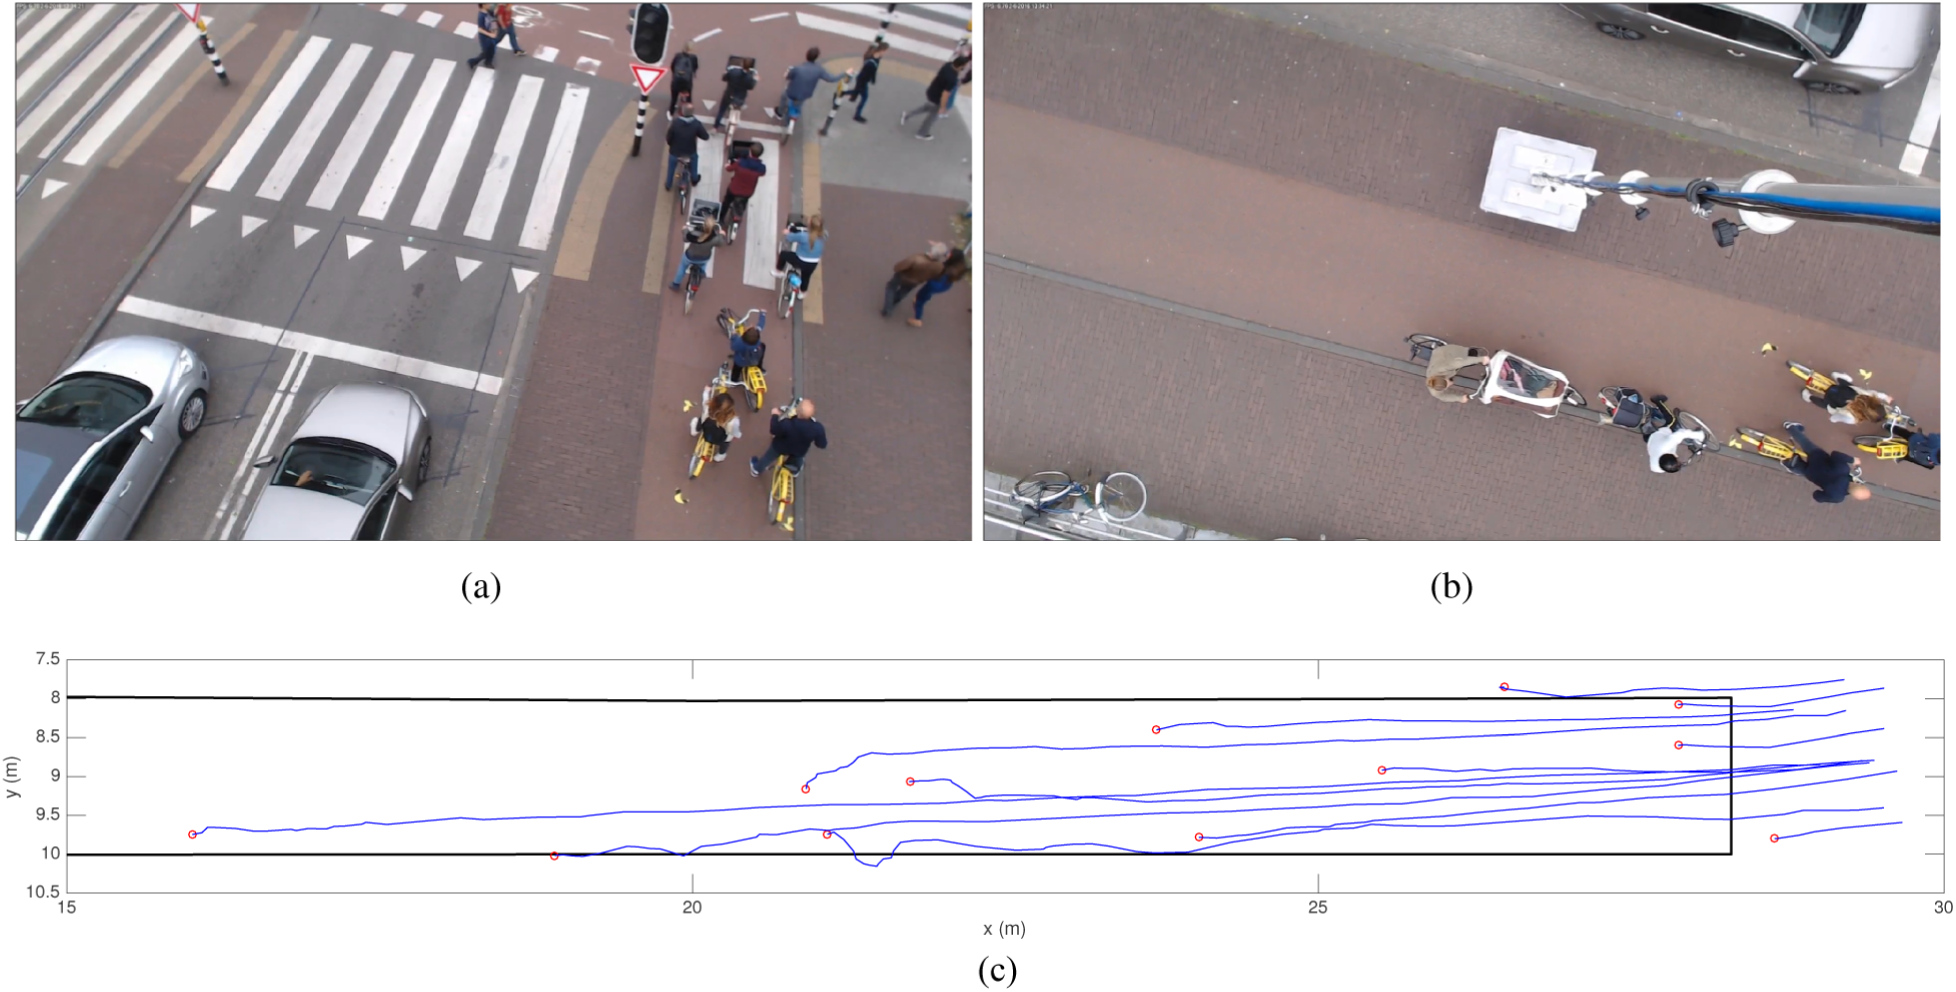
View of the two cameras installed on the 10-m pole at 13:34:23h, when the traffic light was red and 12 bicycles were standing still forming a queue, and derived trajectories: (a) front camera; (b) back camera; (c) derived trajectories.
Bicycle traffic was recorded between 12:45 and 19:00 h on June 6, 2016. By looking at the video footage, queue discharge periods were selected that met the following criteria: (a) at least seven bicycles/scooters are standing still inside the path before the traffic light turns green; (b) there are no more than two scooters within the queue; (c) all the bicycles/scooters move toward the stop line and pass it without getting out of the cycle path; (d) no pedestrian crosses the cycle path during the discharge process; (e) the discharge process is not affected by downstream traffic conditions; and (f) all the bicycles/scooters pass the stop line before the end of the green phase. The threshold established by criterion (a) aims to ensure that the selected queues are long enough to allow for a proper analysis of the macroscopic flow characteristics during the discharge process. Criterion (b) defines a threshold to guarantee that the selected queues are formed mainly by bicycles (instead of scooters). Criterion (c) ensures that, in the selected periods, no cyclist leaves the cycle path during the queue discharge process. This is important because sometimes cyclists do not respect the traffic rules and move to the road or to the sidewalk before crossing the stop line (see the site in Figure 1a). This irregular behavior may have a significant influence on the macroscopic characteristics of bicycle flow. Criteria (d), (e), and (f) ensure that the queue discharge process is not disturbed by the traffic signal nor by agents external to the bicycle queue.
The total number of selected discharge periods was 57. The trajectories of all bicycles and scooters forming part of the queue were derived for every period (see example in Figure 1c). The complete procedure to derive the trajectories for a given period is as follows:
1. Video clip decomposition. The video clip corresponding to the selected period is decomposed into its individual frames.
2. Manual cyclist tracking. TrajectoryViewer, a software package developed at TU Delft, is used to manually track over time (i.e., in each video frame) the cyclists that form part of the queue. The exact point being tracked is the center of the head. In this step, space coordinates (
3. Height transformation. Space coordinates are transformed in order to project the head positions to the ground. This is done using linear functions that give the
4. Orthorectification. The
5. Time coding. The time units of each trajectory point are changed from frame number to seconds. To do this, it is necessary to first assign a time instant in seconds to every frame in accordance with the video file metadata.
6. Trajectory merging. Trajectories from the two cameras that correspond to the same cyclist are merged into consistent full trajectories. This is done by coupling pairs of trajectories that are very close in space and time within the cycle path area where the two camera views overlap.
Data Analysis Methods
This section presents the way macroscopic flow characteristics were calculated for each selected discharge period, and describes the methodology used to establish relationships between these characteristics.
Measured Quantities
An example of the trajectories during one of the selected discharge periods is shown in Figure 2a. The three following quantities were measured for every selected period: jam density (
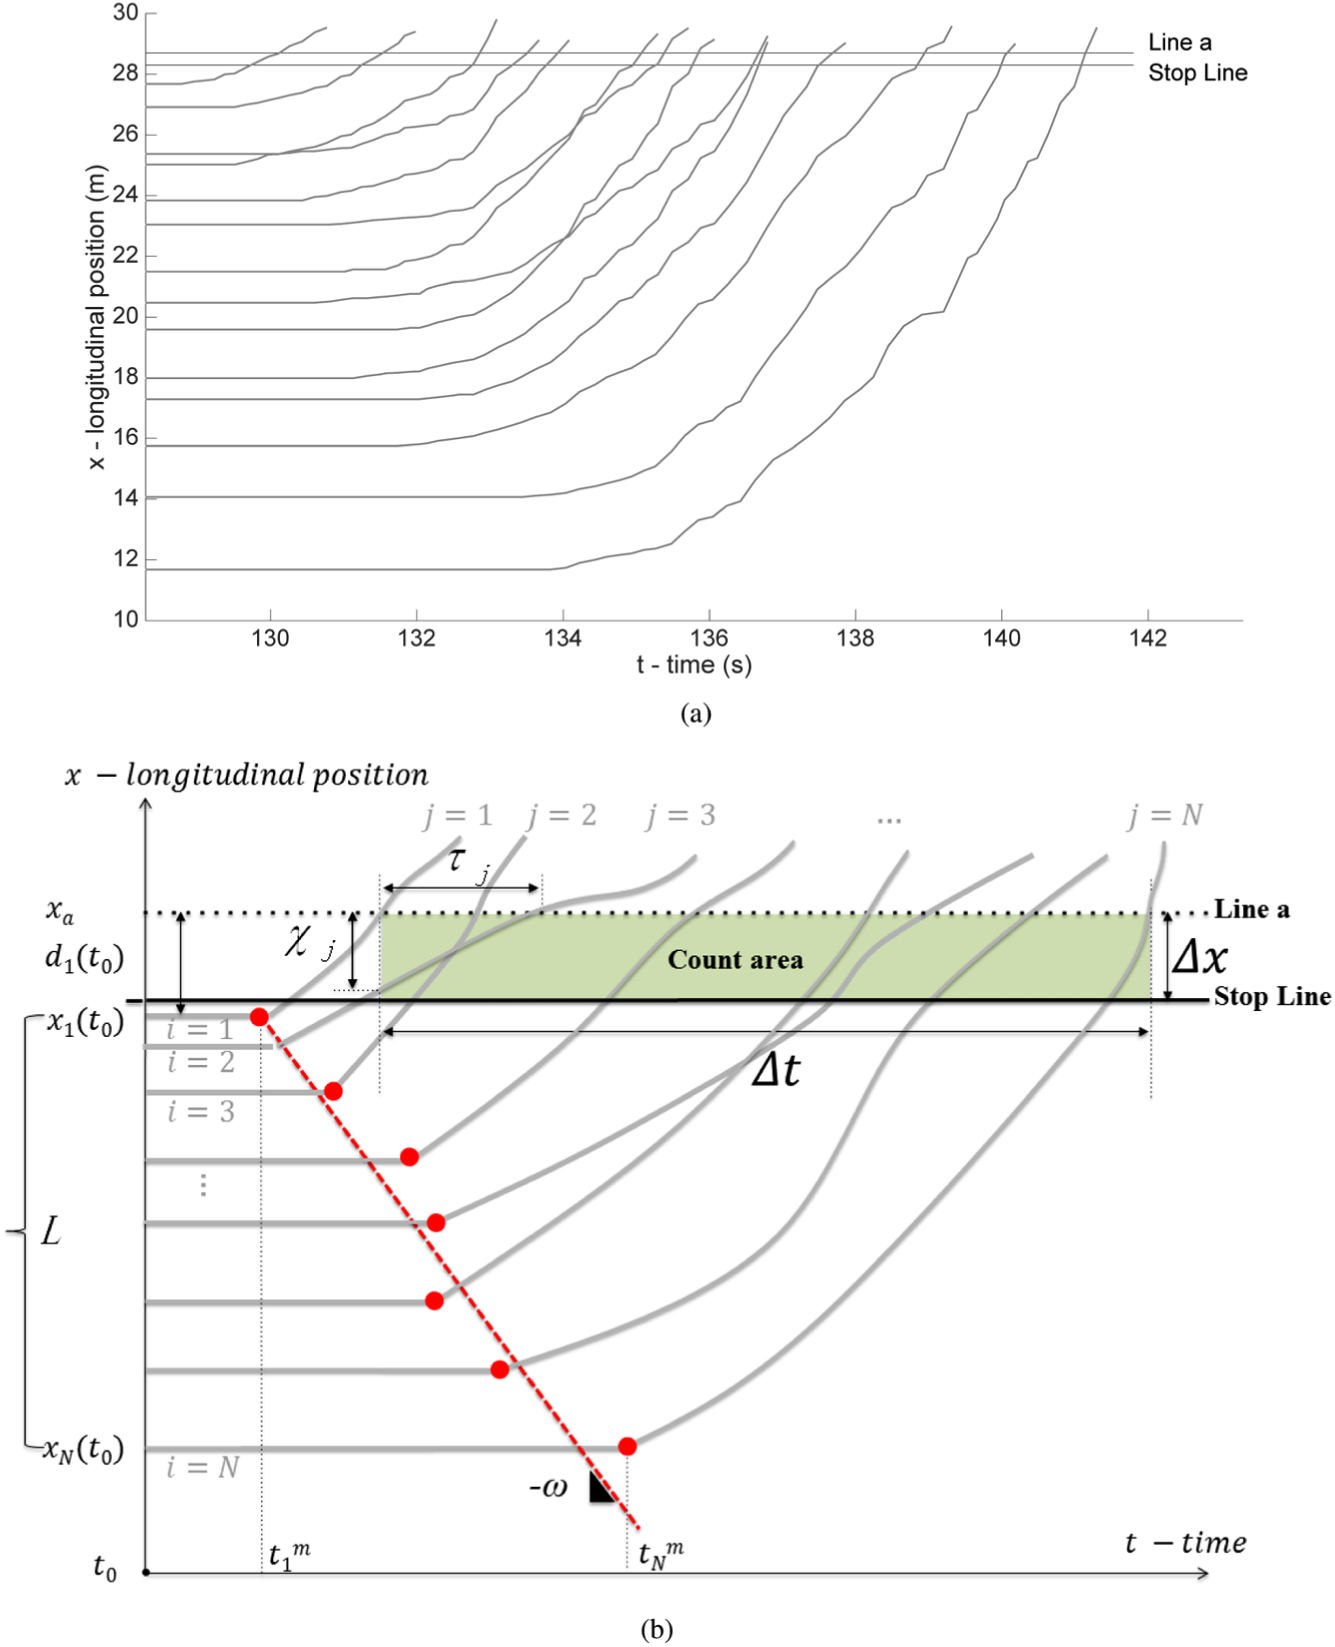
Real trajectories and conceptual plot showing the calculation methods: (a) real bicycle trajectories; (b) calculation of the measured quantities.
The jam density (

where:

In Equation 2,
The wave speed (
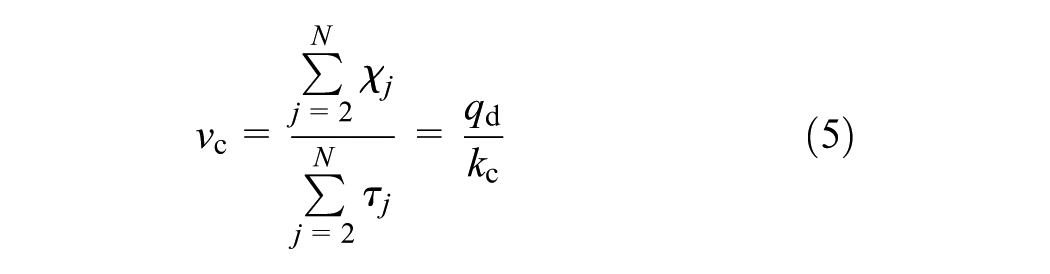
Discharge flow (

where:
Note that, since the time instant when cyclist

and
where
Data Analysis
The empirical measurements of macroscopic flow characteristics (jam density, wave speed, discharge flow, critical density, and critical speed) described above were analyzed in two different ways. First, the variability of the measurements across the 57 selected periods was analyzed. Histograms were created and descriptive statistics calculated (such as the average and the percentiles) in order to gain insight into the shapes of their distributions. Note that the analyzed periods are only a selection of all the observed periods (the selection criteria were explained earlier). Therefore, the histograms and descriptive statistics do not represent all observed periods but only those periods for which it is appropriate to measure the macroscopic flow characteristics given the scope of this research project.
Second, the relationships between different macroscopic flow characteristics were analyzed. The main goal was to determine whether and to what extent discharge flow (which can be seen as an outcome of the queue discharge process) is correlated with jam density and wave speed (which are features of that process). After visual inspection of the data points (see, for example, Figure 3), linear regression analysis was selected to explore these relationships. Nevertheless, this approach is considered as a first step in the analysis of the relationships between macroscopic flow characteristics. The use of more complex regression techniques may provide additional insights, but that will be addressed in further research. In this paper, five linear regression models were estimated based on the empirical measurements:
Model 1:
Model 2:
Model 3:
Model 4:
Model 5:
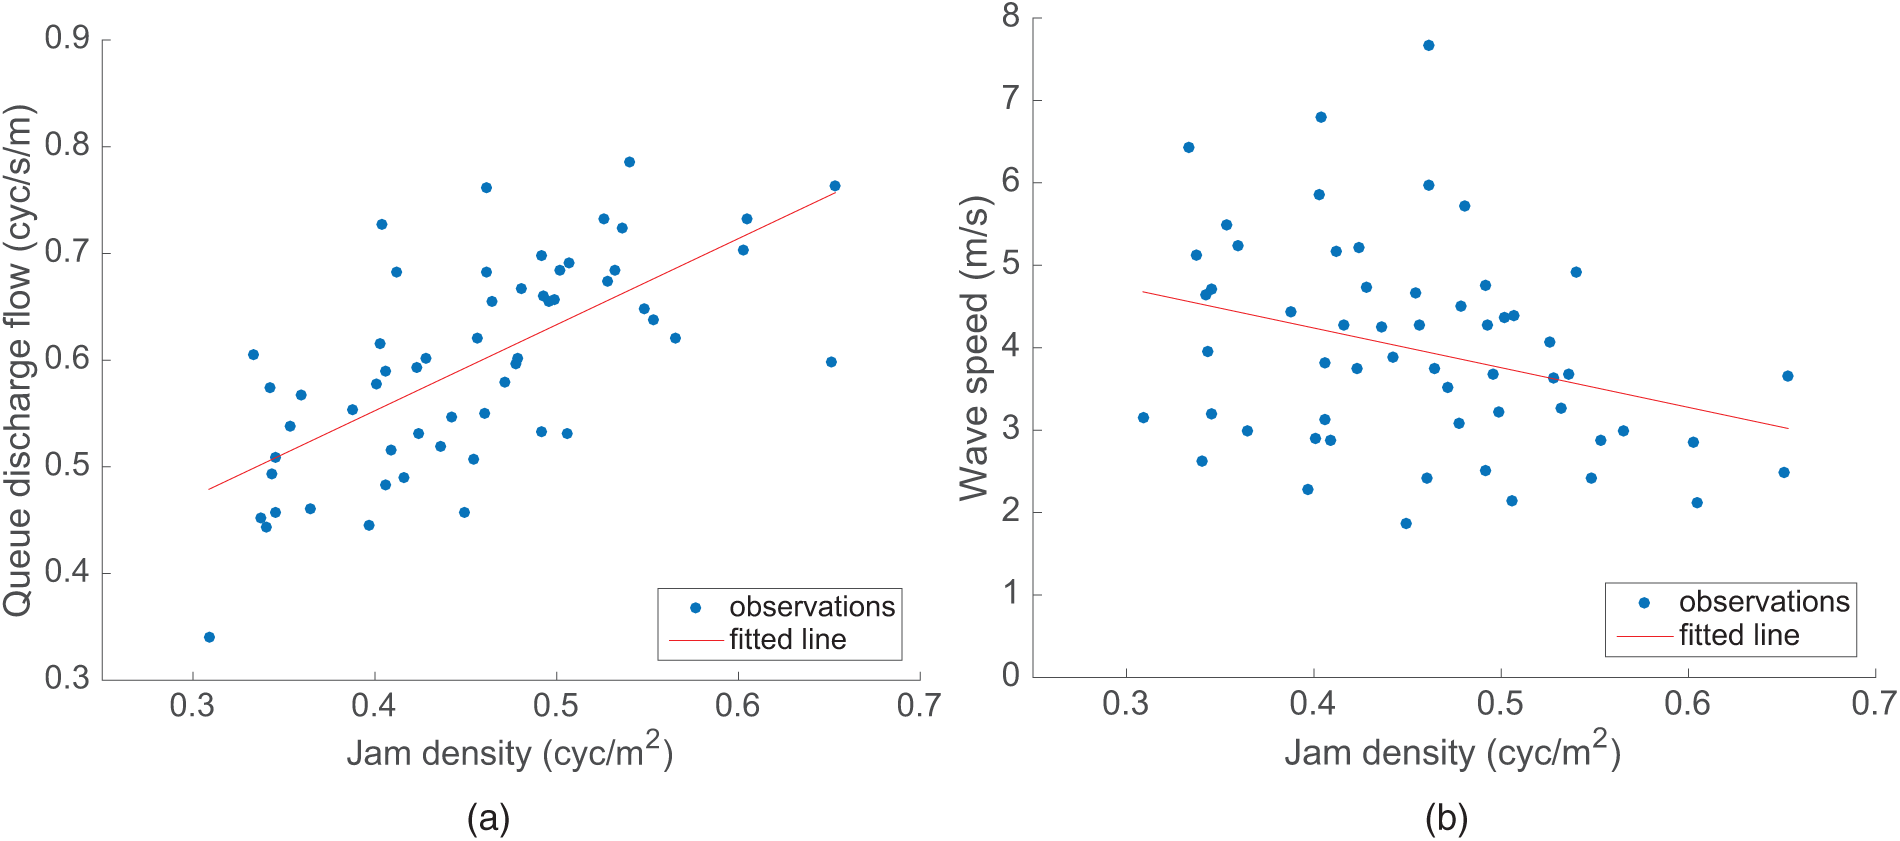
Observations and fitted lines for some of the relationships investigated in this research: (a) Relationship between
Models 1–5 were first estimated using raw scores (i.e., the
Results
Descriptive Statistics
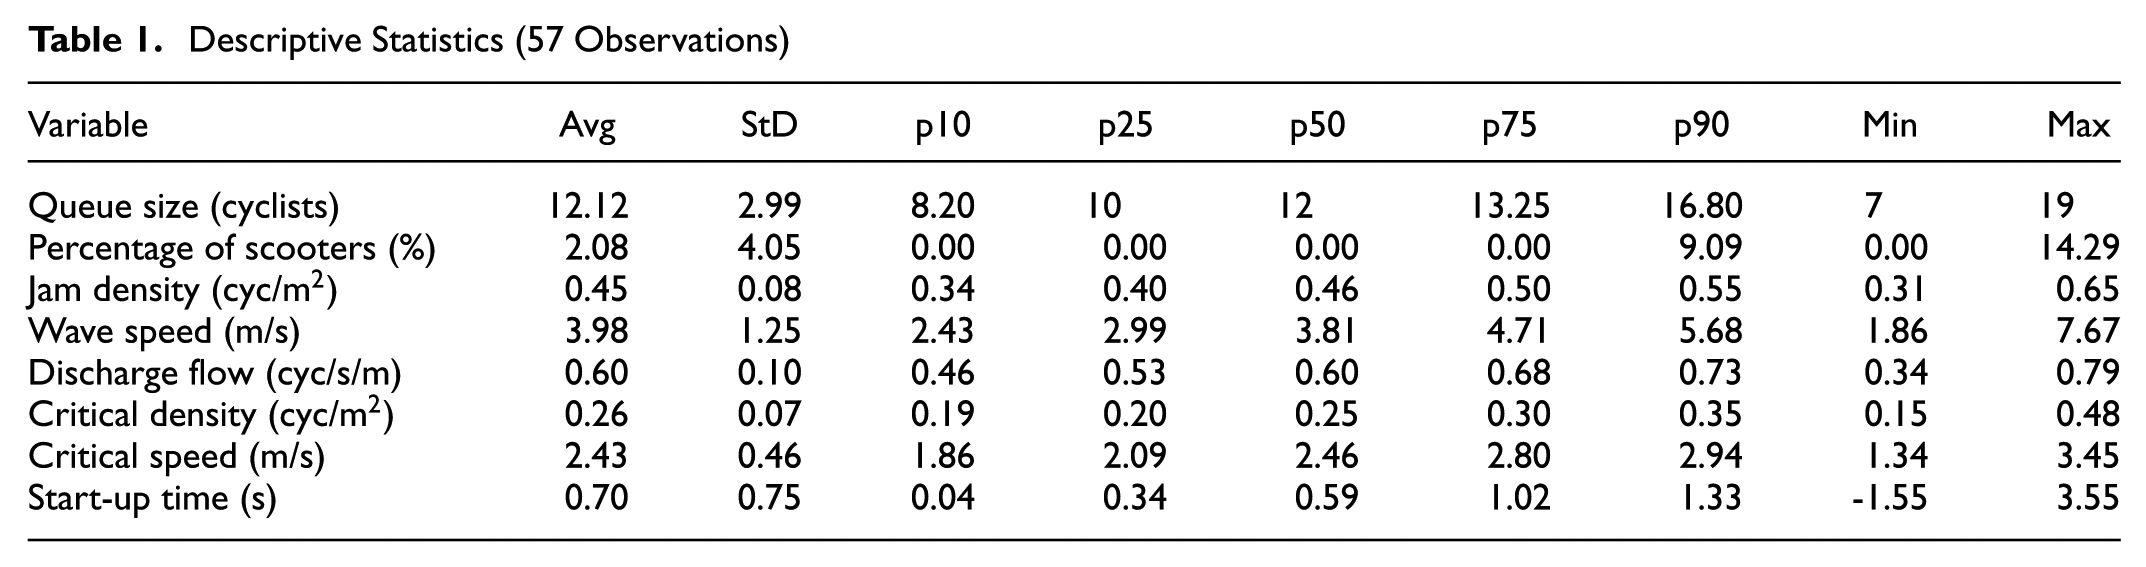
The total number of queue discharge periods analyzed in this study is 57. The average queue size in these periods is 12.12 cyclists, and in 75% of them the queue consists of 10 or more cyclists (see Table 1). In 44 out of 57 periods (77.2%), there are no scooters in the queue; in 11 periods (19.3%), there is one scooter, and in the remaining 2 periods (3.5%), there are two. The maximum percentage of scooters is 14.29% (see Table 1), corresponding to a period in which 2 out of 14 cyclists are riding a scooter.
Descriptive Statistics (57 Observations)
The measurements of the macroscopic quantities defined earlier vary substantially across different queue discharge periods. Figure 4,
a–e
, shows the histograms of these measurements, and Table 1 shows various descriptive statistics. Jam density measurements (
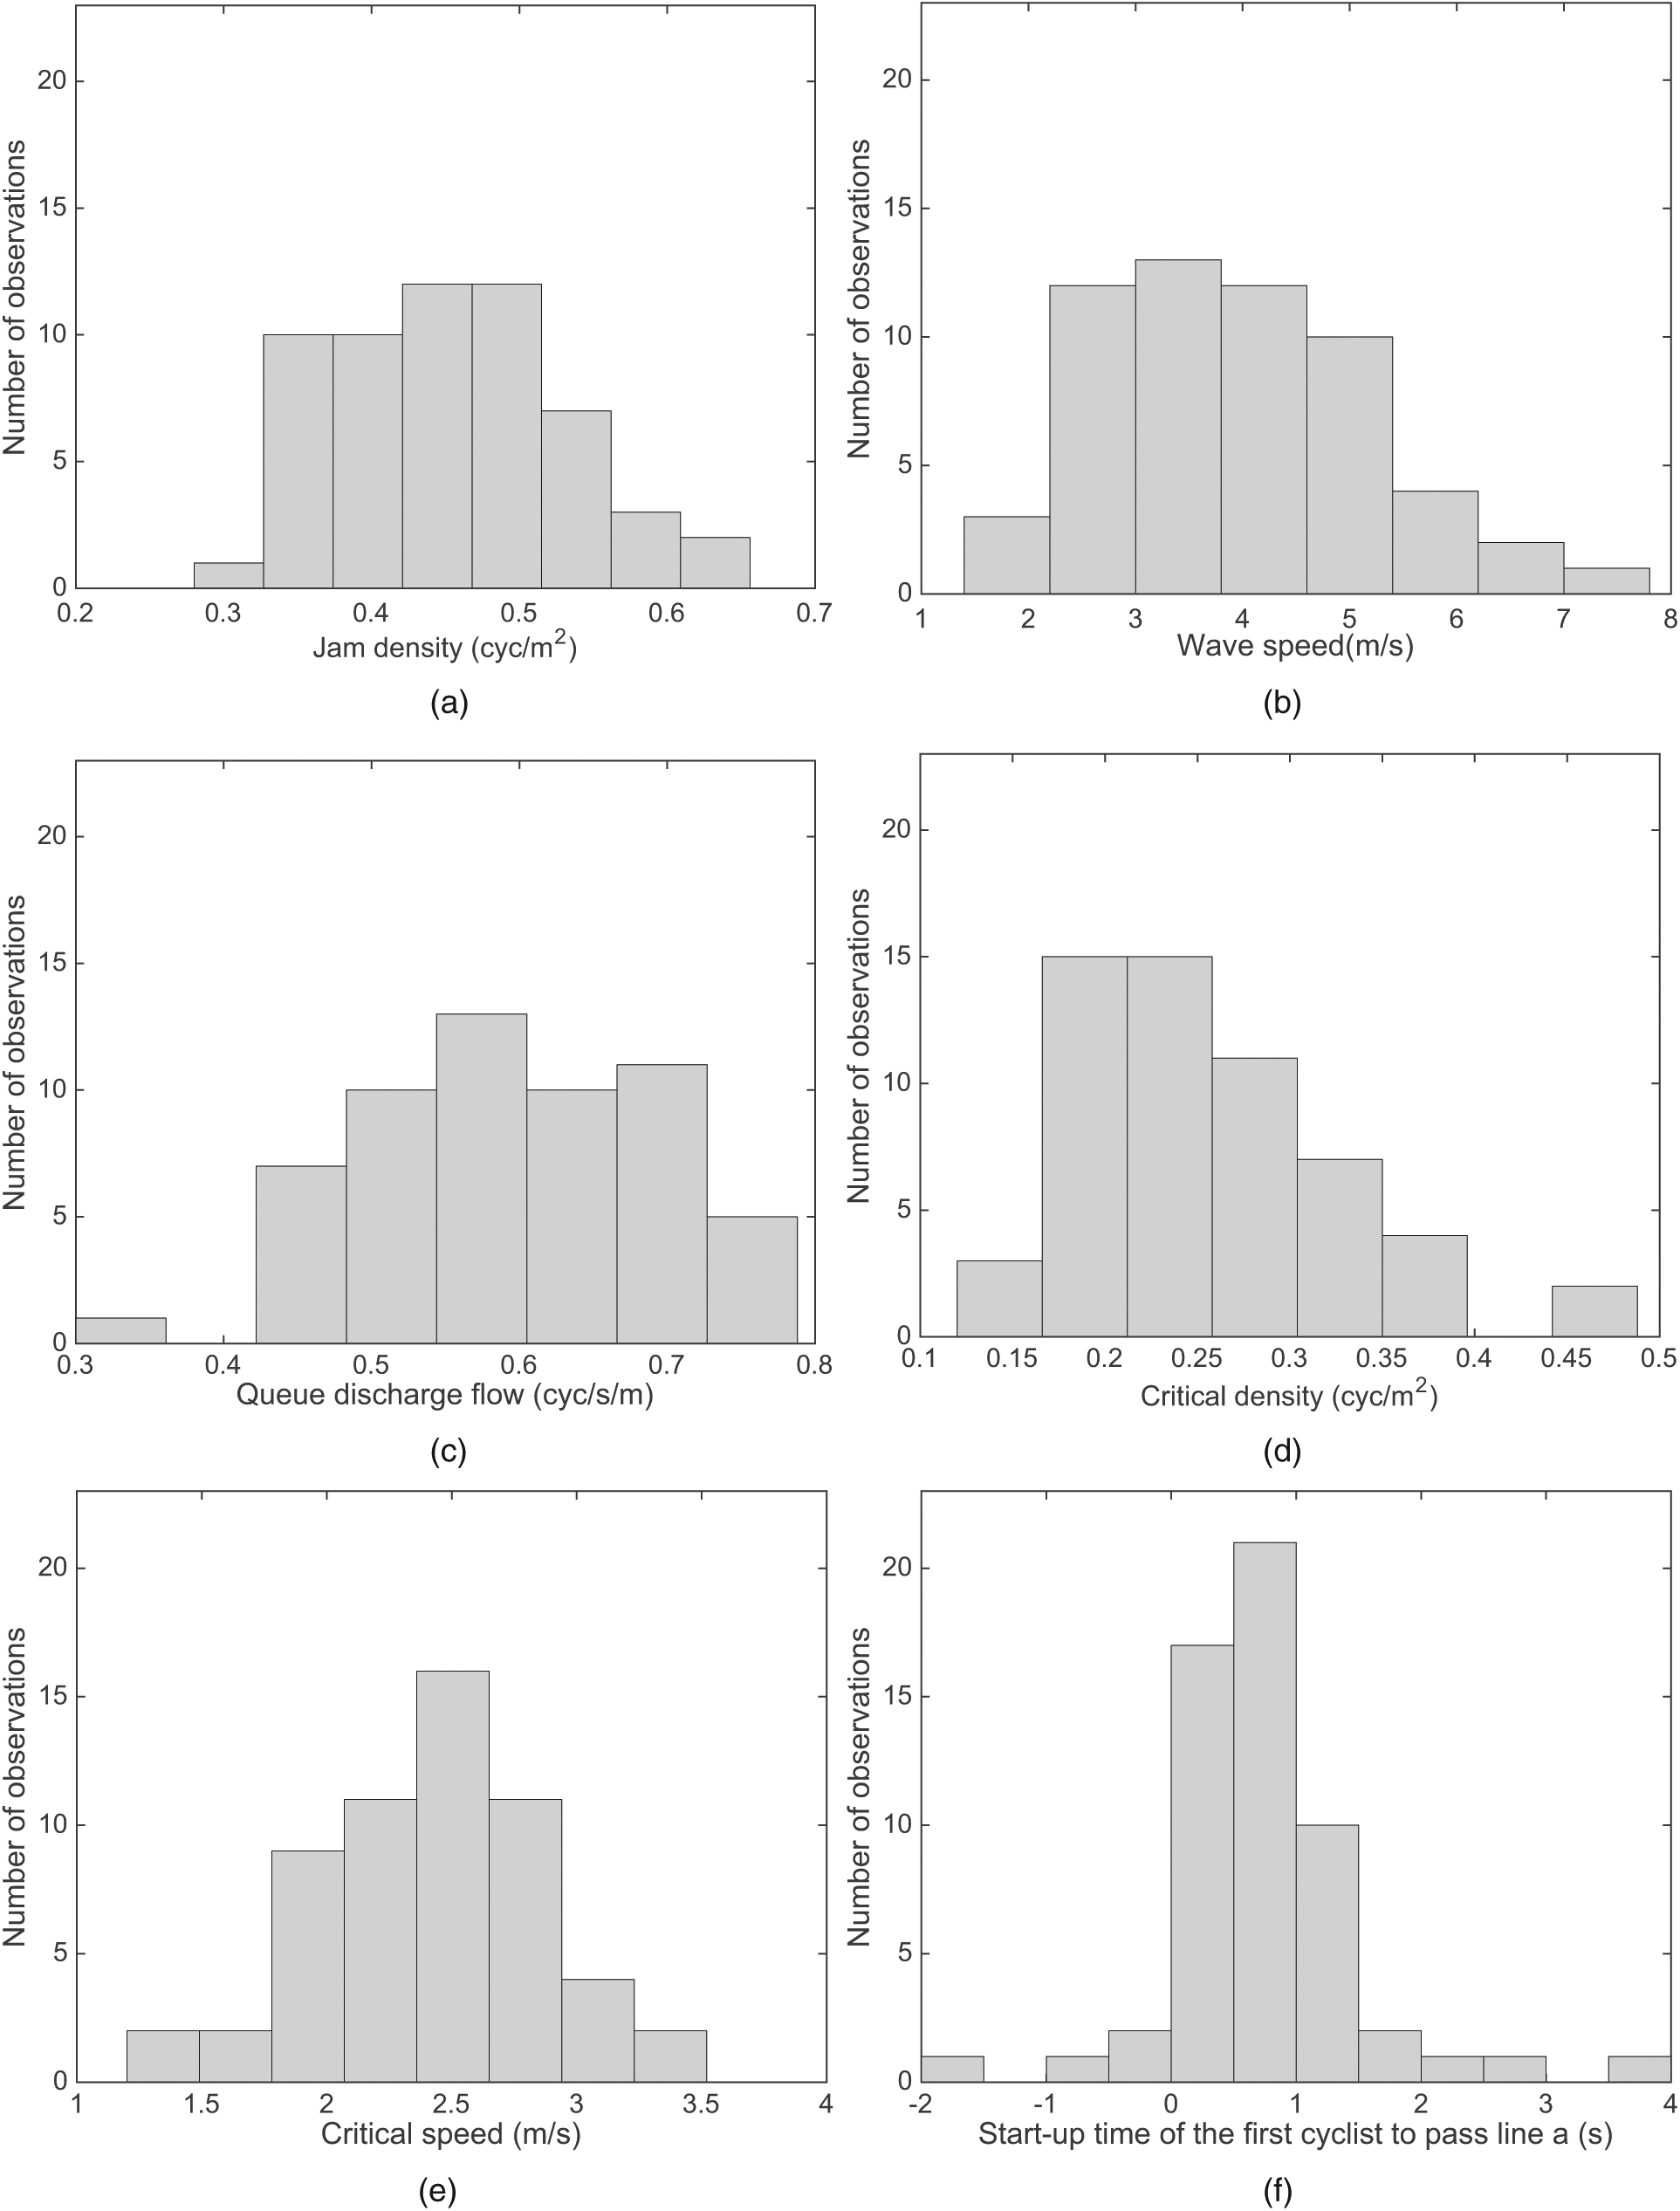
Frequency distributions of the measured quantities: (a) jam density; (b) wave speed; (c) queue discharge flow; (d) critical density; (e) critical speed; (f) start-up time.
Table 1 and Figure 4f also show the distribution of start-up times, which correspond to the length of the time period between the beginning of the green phase and the last time instant before the first vehicle to pass line
Relationships between Macroscopic Characteristics
The regression analysis results show that there is a positive linear relationship between discharge flow (
Model Estimation Results
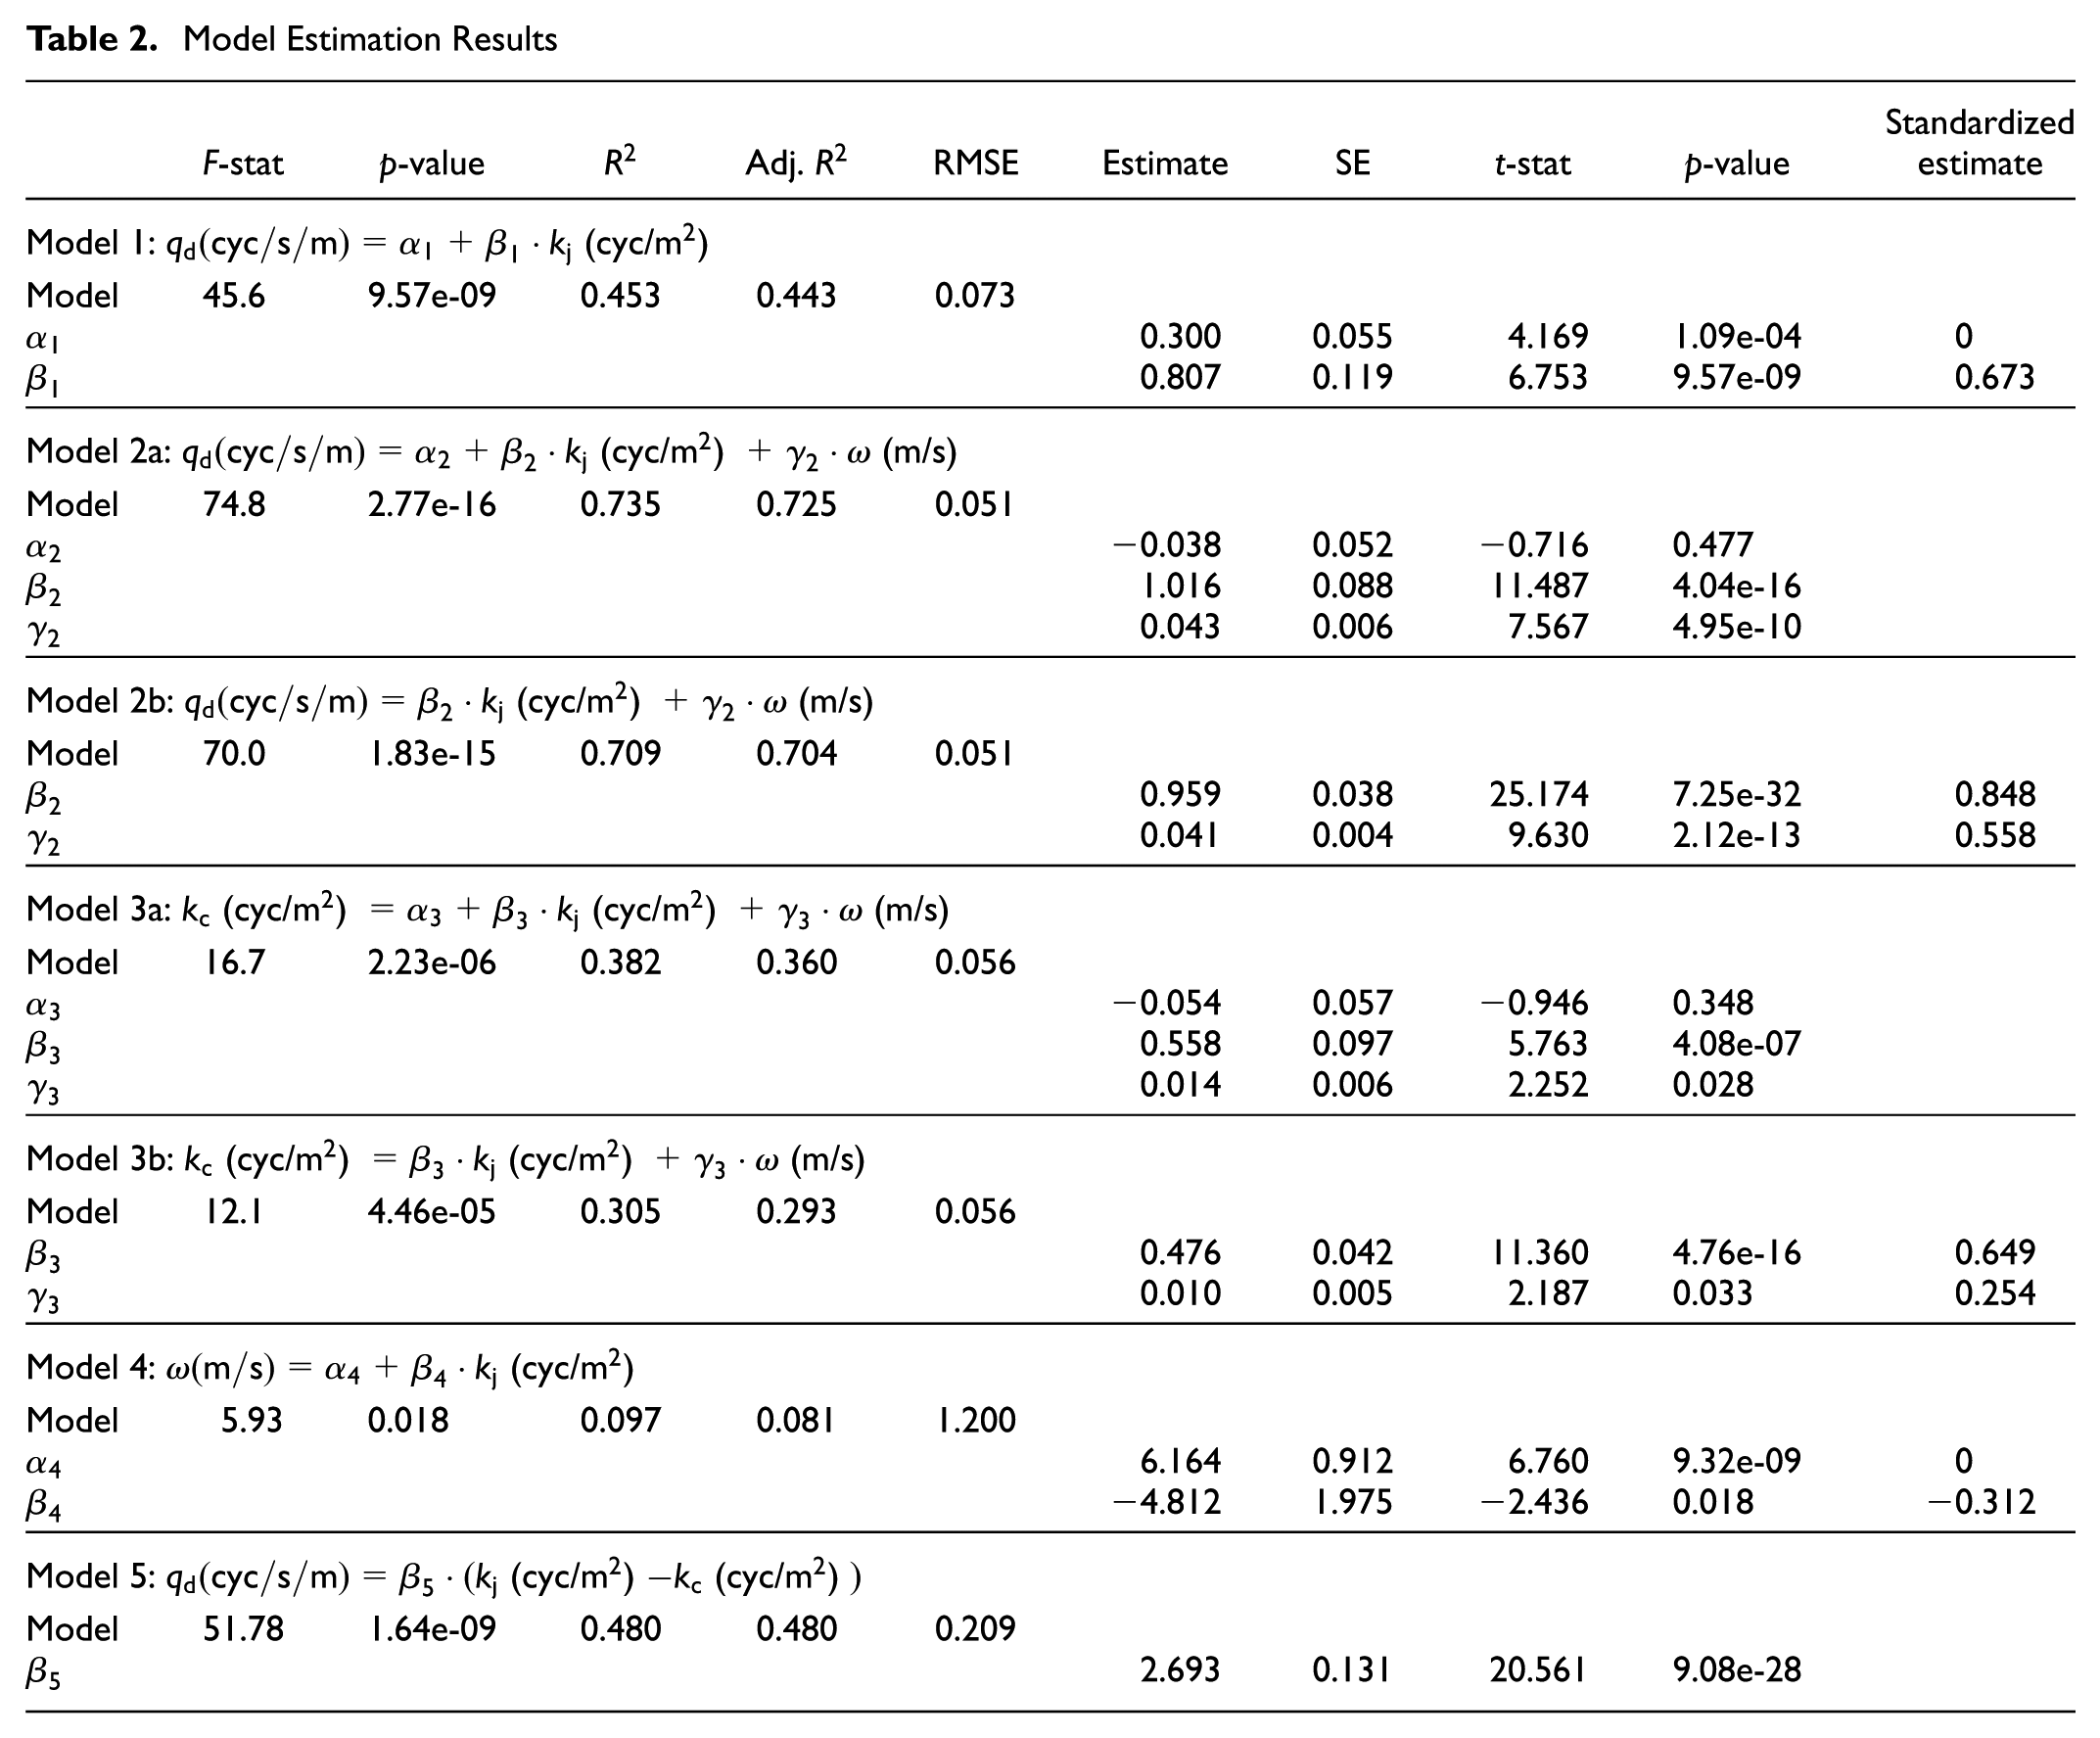
Finally, there is a positive linear relationship between discharge flow (
Possible Implications for Traffic Management
Although regression analysis can only establish correlation (not causation) between variables, it is hypothesized that discharge flow is actually influenced by jam density and wave speed (and possibly also by other factors not accounted for in this study, such as the way cyclists accelerate from standstill, and passing maneuvers during the queue discharge process). This hypothesis is assumed true in first-order traffic flow theory, as explained previously. It is argued that the hypothesis is plausible from a traffic-engineering viewpoint, at least within reasonable ranges of
In this respect, Model 2b suggests that, within the range of observed values, if both
Conclusions and Outlook
A proper understanding of the bicycle queue discharge process is crucial for developing ways to reduce delay at signalized intersections. The main goal of this study was to determine the macroscopic characteristics of bicycle flow during the queue discharge process, and to unveil possible relationships between them. To this end, the study analyzed bicycle trajectories from a one-way cycle path leading to a signalized intersection in Amsterdam. Jam density, wave speed, and discharge flow were measured for 57 queue discharge periods. Linear relationships between these macroscopic flow variables were established using regression analysis.
The results show that jam density, wave speed, and discharge flow vary considerably across traffic-signal cycles, although they are within the range of values reported in the literature. Further research is needed to establish the causes of this variability; however, its existence is a key finding that highlights the stochastic nature of bicycle flow. An important implication is that traffic engineers should take stochasticity into account when predicting bicycle flow dynamics at intersections. Moreover, the results confirm that discharge flow is positively linearly correlated with both jam density and wave speed, at least within the range of observed values. Also, discharge flow is positively linearly correlated to the difference between jam density and critical density, as expected from first-order traffic flow theory. However, it was found that this theory is not able to describe bicycle flow dynamics at intersections very accurately.
The data set analyzed in this paper is of limited size (57 discharge periods at only one intersection). An analysis of additional trajectory data, preferably from other sites (including intersections with two-directional cycle paths), is necessary to obtain more conclusive results. More specifically, data from other sites are crucial to identify the factors contributing to the variability of jam density, wave speed, and discharge flow at signalized intersections, as well as to establish more accurately the relationships between these variables. In this regard, it is necessary to investigate whether these relationships may be non-linear and also whether additional variables may need to be considered.
Although regression analysis cannot establish causation between variables (only correlation), it is hypothesized that discharge flow is actually influenced by jam density and wave speed, as generally assumed by traffic flow theory. Further experimental research may validate this hypothesis; nevertheless, two relevant implications follow from assuming it is true. The first one is that variability in jam density and wave speed in real bicycle queues may partially explain the differences in discharge flow reported in the literature. The second implication is that there is often room to fit additional cyclists in queues, and cyclists are able to start moving earlier, while increasing the discharge flow. This points to two potentially effective strategies to increase outflow at signalized intersections, and thus to reduce the delay experienced by cyclists (especially if queues are too long to dissolve completely during one green-signal phase): (a) increasing jam densities; and (b) increasing wave speeds.
However, more research is needed to determine whether it is possible to implement these strategies through specific traffic-engineering measures. To increase jam densities, one possibility could be to guide cyclists to certain locations during the queue-formation process by indicating ideal paths and/or stopping locations within the waiting area. A further possibility could involve installing static or dynamic information panels asking cyclists to stand close to each other. These panels could also be used to encourage cyclists to start moving early when the traffic light turns green, thus increasing wave speeds. In addition, it may be possible to increase wave speeds by installing traffic lights displaying the time left before the beginning of the green-signal phase; this may induce cyclists to get ready and start moving earlier. The potential effectiveness of these measures is not clear at this point and should be evaluated through field tests.
Footnotes
Acknowledgements
This research was supported by the ALLEGRO project (Unravelling slow mode travelling and traffic: with innovative data to create a new transportation and traffic theory for pedestrians and bicycles), which is funded by the European Research Council (Grant Agreement No. 669792), and the Amsterdam Institute for Advanced Metropolitan Solutions.
Author Contributions
The authors confirm contribution to the paper as follows: study conception and design: all authors; data collection: B. Goñi-Ros, W. Daamen; analysis and interpretation of results: B. Goñi-Ros, Y. Yuan, W. Daamen; draft manuscript preparation: B. Goñi-Ros, Y. Yuan; study supervision: S. P. Hoogendoorn. All authors reviewed the results and approved the final version of the manuscript.
The Standing Committee on Bicycle Transportation (ANF20) peer-reviewed this paper (18-04103).