
Abstract
The present study aims to add to the literature on driver workload prediction using machine learning methods. The main aim is to develop workload prediction on a multi-level basis, rather than a binary high/low distinction as often found in literature. The presented approach relies on measures that can be obtained unobtrusively in the driving environment with off-the-shelf sensors, and on machine learning methods that can be implemented in low-power embedded systems. Two simulator studies were performed, one inducing workload using realistic driving conditions, and one inducing workload with a relatively demanding lane-keeping task. Individual and group-based machine learning models were trained on both datasets and evaluated. For the group-based models the generalizing capability, that is the performance when predicting data from previously unseen individuals, was also assessed. Results show that multi-level workload prediction on the individual and group level works well, achieving high correct rates and accuracy scores. Generalizing between individuals proved difficult using realistic driving conditions but worked well in the highly demanding lane-keeping task. Reasons for this discrepancy are discussed as well as future research directions.
Research into driver workload has been conducted for at least three decades ( 1 , 2 ). Recently, research efforts have shifted to using powerful machine learning (ML) methods, giving promising results ( 3 , 4 ). ML methods have been used for other driver-related classification problems, such as driver distraction ( 5 ), driver interruptibility ( 6 ) or driver identification ( 7 ). The present study aims to fill the gaps in the existing research on predicting driver workload using ML methods in several ways, as will be explained in the next paragraphs.
First, ML studies into predicting driver workload often focus on a binary classification problem (high workload versus low workload). A more fine-grained prediction of workload may be desirable to enable adaptive interfaces for in-vehicle advice systems (IVIS), systems that may simplify their content ( 8 ), or driver assistance systems that may incrementally increase their level of support based on the level of driver workload. The experiments described in this paper attempt to predict workload on 7- and 10-point workload scales.
Second, studies to date often use intrusive sensors or measure variables (e.g., electroencephalogram, EEG) that are not practical in the driving environment [see for example ( 3 , 4 )]. Additionally, it is unknown how well results obtained by the high-grade intrusive sensors used in experiments translate to low-cost sensors. This work uses low-cost sensors that can be integrated into the real-world driving environment, and uses measures that can be obtained non-intrusively. This is important, because especially low-cost sensors are likely to be integrated into the driving environment in real-world applications.
Lastly, the models generated in most studies are not generally publicly available for use by the research community. The models developed in this study will be made available for scientific use after publication of results (https://github.com/paulvangentcom).
Research Objectives
The previous section outlined the main research gaps and ways to add to the present literature. This led to the formulation of three criteria for predicting driver workload in the present work. The main goal is to develop a workload algorithm that (a) has usable accuracy when predicting multiple workload levels, while generalizing among individuals; (b) uses data that can be measured with available low-cost sensors that can be integrated into the driving environment; and (c) is implementable on embedded hardware (for example in a smart steering wheel).
The first criterion (a), predicting workload at a higher resolution than the binary low/high found in previous literature, while generalizing among individuals, is addressed in the experimental design and data analysis presented in subsequent sections.
The second criterion (b) entails using sensor inputs from readily available, low-cost sensors that are easy to implement in the driving environment. By using low-cost sensors, which are likely to present more noise in the signal compared with high-end sensors, results will give a better reflection of real-world performance compared with studies using high-end sensors. Apart from having been used successfully in other workload prediction studies, selected variables should be measurable non-intrusively in the driving environment. This led to the selection of heart rate, skin response, blink rate and several performance measures [for an overview of the selection process, see ( 9 )]. This criterion ensures that any results are directly applicable to in-car settings at a low cost, and that results obtained are likely to translate well to real-world applications.
Criterion (c), ensuring the model is implementable on an embedded system, means it must be efficient both in memory use and in computational requirements. Two ML algorithms were selected that can satisfy this criterion: “Random Forest” and “Support Vector Machine” algorithms. Random Forests ( 10 ) are computationally efficient ( 11 ) but can have a large memory footprint. Solutions have been proposed that allow embedded implementations while maintaining performance ( 12 ), making this a suitable algorithm to use. Support Vector Machine ( 13 ) implementations can suffer from computational complexity, as well as high memory footprint for more complex models. Methods have been proposed, however, that achieve remarkable efficiency increases without sacrificing performance ( 14 , 15 ), making SVMs also a suitable candidate algorithm.
Two experiments were conducted to evaluate the feasibility of the previously defined criteria. First, a simulator experiment was performed, in which workload was induced using realistic driving situations. Results of this experiment were explored further using a dataset obtained from another driving simulator experiment that induced workload with a demanding lane-keeping task. At the end of this paper, the results of both experiments are discussed and future steps are outlined.
Estimating Workload in a Realistic Driving Scenario Study
To assess the feasibility of predicting driver workload in realistic driving settings, a simulator study was performed. The main goal was to evaluate the prediction of multi-level driver workload in realistic driving conditions.
Methods
Equipment
The study was performed in a fixed-base, medium-fidelity driving simulator. A dashboard mockup with three 4K-displays (resolution 4096 * 2160 px) provided roughly 180° vision. Actuators consisted of a Fanatec steering wheel and pedals, and a custom blinker control. The simulation ran in Unity3D. The simulated vehicle had an automatic gearbox and a top speed of 165 km/h. Figure 1a illustrates the setup.
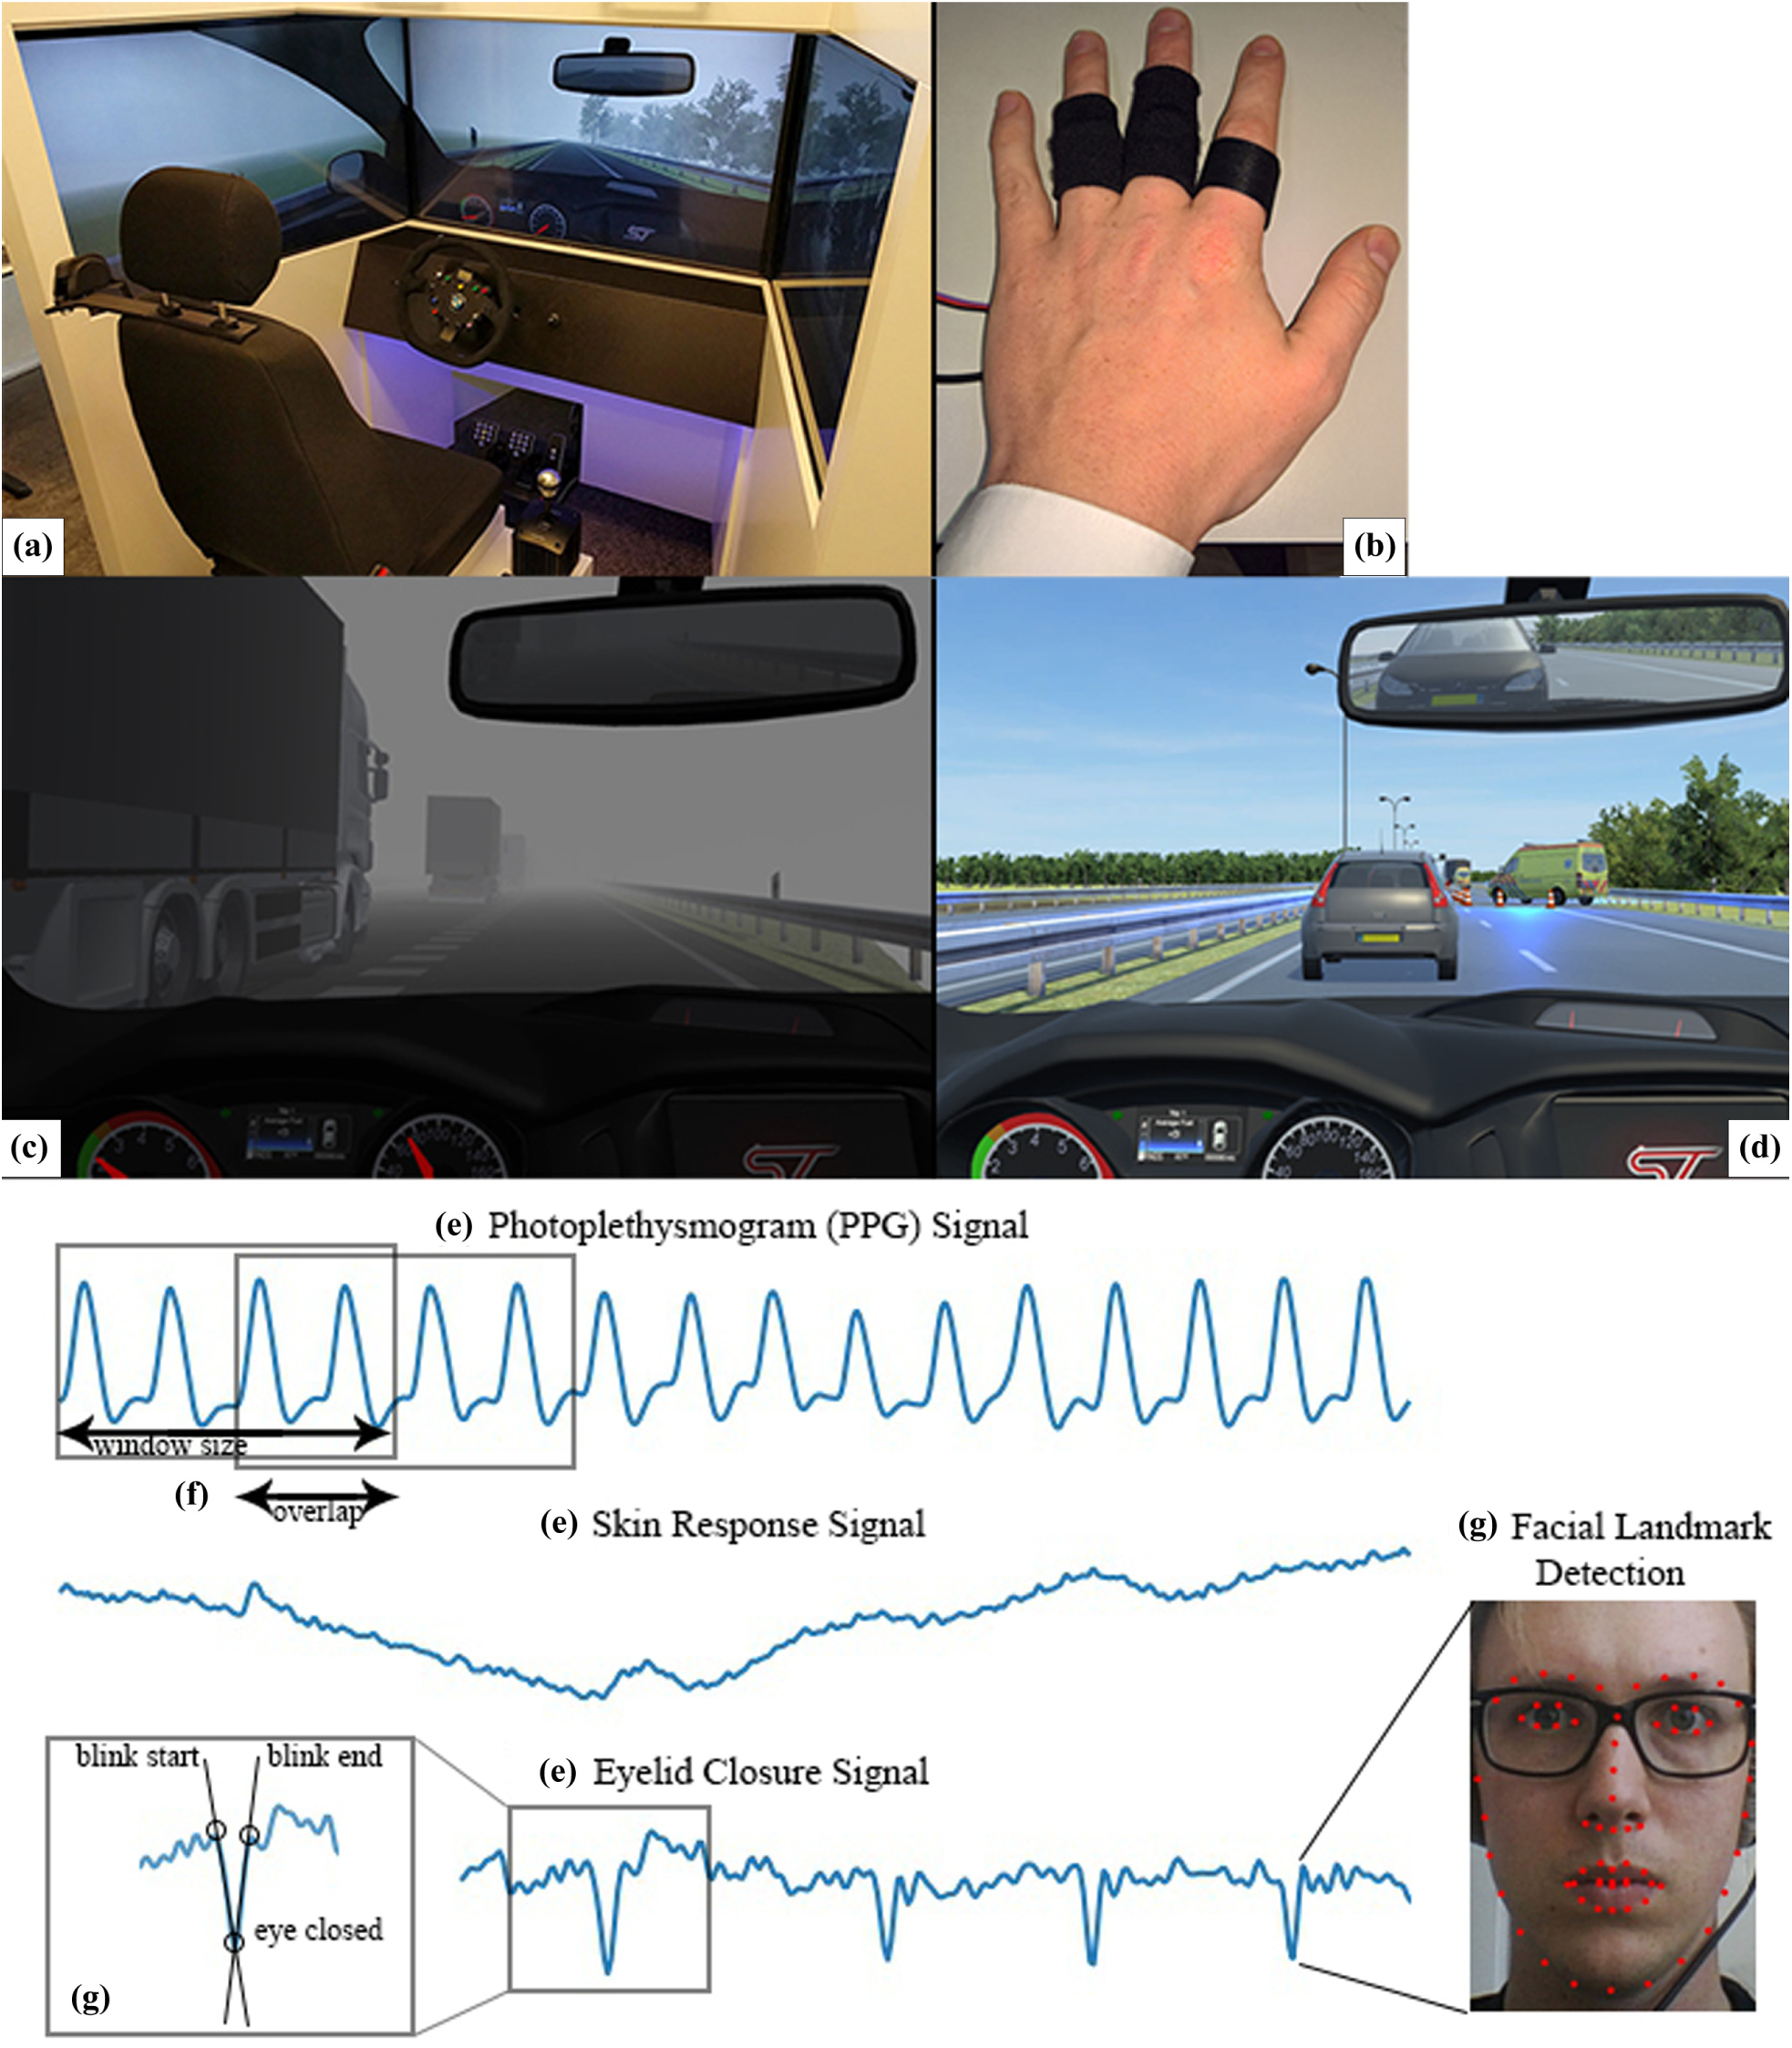
Figure showing (a) the simulator setup, (b) physiological sensors, (c) the merging of a platoon of trucks in dense fog, (d) the accident site at the end of the “high workload” scenario, (e) examples of the raw signal data, (f) the concepts of window size and overlap factor, and (g) an example of the facial landmark detection and the resulting process of analysing the blink rate signal.
Physiological data were recorded at 100 Hz, using low-cost sensors powered by an Atmel ATMega328p embedded processor board. Heart rate was recorded using a photoplethysmographic (PPG) method ( 16 ) at the left index finger. Skin response was recorded at the middle and ring finger of the same hand (see Figure 1b). Additionally, blink data were recorded using a GoPro HERO+ camera on the dashboard, running at 1080p at 30 Hz. Simulator data were logged at 50 Hz.
Simulator Scenarios
Two scenarios were created in Unity3D, one scenario with situations likely to induce high workload (“high workload” scenario) and one with situations that are not likely to induce high workload (“low workload” scenario). Road geometry was based on a part of the Cooperative-ITS (C-ITS) corridor in the Netherlands: the A67, a two-lane highway between Eindhoven and Venlo with a speed limit of 130 km/h. Three weather conditions were designed for each scenario: clear weather, and two levels of fog with visibility of approximately 150 m (“light fog”) and below 25 m (“heavy fog”). This gave a total of six scenarios.
To accurately design the road geometry, CAD drawings of the road segments were secured from the open data program of the Dutch government (https://data.overheid.nl). Using Autodesk 3DS Max, the data in the CAD files were converted to 3D models and textured. The surrounding terrain was generated using height map data obtained from the Microsoft Bing Maps API (https://www.bingmapsportal.com/). Canals and wooded areas were extracted automatically from satellite imagery, and adjusted by hand if necessary. The location, shape, and content of traffic signs were inferred from Google Street View, designed in 3DS Max and manually placed at the corresponding locations in the scenario.
The “high workload” scenario was 15.9 km in length, and ran between Eindhoven and Someren. Participants would encounter several workload-inducing “events” spread out across the scenario. After accelerating across an on-ramp, the first event was encountered: participants had to merge into a dense platoon of trucks (4–5 m headway, Figure 1c), a maneuver shown to increase workload on the driver ( 17 ). The second event was encountered 2 km downstream and consisted of a segment of slow-moving traffic in the right lane, designed to nudge the participants to drive in the left lane. While passing the slow-moving traffic, an ambulance approached from behind exhibiting auditory and visual signals, traveling at the maximum speed legally allowed in the Netherlands (170 km/h, a maximum of 40 km/h difference from other traffic). This placed the participant in the demanding situation of quickly having to find a gap in the much slower moving lane to the right and perform a merging maneuver. The third event was a game of “20 questions” ( 18 ), intended to simulate an engaging (phone) conversation. By asking at most 20 polar (yes/no) questions, participants had to guess which animal, object, or person the experimenter had in mind. The final event came near the end of the scenario. The right lane was closed off because of an accident, with slow-moving (<15 km/h) traffic in the left lane (Figure 1d). The 20 questions game was played until the accident site was reached. If participants finished early, the game was restarted with a different subject. After this, participants took the next exit and stopped the car.
The “low workload” scenario consisted of self-paced driving in light traffic for 20.5 km. The simulated road was a replica of the A67 road between Someren and Venlo. There were no events. Participants drove until reaching a designated exit, where they stopped the car.
Experimental Procedure
Approval for the study was obtained from the ethics committee at Delft University of Technology. Participants drove the six scenarios spread out over three separate days, each day driving one randomly assigned “high workload” and one “low workload” scenario. This approach was taken because physiological measures can vary from day to day, as well as to avoid a fatigue effect from asking participants to drive six 10–15-min scenarios consecutively.
In the “high workload” scenario, participants were asked to rate their experienced mental effort and task difficulty on a seven-point scale after each event, leading to six workload data points per run. In the “low workload” scenario, the questions were asked at fixed positions in the scenario, leading to four workload data points per run. The exact questions were “How much mental effort did the driving task take in the last few moments, on a scale of 1–7?” and “How difficult was the driving task in the last few moments, on a scale of 1–7?”. Scale labels ranged from very low/easy, to very high/difficult, and were explained to participants before the experiment started. Note that the study did not use a standardized workload scale such as the NASA Task Load Index (TLX) or Rating Scale Mental Effort (RSME), because the intent was to keep interaction time with and demands on the driver to a minimum.
Participants who registered for the experiment received a copy of the informed consent. It was signed and brought to the first session. After being seated in the simulator, a relaxation period of 3 min was given to the participants. This was to allow the physiological measures of each participant to return to their baseline. Sensors were attached, after which the signal quality was checked. A physiological baseline was recorded first. After the baseline, it was briefly explained to the participant that there would follow a drive on a segment of the A67 highway. Participants were instructed to drive at their own pace, but not exceed the speed limit as indicated on roadside signs. If a participant was unfamiliar with “20 questions,” a test round was played to familiarize them with the game.
Data Analysis
Participants were asked to rate their mental effort and driving task difficulty on a seven-point scale. Because querying the driver might influence workload, the “high workload” scenario was constructed in such a way that there was at least 1 min of driving between each two events, to allow signals to return to baseline. The data recorded between two events were not used in the analysis. In the case of the “low workload” scenario, 1 min of data following each question was excluded from the analysis.
Preprocessing of Physiological Data
An algorithm was developed to extract the most commonly used features from the measured heart rate signal ( 19 , 20 ), using a sliding window approach (see Figure 1f). The output measures are divided into time-domain ( 21 ) and frequency-domain measures ( 22 ). In the time domain, the measures included are BPM (beats per minute), IBI (interbeat interval), MAD (median absolute deviation of intervals between heart beats), SDNN (standard deviation of intervals between heart beats), RMSSD (root mean square of successive differences between neighboring heart beat intervals), SDSD (standard deviation of successive differences between neighboring heart beat intervals), and the pNN50 and pNN20 (proportion of differences between successive heart beats greater than 50 ms and 20 ms, respectively). In the frequency domain, included measures are LF (the low frequency band: 0.04–0.15 Hz), which is related to short-term blood pressure variation, and HF (the high frequency band: 0.16–0.5 Hz), which reflects breathing rate, and the LF/HF ratio, a measure of sympathetic–parasympathetic balance ( 22 , 23 ).
Skin response consists of a tonic and phasic component ( 24 ). Tonic represents the long-term, slow variation in the signal, indicative of general psycho-physiological arousal ( 25 ). Phasic reflects relatively quick responses to discrete external stimuli, occurring generally 1–3 s after stimulus onset ( 25 ). Power in the frequency spectrum of skin response between 0.03 Hz and 0.5 Hz has been linked to short-term workload changes ( 26 ). The mean, max-min difference, MAD (median absolute difference), and 0.03–0.5 Hz frequency spectrum were extracted from the GSR (galvanic skin response) signal, using the same window approach as for heart rate. Frequency spectra were extracted using a trapezoidal integration of the area under corresponding frequency bands in the power spectrum.
Blink data were detected offline from recorded video data. An algorithm was developed to extract blink number, blink duration, and interblink interval. It functioned by detecting 68 “facial landmarks” ( 27 ), then calculating eyelid distance for each frame. Blinks were detected in the resulting signal by finding large slopes, then finding the lowest point of reversal. The process is displayed visually in Figure 1g.
Driver Performance Data
Performance measures reflect how the control the driver exerts over the vehicle varies across conditions. The study included steering wheel angle, steering wheel reversals, speed, variation in lateral and longitudinal position, and headway and time to collision when available (for more information, see [ 9 ]).
Generating Machine Learning Sets
Machine learning sets were generated from the raw data and labeled based on self-report data, by varying window size and overlap factor. Window size refers to how much data is used for the calculation of features, and overlap factor refers to how much data any window Wi shares with the previous window Wi-1. Both concepts are visualized in Figure 1f. Window sizes of 5, 10 and 30 s, and overlap factors of 0% and 50% were used, leading to a total of six sets.
Model Development and Evaluation
Two different ML algorithms were used: a Random Forest Regressor (RFR), and a Support Vector Machines Regressor (SVR). The RFR creates an ensemble (forest) of regression trees in which each tree is trained on a random subset of the features. They have been used in, for example, ( 28 ). Support Vector Machines function by mapping the data to a higher dimensional space, and solving an optimization problem to identify a set of hyperplanes that separate the training data into classes. They have been used in for, example, ( 5 , 7 ). With the SVR, the Polynomial kernel [SVR(poly)], and the Radial Basis Function kernel [SVR(rbf)] were evaluated. Algorithms that were used are taken from the SciKit-Learn repository ( 29 ).
The resulting models were evaluated using several metrics. Model error was evaluated using mean absolute error (AE µ ) and median absolute error (AEµ1/2), both measures of the accuracy of the predictions. The coefficient of determination (R2) was also computed as a goodness-of-fit measure. Performance for class-based predictions was also evaluated, expressed as correct rate.
Results
Participants
Nineteen participants took part in the experiment. Data from one participant were excluded because of a failure to understand some tasks, caused by a language barrier. This left 18 participants, of whom 12 were males and six were females. The average age was 34.56 years (SD 10.09). Of the 18 participants, 12 owned a car and reported using it three to four times a week on average, and traveling between 2,500 and 15,000 km annually. All participants held a valid driver’s license. No simulator sickness severe enough to terminate a driving session was reported. Reported mental effort and perceived difficulty correlated with weather conditions and with scenario type independently and in line with expectations, although no interaction effect was present ( 9 ).
Individual Models
The training and testing sets for the individual models were generated by dividing the dataset of each driver into training and testing sets with an 80% to 20% split ratio, respectively. This split ratio was chosen to ensure sufficient training data, as individual datasets were relatively small.
The results indicated that the models functioned well, with the RFR outperforming the SVR. For all individual models with a window size of 5 s and overlap of 0%, the AE µ was 0.343, the AEµ1/2 was 0.129, R2 was 0.679, and Correct Rate (CR) was 76.30% when predicting discrete classes, and 93.80% when miss-by-one errors were allowed (CR+/−1). This indicated that, on average, predictions were off by 0.343, and that half the predictions had an error of less than 0.129, from a total scale of seven classes. See Table 1 for an overview of all results. Model performance increased with a larger overlap factor. This was expected, because a larger overlap creates a larger training set to fit the model to, and because a larger overlap factor indicates more shared variance between adjacent samples. Interestingly, an inverse relationship between window size and model performance was observed, contrary to what has been reported previously ( 3 ). Miss-by-one errors indicate predictions that are “almost correct,” and still contain enough information about the true workload states. For example, if workload is predicted as “6” but the true value is “7,” the information in the prediction is still useful: in either case workload is on the high end.
Performance Metrics RFR Models
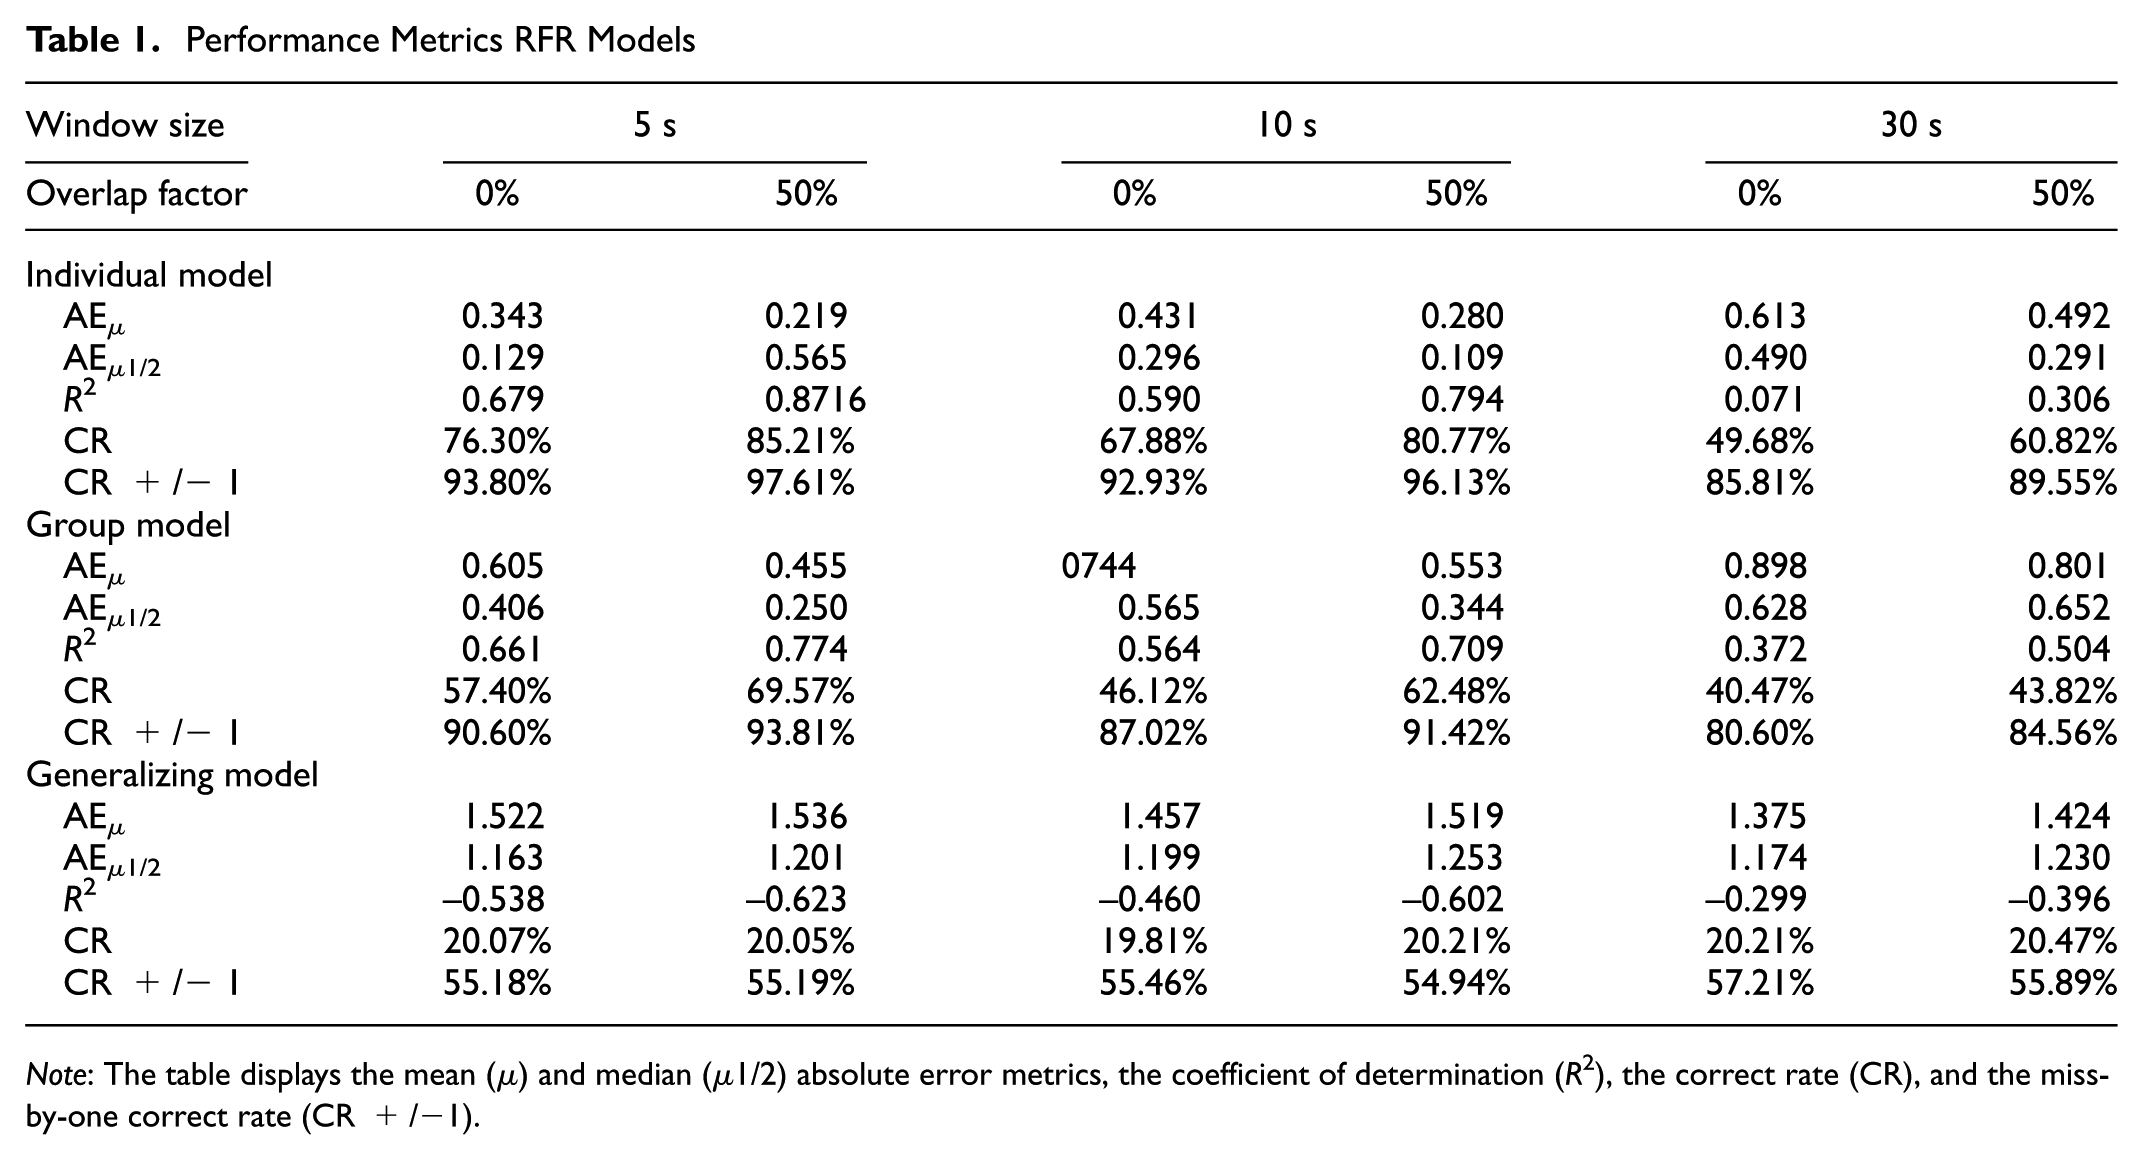
Note: The table displays the mean (µ) and median (µ1/2) absolute error metrics, the coefficient of determination (R2), the correct rate (CR), and the miss-by-one correct rate (CR +/−1).
Group Models
The second step was to estimate the model performance within the entire group. The dataset containing data from all drivers was split into training and testing sets with a 60% to 40% split ratio. Because the size of the group dataset was much larger compared with the individual dataset, a more stringent split ratio could be chosen while maintaining a sufficiently large training set.
Results indicated group models performed well. The AE µ for the model with window size 5 s and 0% overlap was 0.605, the AEµ1/2 0.406, R2 0.661, CR 57.40%, and CR+/−1 90.60%.
Generalizing Group Models
The last step was to assess how models would perform in a realistic setting, such as a setting in which workload from an unknown driver is predicted based on data from a pool of other drivers. To achieve this, data were sampled using a k-fold approach, with k = Nparticipants. For every ki, the training set consisted of all data except the held out participant ki. Workload for participant ki was then predicted and model performance evaluated. This method simulated how the trained models would perform when predicting data from previously unseen individuals. This obtained performance measure reflects real-world settings, in which it is impractical for models to be trained on all possible drivers and generalizing power is thus preferable.
Results showed that models did not perform well when generalizing to unknown drivers. The AE µ for all individual models with window size 5 s and 0% overlap was 1.522, AEµ1/2 was 1.163, R2 was −0.538, CR 20.07%, and CR+/−1 55.18%. The strongly negative coefficient of determination suggests unsatisfactory performance (the mean of the data is a better predictor than the trained model). The relatively low (though above chance level, not satisfactory) absolute error rates given R2 are explained by a class imbalance in the dataset, in which two classes (workload levels 1 and 2) dominate. To assess whether this was a possible cause for the poor performance of the models, data were resampled using SMOTE (Synthetic Minority Over-Sampling Technique) ( 30 ). This had little discernible effect on the model performance, and it was concluded that low performance was not caused by the class imbalance in the dataset. It was also observed that R2 increases slightly with increasing window size, in accordance with earlier studies ( 3 ) and contrary to the individual and group models in the present study.
Conclusion
The results of this study showed that predicting self-reported workload in a simulated realistic environment was possible at the individual and group level, but proved difficult when generalizing to unknown drivers. Several causes can be identified. The simulated scenarios might not have induced sufficient workload to be measurable with performance or physiological measures. Indeed, most participants indicated that driving in the simulator felt very different from actual driving, and was not that difficult at all. Because a self-report measure was used, which is a subjective measure, it is possible that different participants had biased response tendencies. Lastly, it might also be the case that different physiological response patterns to workload exist, in which case the sample size of 18 could have been too small to account for all occurring patterns.
This raises the question of whether workload prediction is at all possible on non-binary scales, while generalizing across drivers. To further explore this possibility, a dataset from a study with a lane-keeping task was obtained. This study and the results are discussed in the next section.
Estimating Workload in a Forced-Pace Simulator Study
A dataset was re-used from a previously executed study by Melman et al. ( 31 ) to further assess multi-level workload prediction in drivers. The study featured a challenging lane-keeping task, which had the potential to induce higher workload than the previous study. The same physiological and performance measurements were used as in the previously described simulator study.
Method
Equipment
The study was performed in a fixed-base driving simulator at the faculty of Aerospace Engineering, Delft University of Technology. The simulator consisted of a mockup dashboard with three LCD projectors (BenQ W1080ST 1080p) that provided roughly 180° vision. The simulated vehicle had an automatic gearbox and a top speed of 210 km/h.
Physiological data were logged using a biosignalsPlux wireless hub at 1000 Hz. Heart rate was recorded using three pregelled Ag/AgCl (silver/silver chloride) electrodes at the heart’s v3-node. Skin response was measured using the same pregelled electrodes, placed inside the palm and on the wrist of both hands. Simulator data were logged at 100 Hz.
Scenarios
The scenarios used to induce workload in drivers each consisted of a 25-km long, single-lane road. The road was divided into four 6-km sections of different lane width (3.6 m, 2.8 m, 2.4 m, 2.0 m). Each section had seven curves, five with an inner radius of 750 m and two with a 500-m radius. Transitions between sections of different width always took place in a 750-m radius curve, and were preceded by a road sign indicating a narrowing road. The four sections were identical, with the exception that the curves of segments 2 and 4 four were mirrored with respect to sections 1 and 3.
Cones were placed 8 m apart on the road markings on both sides of the road. The main task was to hit as few cones as possible. A cone hit was indicated to the participant visually by a red dot on the side of the car where the cone was hit, and by a loud auditory beep. Extra difficulty in lane keeping was induced by a perturbation added to the vehicle’s lateral motion. This perturbation was an unpredictable multi-sine signal with five frequencies between 0.067 Hz and 0.25 Hz, with a maximum summed amplitude of 1,000 N. Without the perturbation, lane keeping (especially on straight segments) was not considered challenging enough. The width of the simulated vehicle was 1.8 m.
Three runs were driven with the aim of inducing different levels of workload: a self-paced run and two forced-pace runs of 90 km/h and 130 km/h. In the self-paced run, participants had full longitudinal control over the car and could drive at their own pace. In the forced-pace conditions, however, the car’s speed was automated and kept constant at 90 km/h and 130 km/h. This would push participants into curves at high speeds, with the goal of raising their workload significantly. The three runs were presented to the participants in randomized order.
Procedure
Participants read and signed an informed consent form, informing them of the purpose and procedure of the study. Participants were instructed that the main task was to minimize the total number of cone hits. Furthermore, participants were informed that during the experiment, a beep would sound every 20 s. At the sounding of this beep, participants were asked to verbally answer the question “From 0 to 10, how much effort does the current driving task take you?” with 0 being “no effort,” 5 being “moderate effort,” and 10 being “a lot of effort.”
Before the experiment started, participants were familiarized with the simulator and the procedure by driving two 3.7-km trial runs. The first trial run was self-paced, the second was forced-pace with a speed of 110 km/h. After the trial run, any question the participant had was answered. The electrodes were attached, and a 1-min baseline was recorded.
Analysis
Participants rated their mental effort on a scale of 0–10, every 20 s. This rating was annotated by the experimenter and added to the dataset. What data were logged, data preprocessing, ML set generation, model development, and evaluation are identical to what has been described in the previous study.
Results
Participants
In total 24 participants took part in the experiment (17 male, seven female). The average age was 24.6 years (SD 2.4). Participants reported driving multiple times a week (11 participants), at least once a month (7 participants), or less than one month (6 participants). All participants held a valid driving license. Reported mental effort was sensitive to the lane width variations, although with respect to speed only to the 130 km/h forced-pace condition ( 31 ).
Individual Models
As in the previous study, training and testing sets for the individual models were generated by dividing the dataset into two stratified sets. More data per participant were collected than in the previous experiment, so data were split with the more stringent 60% to 40% split ratio.
Results were similar to the previous study, and indicated that the models performed well, with RFR outperforming SVR. An inverse relationship between model performance and overlap factor was observed, as well as increasing performance with increasing overlap factors, both as in the previous experiment. For all individual models with a window size of 5 s and overlap of 0%, the AE µ was 1.046, the AEµ1/2 0.662, R2 0.635, CR 40.74%, and CR+/−1 77.31%. The relatively larger absolute errors, compared with individual models in the previous study, might have resulted from the wider workload scale, the different nature of the driving task, or the more frequent reporting of mental workload. More information is displayed in Table 2.
Performance Metrics RFR Models
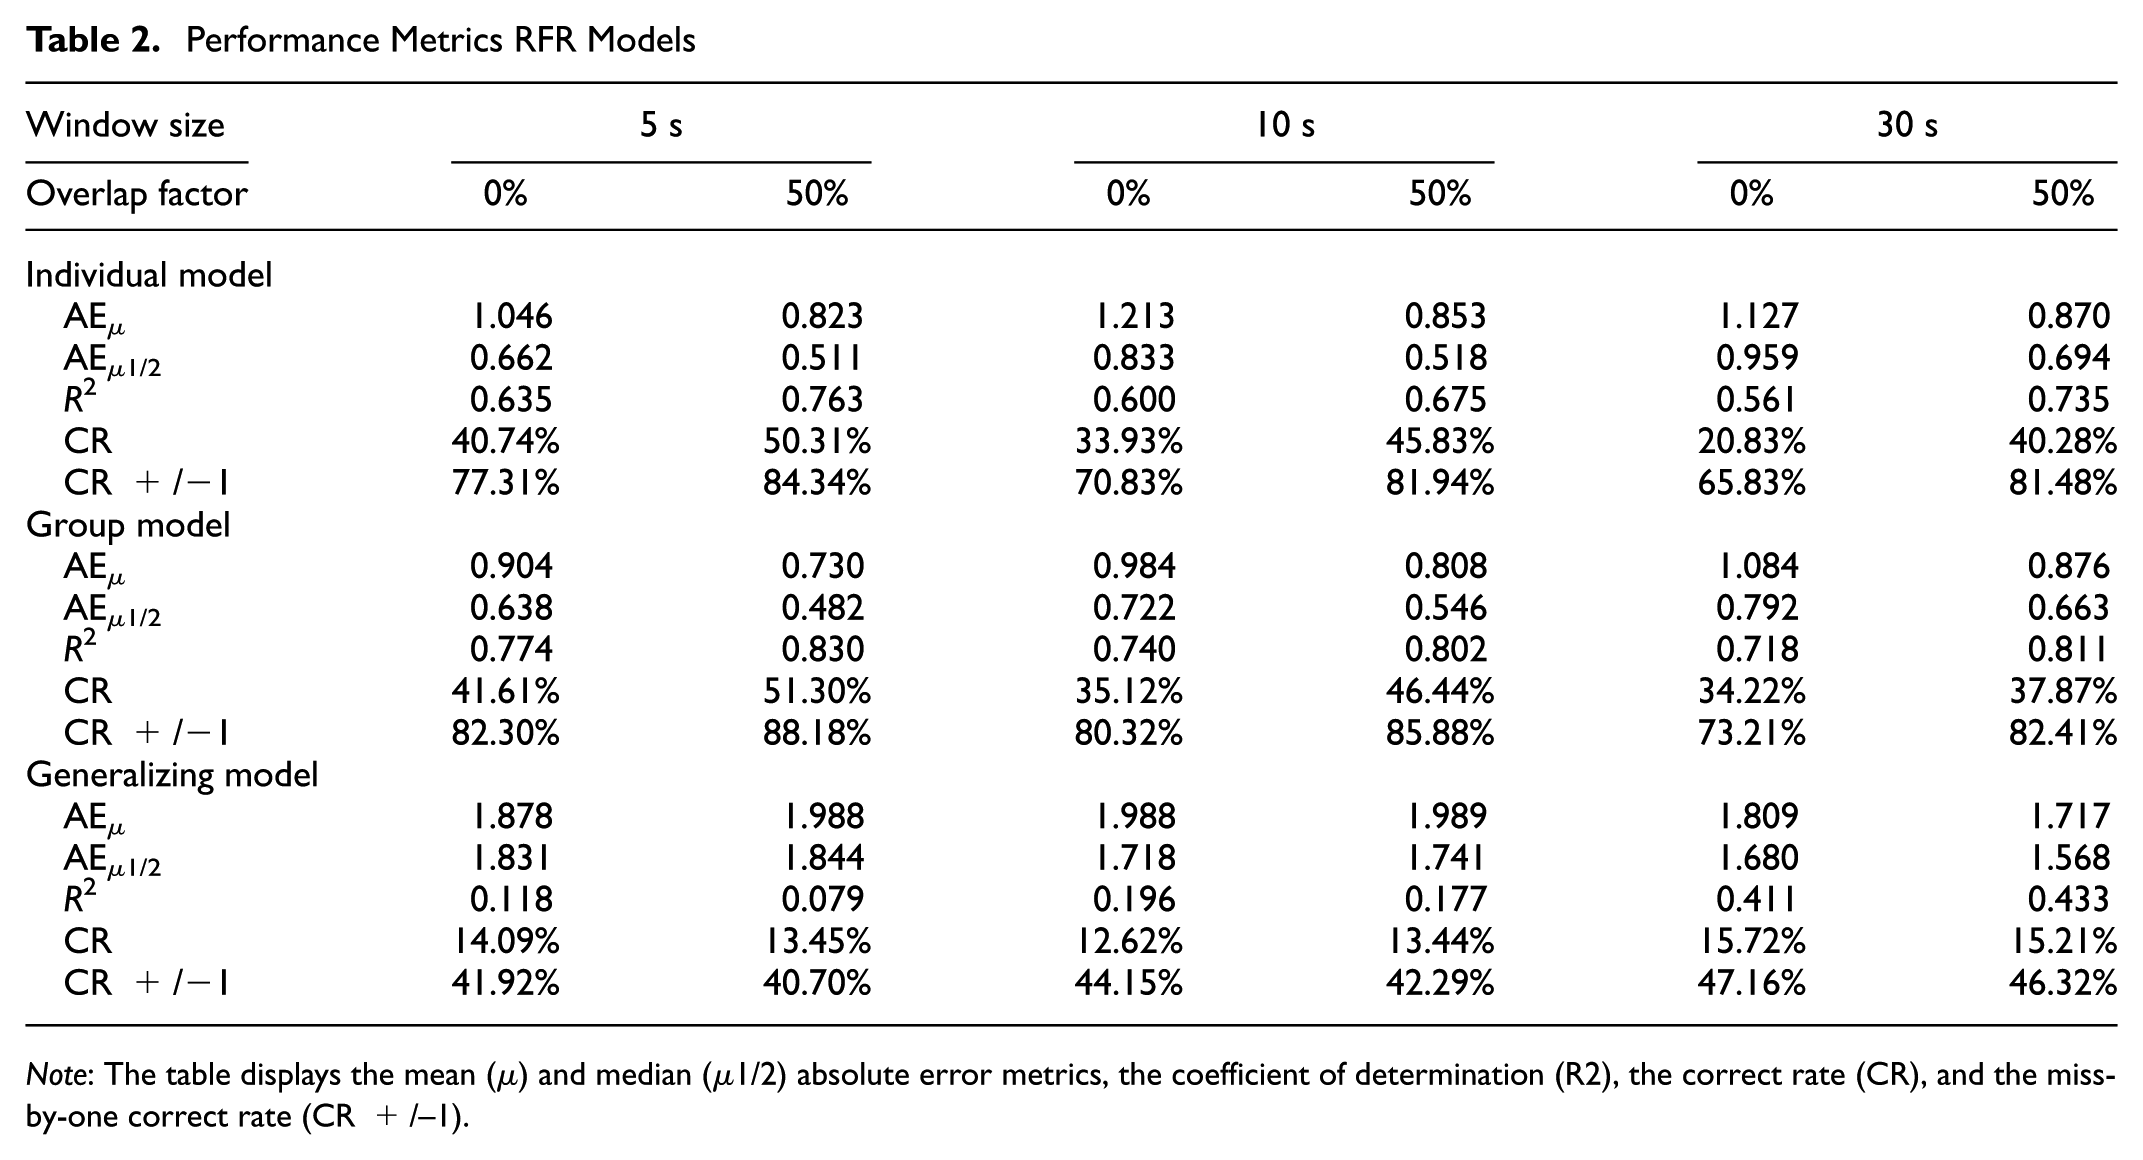
Note: The table displays the mean (µ) and median (µ1/2) absolute error metrics, the coefficient of determination (R2), the correct rate (CR), and the miss-by-one correct rate (CR +/–1).
Group Models
To evaluate performance at the group level, data were split with a 60% to 40% split ratio. Results indicated group models attained high performance. For the model with window size 5 s and 0% overlap, the AE µ was 0.904, the AEµ1/2 0.638, R2 0.774, CR 41.61%, and CR+/−1 82.30%. Table 2 displays the full results. Performance increased with larger overlap factors, and again a (weak) inverse relationship between performance and window size was observed.
Generalizing Group Models
Model performance when generalizing to unknown individuals was then assessed, which had not performed well in the first simulator experiment. Data sampling methods were identical to the previous study.
Results indicated models performed moderately well. For the best performing model with window size 30 s and 50% overlap, the AE µ was 1.717, the AEµ1/2 1.568, R2 0.433, CR 15.21%, CR+/−1 46.32%. Although model absolute error was relatively large, the coefficient of determination indicated a moderate relationship between model and data. Figure 2 displays the predicted and true values for the first four participants. Individual model performance varied, with workload being predicted well for some participants, whereas for others it showed a correct trend but with a constant offset error. These offset errors inflated the absolute error rates and deflated the predictive accuracy despite good model performance. In general, a decreased performance with increased overlap factor was observed (except for the largest window size of 30 s), as well as increased performance with increased window size. The effect is similar to results for the model generalization step in the previous study, but more pronounced. The effect also corresponds with what has been reported before ( 3 ).
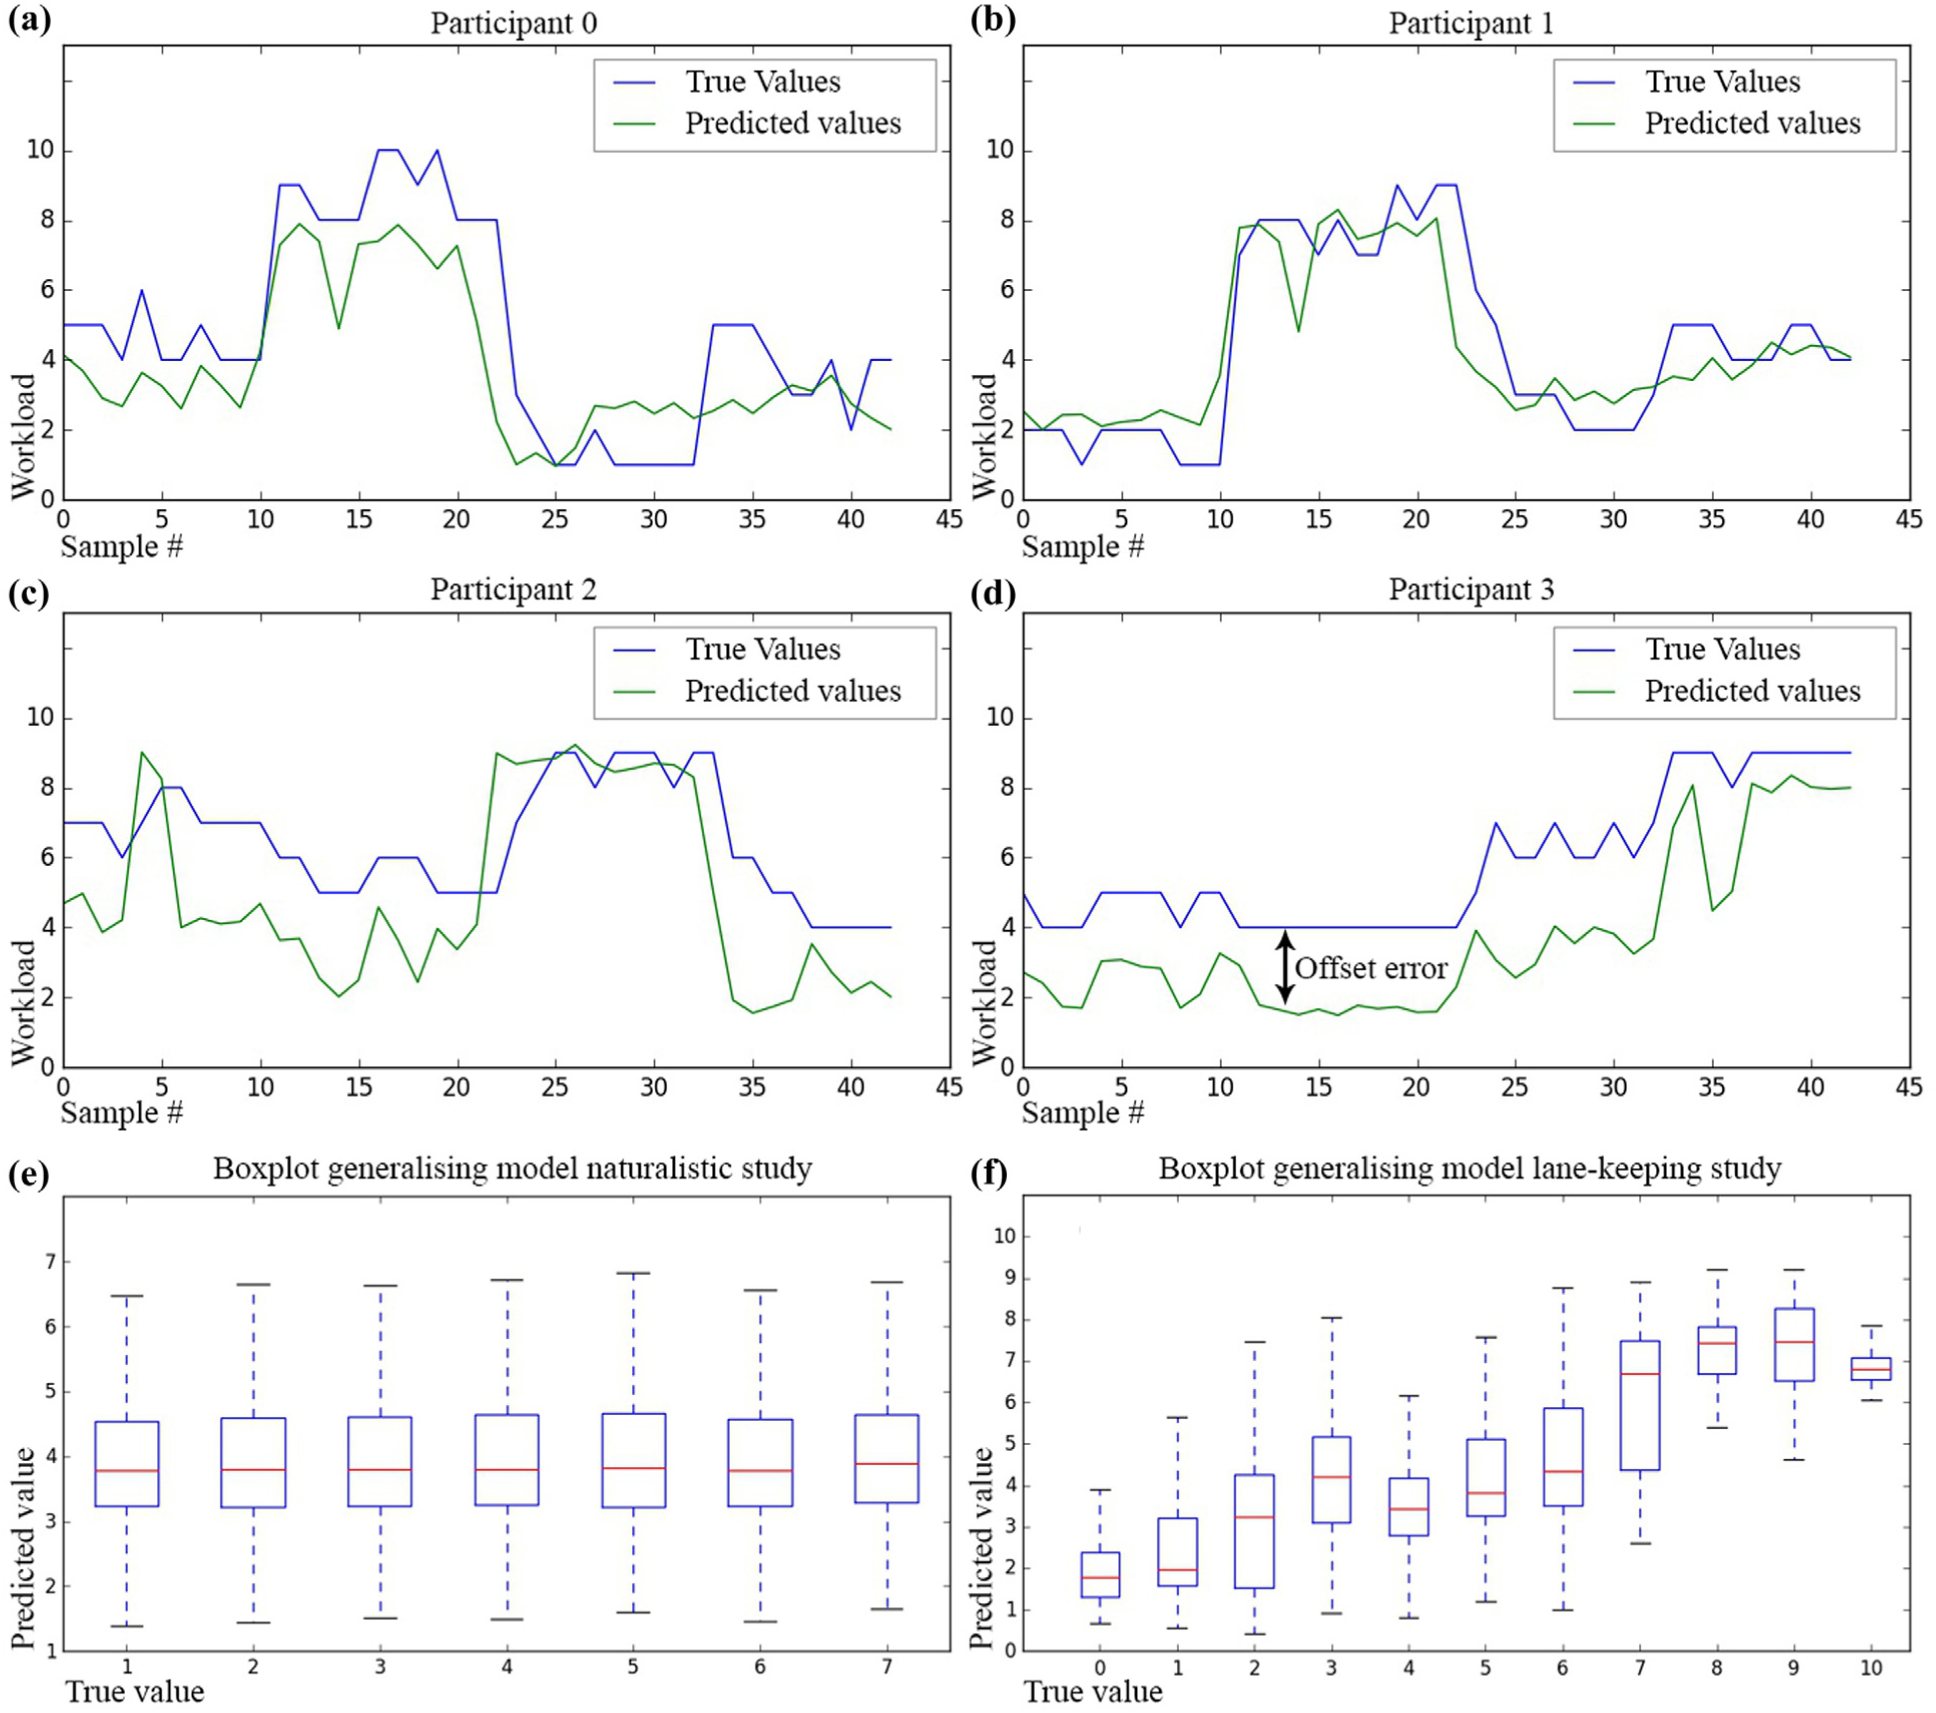
The top four windows (a–d) show plots from the first four participants, indicating that the models performed well, with the relatively large absolute errors likely to have resulted from individual scaling problems in the predictions. These offset errors are indicated in (d): the general trend is predicted well but there is a constant offset error. The last two windows (e–f) show box plots, further exploring the generalizing models from both studies.
Conclusion
The results of this study show similarities with the previous study for individual and group-based models. In addition, this second experiment shows that, when predicting multi-level workload (11 classes), generalizing performance was satisfactory, although still with room for improvement.
This study seems to indicate that indeed non-binary workload prediction that generalizes to unknown individuals is possible using ML methods. Although models generalizing between individuals showed variations in performance based on which individual’s workload was being predicted, including constant offset errors in several participants, overall performance was promising.
Overall Conclusions and Discussion
The present study tried to model driver workload using ML techniques that can run on embedded systems, with data collected from low-cost sensors. Results showed that individual models and within-group models functioned well in both a realistic driving setting and an artificial lane-keeping task setting. When generalizing to unknown drivers, only the lane-keeping study produced usable results. As displayed in Figure 2, e and f , in the first study the generalized model learns to predict values around the mean to optimize accuracy, whereas in the second study the model learns to predict based on the reported workload.
Because the data gathered in the study are time-series human physiological and performance data, they are likely to exhibit strong autocorrelation from one sample to the next. This might be a potential explanation for the higher performance in the individual and group models in both studies because, with random sampling, shared variance between samples from the training set and the prediction set might bias the classifier toward a higher accuracy. To better assess performance, training cases were included for which the models had to generalize to unknown individuals. These give a more accurate indication of performance, as with this approach there is no shared variance between training set (all participants minus participant k) and the testing set (participant k). As such, only the generalizing training case offers a reliable index of performance. This is an important distinction, because it shows that although using ML to predict driver workload can lead to promising results, care must be taken when interpreting the results. Without care in selecting the sampling techniques used, model performance might be inflated.
Possible reasons for the discrepancy in generalizing performance between the two studies could include the workload induced in the realistic settings being too low to be reflected in the physiological or performance signals, or the workload induced by artificial tasks being more easily measurable than that induced by more realistic tasks. It could also be that different physiological response patterns to workload might exist and that the sample in the first study was either too small or contained too much individual variation.
Possible limitations of the present study are that a self-report measure was employed as ground truth of the experienced mental workload of the drivers. The study did not employ standardized workload scales such as NASA TLX, to keep interaction time and demand with the driver to a minimum. However, this may have contributed to lower model performance through participant response tendencies, and leaves some doubt as to the degree to which the data captures workload. In addition to this, the study did not look at compensatory behavior drivers might employ to manage their workload, such as reducing speed in complex or demanding situations.
Future directions are planned. These include feature space normalization of the dataset to attempt to reduce the offset errors observed in some individuals, as well as exploring additional feature extraction methods. After this, on-road testing is planned to explore model performance in real-world driving settings. Lastly, development of an embedded variant of the model is planned.
Footnotes
Author Contributions
The authors confirm contribution to the paper as follows: study conception and design: Paul van Gent, Timo Melman, Haneen Farah, Nicole van Nes, Bart van Arem; data collection: Paul van Gent, Timo Melman; analysis and interpretation of results: Paul van Gent, Haneen Farah, Nicole van Nes, Bart van Arem; draft manuscript preparation: Paul van Gent, Haneen Farah, Nicole van Nes, Bart van Arem. All authors reviewed the results and approved the final version of the manuscript.
The Standing Committee on Simulation and Measurement of Vehicle and Operator Performance (AND30) peer-reviewed this paper (18-02628).