
Abstract
Random regret minimization models (RRMs), based on seminal work in regret theory, have been introduced into transportation research as an alternative to expected/random utility models. With ample applications in diverse choice contexts, the RRMs have been extended to include the effect of “rejoice,” the counterpart of the emotion of regret. The fundamental assumption of regret–rejoice models is that when the chosen alternative is inferior to non-chosen alternatives with respect to an attribute, individuals feel regret; otherwise, if the chosen alternative is superior to non-chosen alternatives, individuals rejoice. The regret and rejoice functions are assumed to be continuous in attribute differences. However, individuals may tolerate small attribute differences when judging regret and be indifferent to small differences when assessing rejoice. This paper therefore introduces tolerance and indifference bands in random regret–rejoice choice models, and compares the performance of these models against the performance of the original models. Furthermore, it is assumed that tolerance and indifference bands differ by trip purpose. Empirical results testify to the better performance of the models with the tolerance and indifference bands, and show that trip purpose is an important factor affecting tolerance and indifference bands.
Different disciplines have developed different concepts and modeling approaches to predict individual choice behavior. Dominant in economic theory has been the concept of (expected) utility, which states that individuals choose an alternative so as to maximize the utility they derive from the attributes of the choice alternatives. (Expected) utility theory ( 1 ) has been the foundation of many discrete choice models that have been applied in transportation research and many other application areas ( 2 ).
Although utility maximizing models have produced adequate results when forecasting individual choice behavior and aggregate market shares, several researchers have argued that in many cases observed choices do not reflect the maximization of utility. This has led to a quest in behavioral economics and other decision sciences for models that are based on concepts other than utility and decision rules different from utility-maximization to move away from models of purely rational behavior.
One of these alternative approaches, regret theory, is based on the contention that individuals experience regret when they realize the choice they made is not the best possible one ( 3 , 4 ). Consequent experiments have demonstrated that the negative emotion of regret significantly affects decision making processes. Chorus et al. introduced the random regret minimization model (RRM), which is inspired by, but different from, seminal regret theory, into transportation research ( 5 ). Regret avoidance was translated into the decision principle of regret minimization. Specifying the attribute regret as proportional to the attribute difference from the best alternative for that attribute, and assuming that overall regret equals the maximum of the sum of attribute regrets in the comparison of alternatives, adopting the independent and identically distributed (IID) assumption of the multinomial logit (MNL) model then yields the random regret minimization (RRM) model. Most applications, however, are based on an alternative specification, in which the double max operators are replaced with the principle of all pairwise comparisons and the attribute difference function, truncated at zero, is approximated by a continuous function ( 6 ). Since its introduction, the RRM model has been applied to many diverse choice problems under certain ( 7 – 14 ) and uncertain ( 15 , 16 ) conditions.
Both conventional RRM and random utility maximization (RUM) models are based on the postulate that individuals are rational economic agents, implying that they discriminate even small differences between alternatives. Under various circumstances, this postulate may not be valid ( 17 ). Kahneman argued that cognitive processes are bounded by biological limitations that prevent individuals from making perfect (rational) choices ( 18 ). Rasouli and Timmermans argued that bounded rationality triggers individuals to use simplifying decision rules ( 19 ). Ignoring small attribute differences in judgmental processes is one example of simplifying decision rules.
There is a consistent body of knowledge, accumulated in a variety of disciplines across a diverse set of topics, suggesting that individuals are insensitive to small attribute (stimuli) differences, either because they cannot perceive the differences or because they are indifferent in that attribute range. For instance, Georgescu-Roegen argued that individuals perceive differences between two commodities only when attribute differences exceed some necessary minimum ( 20 ). Coombs et al. proposed the concept of thresholds of perception, called “just noticeable differences,” to indicate that individuals do not perceive a difference if a change of a stimulus is below a certain threshold ( 21 ).
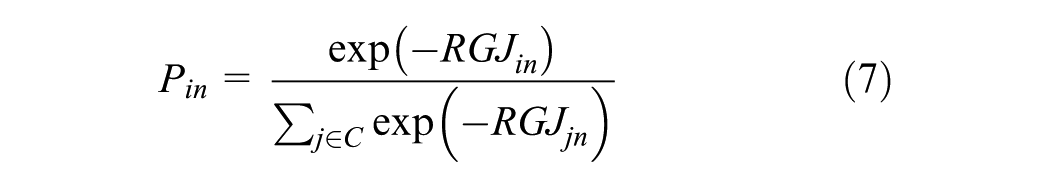
In discrete choice modeling, the principle of indifference has been operationalized by adding an indifference threshold to the deterministic utility difference of choice alternatives in calculating the probability of choosing an alternative under the assumption of utility maximizing behavior ( 22 – 24 ). If the deterministic utility difference between two alternatives is below a certain threshold, individuals are assumed to perceive or judge the two alternatives as being the same. However, it has not been acknowledged that incorporating indifference thresholds in RUM should satisfy two assumptions. First, the error terms should be independent of the deterministic utility value. Second, the error terms should be identically independently Gumbel distributed. If multiplicative error terms are assumed ( 25 , 26 ), or the error terms are not Gumbel distributed, the methodology is difficult to apply. Even if these conditions are met, because of the complex dependencies of indifference thresholds between utilities, it is very difficult to extend the model to many alternatives in the choice set.
In the context of regret, insensitivity can be interpreted as individuals being tolerant about small attribute differences. Regret is only felt if the chosen alternative is outperformed by some margin. Jang et al. incorporated attribute tolerance into deterministic regret functions ( 27 , 28 ). This specification can be easily applied to any type of error term. The tolerance based regret models outperformed their conventional counterparts for two data sets. This positive result stimulated exploration of the application of this idea to more complex choice models.
In this paper, tolerance thresholds are estimated in mixed regret–rejoice choice models. The models assume that individuals experience the negative emotion of regret for inferior attributes and rejoice at the superior attributes ( 27 – 31 ). Thus, it is necessary to extend the model and test whether the notion of thresholds applies to both negative and positive emotions which are triggered by attribute differences. Do individuals apply an indifference/tolerance band around the reference point of identical attribute values between pairs of alternatives ( 32 – 35 )? Do people tolerate a small loss (regret) and are they indifferent to a small gain (rejoice)? Is the band asymmetric between regret and rejoice? In addition, market segmentation analysis based on trip purpose is conducted. When punctuality is required for a trip, such as a work-related trip, individuals may have quite a small tolerance for attribute difference. Otherwise, if they have time to spare, such as on a non-work-related trip, they may have larger tolerance.
The regret–rejoice model incorporating tolerance thresholds will be compared against the original regret–rejoice model using revealed choice data about mode choice. In addition to comparing the predictive performance of the models, K-fold validation tests will be conducted. Further, to examine the effect of trip purpose, market segmentation will be applied, and the thresholds between segments statistically compared. For further insights for transportation policy, elasticities will be compared in each case.
The remainder of this paper first summarizes the development from regret-based models to regret–rejoice-based models as they have been formulated in transportation research. Next, the proposed attribute indifference and tolerance models are outlined. Then, the estimation and validation results are discussed and the results of the market segmentation reported. The paper is completed by a discussion of the results and avenues of future research.
Regret–Rejoice Choice Model
The original RRM models ( 5 , 6 ) introduced into transportation research assume that individuals’ choice only depends on the negative emotion (semi-compensatory decision rule), called regret. This assumption may be too extreme. Therefore, several recent studies have focused on the effect of positive emotions when the chosen alternative outperforms the non-chosen one, the concept of rejoice ( 27 – 31 ). With the inclusion of rejoice, the random regret–(rejoice) minimization models are based on a fully compensatory decision rule. In this study, to incorporate thresholds in the rejoice function in the same manner as in the regret function, the linear regret–rejoice model is used ( 27 , 28 ).
When chosen alternative i is compared with the non-chosen alternative j, regret–rejoice for individuals n can be defined as

where

and

Then, this regret–rejoice model can be defined for multi-alternative choice sets, either (1) against the best non-chosen alternative (Equation 4) or (2) against all non-chosen alternatives (Equation 5).


Note that these regret–rejoice models represent flexible reference-dependent preferences with different taste weights for regret (
Total regret–rejoice is assumed to be stochastic, where RRGJin is random regret-rejoice.

Based on the assumption that the negative error terms
Tolerance Thresholds in Regret–Rejoice Models
How can the indifference/tolerance threshold be incorporated into the regret–rejoice model? In the regret domain, individuals feel regret when the attribute difference between the chosen and non-chosen alternative exceeds a certain tolerance threshold (Figure 1):


Similarly, individuals rejoice if


Therefore, the band defined by the indifference and tolerance thresholds equals


Within this band, individuals do not feel any negative (regret) or positive (rejoice) emotions for the chosen alternative from the comparison with non-chosen alternative(s). The thresholds can be incorporated as
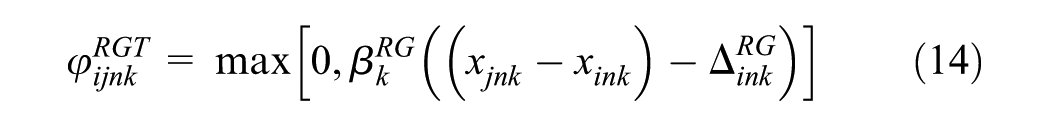
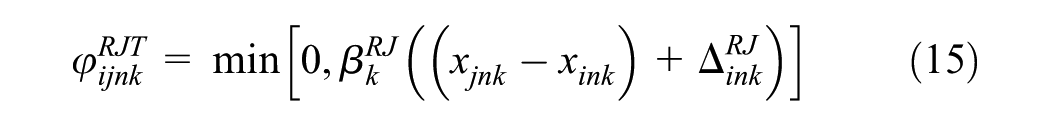


The thresholds may depend on the attribute value of the chosen alternative. If someone traveled for 10 min, and the travel time of the non-chosen route turned out to be 5 min, individuals might feel regret for the 5 min travel time difference. However, when someone traveled for 120 min, and the non-chosen route turned out to be 115 min, individuals might feel less or no regret for the 5 min less travel time. This is similar to the case in which the travel time of the chosen alternative is less: individuals may feel less or no rejoicing for the same travel time difference when the travel time for the chosen alternative is large enough. Therefore, it is assumed that the thresholds


where


where
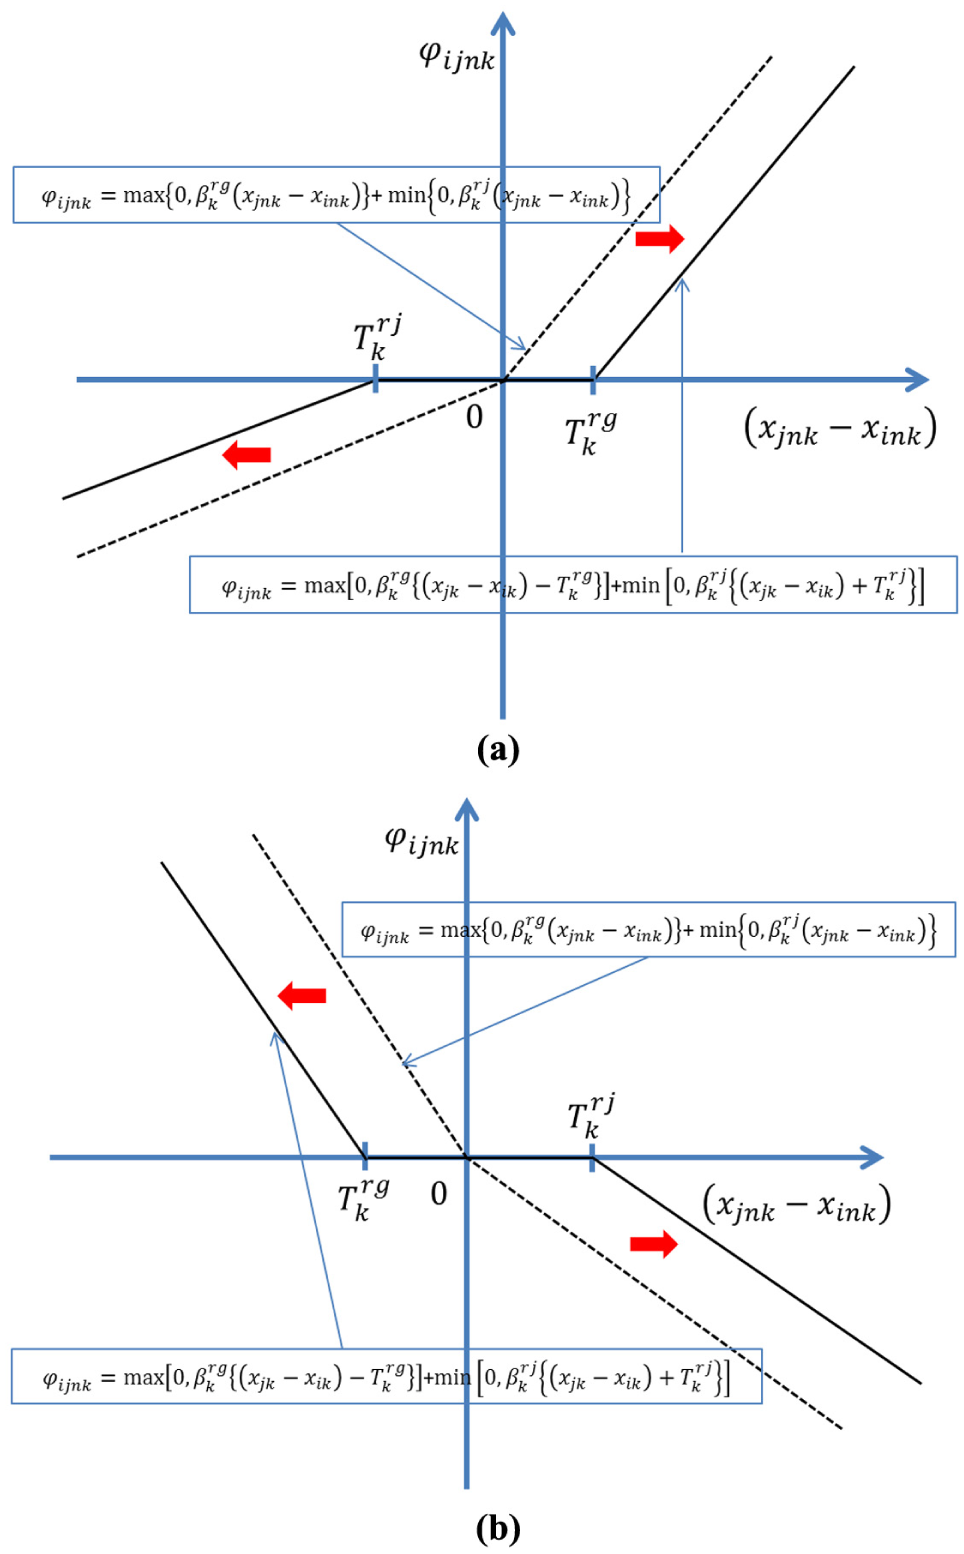
Regret–rejoice specification incorporating tolerance threshold, (a) when taste weight for regret
The threshold parameters


where
Then, if the error terms
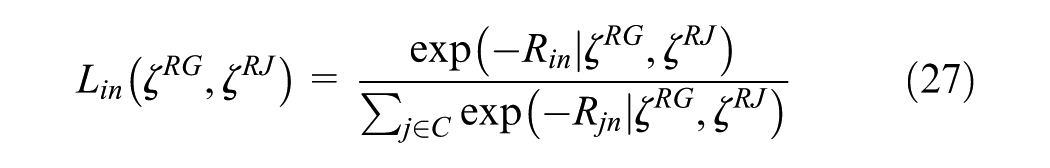
where L is logit function. Thresholds
Because the computation in Equation 26 involves complex integrals with respect to distributions
1) Draw a value of
2) Calculate
3) Repeat steps 1 and 2 R times, and average the results. This average is the simulated probability:

where
where
Empirical Evidence
To examine whether the inclusion of tolerance and indifference thresholds improves the predictive performance of the regret–rejoice model, a revealed preference data set about mode choice behavior in the Noord Brabant area of the Netherlands was used. Matlab R2015a was used to develop the code to estimate the various models. Likelihood values were calculated to compare the goodness-of-fit of the models. Because it was necessary to compare non-nested models with different numbers of estimated parameters, Ben-Akiva and Swait’s test ( 37 ) for non-nested choice models was applied.

where
where
As Ben-Akiva and Swait’s test ( 37 ) is based on Akaike’s Information Criterion (AIC), which tends to prefer the larger model (by number of parameters) if the sample size is big enough, the Bayesian Information Criterion (BIC) ( 38 ) of each model was also calculated.

where
In addition to the comparison of model performance, a K-fold cross-validation test was conducted for each case. The validation test requires splitting the data into K subsets, estimating the models using K−1 subsets, and testing the model using the remaining subset. This process is repeated K times because each subset should be used as a test set once. The 2-norms statistic, which quantifies the distance between predicted and observed choices ( 39 ) was used in this test. It can be expressed as

where
Moreover, elasticities were compared to examine how attribute difference thresholds affect choice probabilities. The elasticities compared were those of the original regret–rejoice choice model and the proposed variant incorporating tolerance thresholds. The elasticity of the regret–rejoice model indicates the relationship between a 1% change in the level of the attribute and the percentage change in the probability of choosing the alternative.
Further, it is assumed that attribute difference thresholds are affected by trip purpose. When the purpose requires punctuality (e.g., a commuting trip), they may be very sensitive to even small travel time differences, whereas for other trip purposes they may be more insensitive to small travel time differences. Therefore, a market segmentation by trip purpose was conducted, and the tolerance and indifference thresholds compared.
Data
For the first case study, the MON (Mobiliteit Onderzoek Nederlands—the Dutch National Travel Survey) data, collected in 2009, was used to estimate the regret models. A sample of representative residents in the Netherlands was randomly recruited to collect data about their daily travel. Data pertaining to the Province of Noord Brabant were extracted. The sample contains revealed preference data of a sample of 354 respondents with 1,158 trips. The extracted data include three mode choice alternatives (car, bike, walk) with two level-of-service variables. The estimated models thus predict the probability of choosing these transport modes as a function of these level-of-service variables. The travel time varies between 1 and 134 min, and travel distance ranges from 1 km to 91 km.
Estimation Results
Because of space limitations, the focus in this paper is limited to Equations 6 and 19. Table 1 shows the estimation results and the difference in predictive performance of the original regret–rejoice model and the specification based on stochastic thresholds for both regret and rejoice. All parameters are statistically significant at the 95% significance level. Their signs are consistent with theoretical expectations.
Summary of Estimation Results of Regret–Rejoice Models: Specification Incorporating Stochastic Threshold
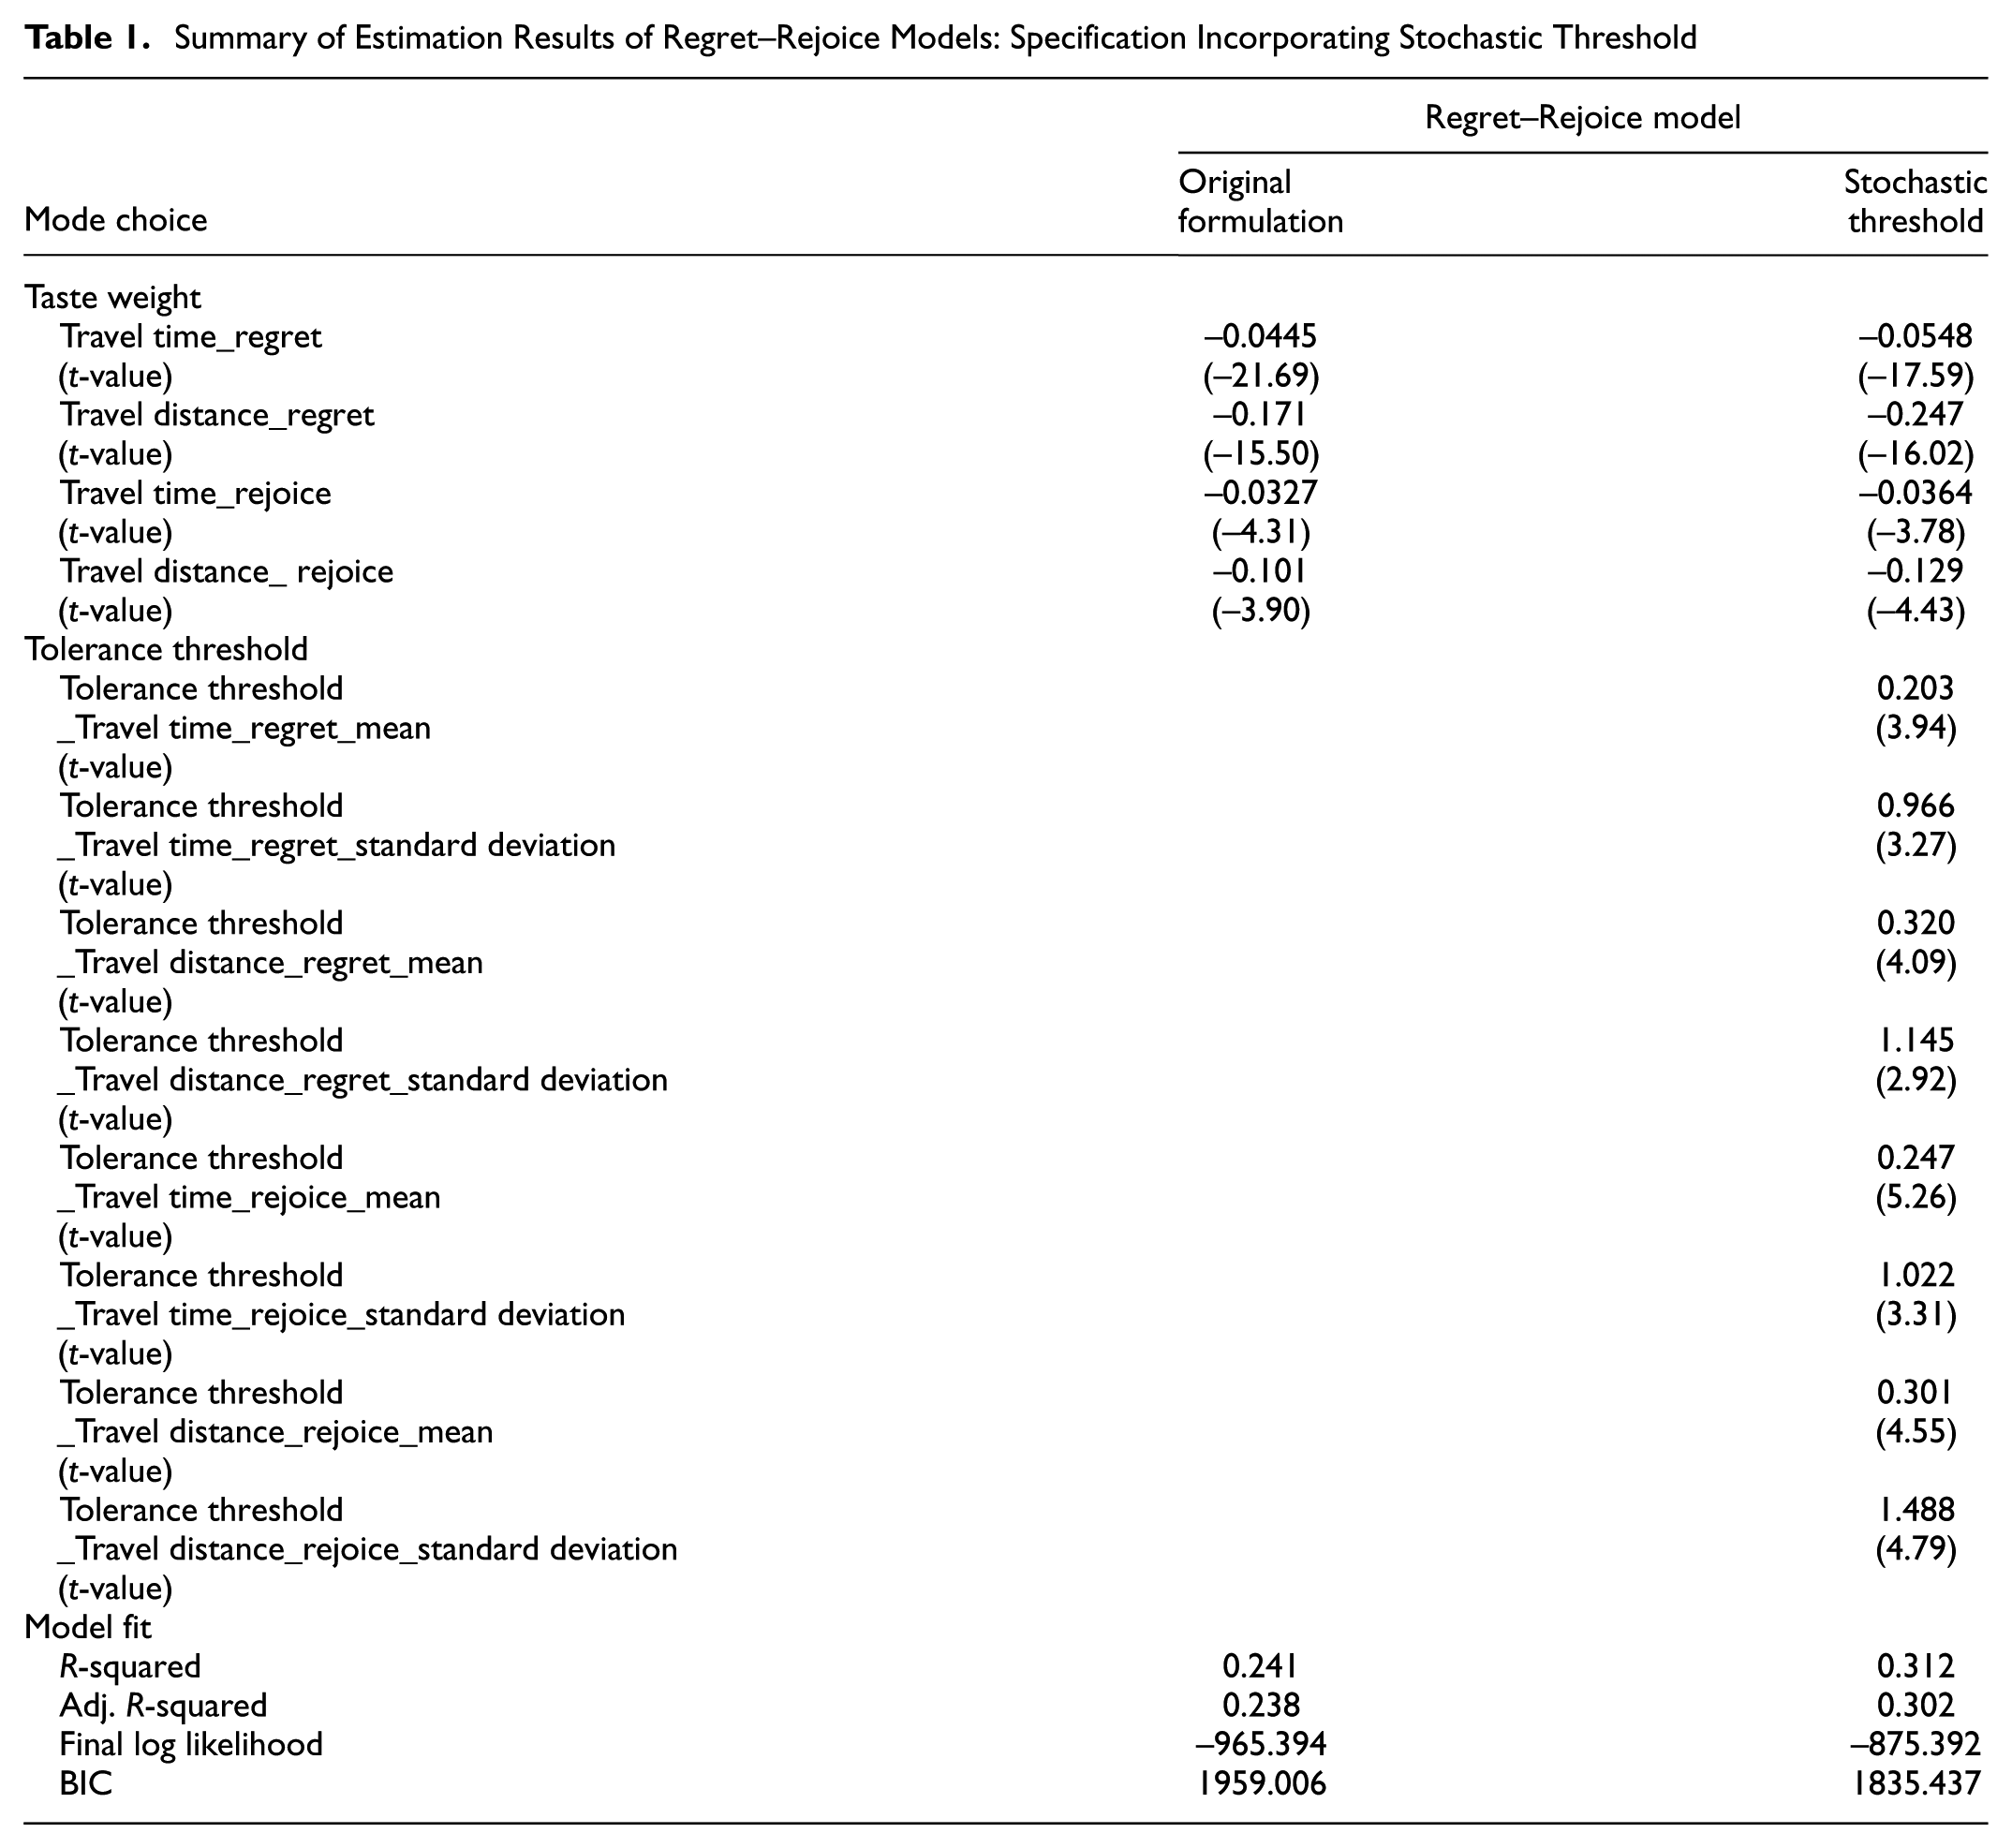
Whereas the mean stochastic threshold is larger for rejoice than regret for travel time, it is smaller for rejoice than regret for travel distance. This means that individuals seem more sensitive to loss (regret) than gain (rejoice) for small travel time differences, but more sensitive to gain (rejoice) than loss (regret) for small travel distance differences.
Furthermore, the band for travel time (
Based on Ben-Akiva and Swait’s test ( 37 ) for non-nested choice models, it is possible to conclude that the tolerance band significantly improves the predictive power of the regret–rejoice model. The probability that the original regret–rejoice model is superior to the specification incorporating stochastic tolerance thresholds is zero (p≤ (−12.444) ≅ 0). This result is also supported by BIC. The BIC of the threshold specification is 1835.437, which is lower than the BIC value of the original regret–rejoice model (1959.006).
Validation Results
The models were also validated using K-fold cross-validation. To that end, the data were randomly split into six different subsets. The models were estimated by pooling five of these subsets. The estimated model was then used to predict the observations of the remaining subset. By repeating this procedure six times, each subset was used for validating the model once.
Figure 2 shows the results of the cross-validation test using the value of the 2-norms statistic to compare the original regret–rejoice formulation and its variant incorporating stochastic thresholds. Results demonstrate that the estimated parameters do not differ much between the subsets used for model estimation. The model incorporating stochastic tolerance thresholds consistently shows better performance than its original counterpart in terms of the 2-norms statistic.
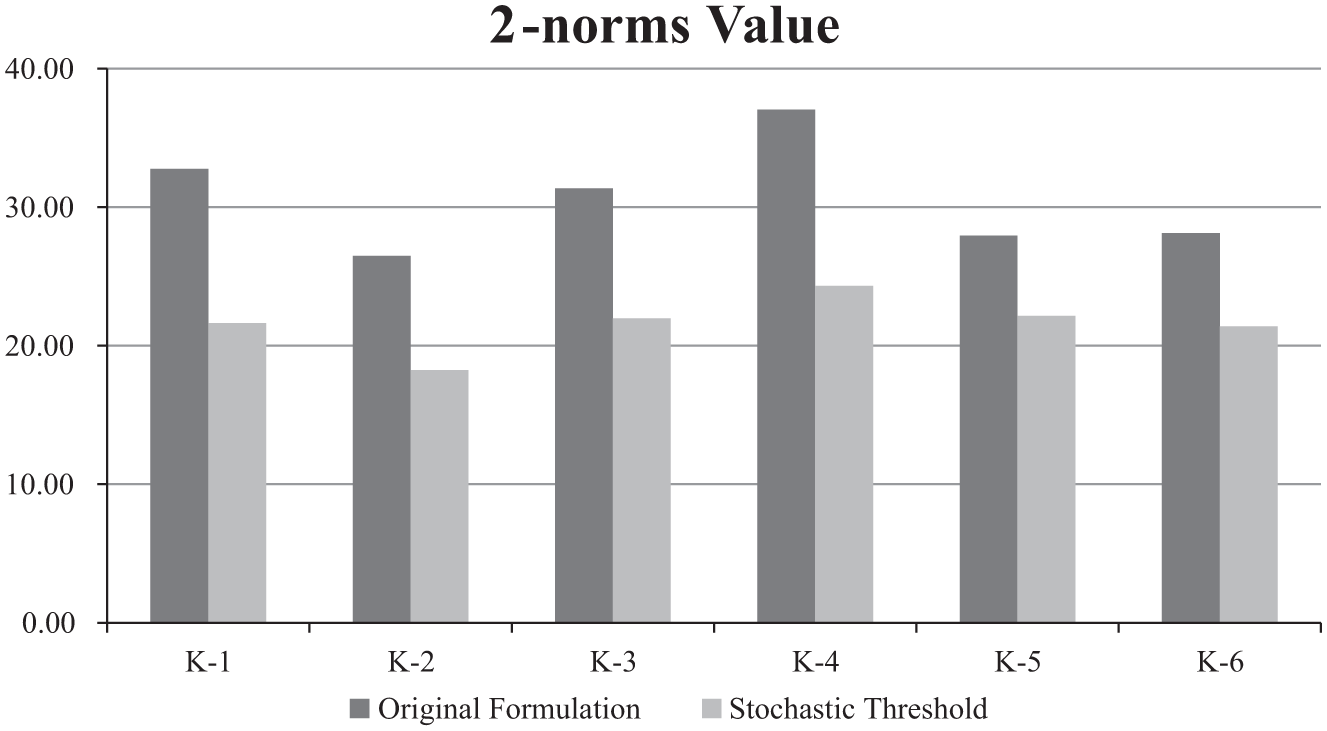
2-norms values for K-fold cross-validation test: Comparison of original regret–rejoice formulation and its variants incorporating stochastic tolerance thresholds.
Market Shares
The comparison between observed and predicted market shares is shown in Table 2. It is clear that consideration of attribute difference tolerance makes the difference between the observed and predicted market smaller in the regret–rejoice model. Without consideration of the attribute difference tolerance, the market shares for alternatives 1 (car) and 3 (walk) are under-estimated, whereas the market share for alternative 2 (bus) is under-estimated. However, by considering the attribute difference tolerance, albeit the market share is still under-estimated for alternative 1 and over-estimated for alternative 2, the difference becomes smaller. It even becomes over-estimated for alternative 3.
Observed and Predicted Market Shares
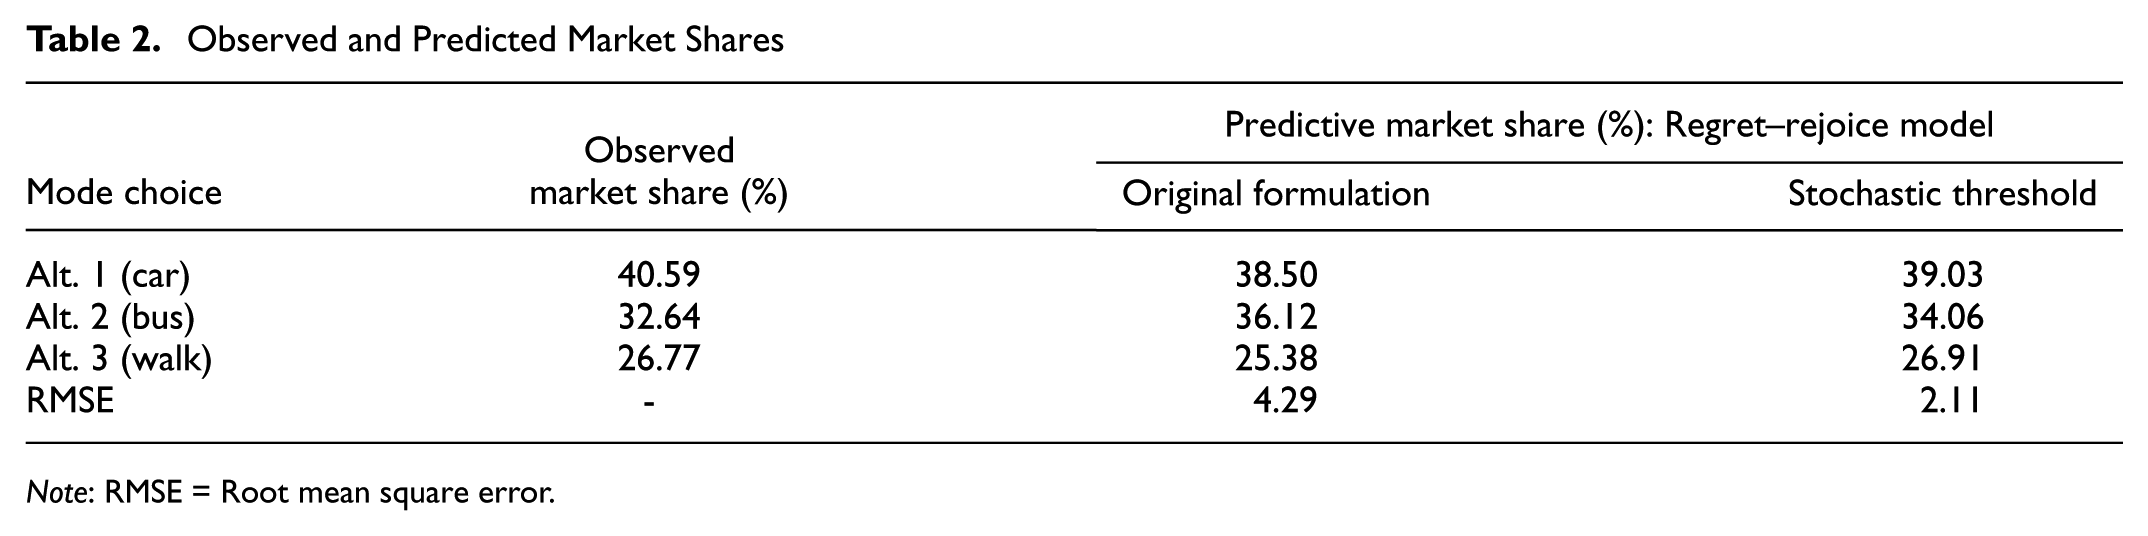
Note: RMSE = Root mean square error.
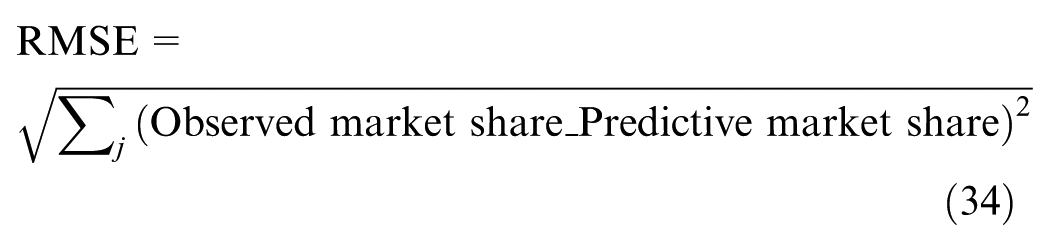
Considering the root mean square error (RMSE) in Equation 34, by considering attribute difference tolerance, the value of RMSE decreases (original formulation: 4.29, incorporation thresholds: 2.11). By definition, this indicates that the consideration of attribute difference tolerance generates market shares closer to the observed ones.
Elasticity
Analysis of the effect of attribute difference tolerance to changes in the travel demand of each mode was carried out. Because of the space limitation, it is not possible to include details of the derivation of elasticity. For the detailed derivation of elasticity with tolerance thresholds, readers can refer to Jang et al. ( 27 ).
The elasticities of the original regret–rejoice formulation and the regret–rejoice model with thresholds are shown in Table 3. The stochastic thresholds decrease the elasticities of the regret–rejoice model in every case. This is because it is assumed that individuals feel regret or rejoice for small attribute differences in the original regret–rejoice model, but not in the model with the stochastic thresholds. For example, whereas a 1% increase in travel distance decreases the probability of choosing alternative 3 (walk) by 3.01% in the original regret–rejoice model, it only decreases it by 0.97% if the stochastic tolerance threshold is incorporated. These results provide relevant insights for transportation policy. For instance, policy makers believe that if they impose a penalty on car traffic (increasing travel time by car), the market share of public transport will increase, even for small increases in travel time. However, these expectations are ill-founded, as the existence of thresholds implies that the market share of public transportation will increase much less than expected, or may even not change at all.
Elasticities: Comparison between Original Regret–Rejoice Formulation and Variant that Includes a Stochastic Threshold
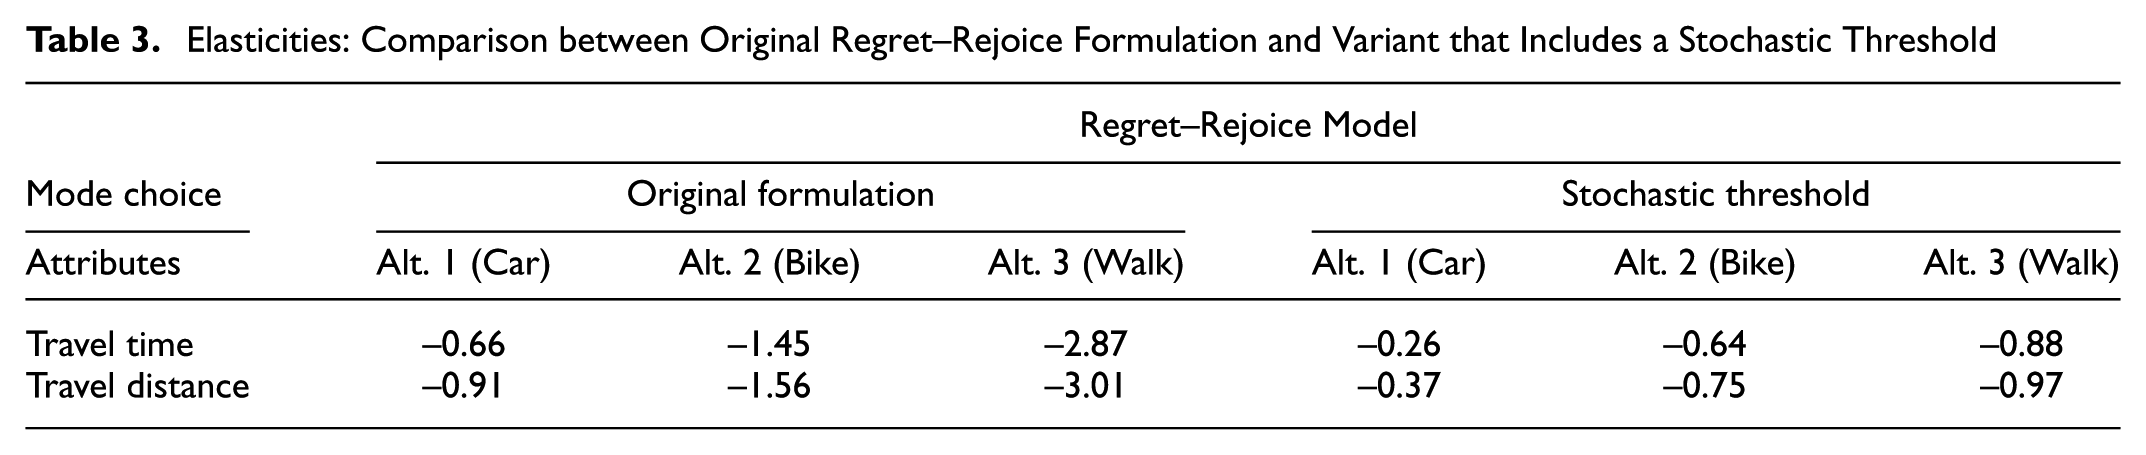
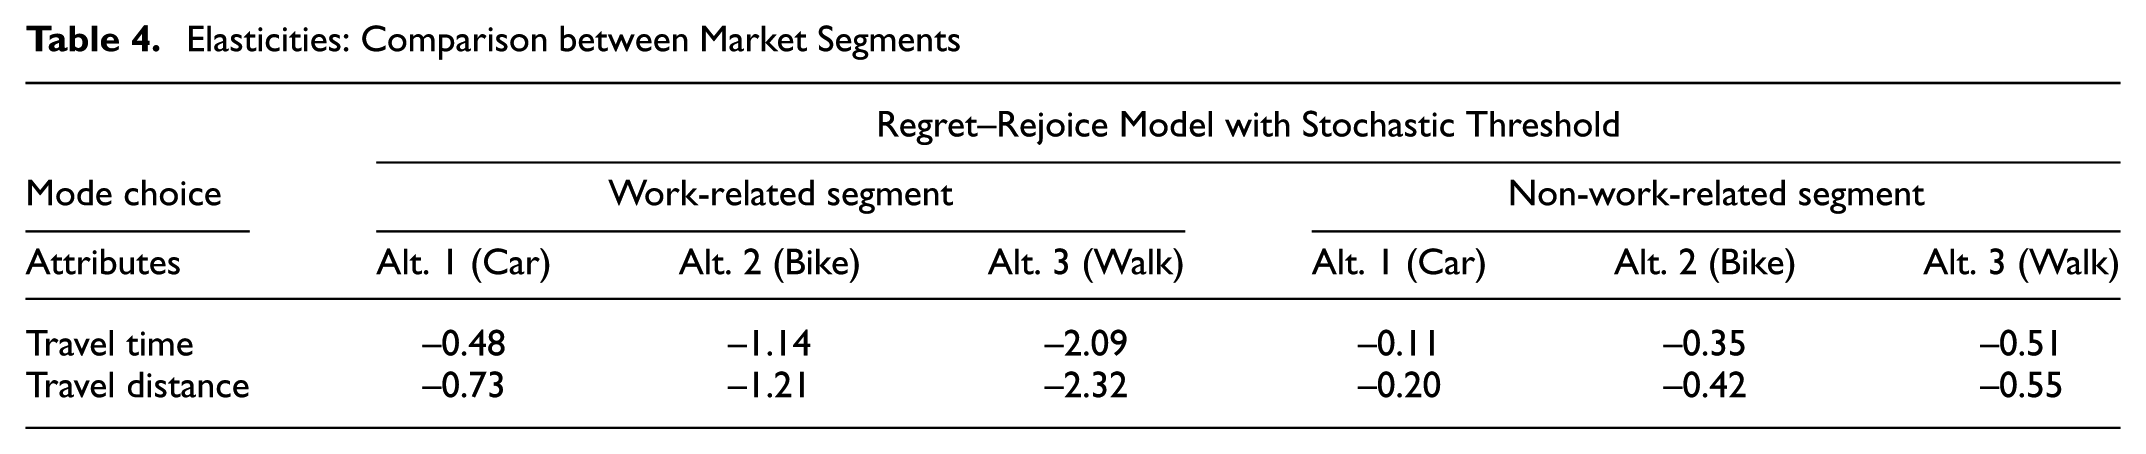
Table 4 shows the elasticities of each segment when considering attribute difference tolerance in regret–rejoice models. The elasticities of work-related segments are higher than those of non-work-related segments in every case. This means that when individuals travel with work-related purpose, they are more sensitive to changes in attribute values. This implies that when travel time by car increases, many travelers with work-related purpose will use public transportation. However, if the increase is small, most travelers with a non-work-related purpose will stick to car travel.
Elasticities: Comparison between Market Segments
Market Segmentation
Even when stochastic tolerance thresholds are used, individuals’ tolerance may be quite different for different travel purposes. In the context of mode choice behavior, travelers’ tolerance for attribute difference may depend on their purpose of travel: Individuals may be more sensitive to small travel time differences during the work commute than during non-work travel. Therefore, analysis of attribute indifference tolerance with market segmentation will provide more insights into traveler behavior.
To examine whether thresholds vary by trip purpose, this section proposes market segmentation, differentiating between work and non-work trip purposes. The work-related segment includes business and education with a total of 605 trips, equaling 52.25% of all trips. The non-work-related segment includes other purposes such as recreation, shopping, and touring with 553 trips (47.75%).
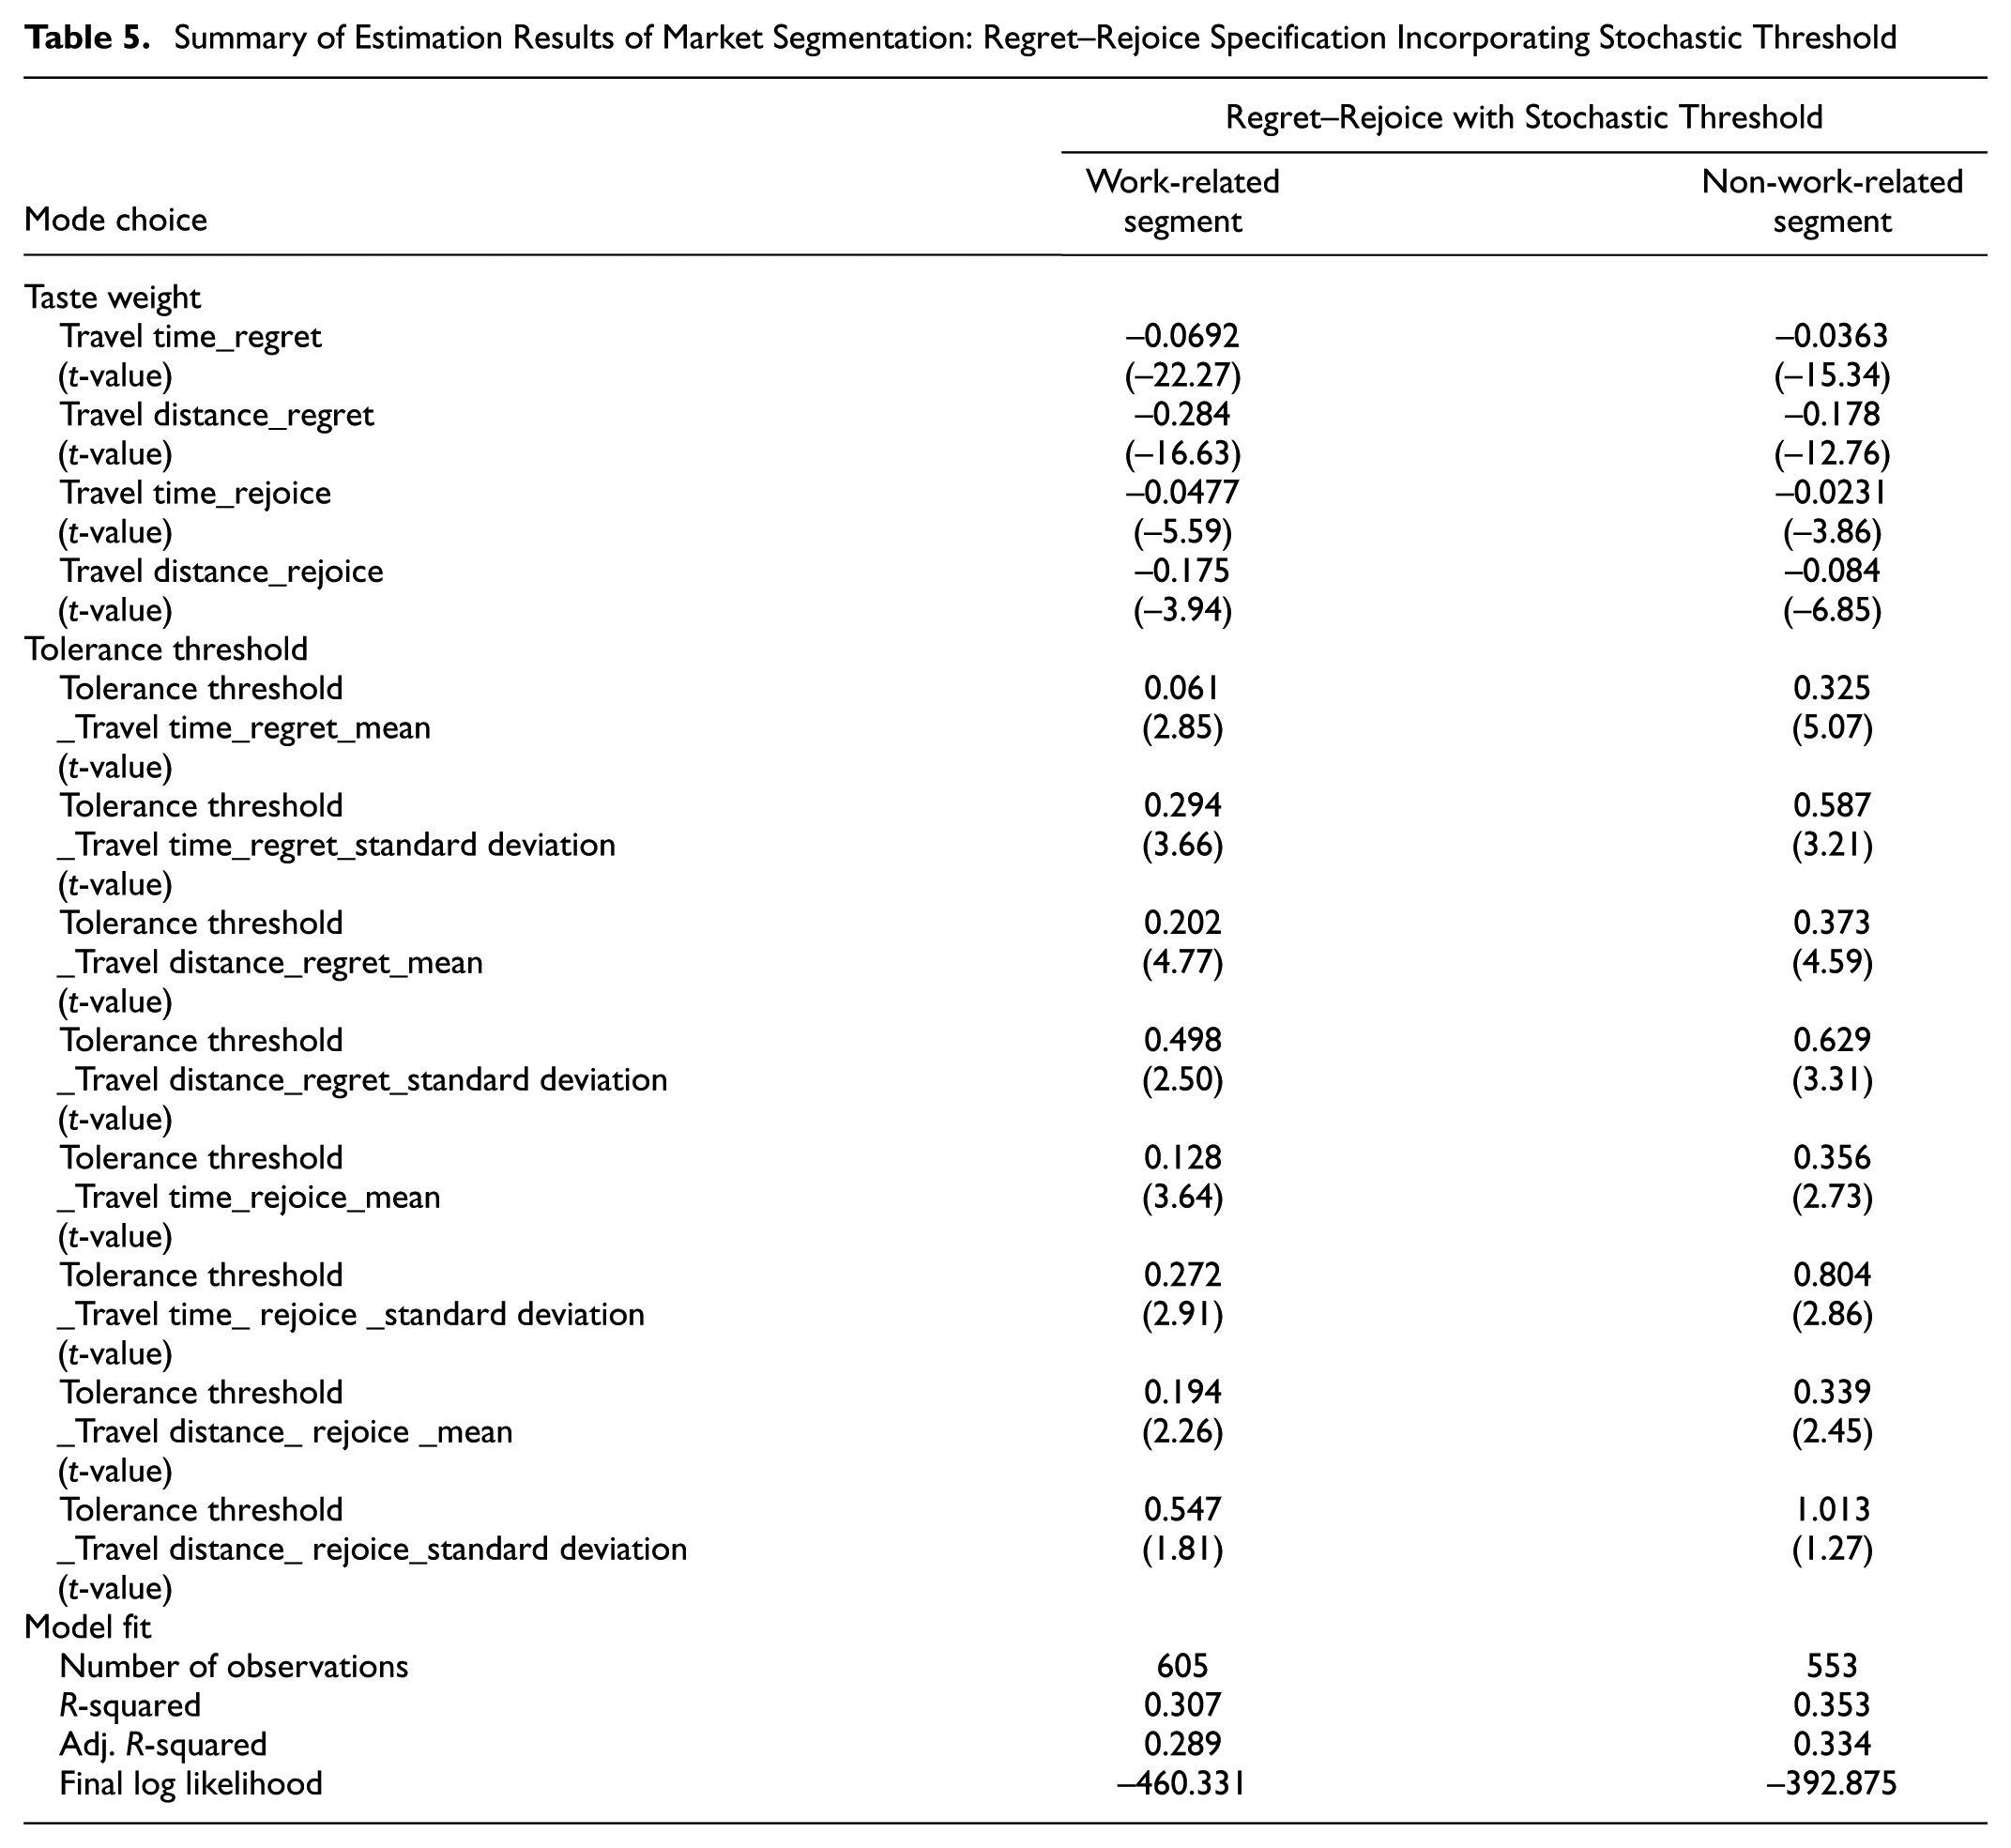
Table 5 shows the estimation results of this market segmentation. All parameters are significant at the 95% level, except for the standard deviation of the tolerance threshold for travel distance in both segments. First, to validate the market segmentation, a log likelihood ratio test ( 40 ) was conducted. The null hypothesis is that there are no differences between parameter values, which would mean that the market segmentation is not valid.
Summary of Estimation Results of Market Segmentation: Regret–Rejoice Specification Incorporating Stochastic Threshold
where
Therefore,
The absolute values of the taste weights for regret and rejoice are always larger for the work-related segment. This means that individuals are more sensitive to travel time and travel distance differences when their purpose is work-related. To check whether the parameters from each segment are statistically different, an asymptotic t-test ( 40 ) was conducted:
where
Thus, the null hypothesis is rejected. Therefore, it can be concluded that the taste weight of travel time for regret is statistically different between the segments at the 95% confidence level. Likewise, the result of the asymptotic t-test for travel distance for regret, travel time for rejoice, and travel distance for rejoice are −4.81, −2.36, and −1.97. The null hypothesis is rejected at the 95% confidence level in every case, indicating that all taste weights for travel time and travel distance are statistically different between the segments for both regret and rejoice.
In the work-related segment, travelers are more sensitive to small travel time differences than travel distance differences. Particularly, they are quite sensitive to small travel time differences in the regret domain: The mean stochastic tolerance threshold is only 0.061. Consequently, when individuals travel for a work-related purpose, they want to avoid any delay in arrival times. Therefore, when their chosen mode is slightly inferior to the non-chosen mode, they immediately feel regret. Conversely, when the chosen mode is slightly superior to the non-chosen mode, they immediately rejoice, but the indifference threshold is larger than the tolerance threshold: The mean stochastic indifference threshold is about 0.128. For travel distance, the threshold is more similar for both regret and rejoice (it is slightly larger for regret): The mean stochastic tolerance threshold is 0.202 for regret and the stochastic indifference threshold is 0.194 for rejoice.
In the non-work-related segment, the thresholds are larger than for the work-related segment, and relatively similar across attributes for both regret and rejoice: All mean stochastic thresholds are around 0.35. This means that when individuals travel for a non-work-related purpose, they exhibit higher indifference and tolerance for attribute differences, and the thresholds do not differ much for loss (regret) and gain (rejoice). Furthermore, the standard deviation of the threshold is always higher for non-work-related trips, implying that when individuals travel for a non-work activity, their tolerance is more heterogeneous than in the case of a work-related purpose. Compared with the whole data set, the heterogeneity (standard deviation) of tolerance for each attribute is smaller in each segment in all cases. This is reasonable because similar respondents are assigned in each group, and therefore their tolerance tends to be more similar.
Conclusions and Discussion
The regret–rejoice models that have been introduced in transportation research have in common the assumption that both the regret and rejoice functions are continuous in attribute differences. However, in contexts other than travel choice, there is evidence that individuals may be insensitive to small attribute differences. Related to the very nature of the concepts of regret and rejoice, individuals may tolerate or be indifferent to small attribute differences between the chosen alternative and one or more non-chosen alternatives. In this study, therefore, tolerance and indifference thresholds are incorporated in regret–rejoice choice models. Then, the study explores two main issues using empirical data: 1) How individuals’ tolerance is different between loss (regret) and gain (rejoice), or symmetric; and 2) How individuals’ tolerance differs by market segmentation.
Empirical results based on revealed mode choice data support the hypothesis that individuals are insensitive to small attribute differences in both the regret and rejoice domains, at least for this dataset. The sensitivity, however, depends on the attribute and is asymmetric between regret and rejoice. Moreover, indifference and tolerance thresholds vary by trip purpose. When individuals have a trip purpose related to work, they are less tolerant of small attribute differences, especially when they feel regret for travel time. However, when they travel for a non-work-related purpose, they are less sensitive to attribute differences, and the sensitivity is different across attributes for both regret and rejoice. Further elasticity analysis implies that the effect of transportation policy may become smaller when considering the attribute difference tolerance. In addition, the effect would be quite different at the individual level depending on travel purpose.
The suggested approach, which is based on the inclusion of attribute thresholds in the pairwise comparison of choice alternatives, solves the typical limitations of models which define a threshold at the level of overall utility. The approach is scalable to choice problems involving large choice sets. Still, some interesting and relevant research questions remain for future work. The current model assumes that the thresholds are proportional to the attribute differences. However, previous research by the authors has provided evidence that regret models based on perceptual differences, and which account for attribute variation, outperform conventional regret models. Therefore, it would be potentially valuable to more critically examine the specification of indifference and tolerance thresholds. Would a specification in perceptual space be better than the current specification in attribute space? Should the specification be made a function of (perceived) attribute variation? The authors plan to explore these issues in future research.
Footnotes
Author Contributions
The authors confirm contribution to the paper as follows: study conception and design: S. Jang, S. Rasouli, H. J. P. Timmermans; data collection: H. J. P. Timmermans; analysis and interpretation of results: S. Jang, S. Rasouli, H. J. P. Timmermans; draft manuscript preparation: S. Jang. All authors reviewed the results and approved the final version of the manuscript.
The Standing Committee on Traveler Behavior and Values (ADB10) peer-reviewed this paper (18-00733).