
Abstract
Unplanned disruptions in transit can have consequent impacts on passengers. The more inconvenienced passengers are, the more likely operators will be negatively impacted. Yet so far, operators and researchers have addressed the rescheduling problem during disruptions mainly with a supply-side focus – timetable, crews, and vehicles – and not with a passenger perspective. Urban rail transit particularly lacks insights in terms of passenger-focused rescheduling. Being able to assess the inconvenience experienced by passengers during disruptions compared with what they normally experience, and being able to compare how different rescheduling strategies affect them are therefore two major challenges. The framework developed in this study precisely aims at tackling these challenges. A case study of the Rotterdam Metro is used to test the framework developed in this paper. Alternative strategies are developed focusing on the incident phase (from the beginning of the incident until its cause is resolved). The application of the framework reveals that a regularity-focused rescheduling strategy would be beneficial for high-frequency service users. Realistically, yearly savings could amount to around €900,000 in terms of societal passenger costs for the operator in the Rotterdam area alone. However, the omnipresence of the punctuality paradigm, through which most operators plan and analyze operations, makes the implementation of passenger-focused strategies a challenging task for traffic controllers. The results of the study are valuable for transit operators worldwide, and the framework could provide decision makers with insights on the performance of different strategies, bringing to light trade-offs between the supply and passenger sides during disruptions.
Passengers can be seriously inconvenienced by unplanned disruptions occurring in transit, that is, major events with “a beginning and an end in time and a location where its effects can be felt” ( 1 ). At the beginning of a disruption, traffic controllers decide on and implement a service control strategy, one of the final goals being to restore operations as originally planned. These strategies consist of service control measures that directly affect vehicles and thus passengers. When the implemented strategy results in unfavorable conditions for passengers, rippling adverse publicity and revenue loss may follow for the operator. It is therefore crucial for operators to take a closer look at control strategies and their implementation in non-recurrent conditions.
Rescheduling Research and Practices in Transit
Disruption management is usually divided into three categories in the rail transport domain: timetable adjustment, crew rescheduling, and rolling stock rescheduling ( 2 ). Only in the past few years has the focus started to shift toward passengers ( 3 ). A disruption consists of two distinct phases ( 4 ):
The incident phase, from the start of the incident until the cause of the disruption is resolved. Capacity is scarce but demand peaks.
The service recovery phase, when traffic controllers work to bring the system back to a target state.
Passengers and Transit Rescheduling Research
The lack of rescheduling research focusing directly on passengers can be explained by vehicle data having been available longer than passenger data. Technology has evolved in the past few years though, and smartcard data for instance have tangible applications at the operational level ( 5 ), opening up new opportunities to focus more on passengers.
The first steps in the shift from a supply to a passenger focus in research pertain mostly to heavy rail ( 3 ), with the development of optimization algorithms including variables such as passenger travel and waiting time in objective functions ( 6 ). Although relevant, such studies do not necessarily fully acknowledge the complexity of the traffic controllers’ environment and may therefore lack applicability ( 1 ). Unlike heavy rail, fewer studies taking the passenger perspective into account were produced for non-recurrent conditions in urban rail transit. This may be due to the apparent lower complexity of operations compared with heavy rail. Consequently, there is a gap in knowledge regarding passenger-centered rescheduling strategies for non-recurrent conditions in urban rail transit.
Rescheduling in Urban Rail Transit
To support traffic controllers, control strategies can be planned. In rail urban transit systems, partial pre-plans are acknowledged as reasonable ( 1 , 4 ), providing elements like control measures and potential capacity issues at different times of the day, while leaving traffic controllers a degree of freedom ( 4 ). Many operators have already adopted pre-planning. The transit operator in Rotterdam in the Netherlands, RET (Rotterdam Electric Tram), designed pre-plans for each potential partial or full blockage in the metro network, consisting of lists of control measures. Traffic controllers at RET acknowledge however that the passenger perspective has never been formally considered in the design of these pre-plans.
Measures typically used in urban rail transit can be grouped in three main categories (see [ 7 , 8 ] for more details):
Speed control measures, including holding – delaying the departure of a vehicle to reduce headway variance – speeding up, and slowing down. The two latter have little application in high-frequency urban transit systems.
Station-skipping control measures. These include expressing, deadheading, short-turning, diverting, and cancelling. Expressing is when a vehicle with passengers skips one or multiple stations that it was supposed to serve. Deadheading is similar, but with an empty vehicle. Short-turning means allowing a vehicle to turn and run in the opposite direction before it has reached its terminal. Diverting can occur when branches exist in the network. The ultimate station-skipping measure is the cancellation of a service. In all cases, the aim is to restore regularity, punctuality, or both. Because of the mismatch between supply and demand during the incident phase, an aggressive use of station-skipping measures is usually not recommended and short-turning is typically used, along with diversion when possible ( 7 ).
Other measures. Service addition measures like adding a gap vehicle and implementing a shuttle service may be used. Furthermore, the single-track operations measure may be used when one of the two tracks of a rail system is unavailable and if crossover tracks are available on both sides of the disrupted segment. This measure is typically used during the incident phase.
Most research on these measures in rail-bound urban transit systems has been produced either with a passenger focus but with recurrent conditions in mind only ( 9 ) or for non-recurrent conditions but without acknowledging passenger impacts, typically for single-track operations ( 10 ). A recent study provides an exception though ( 11 ). Because passengers are considerably affected during the incident phase ( 4 ), and because of the lack of research on single-track operations, this study focuses on the incident phase.
Main Challenges When Investigating Passenger-Centered Rescheduling Strategies During Disruptions
There are two main challenges in this study. First, it is necessary to be able to quantify the inconvenience experienced by passengers in non-recurrent conditions with a clear framework, similar to what Van Oort et al. and Fadaei and Cats did for recurrent conditions ( 9 , 12 ). Second, the impacts of different strategies on passengers need to be compared for the same disruption, a challenge already highlighted in literature ( 1 ). To overcome this challenge, simulation is used.
Motivation of the Study and Outline
The aim of this study was to determine how service control strategies used in non-recurrent conditions could be improved and developed when the passenger perspective is considered. To this end, a framework was developed based on literature and analytical thinking. The framework was then tested using a case study of the Rotterdam Metro network. This framework allows the assessment, development, and comparison of strategies. The study demonstrates that there is room for improvement in terms of passenger-oriented rescheduling in the Rotterdam Metro and sheds light on the types of actions that benefit passengers during disruptions in high-frequency transit systems in general.
This paper fulfills the aforementioned objective by first presenting the development of the framework. The subsequent section presents the case study and the results. The final section then provides general conclusions, recommendations, and future research directions.
Development of the Framework
In this section, the development of the framework is described. Following a clearly defined objective, data needs are established. The structure of the framework is presented.
Framework Objective
The aim of the framework is to allow for multiple service control strategies to be assessed, developed, and then compared from a passenger perspective for one given disruption. To allow for a suitable quantification of the costs of a disruption, strategies should be assessed with recurrent conditions as a reference, and not ideal conditions as defined by the operations plan. Indeed, because of the variability of travel times inherent in transit, recurrent conditions are often different from what was planned. As inspired by Wilson et al., the assessment should allow distinguishing between different (groups of) OD (origin–destination) pairs to provide meaningful insights into trade-offs between groups of passengers ( 13 ).
Data Needs
In previous studies where passenger inconvenience is assessed in recurrent conditions, a combination of passenger and vehicle data is used ( 9 , 11 ). This is also the chosen approach here. As the passenger trip chain and vehicle processes are intertwined ( 9 ), supply-side (automatic vehicle location, AVL) data combined with demand-side (automatic passenger count, APC) data can facilitate derivation of passenger impacts ( 14 ). It is best to make use of APC data that easily allows reconstitution of the full passenger journey, as the way passengers are affected depends on their full journey ( 13 ). Data from smartcards that need to be tapped in at the beginning of the journey and tapped out at the end are thus needed.
Organization of the Framework
Using a combination of AVL and APC data led Van Oort et al. to define a three-step approach, providing a good basis for the assessment developed here ( 9 ). Supply-side indicators are computed based on AVL data and then translated into passenger impacts based on APC data. It is assumed that passengers do not cancel their trip or reroute; this assumption will be discussed in the Reflection section. Then, passenger impacts are turned into monetary impacts based on values of travel time components, thereby allowing for comparisons.
To complete the framework, passenger impacts need to be defined and a method must be chosen to generate alternative strategies. Ideally, to compare the impacts on passengers of various strategies, one would have the AVL data of multiple situations with the same disruption and identical circumstances but various strategies. As this is unlikely to ever happen, AVL data corresponding to the use of alternative strategies must be simulated.
Passenger Impacts
Quality indicators are required to properly quantify the quality of service (
15
), in this instance, the performance of a transit system in non-recurrent conditions from the passenger perspective. The chosen impacts are loosely based on research by Van Oort et al. (
9
). To derive each passenger impact, AVL data (from historical data or simulation) were used and supply-side indicators were computed (Step 1 of the three-step approach), such as headways and percentage regularity deviation mean (PRDM) (
16
). Let
Average additional effective in-vehicle time
Average additional waiting time at the first boarding
Average additional perceived in-vehicle time
Average additional denied boarding occurrences, with their associated waiting times. The average denied boarding cost for a passenger,
Average amount of unplanned transfers, with their associated waiting times. With
The VoT for the Dutch situation was based on Kouwenhoven et al. (
18
). The VoWT was determined based on a trade-off between values from studies by Wardman, and by Van der Waard (
19
,
20
). The transfer penalty was based on Bovy and Hoogendoorn-Lanser (
21
). Using the variables described above, the additional generalized costs (AGC) in Euros in case
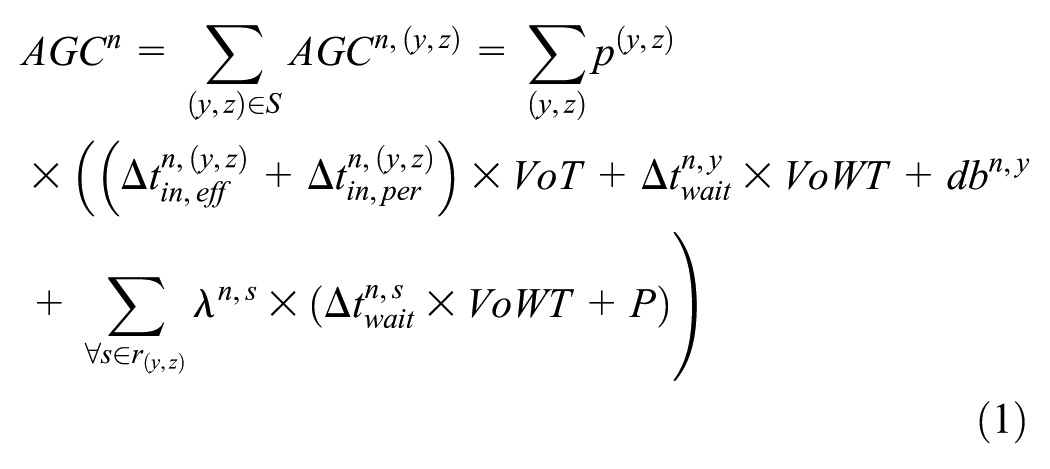
where
Generation of Alternative Strategies
As previously mentioned, simulation is used to generate alternative strategies. The inputs of the simulation are the initial situation (i.e., location of the vehicles in the network) and a service control strategy. The latter consists of dispatching times from terminals, holding times at stops, number of dispatched vehicles, and routing of vehicles. The outputs of the simulation are AVL data corresponding to the use of alternative strategies: times are recorded at the arrival and the departure of each vehicle at each stop so that a file comparable to an AVL file can be generated (Figure 1).
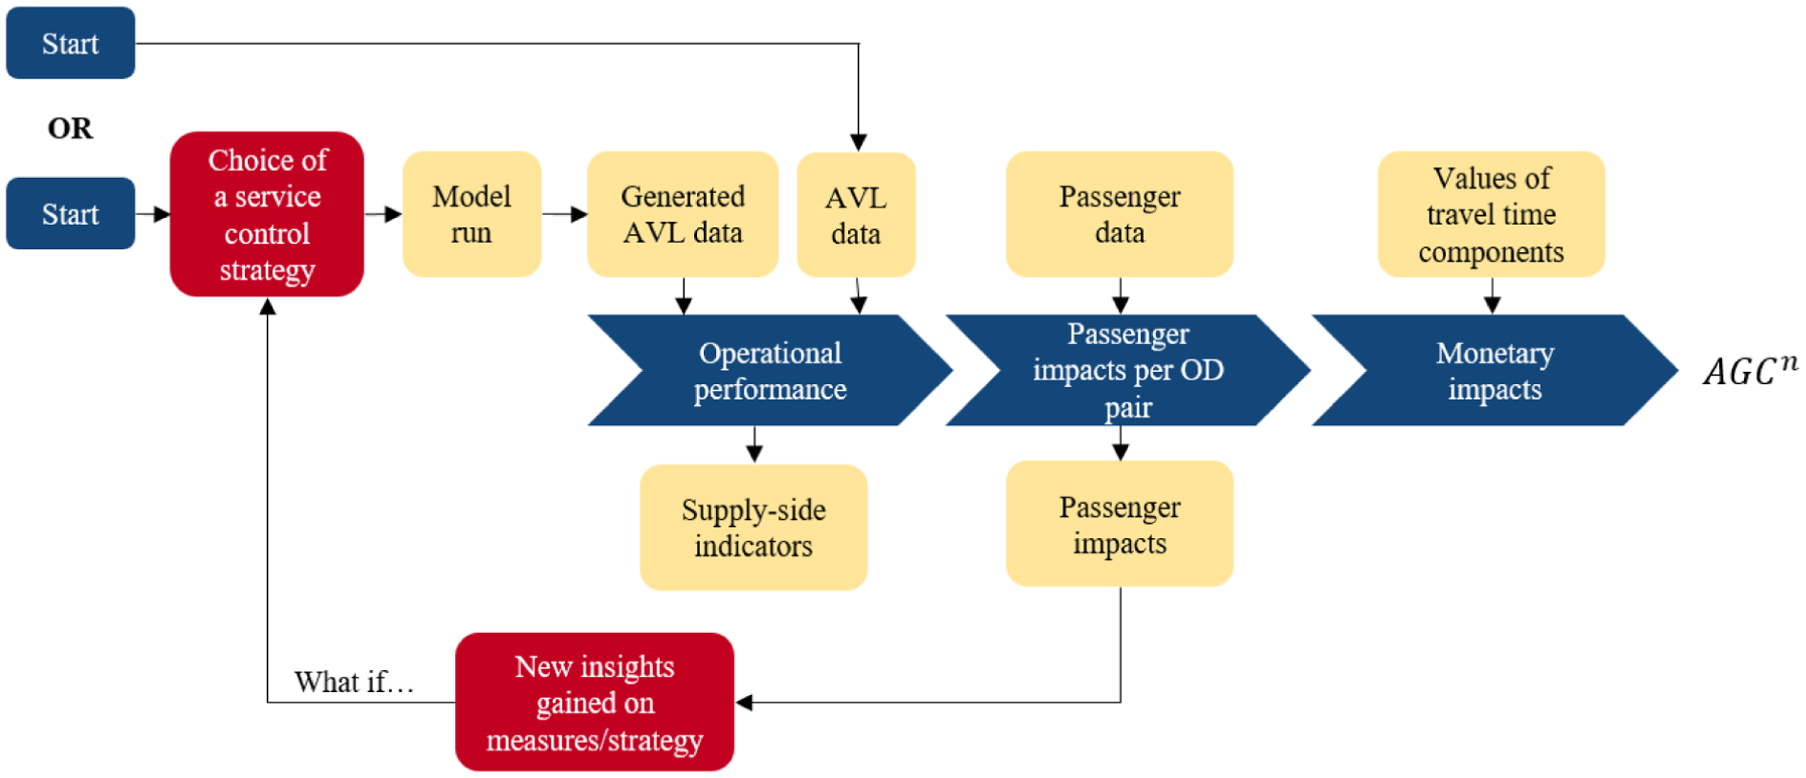
Overview of the developed framework to assess service control strategies and design alternative strategies in non-recurrent conditions from a passenger perspective.
Discrete-event simulation (using the software package Arena) was chosen because it allows for incremental changes to be easily implemented and queues to be easily modeled. In the simulation, each stop is represented as a resource. Each entity (train) successively seizes and releases each resource on its path. An entity can only seize a resource if it is available, and tracks and switches are available: this is the safety system. Otherwise, it queues. Queues follow a FIFO (first in, first out) discipline. Due to time constraints, modeling choices were made: passenger interactions were not included but APC data were used to estimate boarding and alighting rates at each stop. The time during which each resource is seized (dwell time) can be based on AVL data from previous disruptions, including expected crowding, and on when the next resource is available to seize (bunching time). Deterministic running times can be chosen if available AVL data show that this is a reasonable assumption.
Once the list of measures to be included in the assessment is established (see Rescheduling in Urban Rail Transit section) and the strategy used by traffic controllers is assessed, alternative strategies can be generated based on a “what-if” approach. The objective is to reduce AGC while making sure that improvements (on OD pairs) are not obtained at the expense of other passengers. Indeed, extreme inconvenience is likely to drive passengers away from urban transit (
22
). For each modification of a strategy, the variable inputs of the simulation model are incrementally modified by the analyst based on the results from the previously assessed strategies (passenger impacts for each OD pair). For instance, once the strategy used by traffic controllers is assessed, the analyst may decide to add, modify, or remove a measure (e.g., hold vehicles at the station
The discrete-event simulation model used within the framework was verified, calibrated, and validated before use. The selected disruption (see Presentation of the Case Study section) was reproduced with the simulation, yielding generated AVL data. These were translated into a time–distance diagram that was qualitatively validated by experienced traffic controllers. Generated AVL data were then compared with AVL data from the disruption by calculating impacts and AGC. Generated AVL data were found to slightly overestimate AGC, by 3%. This was deemed sufficient. The reader can refer to Durand for further details ( 23 ).
Case Study
In this section, the case study is presented and the framework applied. Results are then described and implications for transit operators and conclusions pertaining to the framework itself are formulated.
Presentation of the Case Study
The framework was tested with a comprehensive case study, dealing with a disruption that occurred in Rotterdam Metro. Rotterdam is the second-largest city of the Netherlands, with approximately 630,000 inhabitants ( 24 ). RET operates the metro, all trams, and most buses. In 2017, the metro network comprised five lines and 53 stations. APC data as required in the Data Needs section are available due to the use of contactless smartcards by all passengers; see Van Oort et al. for more details ( 25 ). In 2016, 54% of all check-ins at RET were carried out in the metro and the total number of trips by metro amounted to 88 million ( 26 ). AVL data are available via the Dutch nationwide AVL system ( 27 ).
The most concentrated period in terms of disruptions is 6:00–8:00 a.m., whereas 8:00–9:00 a.m. is the busiest hour in terms of check-ins. Eighty-two percent of the morning trips in Rotterdam Metro are undertaken by commuters ( 28 ). It is likely that these frequent travelers will be affected in some way by a disruption at least once a month. A generic disruption occurring during the morning peak of a working day was therefore chosen as the case study: a vehicle was blocked from roughly 8:00 a.m. to 9:00 a.m. on the northbound track of Maashaven Station. Two lines share the tracks between Rotterdam Centraal and Slinge; one extends further north whereas the other extends further south (Figure 2). During peak hours (7:00–9:00 a.m. and 3:00–6:00 p.m.), the planned frequency is 18 vehicles per h.
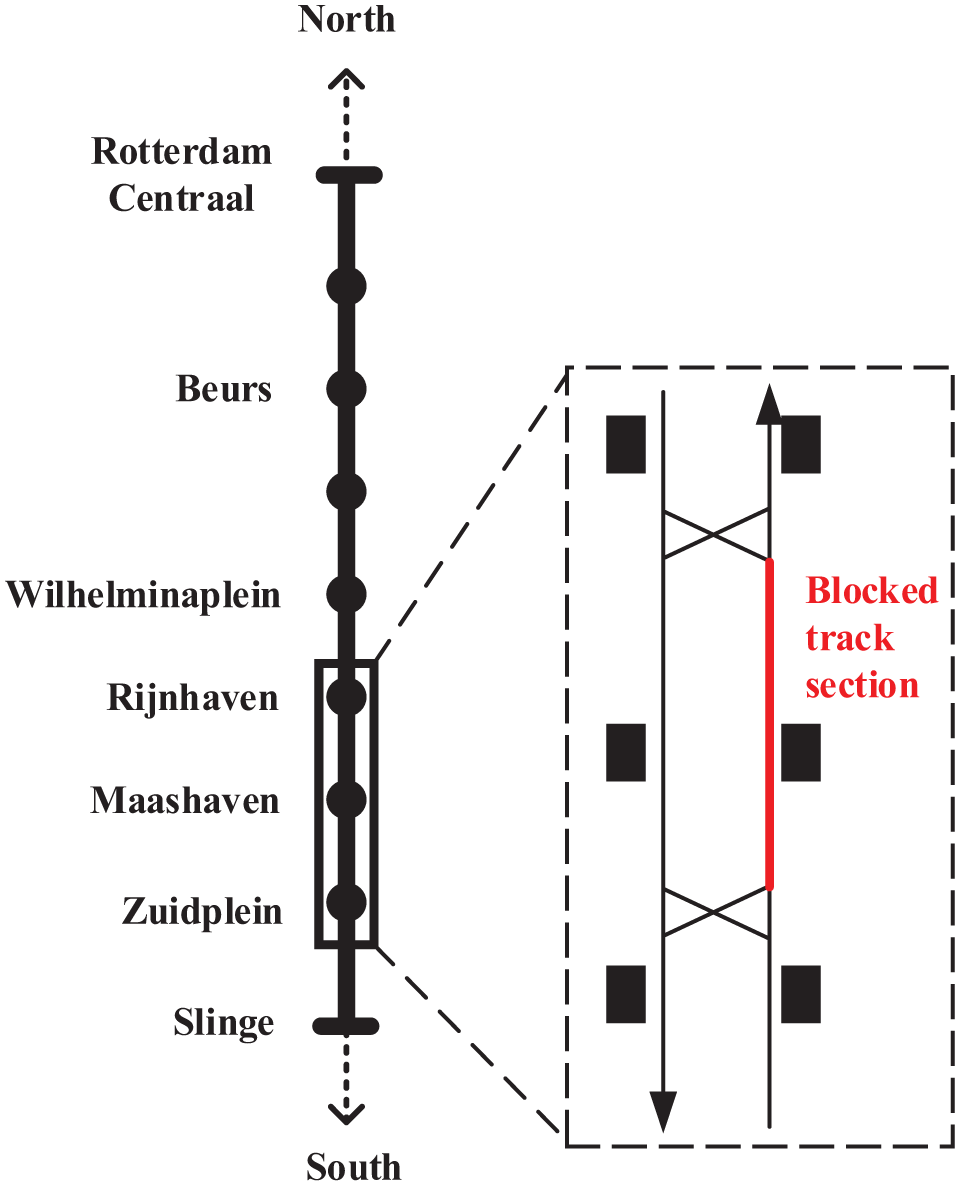
Slinge–Rotterdam Centraal track segment and zoom on the disrupted area.
The corresponding pre-plan for such a disruption states that:
All southbound vehicles from the line that extends north of Rotterdam Centraal should short-turn in Rotterdam Centraal, thereby leaving no train from this line between Rotterdam Centraal and Slinge. This reduces the frequency to 12 trains per hour between Rotterdam Centraal and Slinge.
Vehicles from the other line should drive as planned, preferably alternating two by two on the single-track segment, the bottleneck section.
On the day of the disruption, traffic controllers started by applying this plan. However, since 12 vehicles in each direction on the single-track segment create congestion on both sides of the bottleneck, they also decided after several minutes to short-turn some northbound vehicles in Slinge, to relieve the bottleneck.
Results of the Framework Application
In the assessment, only passengers starting at, stopping at, or crossing at least one station between Rotterdam Centraal and Slinge were considered. This is a good starting point given that the pre-plan aims at “protecting” frequencies beyond this segment. The assessment is carried out for 1 h, the duration of the partial blockage, that is, the incident phase, the scope of this study. Extending beyond this phase involves further quantitative considerations on vehicles and crews, which are not yet part of this research.
Performance of the Strategy used by Traffic Controllers
Smartcard AVL data were used to assess the performance of the strategy used by traffic controllers. Although there were 30% more passengers traveling northbound than southbound, the latter suffered greater inconvenience on average, especially in terms of denied boarding (Figure 3). The observed imbalance is probably due to a significant headway gap in Rotterdam Centraal, around 18 min between two southbound trains. The corresponding AGC, using the base strategy (A), amounted to €57,000 of passenger societal costs.
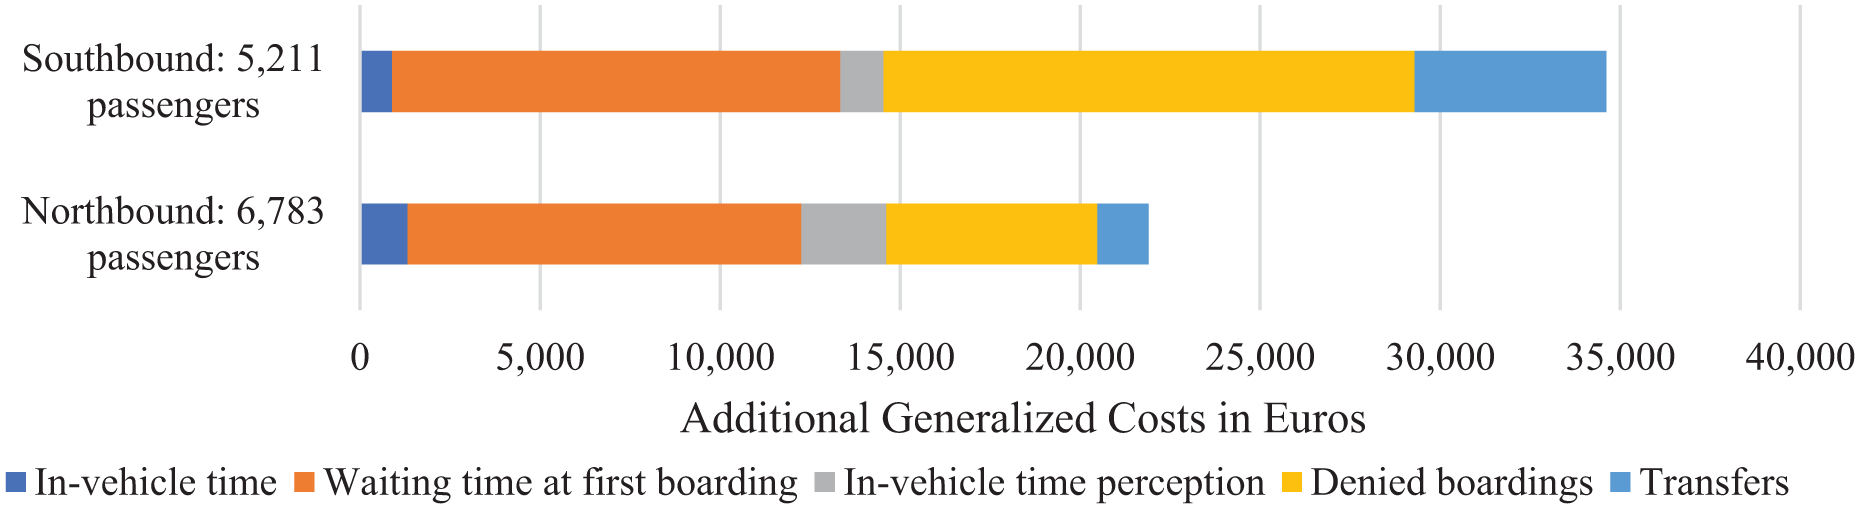
Assessment of the inconvenience experienced by passengers due to the disruption, with the strategy implemented by traffic controllers, strategy (A).
Generation of Alternative Strategies
In total, 10 alternative strategies were generated with the procedure presented in the Generation of Alternative Strategies section. The three most important alternative strategies are presented here. These strategies are named (B), (C), and (D), respectively, the latter being the best-performing strategy.
In strategy (B), the sequence of trains in the bottleneck for single-track operations was modified compared with strategy (A). During the transition phase, that is, from steady operations in recurrent conditions to steady operations in non-recurrent conditions, trains need to be sent into the bottleneck in a way that anticipates gaps in headway created by the unplanned event. Implementing this change alone reduced AGC by around 12%.
Strategy (C) consists of strategy (B) to which holding at stations for regularity purposes was added. A combination of holding upstream and downstream of the bottleneck was found to be most efficient. Around half of the vehicles were held between 30 s up to 5 min. In strategy (C), an 18% reduction in AGC was achieved compared with strategy (A).
Strategy (D) uses strategy (C) as a basis, and the implementation of short-turning in Rotterdam Centraal as described in the pre-plan is delayed. This way, a vehicle can fill the gaps in headway created by the unplanned event. A 35% reduction in AGC was achieved compared with strategy (A) and no further impacts on the branch north of Rotterdam Centraal were expected. Denied boarding and waiting time at the first stop were the two components most significantly reduced with strategy (D), with a 61% and 29% decrease in costs, respectively, compared with strategy (A).
Furthermore, structural changes such as implementing short-turnings within the Rotterdam Centraal–Slinge segment led to substantially higher AGC than with strategy (A), indicating that pre-plans designed by RET most likely form a good basis. Nevertheless, the assessment shows that there is room for improvement regarding passenger-centered strategies. With strategy (A), a passenger traveling from Beurs to Wilhelminaplein is affected more than three times as much as a passenger traveling from Zuidplein to Beurs (€10.6 versus €3.4). This is paradoxical because the first passenger is traveling upstream of the blockage and never crosses it, whereas the second passenger does cross the bottleneck. This is probably due to traffic controllers focusing their efforts on the single-track segment. With strategy (D), the inconvenience for both OD pairs is reduced (€4.2 versus €2.9 respectively). In general, more focus on regularity led to a substantial decrease in AGC for OD pairs that did not cross the bottleneck, more than for OD pairs that did. Because of the ripple effects of a disruption, some OD pairs that do not cross the bottleneck remain more affected than OD pairs using the single-track segment. Nonetheless, a positive correlation was found between a stricter control of regularity – making sure that headway gaps were not becoming too large – and a decrease in total AGC.
Sensitivity Analysis
The starting point of this study was the current approach at RET, which is why the crush capacity
Even with increased crush capacities, trends remained similar. There was still a decrease by around 35% in AGC with strategy (D) compared with strategy (A) and denied boarding still occurs with all strategies, although to a lesser extent with strategy (D). This analysis allowed derivation of bandwidths for the results (Table 1). Such bandwidths were even more relevant, as simulation outputs were shown to slightly overestimate AGC (see Generation of Alternative Strategies section).
Bandwidth for Additional Generalized Costs
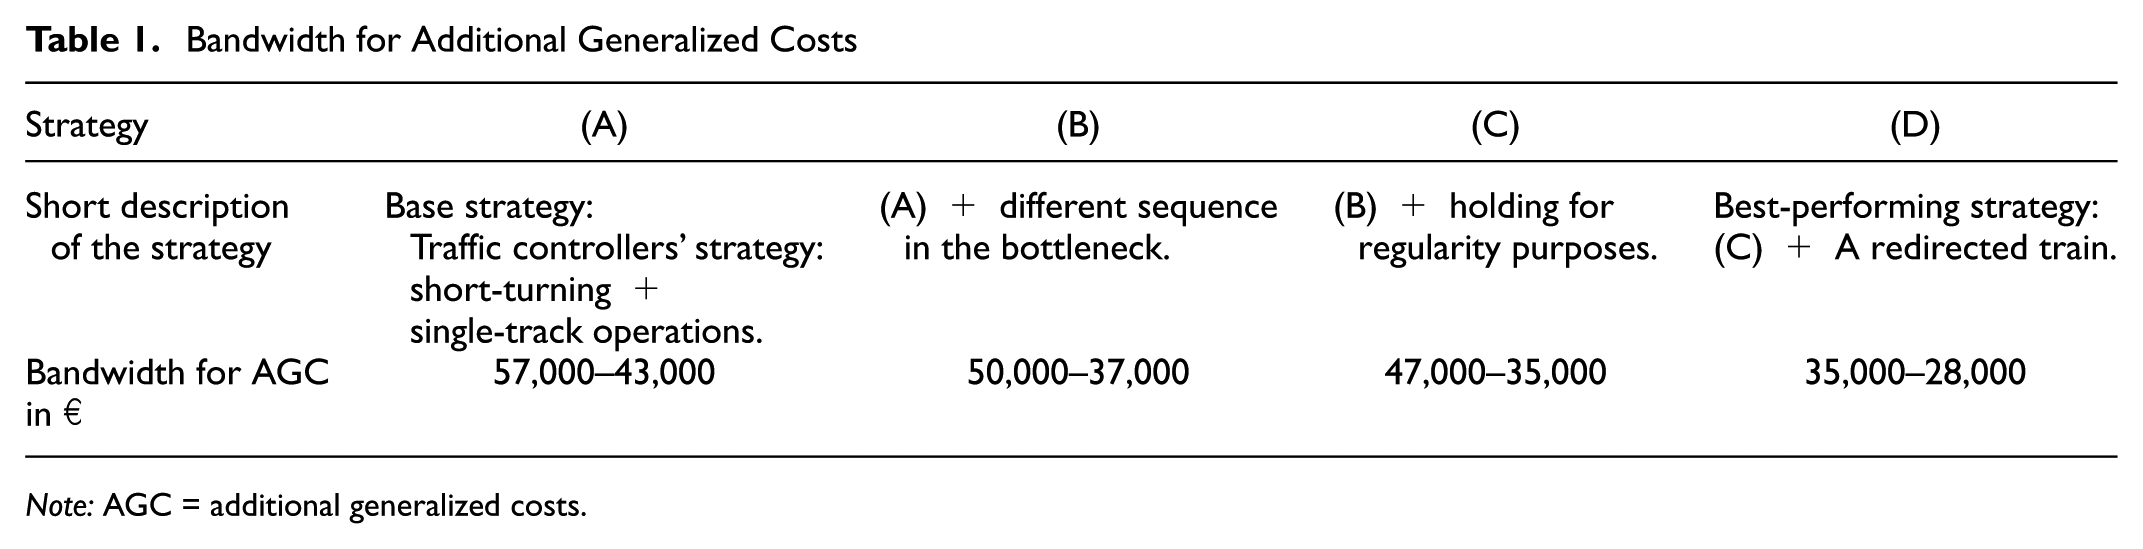
Note: AGC = additional generalized costs.
An estimate for yearly AGC savings can be computed based on these bandwidths. In 2016, approximately 60 disruptions like the case study regarding time, duration, and cause occurred in the RET metro network. Assuming around €15,000 of savings in AGC per incident, savings for passengers could amount to approximately €900,000 if every disruption like the case study was addressed with a strategy similar to (D) (a saving of €1 of AGC means reducing the waiting time of one passenger by 5 min).
The final step of the framework test is the validation of results. No quantitative validation was done because of the constraints of the project, however multiple interviews were conducted. Technical experts at RET all found both the qualitative and the quantitative results to be reasonable and realistic; moderate changes in strategy led to moderate – yet non-negligible – improvements. The authors therefore consider the framework to be currently valid and are working on an improved validation process.
Implications in Practice for Operators and Authorities
Although a significant part of this research was a case study, multiple insights are transferable to other operators and authorities worldwide; a global lack of passenger focus has been observed by Van Oort ( 29 ). In non-recurrent conditions, traffic controllers need to focus more on regularity at a network scale. Focusing on regularity has already been found to be beneficial for passengers ( 30 ). However, traffic controllers are used to working with a punctuality paradigm as their daily goal is to ensure that deviations from the operations plan (timetable, crew, and vehicle schedules), built on punctuality, are as small as possible. This is the main dilemma. Nevertheless, authorities and operators should strive to make it easier for traffic controllers to focus on passengers when needed. Such organizations should therefore ask themselves the following questions:
Are traffic controllers sufficiently aware of passenger issues related to a lack of regularity? Busy with daily work, some may not be completely aware of the punctuality paradigm. Furthermore, they may have been metro train drivers in the past, resulting in a particularly acute awareness of crew and vehicle issues.
Is the work environment of traffic controllers conducive to a focus on regularity when needed? For instance, at RET, controllers can see train delays on control screens, but no regularity-related indicator is displayed, such as the time elapsed since the last train at each station. This makes it almost impossible for them to spot or anticipate gaps in headway. Pre-plans and their application should also be questioned.
Are there elements outside of the traffic control center (tactical, strategic levels) that may indirectly contribute to traffic controllers’ limited focus on passengers? For instance, operations at RET are being analyzed with indicators that are typically not passenger-oriented, a conclusion based on a comparison between the metrics used at RET and those suggested by Barron et al. ( 31 ). Moreover, the incentives defined by the authority that grants RET the right to operate Rotterdam Metro as a concession are mostly punctuality-based. These incentives do afford traffic controllers some freedom to focus on regularity without the risk of being fined, but this involves strict registration and justification of every action, which is currently materially impossible.
Modifications of the work environment and procedures are likely to increase traffic controllers’ workload, at least on a short-term basis. Changes should be gradual and consider the existing work culture. For instance, RET could start by implementing regularity-related indicators in their monitoring system and by modifying pre-plans. They could include peak-hour variants and estimated capacity for a given bottleneck for each potential partial blockage. Such changes would already allow for traffic controllers to be more proactive.
Reflection
In the assessment, it is assumed that passengers do not reroute or cancel their trips. The no-rerouting assumption may not always hold. In 2017, 79.2% of the Dutch population had a smartphone and used it to access the Internet at least once every three months ( 32 ). Passengers are likely to use a journey planner to quickly reroute. Some may simply know the network and find alternatives routes themselves. Parts of the network in the case study offer limited alternatives, but the assessment may still have overestimated denied boarding and waiting time costs. The no-cancellation assumption may be more correct as, during the morning peak, 82% of the passengers on Rotterdam Metro are commuting for work and study ( 28 ). Thus, it would be difficult for most people to postpone their trips. Further research on these assumptions would be needed.
If these passengers were to experience frequent and serious inconveniences, they may be driven out of the system. Therefore, an additional impact in the assessment could be the “long-term effect” of a disruption. Reliability buffer time (RBT) could be used for this purpose. Uniman et al. define this as the difference between the 95th percentile travel time and the 50th percentile travel time ( 33 ). An RBT of 5 min therefore means that if a commuter plans 5 min of buffer time for their journey, they will reach their destination on time 95% of the time. A high RBT in non-recurrent conditions might lead passengers to readjust their departure time, extending the impacts of the disruption to multiple days or weeks. A long-term effect can thus be computed. In general, using extreme-value-based impacts instead of average impacts is recommended, because they better reflect passengers’ perceptions of traveling and thus inconvenience ( 22 ). However, a simulation with a greater level of detail would have been required to make the use of extreme-value-based impacts relevant. Average values were deemed more likely to be accurate for this study.
Conclusions and Recommendations
This study aimed to determine how service control strategies used in urban rail systems could be improved and developed when the passenger perspective is considered. The framework allowed assessment of the inconvenience experienced by passengers during the incident phase of a disruption. It also allowed for the development and comparison of the performance of various service control strategies in response to one specific disruption, each strategy yielding a different quality of service. In the Rotterdam case study, societal passenger costs were reduced by up to €7 per passenger (e.g., one unplanned transfer and 30 min of waiting time) for certain OD pairs with the best-performing strategy. Yearly savings in societal passenger costs could amount to approximately €900,000 if every disruption like the case study is addressed with an approach similar to the best-performing strategy.
Based on the study results, insights were gained into passenger-centered disruption management in high-frequency, rail-bound transit systems in general that could apply to transit operators and authorities worldwide. In such systems, pre-plans should exist for potential full or partial blockages and provide variants for peak hours, highlighting potential capacity issues. In addition, results suggest that real-time decisions favoring regularity considerations could benefit passengers considerably. However, instead of attributing by default the lack of passenger focus to traffic controllers, operators should first question whether traffic controllers are able to focus on regularity. Moreover, all levels of a company (operational, tactical, and strategic) could potentially influence the amount of attention passengers are given during disruptions. Naturally, all changes come at a cost. Therefore, it is suggested that decision makers use the outputs of the framework developed in this study as inputs for a cost-benefit analysis, to determine the extent to which being passenger-oriented is worthwhile.
Furthermore, insights were gained into the single-track operations measure. In rail-bound transit systems, this measure allows avoidance of cutting a full segment because of a partial blockage. There were two main findings: first, planners and traffic controllers should have an idea of the capacity the single-track segment can reasonably sustain and, second, single-track operations need to be associated with proactive holding upstream of the bottleneck to prevent major irregularities. Nonetheless, conducting more research to gain a better understanding of the different variables that influence the performance of this measure is suggested. Three other areas of research are also suggested for the medium term. First, more research regarding the behavior of urban transit passengers during unplanned non-recurrent conditions could be useful, to better understand how, why, and which passengers choose to reroute or give up on their trips. It would also be useful to know what might drive passengers away from urban transit. Once there is more knowledge in these areas, passengers could be modeled as entities in future simulations and passenger interactions could be properly taken into account. Second, undertaking more research on in-vehicle crowding is recommended. Indeed, capacity was found to be a major variable of the assessment and thus deserves attention. Further studies could use AVL and APC data to determine crush capacities more precisely. In general, it would be interesting to know which factors influence crush capacity and how. Third, extending the assessment with some non-passenger-related impacts, such as the impact on crews is recommended. Ultimately, this would allow the framework to be applied to the recovery phase. The framework would then provide even more meaningful insights into the possible trade-offs that could be made by traffic controllers during a disruption.
Footnotes
Acknowledgements
This research was made possible owing to working closely with RET, which provided the necessary data, resources, and support to complete this study. The authors thank the anonymous reviewers for their valuable comments.
Author Contributions
The authors confirm contribution to the paper as follows: study conception and design: AD, NVO, SH; data collection: AD; analysis, interpretation of results, and draft manuscript preparation: AD, NVO, SH. All authors reviewed the results and approved the final version of the manuscript.
The Standing Committee on Transit Management and Performance (AP010) peer-reviewed this paper (18-00524).