
Abstract
Insight into factors influencing the choices people make in case of an evacuation from a natural disaster can help governments and emergency management personnel to manage people in case of such a situation. One of the aspects that influences the choices that people make in such a situation is herding. Since herding has not been quantified, this paper focuses on quantifying the effect of herding on the decision to evacuate by using an experimental setup that is based on the serious game Everscape. Around 400 people participated in 13 experiments with this setup. Choice models were estimated with the data from these experiments by including observable characteristics of herding as an attribute into the utility function. It is concluded that an important step is made in quantifying herding. It is shown that the more people someone sees leaving, the more inclined this person is to leave. Seeing people leave has more impact than seeing people stay. When people have no information from official sources, they tend to use other people as a source of information. In case of a disaster, this might result in following people who make the situation even more dangerous (for themselves and possibly for others as well). The information provided by official sources is therefore essential in managing people in the best possible way in case of a natural disaster.
It is known from research that many different aspects influence the decision to evacuate or not in case of a natural disaster, for example, disaster characteristics, instructions, and a person’s social situation. In the case of a hurricane, for instance, people are more likely to evacuate when the storm is more severe ( 1 , 2 ). When people receive evacuation instructions that are directed to them personally, they are more likely to evacuate than when these instructions are not personally directed ( 3 ). With respect to a person’s social situation, the household especially has an impact on the mobility patterns ( 4 ).
In case of an evacuation, people may also be influenced by the behavior of other people, and copy this. Ariely considers this to be herding behavior, and defines it as seeing other people doing something and believing that what they are doing is a good alternative, resulting in doing the same thing ( 5 ). With animals, herding leads to having anti-predator or foraging benefits ( 6 – 10 ). With people, individualism allows people to detect a good solution; for example, in the case of an evacuation from a building, people are able to detect the exits. Herding might lead to the imitation of successful alternatives ( 11 ). To the authors’ knowledge, the effect of herding on evacuation choices has not been quantified empirically.
Doirado et al. and Van den Berg et al. described the development of an experimental setup using the 3D multi-user virtual environment (or serious game) Everscape, in which a group of people participates simultaneously ( 12 , 13 ). A serious game is defined as a game which is used for other purposes than pure entertainment. In this case it is used for research, but it could also be used for education or training purposes ( 14 – 16 ).
Everscape consists of a virtual island, where an avatar is appointed to each participant. With this avatar, each participant can walk and drive around on this island. He or she can also see the other avatars and what they are doing. Beforehand, participants know they will go to this island to see a concert but during this concert there is an earthquake and they have to evacuate for a tsunami. The authors believe that the experimental setup using Everscape is a suitable technique to quantify the effect of herding on the decision to evacuate.
The main objective of this paper is therefore to quantify the effect of herding on the decision to evacuate with the use of the experimental setup with Everscape. More specifically, the study aims to answer two specific research questions:
Does herding behavior influence the decision to evacuate?
If herding influences the decision to evacuate, how does it work?
To answer the research questions, the research approach consists of several steps. The experimental setup using Everscape is developed to focus on quantifying the effect of herding. Choice models are subsequently estimated with the data from the Everscape experiments to answer the research questions. Finally, the conclusions and recommendations for further research are presented.
Data Collection with Everscape
The experimental setup with Everscape at its core was designed to focus on quantifying the effect of herding on the decision to evacuate. The setup consisted of three parts: an introduction, the experiment with Everscape, and filling in a questionnaire.
Everscape Tool
In Everscape, which was created in cooperation with the National Institute of Informatics (in Tokyo, Japan), the considered scenario is as follows: people arrive on an island by helicopter and upon arrival they all take a car and drive to a concert themselves. For an impression of the concert area, see Figure 1. When all people are at the concert, an earthquake is triggered.
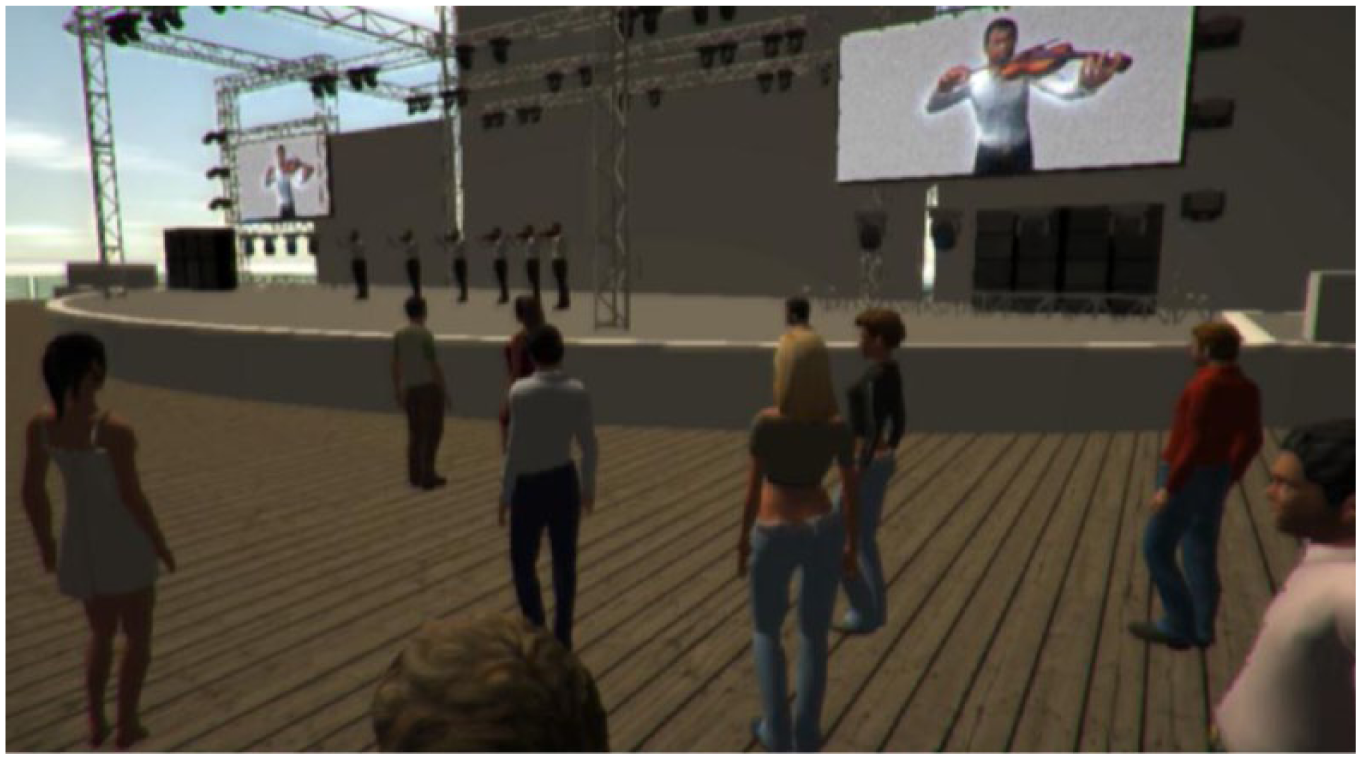
Impression of the concert area in Everscape.
The earthquake consists of shaking of the ground and a rumbling sound. As a result of the earthquake, the concert stage partly collapses. After the earthquake, there is a moment of silence, followed by a news item, which informs people they have to evacuate the island because of a tsunami that will soon arrive. In the news item, they are instructed to travel back to the helicopter and they are informed about their travel options: a direct train connection and two options by car. By car, they can drive via a short route along the beach and a longer route through the mountains. The news item abruptly ends. Those who are not able to make it to the helicopter on time do “not survive.” After the news item, the expected arrival time of the tsunami is shown throughout the rest of the scenario. For an impression of the Everscape scenario, see the movie of one of the first experiments online ( 17 ).
Setup of Everscape Experiments
The full experimental setup consists of three parts. These are explained below.
Part 1: Introduction to Experiment
Upon arrival at the experiment, each participant sat down behind a computer. At their computer they found a set of documents. The first document included their participant id, which they had to use throughout the entire experiment. They also had to sign this document before the start of the experiment, stating they participated voluntarily and the researchers could use the data anonymously. Parents of participants younger than 18 had to sign this form for them. The second document included a brief description on how to use the controls during the virtual part of the experiment with Everscape.
When every participant had signed his or her informed consent form, an introduction was given to the participants. In this introduction, it was explained that the experiment consisted of a virtual part and a questionnaire. In the virtual part, they would visit an island to see a concert. They would arrive on the island by helicopter and then each of them would have to drive to the concert by car. The introduction included a short demonstration on how to use the controls.
Part 2: Virtual Experiment with Everscape
The second part of the experiment was the actual experiment with Everscape. During this part of the experiment, one person was managing the process. This same person gave the introduction. A second person was behind the admin computer to see if everything went well and to give a sign when everyone was at the concert area. When this was the case, the earthquake was triggered. Two extra people were in the room to help if there were any questions.
Part 3: Questionnaire
After the virtual experiment with Everscape, each participant filled in a questionnaire, which included questions on their socio-economic characteristics, their computer and gaming experience, their experience with (evacuations from) disasters, and questions on what they did during the virtual experiment and why.
The Experiments and the Participants
In total, 13 experiments were conducted with on average 27 people per experiment. The first two experiments were with students only, who were recruited via a student employment agency. Because of technical problems, it was decided to first do experiments with students only. When this worked, other people were invited for the rest of the experiments.
To recruit the other participants, announcements were placed at the website of Delft University of Technology, at the website of the Faculty of Civil Engineering and Geosciences, via the news paper of Delft University of Technology (Delta), via a local newspaper (Delft op Zondag), via a local radio station (Omroep West), and on social media (LinkedIn, Facebook, and Twitter). The announcements stated that the study was going to test a new type of experiment for research on travel choice behavior. Nothing was said about disasters or evacuations. Participants could register via a website and choose their preferred day and timeslot. They all received a €25 gift check after participation. Except for the first two experiments in which only students participated, in the other experiments a mixed population took part, with ages ranging from 12 to 78 and around an equal share of men and women. Because of technical limitations the maximum number of participants was fixed to 38. This resulted in five more experiments than originally planned but with fewer people per experiment.
Available Data
After the experiments, the available data consisted of two datasets. The first dataset included data from the virtual experiment with Everscape. The second dataset included data from the questionnaire. In Everscape, the behavior of each participant was closely monitored during the virtual experiment ( 13 ): “the data were collected at a 1.0 (s) time and at a 0.1 (m) position resolution along with viewing directions (resolution of 1). Furthermore, the following data from the events that occurred were logged:
starting time of the earthquake
timing of the tsunami
departure time of the train
departure time of the helicopter
when a participant got in / out of a car, the train, or the helicopter”
To link the Everscape data to the questionnaire, each participant received a participant id. They filled this in before both parts of the experiment.
Approach to Quantify Effect of Herding on Evacuation Decisions
Before discussing the approach to quantify the effect of herding, the mindset of the participants during the experiments was considered. As data were collected with a serious game, the question could be if people participated seriously. During the experiments nothing was said about a game; the participants were informed that they took part in an experiment with a virtual part. To find out how their mindset was, the authors asked about participants’ goals during the Everscape part of the experiment and also looked at the trajectory data. Of every participant their goal was to, for example, “survive” or “get back to the helicopter.” The trajectory data showed that all participants at least tried to evacuate. From this, it was concluded that the participants were taking the experiments seriously.
Every participant evacuated the concert area. The differences were the characteristics of the situation they were in before they evacuated. For example, did people leave before they had received the information and instructions via the news item, or did they leave after they had received this? How many people did they see and what were these people doing?
To quantify the effect of herding on the decision to evacuate, (discrete) choice models were estimated. As discussed earlier, with herding, it is the behavior of other people that is copied. It was therefore decided to quantify the effect of herding by including the actions of other people. This makes it possible to use observable characteristics of herding as an attribute into the utility function.
The herding phenomenon involves the behavior of other people, but it is not known how this exactly works: what do people actually see? Do they see other people leaving or staying (or both)? Do they see this in a split second or over a longer period? And when do they make the decision to evacuate? Is this a continuous decision process or not? The moment that each participant left the concert area was known. This was used as the basis, and it was decided to use a systematic approach to consider herding and cover a range of possibilities of the herding phenomenon.
To include observable characteristics of herding as an attribute into the utility function, the Everscape data had to be processed. After this process, it was known, per participant, when he or she started to leave toward the exit of the concert area. Also known per participant and per second was the numbers of people that were seen while they were staying at and leaving the concert area.
To make it possible to estimate choice models, it was assumed that people also decided to stay. Figure 2 shows the decision tree that has been used.
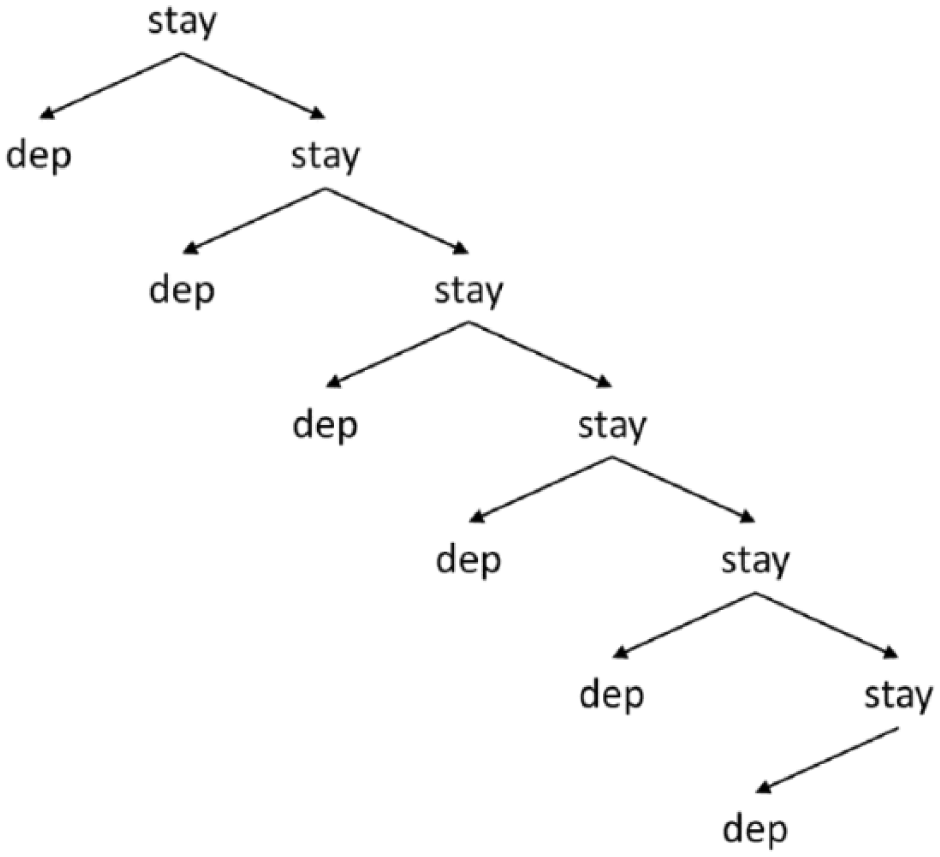
Decision tree on staying at and leaving the concert area.
Figure 3 shows a sequential choice process with one departure choice (D) and six assumed stay choices (S). Intervals of 5 seconds were added between the choices to make sure there were intervals with different characteristics, for example, different numbers of people that were seen but also differences in what was happening in the Everscape scenario itself.
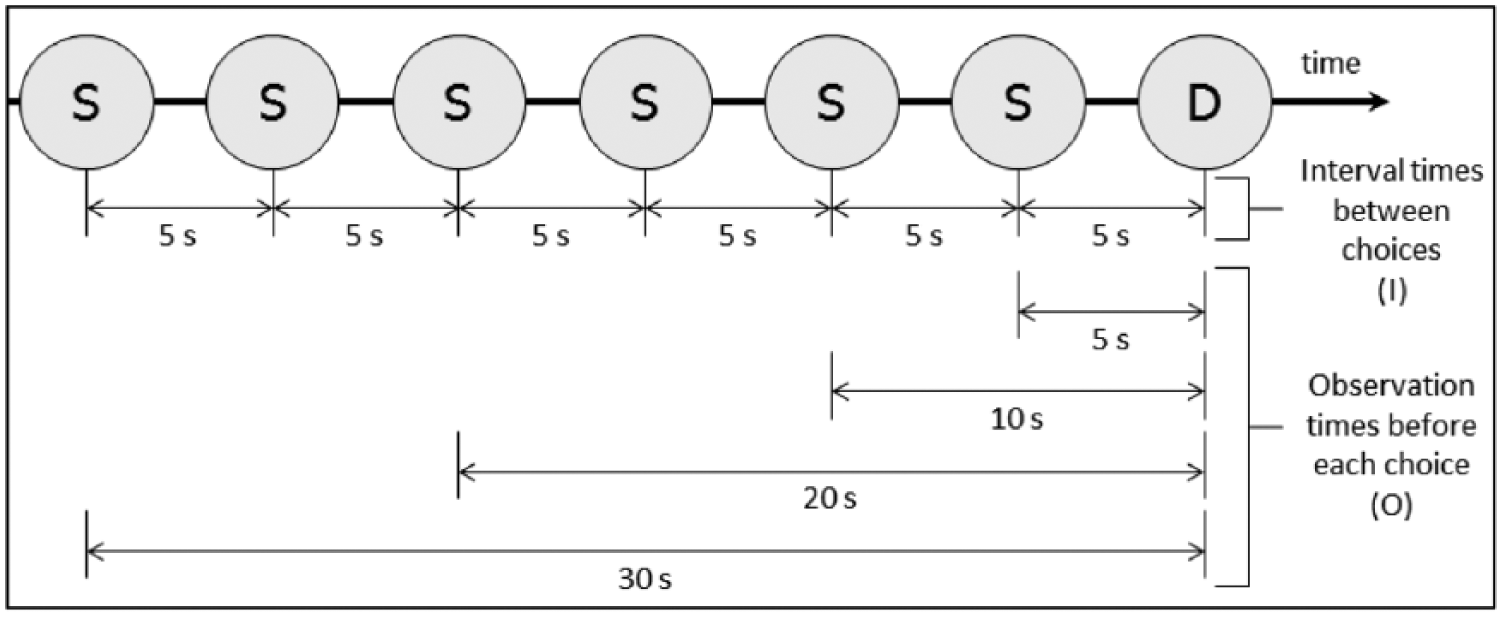
Herding data used to estimate the choice models.
To include the actions of other people in a systematic way, the authors wanted to cover a range of options on what participants might have observed. Therefore, different observation times were included. Note that Figure 3 only shows the observation times before the departure choice moment; data were also calculated for the stay choice moments.
An observation time of 5 seconds, for example, means that within the 5 seconds prior to the decision to leave, the numbers of unique people that were seen within that time frame were calculated. As with the interval times, the observation times were also chosen in a systematic way to cover a range of options. Because of the duration of the Everscape scenario and the duration of the different phases in Everscape (before the earthquake, during the earthquake, during the news item, after the news item), a maximum of 30 seconds of observation time was used.
Choice models were estimated with Biogeme ( 18 ) in two steps. Step 1 of the choice modeling process involved estimating binary choice models, which included herding as an attribute in the utility function. See Equation 1 for the utility function representing the choice to leave the concert area and Equation 2 for the utility function representing the choice to stay at the concert area. Both utility functions consist of an alternative specific constant (ASC), which was fixed in Ustay to easily compare both utilities and find out if people were inclined to leave or stay. The herding attribute is β. The analysis was focused on the ASCs, βs, adjusted ρ², and final log-likelihood:


Figure 4 shows all different choice set combinations of staying at (S) and leaving the concert area (D). Depending on the choice set, different combinations of observation and interval times were considered. For example, O5.I5.II means that two choices are included (one departure choice and one stay choice) for an observation time (O) of 5 seconds before each choice and an interval time (I) of 5 seconds between the choices. No overlapping observation times were included to consider every different action of each person once.
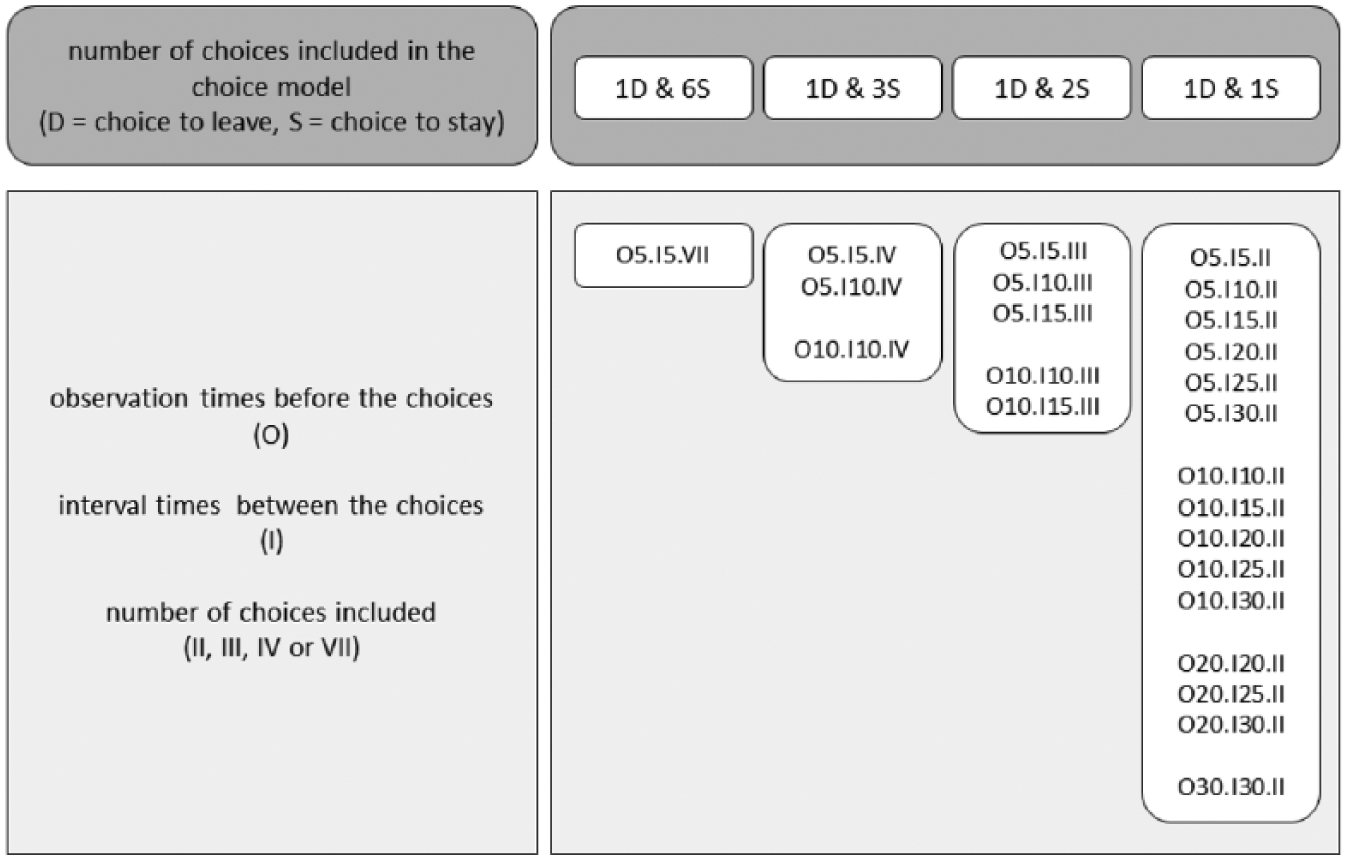
Step 1 of choice modeling process, structured approach to determine herding.
Step 2 of the choice modeling process involved estimating latent class models to find out if a segmentation on herding can be made based on other characteristics. To find out if personal characteristics influenced herding, age and gender were considered. To consider the effect of the situation, the news item was used. This meant determining if people had received information through the news item or not before their decisions to stay and leave. Finally, to find out if gaming experience caused a bias in the results, this is considered as well.
With latent class models it is assumed that different classes exist that each have homogeneous preferences. The classes cannot be observed, and emerge from the estimation process. A separate set of parameters (of multinomial logit [MNL] type) is estimated for each class.
Before discussing the results in detail, it should be stressed that the panel effect was considered to find out if the choices from the same person were correlated. Based on too high p-values, it was concluded that there was no panel effect. Therefore, the panel effect is not considered later in the choice modeling process.
Estimation Results on Herding Effect on Decision to Evacuate
This paper discusses a selection of the results from the estimated choice models, for a complete overview, see Van den Berg (Chapter 5) ( 19 ). The results of the two steps introduced in Chapter 3 are here.
Step 1 focuses on determining if and how herding works. How often do people make the decision to stay or leave? Do they consider other people that stay or leave (or both)? What is the effect of observation time before the decision to stay or leave, and what is the effect of different interval times between choices? Step 2 will discuss the results of latent class models to find out if a segmentation on herding can be made based on age, gender, and information via the news item. Gaming experience is considered to find out if it caused a bias in the results.
Results of Step 1: Structured Approach to Herding Phenomenon Modeling
In the first step of the choice modeling process, the goal was to find out if herding exists and, if so, how it works. Tables 1–4 show the results for (Part A) the effect of the number of included choices, (Part B) the effect of seeing people leave versus seeing people stay, (Part C) the effect of observation times before each choice, and (Part D) the effect of interval times between choices. The p-values are included between parentheses.
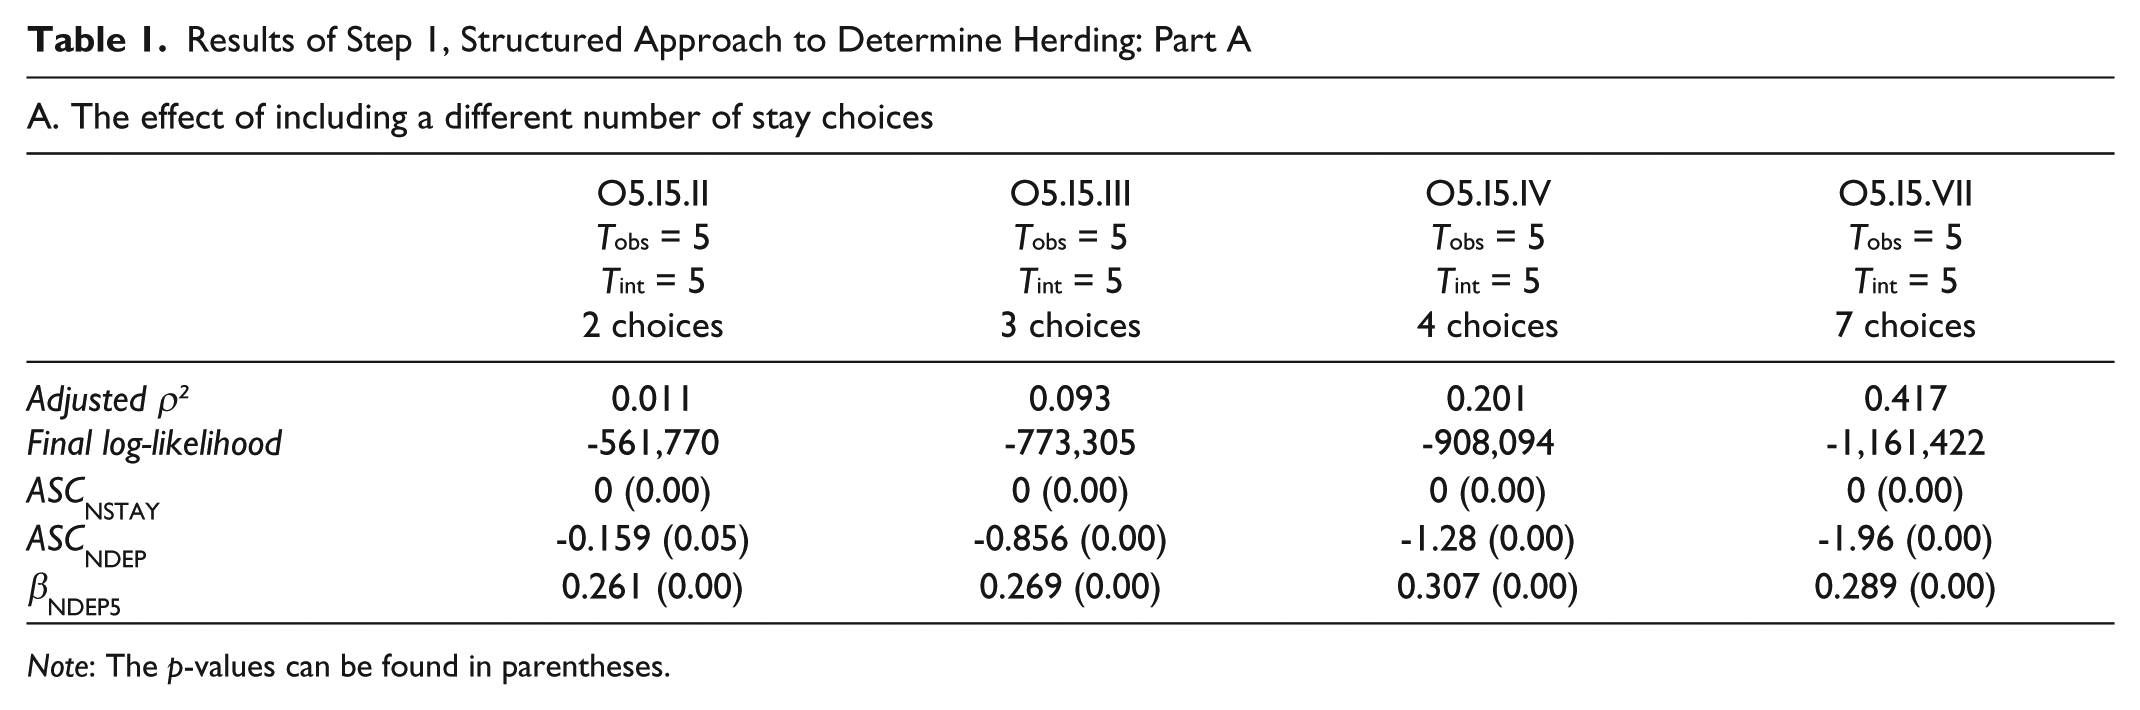
Results of Step 1, Structured Approach to Determine Herding: Part A
Note: The p-values can be found in parentheses.
With respect to the number of included stay choices, Part A (Table 1) shows that when more choices are included, the adjusted ρ² and the final log-likelihood increase. Because the sizes of the datasets that are used to estimate these four models are different, the only option to compare the models is to find out if the results are consistent. The most important result is that even though people were inclined to stay at the concert area (ASCNDEP is smaller than ASCNSTAY), the positive value for βNDEP5 shows that the more people they saw leaving, the more inclined they were to leave themselves. The results of these models are consistent in confirming herding.
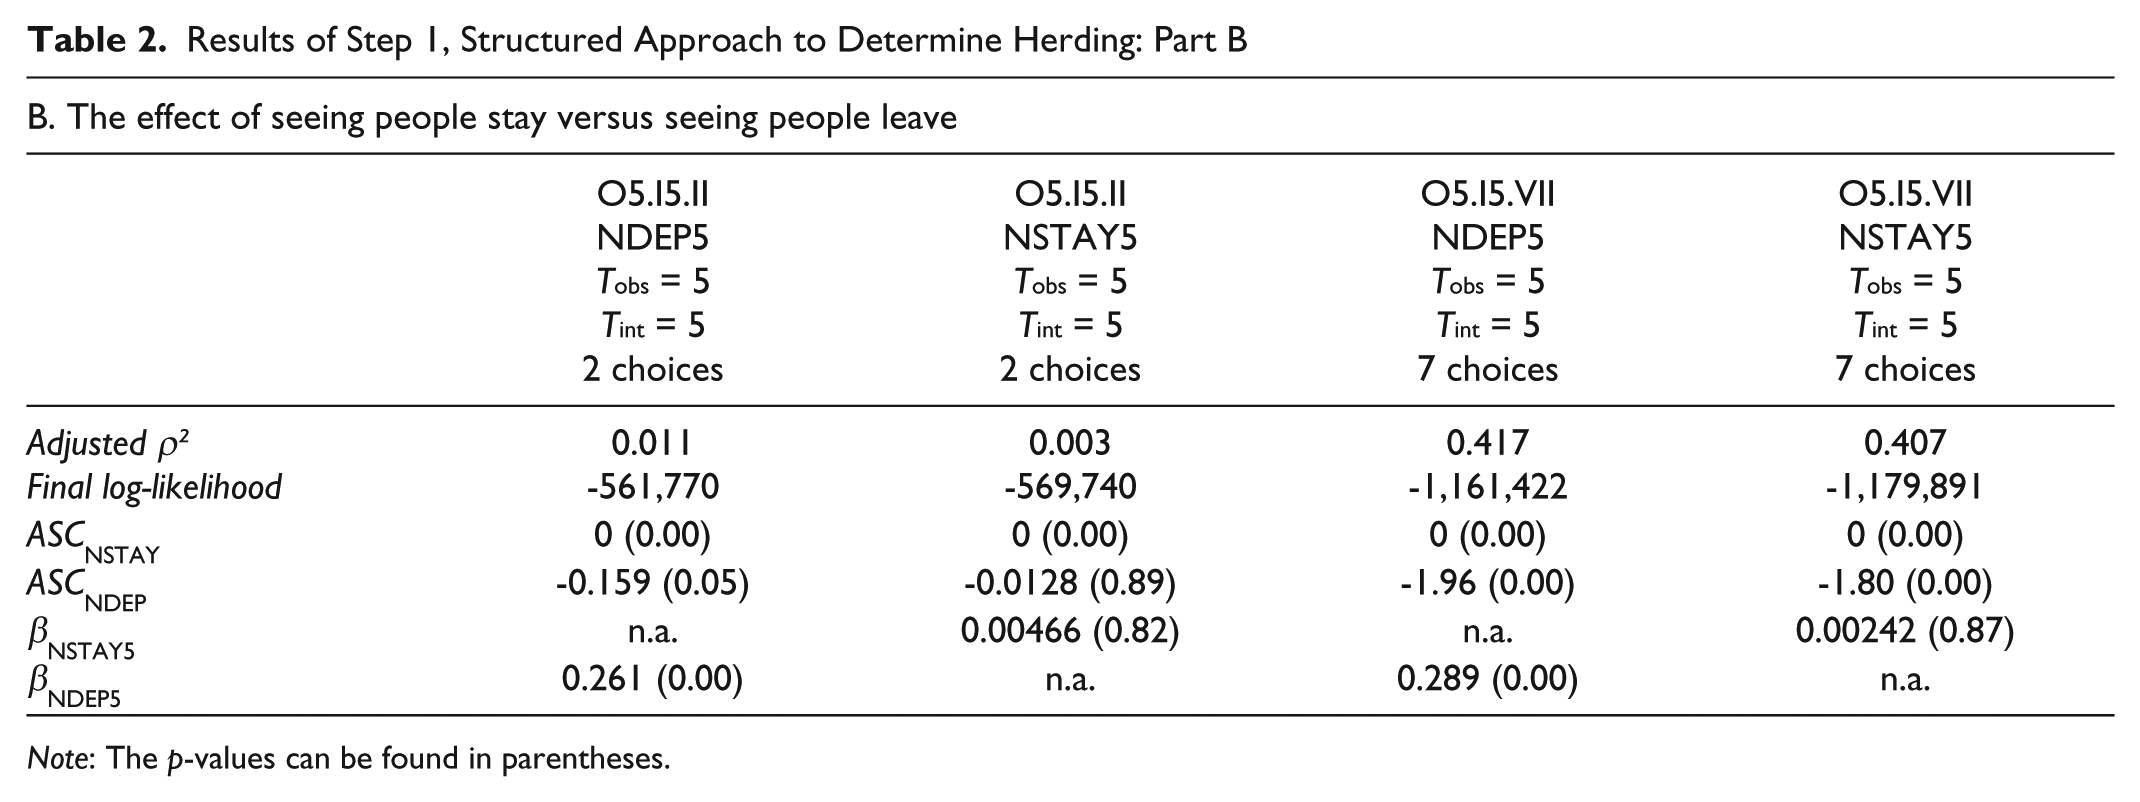
Part B (Table 2) presents the results for determining the effect of seeing people leave versus seeing people stay. The results are shown when including two choices in the dataset (columns 1 and 2) and when including seven choices (columns 3 and 4) in the dataset. Columns 1 and 3 show the results when only the number of people seen that were leaving are included; columns 2 and 4 show the results when only the number of people seen when they were staying are included. Because of differences in sizes of the datasets, columns 1 and 2 can be compared, and columns 3 and 4 can be compared. From comparing columns 1 and 2, seeing people leave has more effect than seeing people stay. This is confirmed by comparing the results of column 3 with column 4 (βNDEP5 is larger than βNSTAY5). Throughout the rest of the choice modeling proces of Step 1, the focus is on including the people that were seen while they were leaving.
Results of Step 1, Structured Approach to Determine Herding: Part B
Note: The p-values can be found in parentheses.
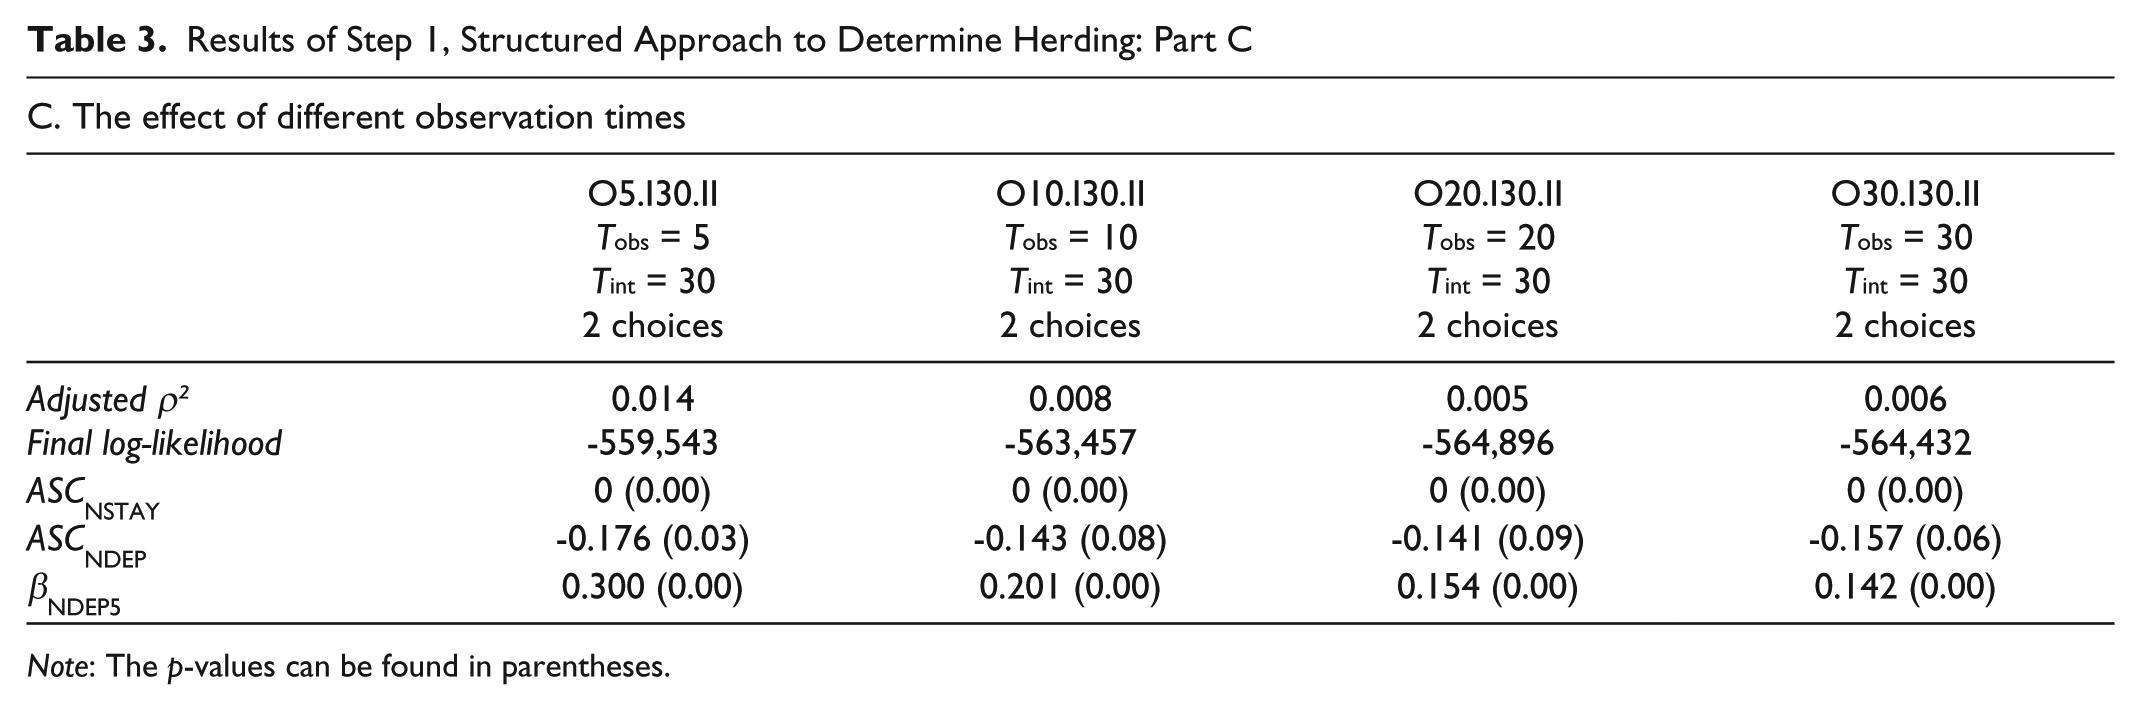
To find out how much observation time is considered, Part C (Table 3) shows four modeling results when different observation times are included. The interval times and number of included stay choices are consistent over these models. Based on the adjusted ρ² and the final log-likelihood, the model that performs best is the model with an observation time of 5 seconds. This suggests that the last few seconds before the decision is made influences this decision the most.
Results of Step 1, Structured Approach to Determine Herding: Part C
Note: The p-values can be found in parentheses.
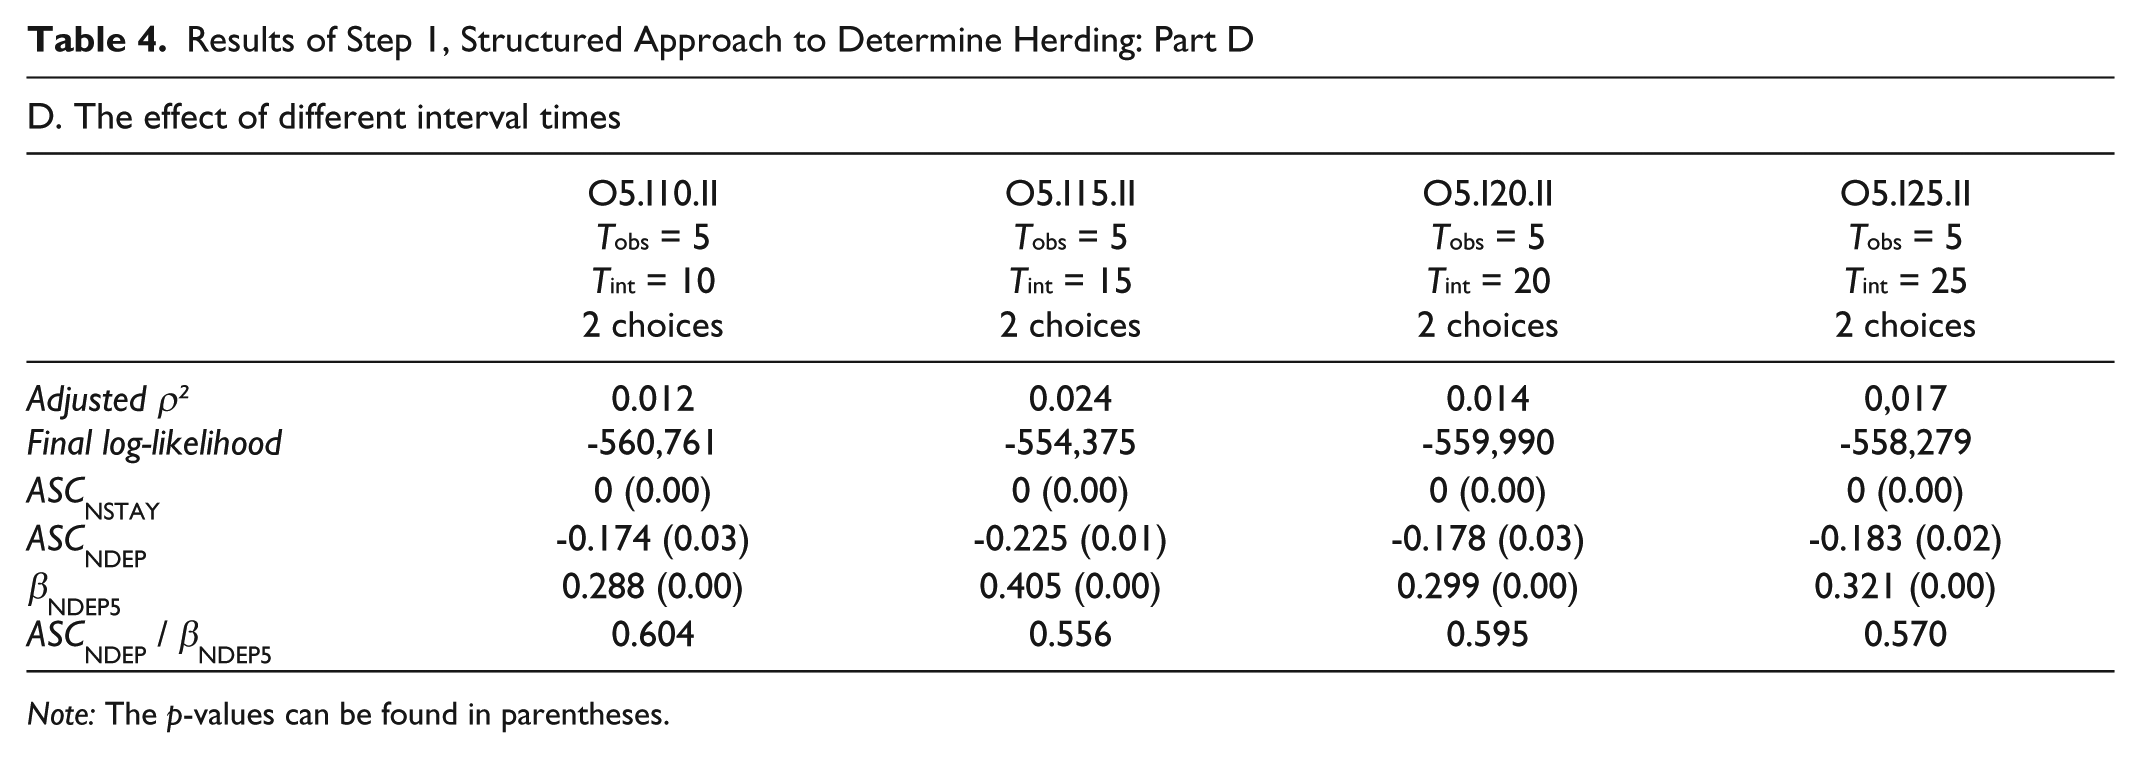
Part D (Table 4) presents the final aspect of Step 1 of the choice modeling process, which is the effect of interval times. When considering different interval times between the choices to stay and leave, the situation that influenced these choices was more likely to be different before these choices. When the choices were closer together, the situation of the Everscape scenario was more similar and it was more likely that only herding was different as an influencing factor. Differences in adjusted ρ², ASCNDEP, and βNDEP5 can be found for the different models. No behavioral conclusions can be drawn from this. It might be a coincidence, but it might also be related to the result that all participants left. To determine if a segmentation can be made based on herding, latent class models were estimated.
Results of Step 1, Structured Approach to Determine Herding: Part D
Note: The p-values can be found in parentheses.
Results of Step 2: Estimated Latent Class Models
To find out if a segmentation could be made based on herding, latent class models were estimated. A selection of the results is presented in Table 5. For more results, see Van den Berg (Chapter 5) ( 19 ). The assumption with latent class models is that different classes exist that each have homogeneous preferences. The classes, with each a separate set of MNL-type parameters, emerge from the estimation process and cannot be observed.
Results of Step 2, Latent Class Results on Herding with Class Membership
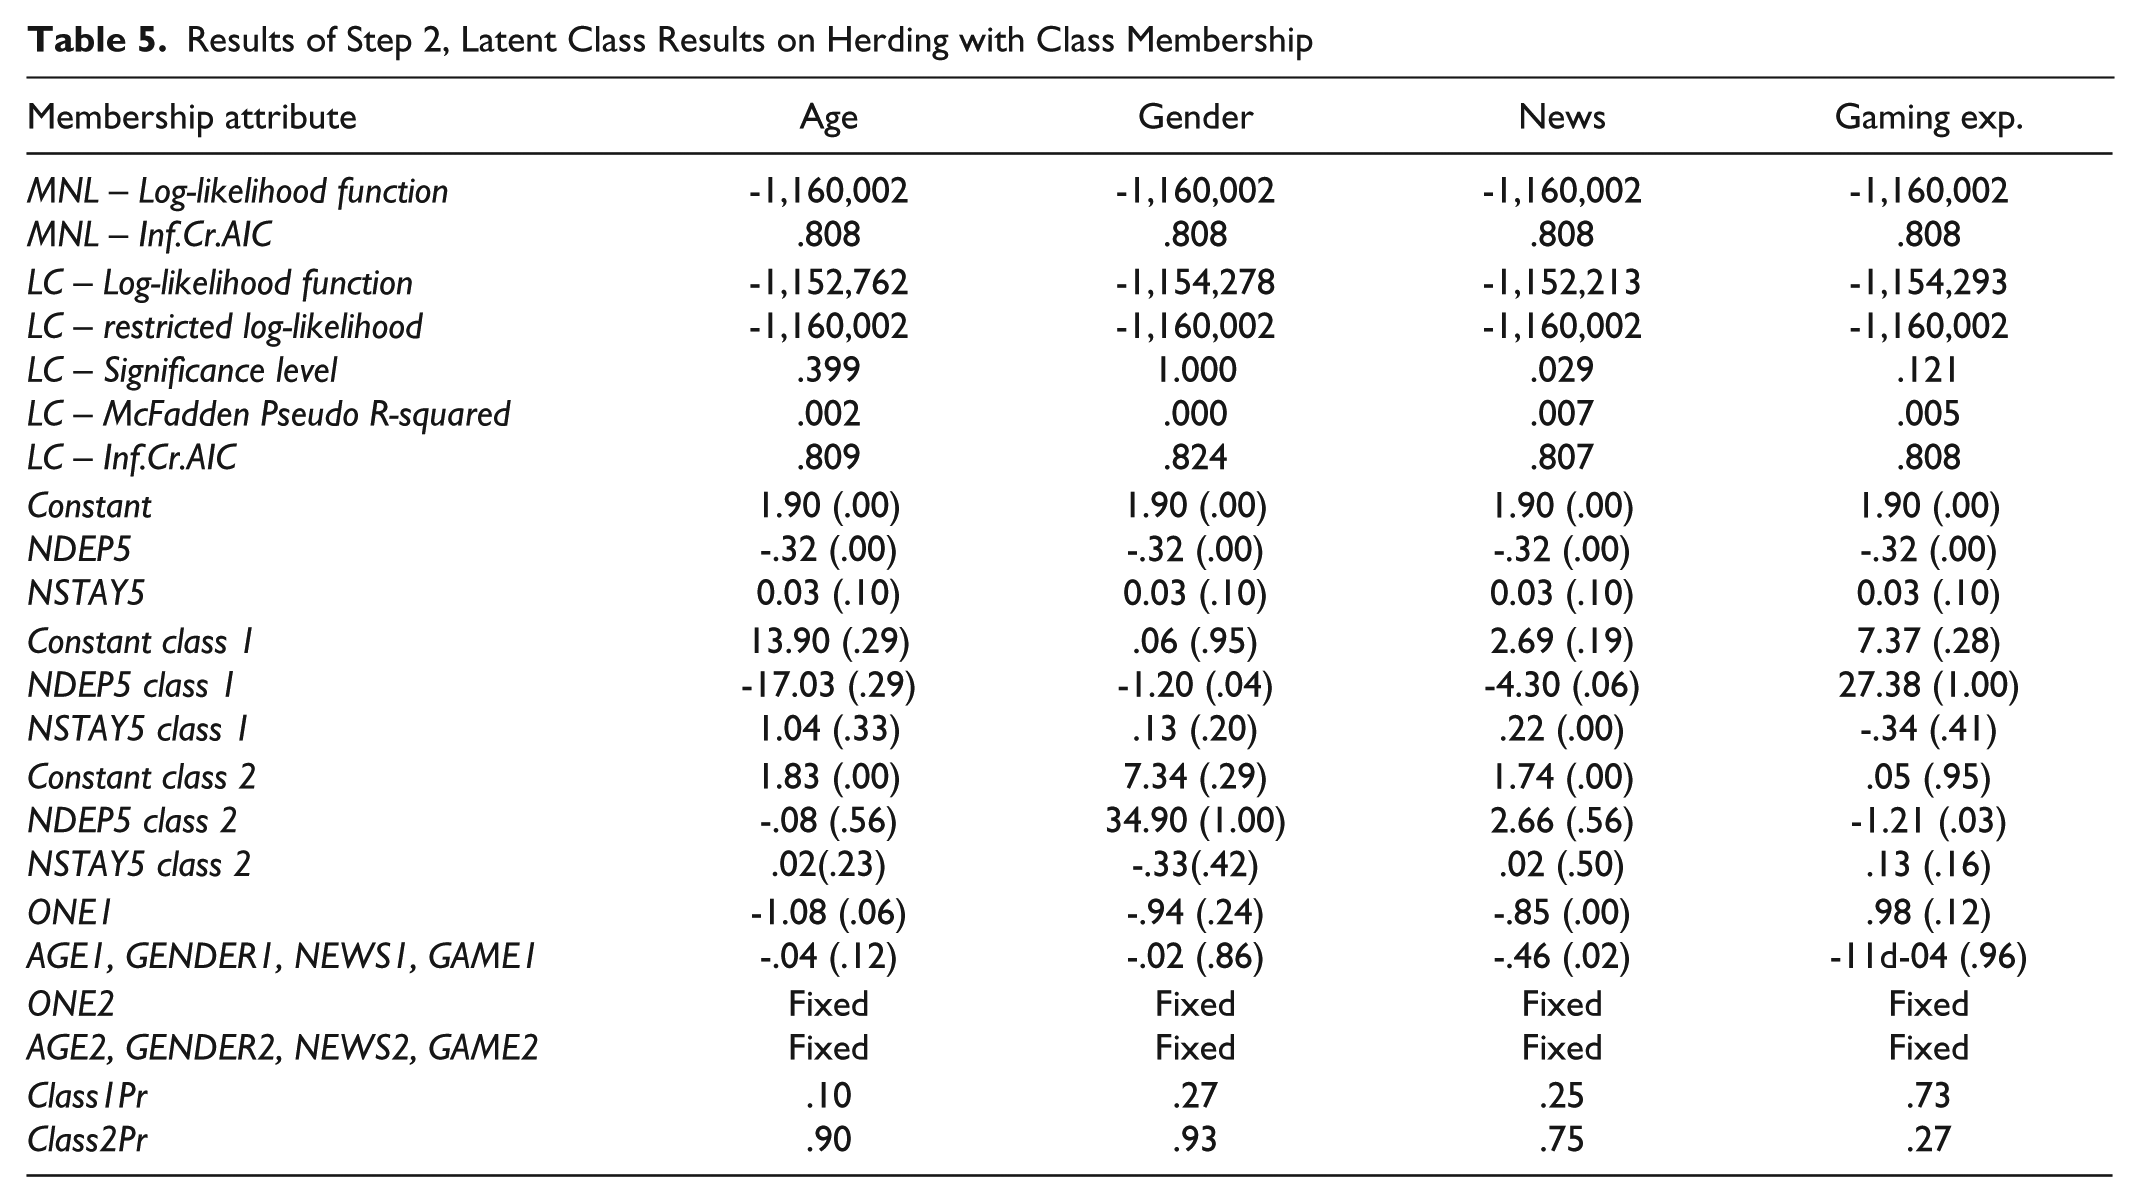
In all cases both NDEP5 and NSTAY5 are included, so the number of people seen while they were leaving and staying within the last 5 seconds before the decision to stay or leave was made. The different columns show the results for estimated latent class models with a segmentation on age, gender, information via the news item, and gaming experience. Age and gender are considered to find out if certain types of people respond differently, and information via the news item is considered to find out what the effect of information is. Gaming experience is considered to find out if it caused a bias in the results, which is undesirable.
According to Akaike’s Information Criterion (AIC), the lowest AIC (0.807) is for the model NEWS. This means that the effect of the news item determines class membership more than age, gender, and gaming experience. There are two classes in the model. The people in class 1 are influenced by the behavior of other people, while people in class 2 are not influenced by this behavior. These results show the effect of the news item. Before the news item, participants were more likely to follow than after the news item. This makes sense, because before the news item, the participants did not have any information and “used” other people as a source of information.
The shares are about 25% and 75%, meaning 25% of the participants are part of class 1 and could be defined as the followers. This model shows (and confirms models in Step 1) that seeing people leave has more impact than seeing people stay.
The results of Step 1 on the effect of interval times, suggested that herding occurred because everyone left. However, the latent class results of Step 2 showed the effect of information on herding. It more specifically showed that herding exists when there is no information. In that case other people are a source of information. The other participants who left did not leave because they were following; they were more likely to leave as a result of the information and instructions from the news item. The modeling results show that a segmentation on age, gender, and gaming experience is not possible (see especially the p-values in parentheses).
Conclusions and Recommendations
The main objective of this paper was to quantify the effect of herding behavior with the use of the experimental setup with Everscape. Based on the results, it is concluded that an important step is made in quantifying herding with empirical research.
The first question was if herding behavior influences the decision to evacuate; and if so, the second question was: how does this herding work? To answer these research questions, several conclusions are drawn in this paper. From the estimated choice models, it can be concluded that herding influenced the decision to leave the concert area and therefore the decision to evacuate. The models showed that people were inclined to stay at the concert area but when they saw others leaving, they were inclined to leave as well. The results seem to imply that herding is impulsive because, especially within the last few seconds before the decision to leave, herding influenced this decision.
Latent class models were estimated to find out if a segmentation on herding could be made. The results showed that the effect of information is especially important. When people have no information, they tend to use other people as a source of information and copy their behavior. This might be positive when “good” behavior is copied. In case of a disaster, it might also happen that people are followed who move toward a disaster instead of away from it. It is important in practice to provide people (if possible) with information and instructions to control or manage a disaster as much as possible.
As an important step is made in quantifying the effect of herding, several recommendations for further research are to be made.
Experiments in Known Environments
In real life, when a natural disaster occurs, people are usually in known environments. With Everscape, everyone had the same prior knowledge, which is useful for excluding the effect of this prior knowledge. The effect of herding behavior might be different when people are in a known environment. When people are in a known environment, they probably have more knowledge on their evacuation options, which might have a different effect on herding. Collecting data in known environments could provide insights on this.
More People Taking Part in the Same Experiment
In the Everscape environment, the maximum number of people participating at the same time was fixed at 38 because of technical limitations. Increasing the number of people could provide extra insights. In real life, especially in large-scale events such as concerts, emergency management personnel need to know how they can influence and manage people in case of a stressful situation. Knowledge on how people influence each other will provide insights on which information to provide to whom, and how.
Measuring Stress Levels
A natural disaster is a stressful situation. The effect of the stress levels that people experience might also influence their behavior. Knowing how much stress people experience, for example by measuring heart rates, could show differences in the effect of herding on evacuation choices.
Measuring Viewing Directions
The number of people that were seen, including if they were staying at or leaving the concert area, was based on the viewing directions. It remains unknown if participants were actually considering this. Adding eye trackers could help in finding out what people were actually looking at and considering for their choices.
Different Setup of the Choices
For the choice modeling process a structured approach was used. It could be useful to find out what the effect would be of a different setup, for example, when including the situation of the Everscape scenario in the choice itself. The choices could then be to leave before the news item or to leave as a result of the news item. This was tested, but the available dataset was too small. It would be recommended to collect more data to use this setup of the choices.
Different Type of Model
The herding phenomenon involves the behavior of other people, and as it is not known how this exactly works, it was decided to start with basic choice models and use a systematic approach to cover a range of possibilities of the herding phenomenon. A useful next step and different type of approach with the data could be to use a continuous duration model in which a hazard function could capture the probability of leaving after a certain time. Characteristics of the participants as well as the situation can then be included.
Footnotes
Acknowledgements
This paper is based on edited parts of the dissertation of Van den Berg ( 19 ). It is part of the research program “Traffic and Travel Behavior in case of Exceptional Events” sponsored by the Dutch Foundation of Scientific Research MaGW-NWO.
Author Contributions
The authors confirm contribution to the paper as follows: study conception and design: Mignon Van den Berg, Rob van Nes, Serge Hoogendoorn; data collection: Mignon Van den Berg; analysis and interpretation of results: Mignon Van den Berg, Rob van Nes, Serge Hoogendoorn; draft manuscript preparation: Mignon Van den Berg. All authors reviewed the results and approved the final version of the manuscript.
The Standing Committee on Emergency Evacuations (ABR30) peer-reviewed this paper (18-01460).