
Abstract
Obtaining load profiles of transit vehicles has remained as a difficult task for transit operators because of technical and financial constraints. Although a significant advance in transit demand and supply data collection has been achieved over the past decade, information related to load profiles at the vehicular level is either impossible or very difficult to retrieve from them. It is not even uncommon to see that these data are underutilized by transit operators owing to considerable deficiencies and shortcomings in the data themselves, and/or the processing algorithms needed to process them. This study is therefore dedicated to addressing this challenge that has largely been overlooked by both researchers and practitioners. First, the issues which hinder the construction of load profiles based on three prevailing transit data sources are identified, including automatic fare collection (AFC), automatic vehicle location (AVL), and general transit feed specification (GTFS) data. Second, a methodology is developed for sequentially addressing all the issues and generating desirable vehicle load profiles. The methodology consists of four steps, including (1) data pre-processing, (2) matching trips in GTFS and AVL, (3) matching passenger rides to vehicle trajectories, and (4) improving vehicle trajectories. The resulting spatiotemporal load profiles of transit vehicles enable detailed investigation into vehicle movements and demand patterns over time and space, including service utilization and the propagation of delays and crowding. Data collected from the urban transit network in The Hague, The Netherlands are used to demonstrate the proposed methodology. The visualization of spatiotemporal load profiles through space-time seat occupancy graphs provides operators with a compact and powerful reference for the improvement of their services.
Knowing the on-board load of transit vehicles is key to improving transit services from both planning and operational perspectives. However, obtaining such information for transit operators has remained as a difficult task for a long time because of technical and financial constraints. Although manual surveys have often been used to estimate on-board passenger loads, such surveys are too costly to be conducted daily over all offered services, and are also subject to error and bias. Opportunities to change this situation, however, have emerged in recent years with the fast-growing data richness in transit research and practice, including automatic vehicle location (AVL) ( 1 ); automatic fare collection (AFC) ( 2 , 3 ); and general transit feed specification (GTFS) data ( 4 , 5 ). In many cities and regions around the world, transit demand and supply data have been continuously collected and managed with fine granularity, accuracy, and spatiotemporal scale. Notwithstanding, it is not uncommon to see transit operators still struggle to obtain some fundamentally important information, such as service utilization (i.e., passenger load). Data are often underutilized as a result of considerable deficiencies and shortcomings that can be frequently overlooked. To unlock their potential, it becomes necessary to develop sound techniques to overcome these issues and achieve valuable information, such as the transit vehicle load, by processing and integrating different data sources, including AFC, AVL, and GTFS. The current study is therefore dedicated to this specific challenge.
To the best of the authors’ knowledge, few scientific studies and practical reports have attempted to address a similar problem. One of the main causes for this scarcity could be the rather limited access to multiple transit data sets from the same period by researchers. In many cases, only a single data source is available and the studies primarily developed methods to infer missing information. For example, Chu and Chapleau early on presented how spatiotemporal bus load profiles could be estimated based on AFC data only ( 6 ). In the absence of real bus trajectory information, they managed to estimate the spatiotemporal paths of vehicles by combining the first and last transaction times at each stop and corresponding timetable. Their work is one of the pioneering studies that revealed the power of AFC data on load profile construction. Sun et al. subsequently investigated a similar problem, however, in the context of a metro system ( 7 ). With only AFC data available (both tap-in and tap-off information recorded), they developed a methodology for estimating trains’ trajectories and linked individual passenger rides to these trajectories, which results in a spatiotemporal density of metro vehicles. More recently, Moreira-Matias and Cats proposed a novel method for estimating on-board loads of buses using AVL data only ( 8 ). Passenger loads are built by applying machine learning algorithms to smoothen the load profile based on actual dwell time records. In addition, a web-based application to visualize bus load profiles, called BusViz, has also been developed based on the AFC data in Singapore ( 9 ). Despite the progress on the visualization work, their approach to derive bus trajectories has several constrained assumptions. For instance, the arrival time of a bus at a stop is equated to the earliest entry time of the first passenger who boards or alights at that stop, while the departure time is set equal to the greatest of the card entry times of passengers who board or alight at the stop. More advanced vehicle trajectory inference techniques based on AFC data only, (see for example Min et al. and Zhou et al. [ 10 , 11 ]), can be adopted and extended to address these limitations.
Although multiple transit data sets that are comparable among each other have become increasingly available to researchers, most research effort has focused on a selected number of fields, such as transit origin–destination (OD) estimation ( 12 , 13 ), travel time reliability analysis ( 14 , 15 ), and passenger assignment modeling in urban rail systems ( 16 – 19 ). Few existing studies have comprehensively examined how spatiotemporal load profiles of transit vehicles can be constructed using multiple data sources. This study is therefore devoted to bridging this gap, which can benefit both researchers and practitioners. The study’s contribution is twofold, including specific identification of the issues pertaining to a single or a combination of data sets (AFC, AVL, and GTFS), and the development of a methodology for addressing these issues and generating spatiotemporal load profiles of transit vehicles. The methodology consists of four steps through which raw data are processed and integrated to generate the passenger load profiles over space and time. These profiles allow service providers to analyze vehicle trajectories and demand patterns, and further investigate service utilization and the propagation of delays and crowding. The data collected from the urban transit network in The Hague, The Netherlands are utilized for demonstrating the methodology. A series of inference and matching steps are employed. This analysis results in profiles of vehicle trajectories and passenger loads which are further visualized through space-time occupancy graphs. Analogously to how space-time graphs of speed and flow enable traffic engineers to study spatiotemporal congestion patterns along routes in car traffic, these space-time occupancy graphs enable transit operators to study and inspect spatiotemporal on-board crowding patterns along transit service lines.
The remainder of this study is organized as follows. The next section describes the transit data sets available in the Dutch context, including AFC, AVL, and GTFS data, along with the related issues. Following this the methodology is described, with an overview and descriptions of all the steps as well as implementation. The results are then presented, followed by the conclusions and discussion of future research directions.
Data Description and Issue Identification
In this study three different transit data sets are used, all of which were collected from the urban transit system in The Hague, The Netherlands. These comprise AFC, AVL, and GTFS data. All three data sets cover the period of March 2015, which includes 22 normal working days and 9 weekend days. In this period, the system consisted of 12 tram lines and 8 bus lines, and the incumbent transit operator was HTM.
Clarification of Terminology
In order to avoid ambiguity, all terms used in this study are specified as follows based on what Robinson et al. proposed ( 20 ).
(Passenger) Ride: This describes the movement of a passenger on a single vehicle, that is, a bus or tram. The ride begins at the stop where the passenger boarded the vehicle and ends at the stop where the passenger alighted the vehicle.
(Vehicle) Trip: This describes the movement of a transit vehicle through a pre-defined sequence of stopping points. It is sometimes called “run” in the literature.
AFC Data
The Dutch smart card system (OV-chipkaart in Dutch) is a nationwide fare-collection system ( 21 , 22 ). An important feature of the Dutch smart card system is that passengers are required to check in and check out for every single ride of a journey for fare calculation, except when transferring within the national railway system and metro systems. Missing the check-out will result in a much higher fare, therefore making passengers have a strong incentive to finish a ride by correctly checking out. Consequently, information of travelers’ origin and destination is fairly complete and accurate without the need to infer passenger alighting stops. However, individual rides still need to be combined to obtain an OD matrix, which is an important input for a variety of offline applications.
The smart card data set from The Hague for the whole month of March 2015 contains close to 8 million validated records. Each record characterizes a single transit passenger ride with anonymous card ID, line/route ID, date, stop ID, and time of check-in and check-out. The information of trip ID and vehicle ID, which would allow for the connection to the AVL data, is not available in this data set.
AVL Data
The AVL data of transit vehicles in The Netherlands are well stored and managed at a national level ( 23 ). The one-month data set used in this study contains over 22 million records in an event-based format. Individual trips are distinguished by a unique trip ID within an operating day. Besides information of line ID, stop ID, and vehicle ID, each row of data is specified as an event and its corresponding timestamp(s), such as the start of a trip, on-route, arrival, dwell, departure, and end of a trip. In addition, deviation from the scheduled time is indicated in the data under “punctuality.” The entire fleet of HTM is equipped with the AVL system.
GTFS Data
GTFS, as one of the most prevailing formats for transit schedules and associated geographic information, has been widely adopted in the past decade by transit agencies and operators to share information with the public ( 4 ). In The Netherlands, GTFS data that cover most transit services nationwide can be accessed via a website called OVapi ( 24 ). These feeds are created from the open data files published by local transit operators under an open license. The website is well maintained with frequent updates of GTFS and GTFS-Realtime data.
The GTFS data used in this study contain all trips scheduled by HTM for March 2015 in The Hague. The GTFS data can be matched with the AVL data set using the trip ID.
Data Issues
Several issues pertaining to a single or a combination of data sets can be identified and need to be resolved for the current application, that is, constructing the spatiotemporal load profiles of transit vehicles. These issues are summarized and presented in Figure 1 in relation to their sources. Basically, issues specific to each individual data set are illustrated in the respective oval, whereas issues that arise when two or more data sources are combined are positioned at their intersections. The following issues have been identified:
Information in GTFS data is stored in a trip-based manner, meaning that what can be directly obtained from it are only individual vehicle trips that consist of all the stops per trip. Complete stop sets of service lines, which are crucial for subsequent analytics, are not directly available from the GTFS data.
AFC data contain different types of errors, including unrealistic alighting times or alighting locations, as well as missing and unrealistic trip numbers. The issues are the result of improper passenger behaviors and system malfunctions.
Multiple timestamps can be occasionally found for one arrival or departure event in the raw AVL data set. It is unclear why this happens, but it jeopardizes the global consistency of vehicle trajectories.
Arrival and/or departure timestamps at a stop can be missing. The size of missing timestamps ranges from one event (arrival/departure) at a stop to an entire trip. Note that issue #3 and this one can happen to the same stop (e.g., two arrival events, missing departure event), which makes the issue even worse.
The vehicle trip ID indices in AVL and GTFS data do not always match. This inconsistency causes problems in matching trip and trajectory when combining GTFS (scheduled trajectories) and AVL (recorded trajectories).
Since the AFC data set used in this study does not contain vehicle trip ID, it is impossible to directly match individual rides to scheduled vehicle trips that are extracted from the GTFS data.
The same issue as #6 holds for this situation too. There is no direct way to match rides to the recorded vehicle trips from AVL data.
The GTFS data contain all scheduled trips of a day. However, this does not provide conclusive evidence that all these trips are indeed executed. In many cases, the number of trips found in the AVL data set is smaller than the scheduled number of trips. It is uncertain whether this is a result of trip cancelation or AVL system malfunction without any additional information. AFC data may be used here to settle the discrepancy.
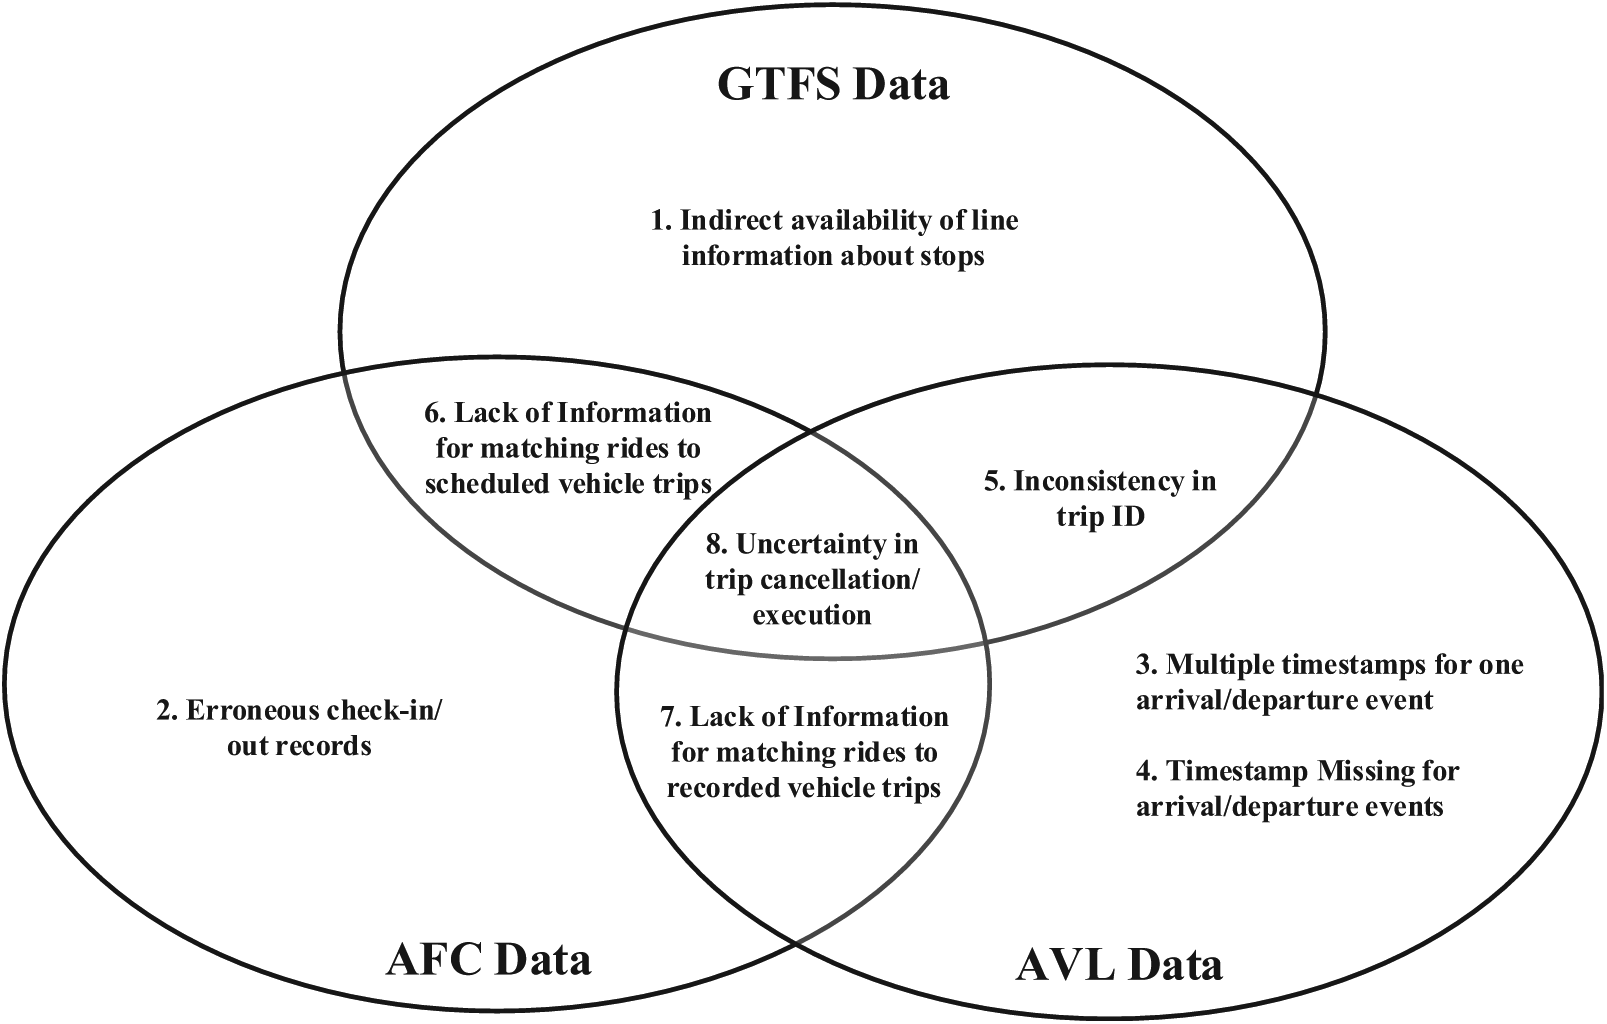
Identification of the issues pertaining to a single or a combination of data sets for constructing the spatiotemporal load profiles of transit vehicles. Issues specific to each individual data set are illustrated in the respective oval, whereas issues that arise when two or more data sources are combined are positioned at their intersections.
These issues are illustrated for a given day and line in Figure 2, which visualizes the recorded trajectories from AVL data; scheduled trajectories from GTFS data; and check-in/out records. Figure 2a first displays all the recorded trajectories from the AVL data. There are many gaps in this plot, which indicates that there is either a missing timestamp or multiple timestamps for the arrival or departure event at that stop. Figure 2b adds the layer of all scheduled trajectories (blue lines) underneath the recorded ones (red lines). It can be observed that overall vehicle trips adhere to the timetable very well. Next, check-out (blue circle points) activities are added in Figure 2c. An important finding from this plot is that when there is a trajectory gap, check-in/out activities also do not exist, or are very sparse, which implies that in the case where the arrival timestamp is missing but departure has at least one timestamp, the vehicle probably drives through the stop without serving passengers. Figure 2d displays a zoom-in plot to allow for a more detailed inspection. Check-in activities are clustered close to the vehicle arrival time, unlike check-out activities, because it is customary for passengers to check out in the segment directly upstream of the alighting stop.
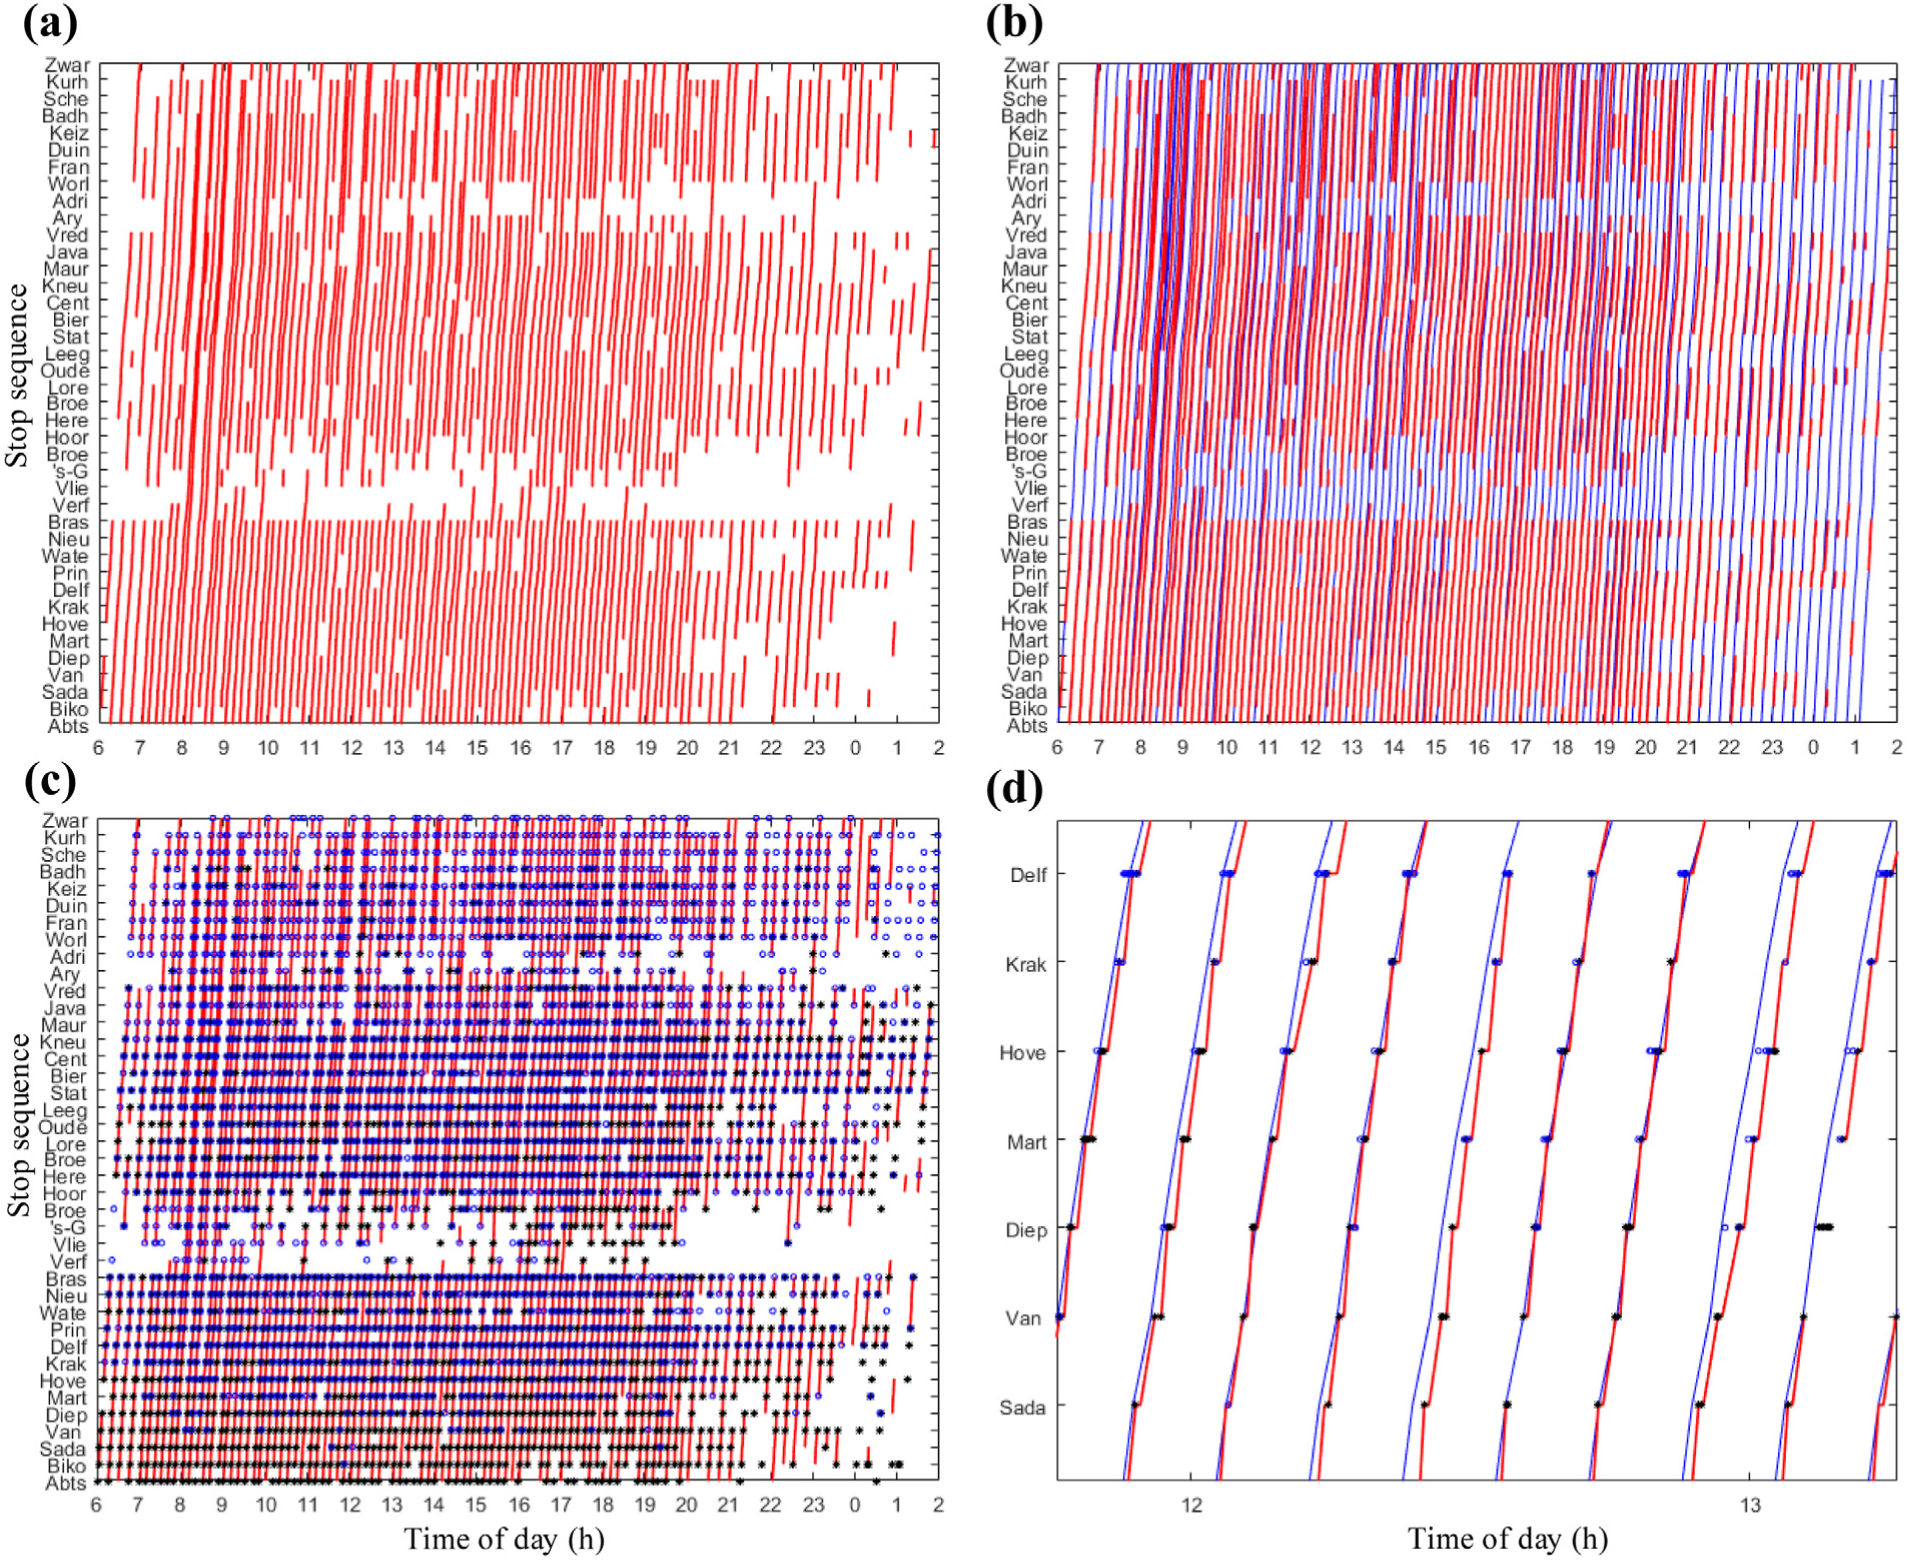
Visualization on how different data sources characterize 1-day services. The example is from line 1 from Delft Tanthof to Scheveningen Noorderstrand on March 5, 2015. (a) Recorded trajectories (red lines) obtained from the AVL data set; (b) Recorded trajectories (red lines) on top of all the scheduled trajectories obtained from the GTFS data set; (c) Recorded trajectories (red lines) on top of all the check-in (black star points) and check-out (blue circle points) activities; (d) Zooming-in for a selected hour (12–13) of the data presented in (c).
Methodology
In this section, a methodology for constructing the spatiotemporal loads of transit vehicles based on aforementioned data sources is described. An overview is first provided, followed by subsections dedicated to each step. The final subsection describes how this was implemented.
Overview
The methodology consists of four steps as shown in Figure 3. Raw data from three independent sources are used throughout the four steps. All three individual data sets are initially stored in separate databases. In step 1, the raw data are first obtained from the databases with all the information restructured at a daily level. By doing so, the subsequent workflow is made more computationally efficient. Issues #1 and #2 (described earlier) are addressed at the first step, resulting in data files respectively containing passenger rides; recorded vehicle trajectories, and scheduled vehicle trajectories. The integration of recorded and scheduled vehicle trajectories is then performed at the second step. Issue #5 is solved, resulting in data files that contain both scheduled and recorded vehicle trajectories. In step 3, passenger rides are matched with vehicle trips and trajectories (solving issues #6 and #7). In the last step, all scheduled trips are first labeled either “canceled” or “executed” based on the validation results. The data files from step 3 are used to perform this validation task, addressing issue #8. Finally, vehicle trajectories of validated trips are corrected by fusing multiple types of information. Consequently, all trajectories have complete trajectory and load information and are globally consistent. Issues #3 and #4 are thus solved in this final step. This sequential method decomposes the process into small sub-tasks with each step solving one or several of the identified issues.
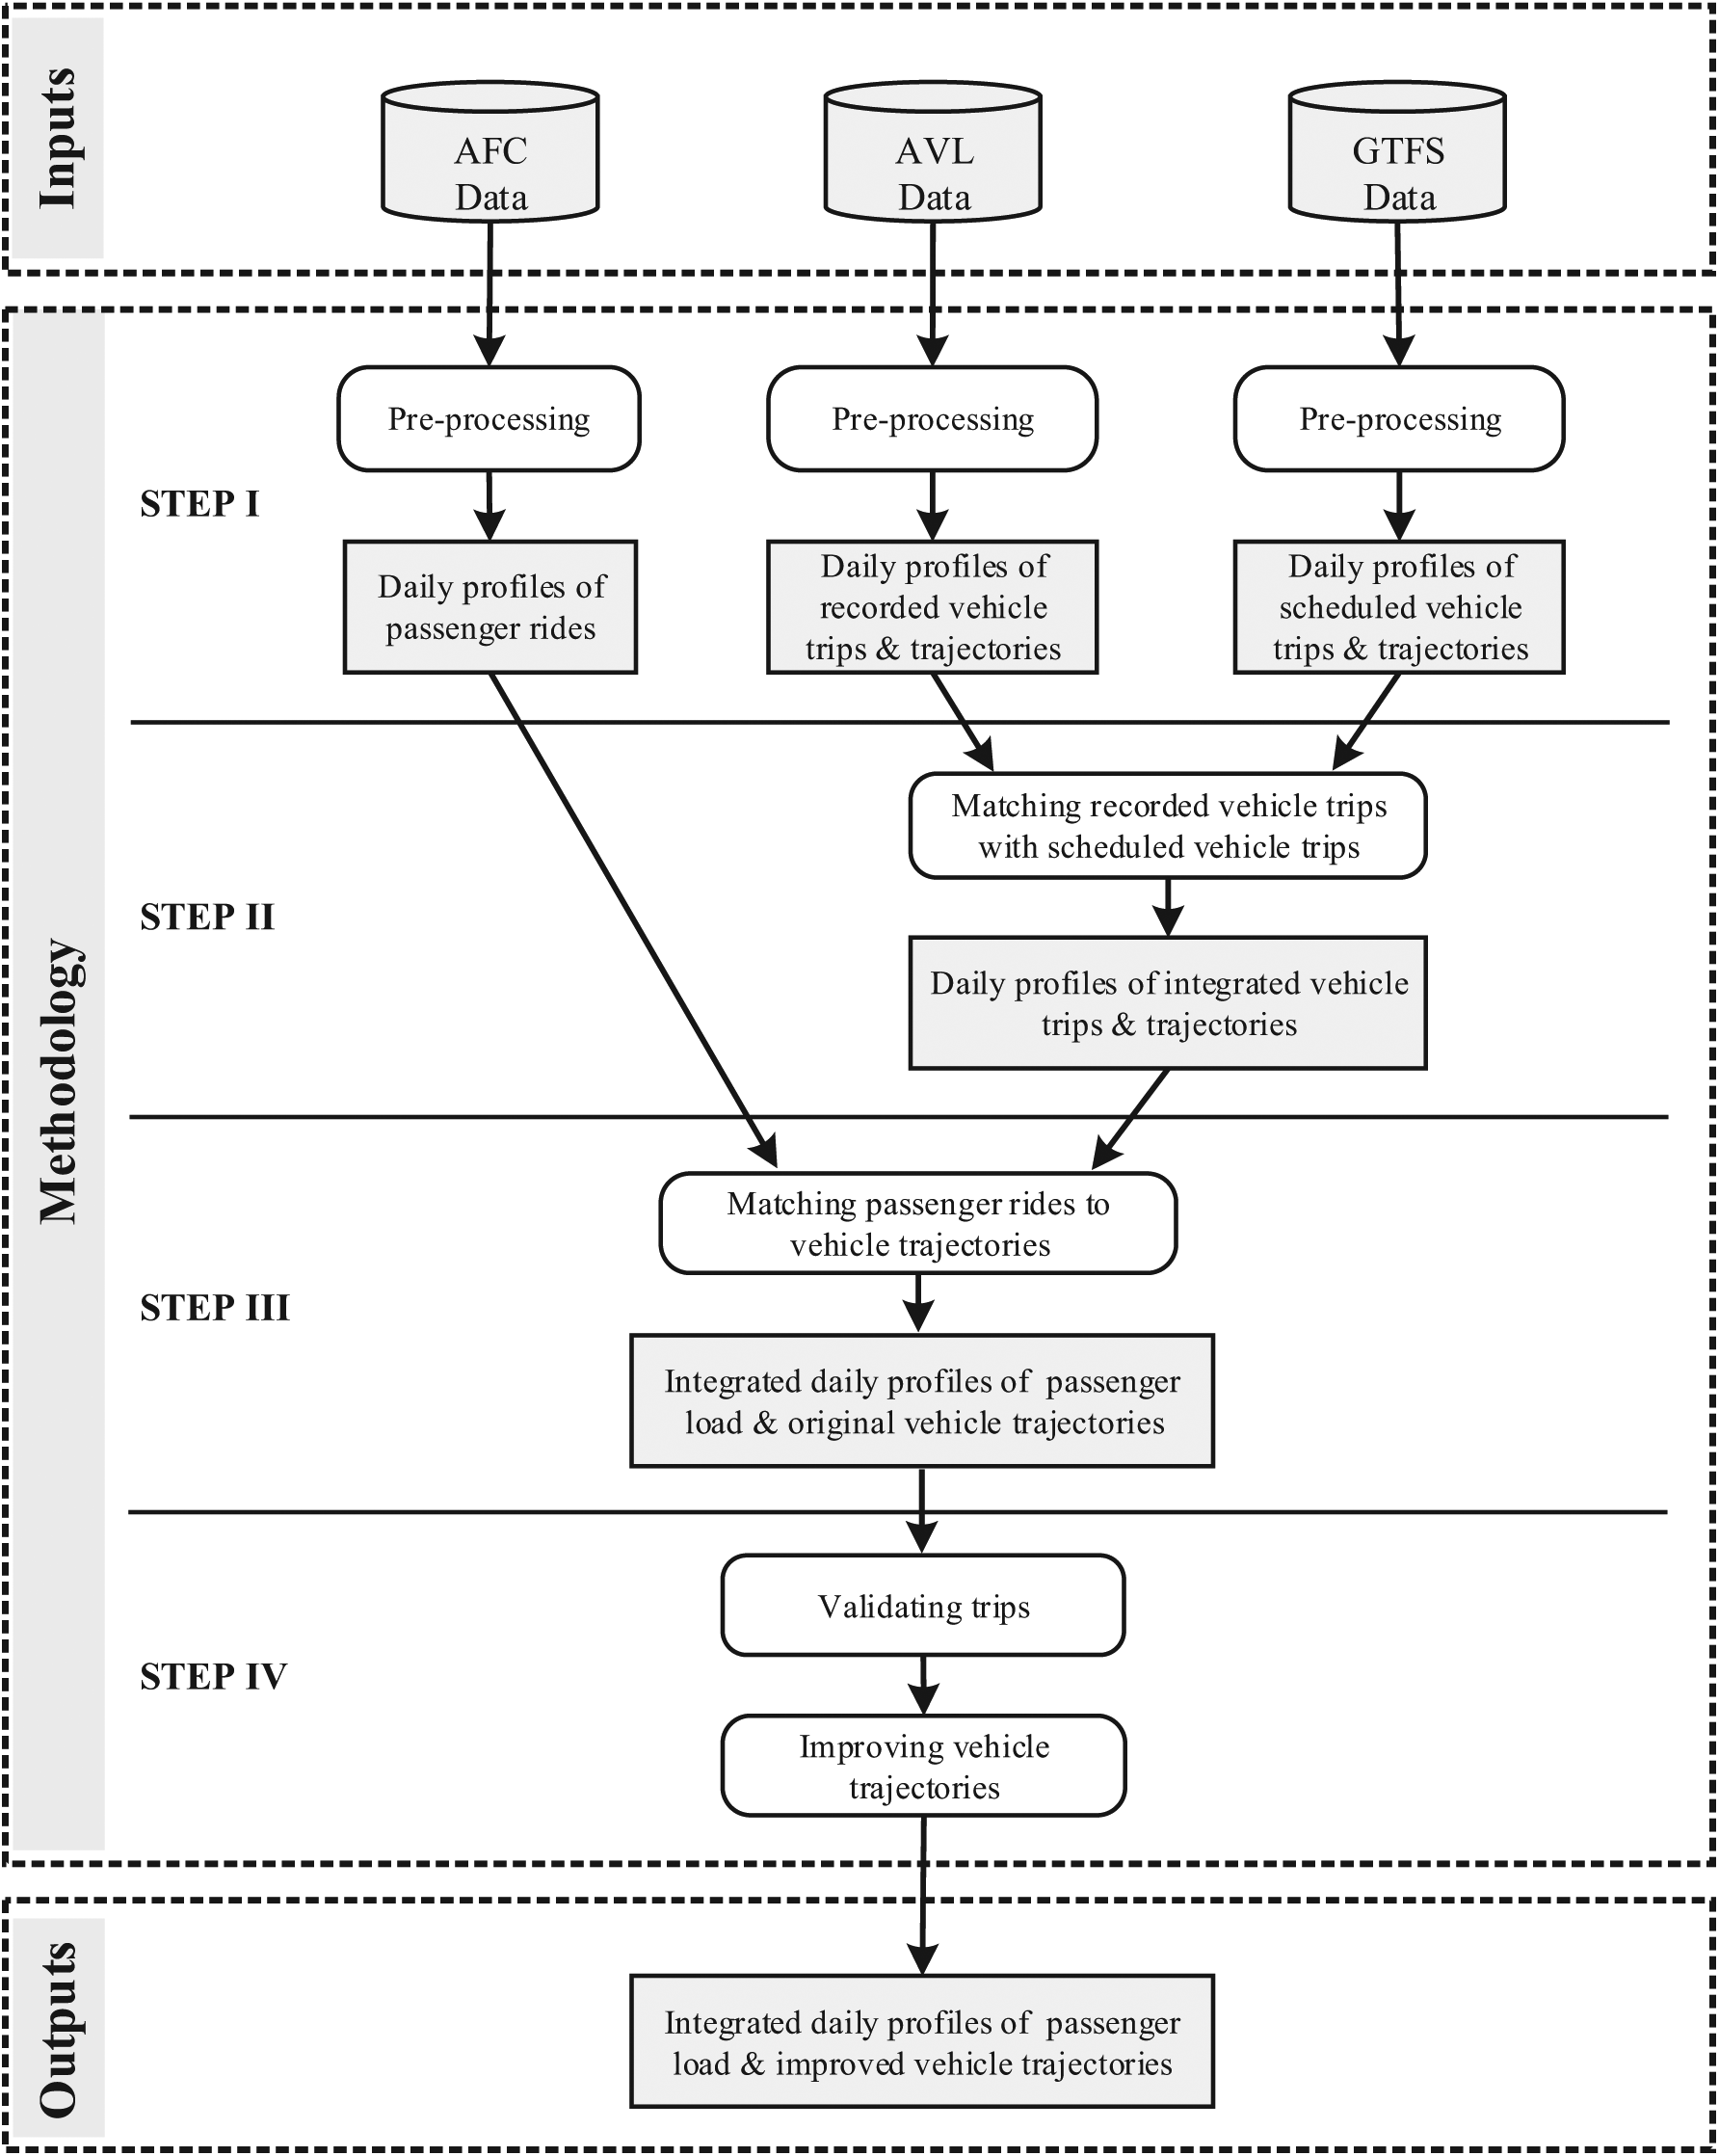
Overview of the four-step methodology. Inputs are raw information from individual data sets, and the final outputs are integrated profiles containing vehicle trajectories and passenger loads.
Step 1: Data Pre-Processing
All three types of data are preprocessed in the first step at a daily level. For AFC data, single transaction records are first linked to generate individual passenger rides with both check-in and check-out information (stops and times). Erroneous rides with unrealistic travel time and origin or alighting stops are identified and removed in this process. In this case, the travel time threshold was set to 90 min, which exceeds the maximal travel time between any pair of stops in the case study network. In addition, the indices of stops were also transformed to be consistent with those of the AVL and GTFS data.
Every single scheduled trajectory—characterized by the arrival and departure time at every stop along a line—is extracted from the GTFS data. This process is not straightforward because the GTFS standard does not contain direct information about regular stop sequences of individual transit routes. Designed originally for the purpose of route planning, the GTFS data make it quite handy to obtain arrival and departure times at each stop of individual trips by storing information based on trips. A trip is recorded in the trip.txt file and further detailed in the stop_times.txt file with its sequence of stops. All trips, including sub-lines and partial trips with some stops skipped, are thus easily stored in the data. However, this becomes an obstacle when information about the most regular and fullest stop sequence of transit lines is required. To overcome this problem, a brute-force approach is adopted. All trips of a transit route from a normal working day are scanned in order to acquire the complete set and right sequence of stops on this line and this direction. This is a straightforward yet effective solution to this problem. AVL data, however, do not need to be much processed since the information is already organized based on stop sequences of trips. If there is a missing record, a “Not A Number” label is added.
Step 2: Matching Trips in GTFS and AVL
This step is dedicated to matching all the trips recorded in the AVL data set to all the scheduled trips contained in the GTFS data. Ideally, the two data sources should share the same trip ID indexing scheme so that the matching is very straightforward. However, inconsistencies do exist, as illustrated in the previous section. To address this issue, the recorded arrival time as well as the delay at stops from the AVL data are used to compute the probable scheduled arrival times as follows:

where
Step 3: Matching Passenger Rides to Vehicle Trajectories
The objective of this step is to match all individual passenger rides to the vehicle trips that these passengers traveled with. However, since the trip ID information is missing in the current AFC data set, a trip ID inference algorithm for all the rides is first developed, as shown in Figure 4.
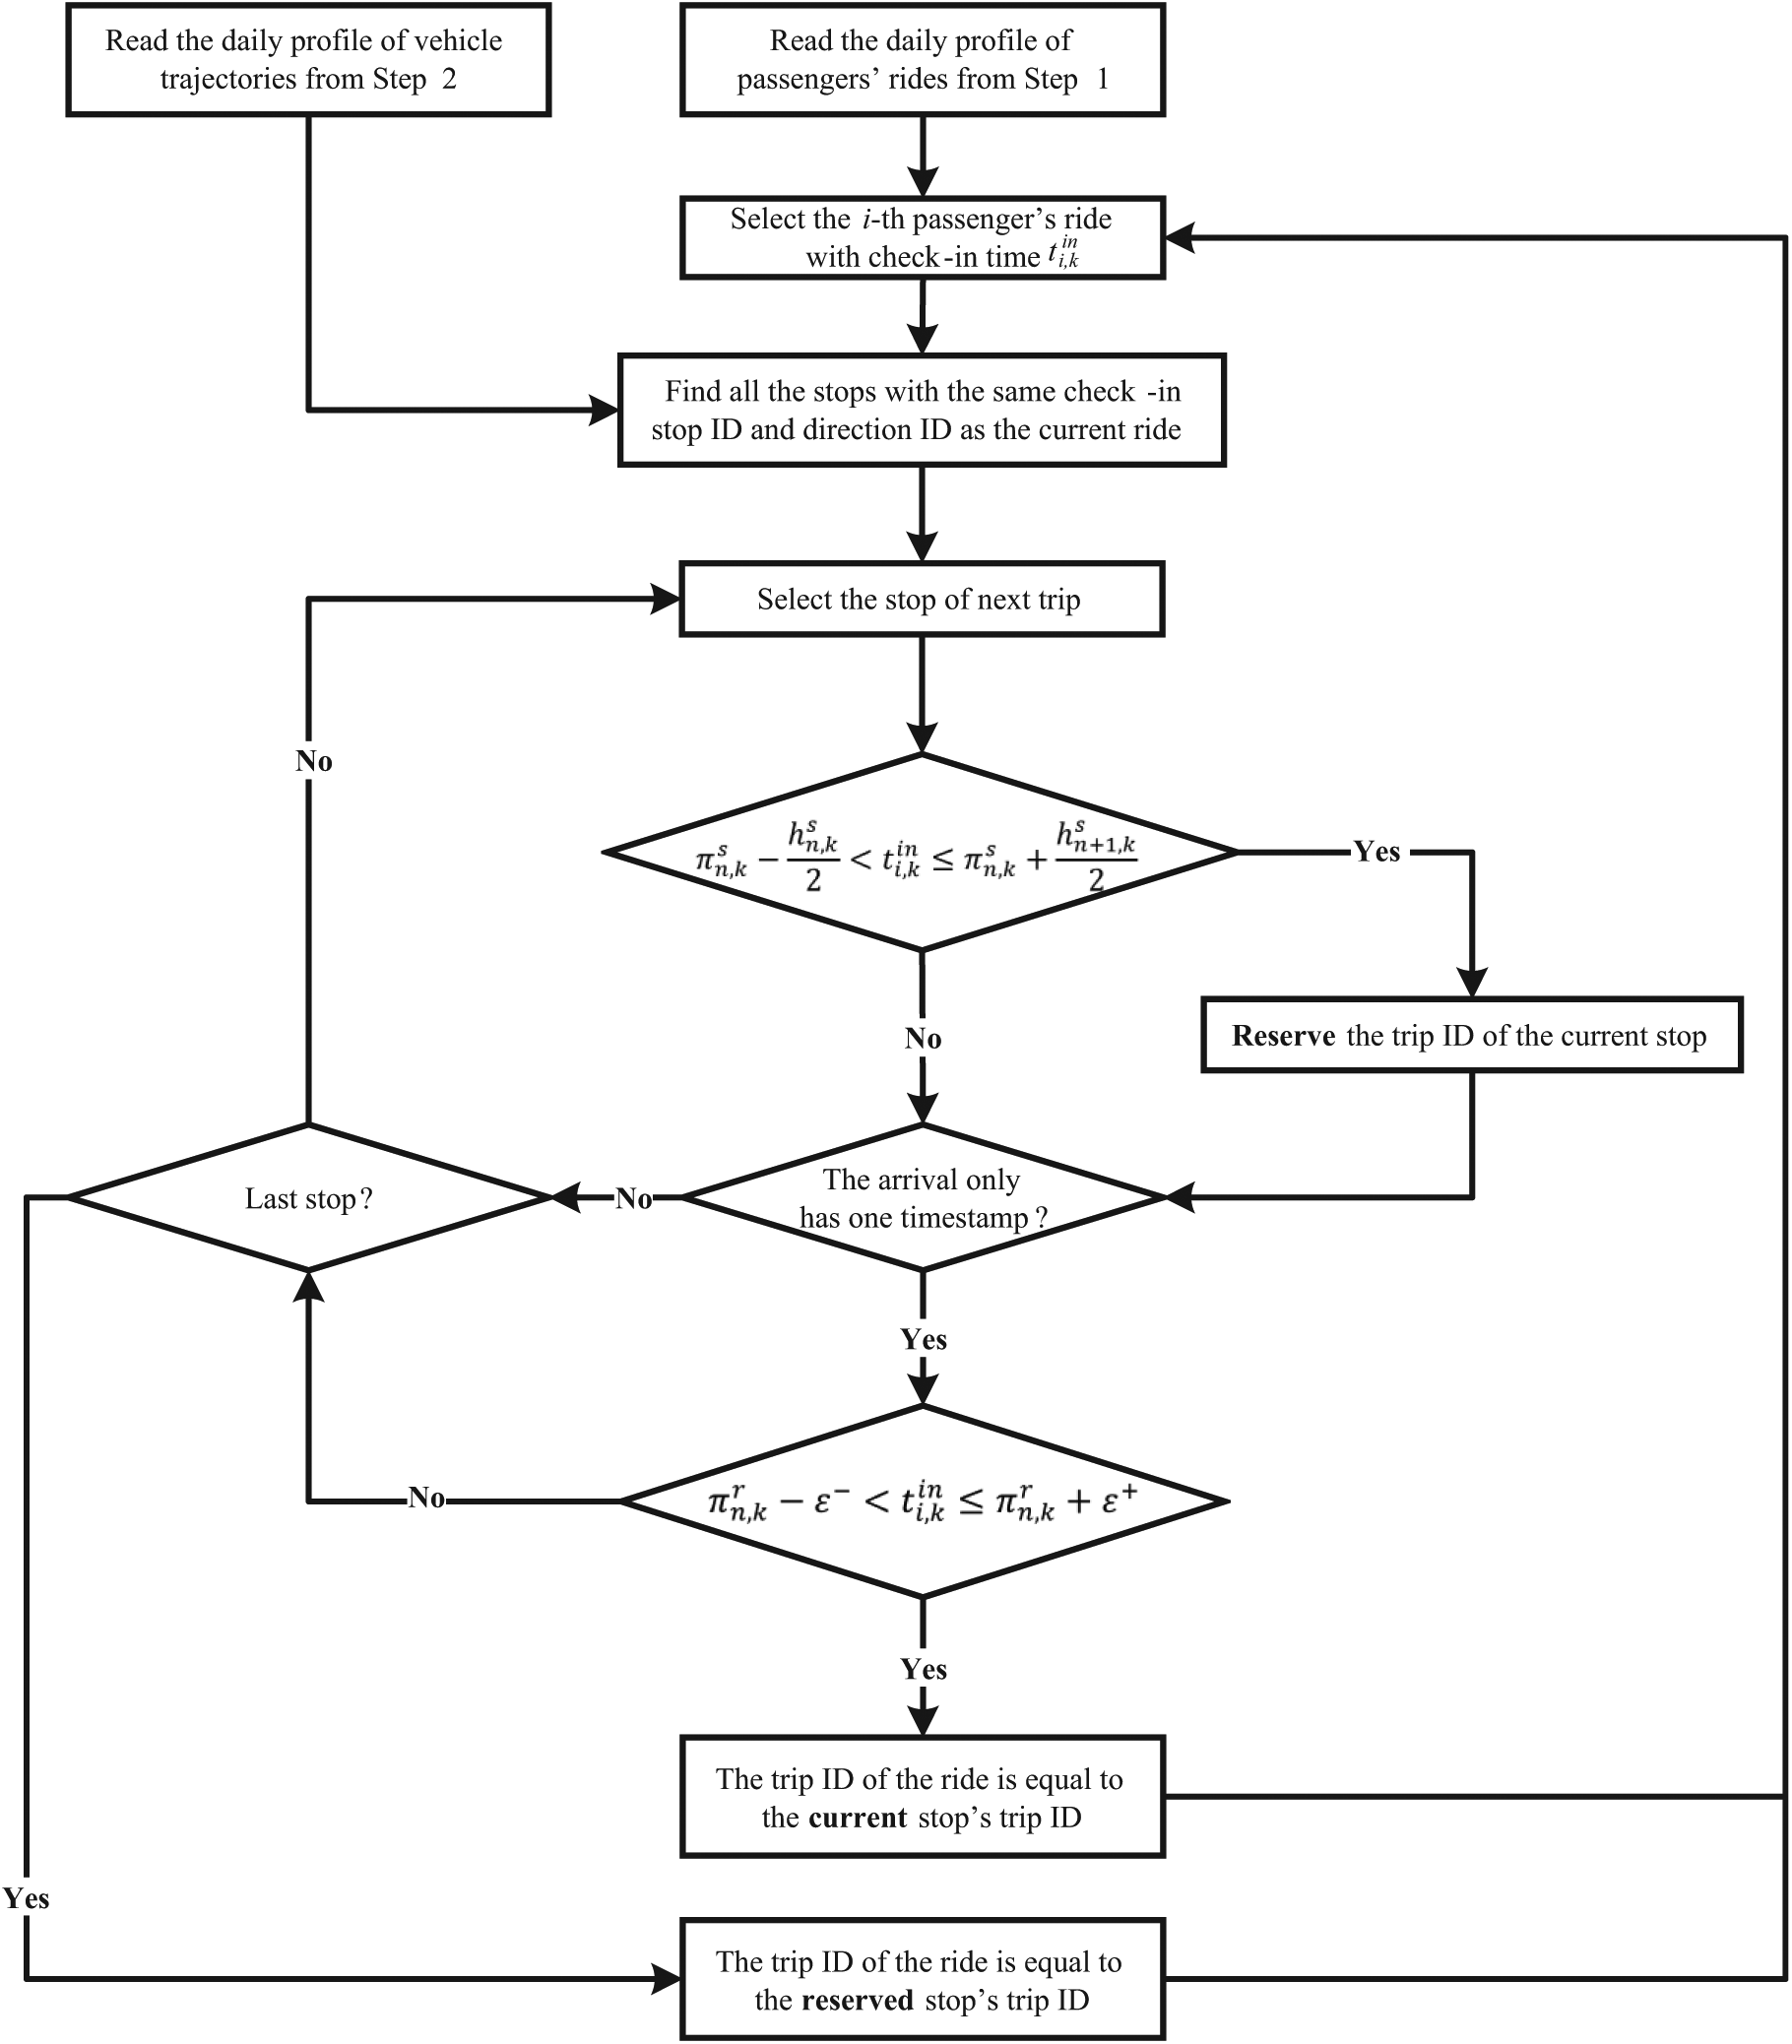
Algorithm for infering the trip ID of individual passenger rides.
Let

where

where
Step 4: Improving Vehicle Trajectories
The last step is dedicated to the correction of vehicle trajectory profiles based on the results from step 3. It attempts to resolve the issues identified in the AVL data (#3, #4, and #8). The central idea is that the integrated information from three different data sources at the same detail level, including the recorded (AVL) and scheduled (GTFS) arrival/departure times, as well as check-in/out times at stops (AFC), will allow (1) whether a vehicle trip was indeed executed to be inferred, and (2) actual vehicle trajectories to be restored to the maximal extent. In the current study, practical solutions consisting of several rules were developed and applied.
To infer whether a trip is executed or canceled in reality, a series of rules are proposed based on the practical investigation. The inference takes into account (1) whether there is sufficient information about recorded timestamps for a trip; and (2) whether there are enough check-in activities that can be reasonably associated with this trip. Eventually, all scheduled trips are labeled as either “executed” or “canceled.”
The restoration of vehicle trajectories is performed using a practical approach which attempts to fill in all the gaps in the recorded trajectories (exemplified in Figure 2a). Two rules and one assumption are made in this process:
By applying these rules and this assumption, it is ensured that the vehicle trajectory of a trip is globally consistent in a sense that vehicles can never move backward. The assumption is made based on the practical investigation into the data. As Figure 2c illustrates, when there is a gap in the recorded trajectory, very few check-in/out activities can be spotted. Therefore, it can be safely assumed that vehicles skipped the stops when only departure times are logged in the database.
Implementation
All three raw data sets are stored in a PostgreSQL 9.3 database. A series of indices on date, line ID, stop ID, and so forth, were created to improve the SQL query performance. All of the abovementioned steps were coded in MATLAB.
Results
For simplicity and tractability, only the results of tram line 1 for the entire month of March 2015 are described in this section. Line 1 connects Delft, a mid-size old university city, to The Hague, the main city in its urban agglomeration, serving 41 stops per direction, including three major train stations. The service is frequent, with 208 trips on a normal weekday and up to 8 trams per hour in the peak on each direction. More than 670,000 passenger rides are recorded for line 1 in the AFC database over the case study period. After applying the pre-processing to these rides, around 0.03% (around 200) rides were discarded because of the issues described earlier.
Figure 5a shows the result of vehicle trip ID inference for passenger rides. For most of the days, over 90% of the rides’ trip ID can be successfully inferred based on the recorded trajectories owning to the relatively high quality of AVL data on these days. Two particular days, that is, the 6th and 18th of March, are noticeable because of their low AVL-based inference percentage. This is arguably caused as a result of the significant loss of AVL data on those two days, which implies that many inferences rely instead on just the scheduled trajectories.
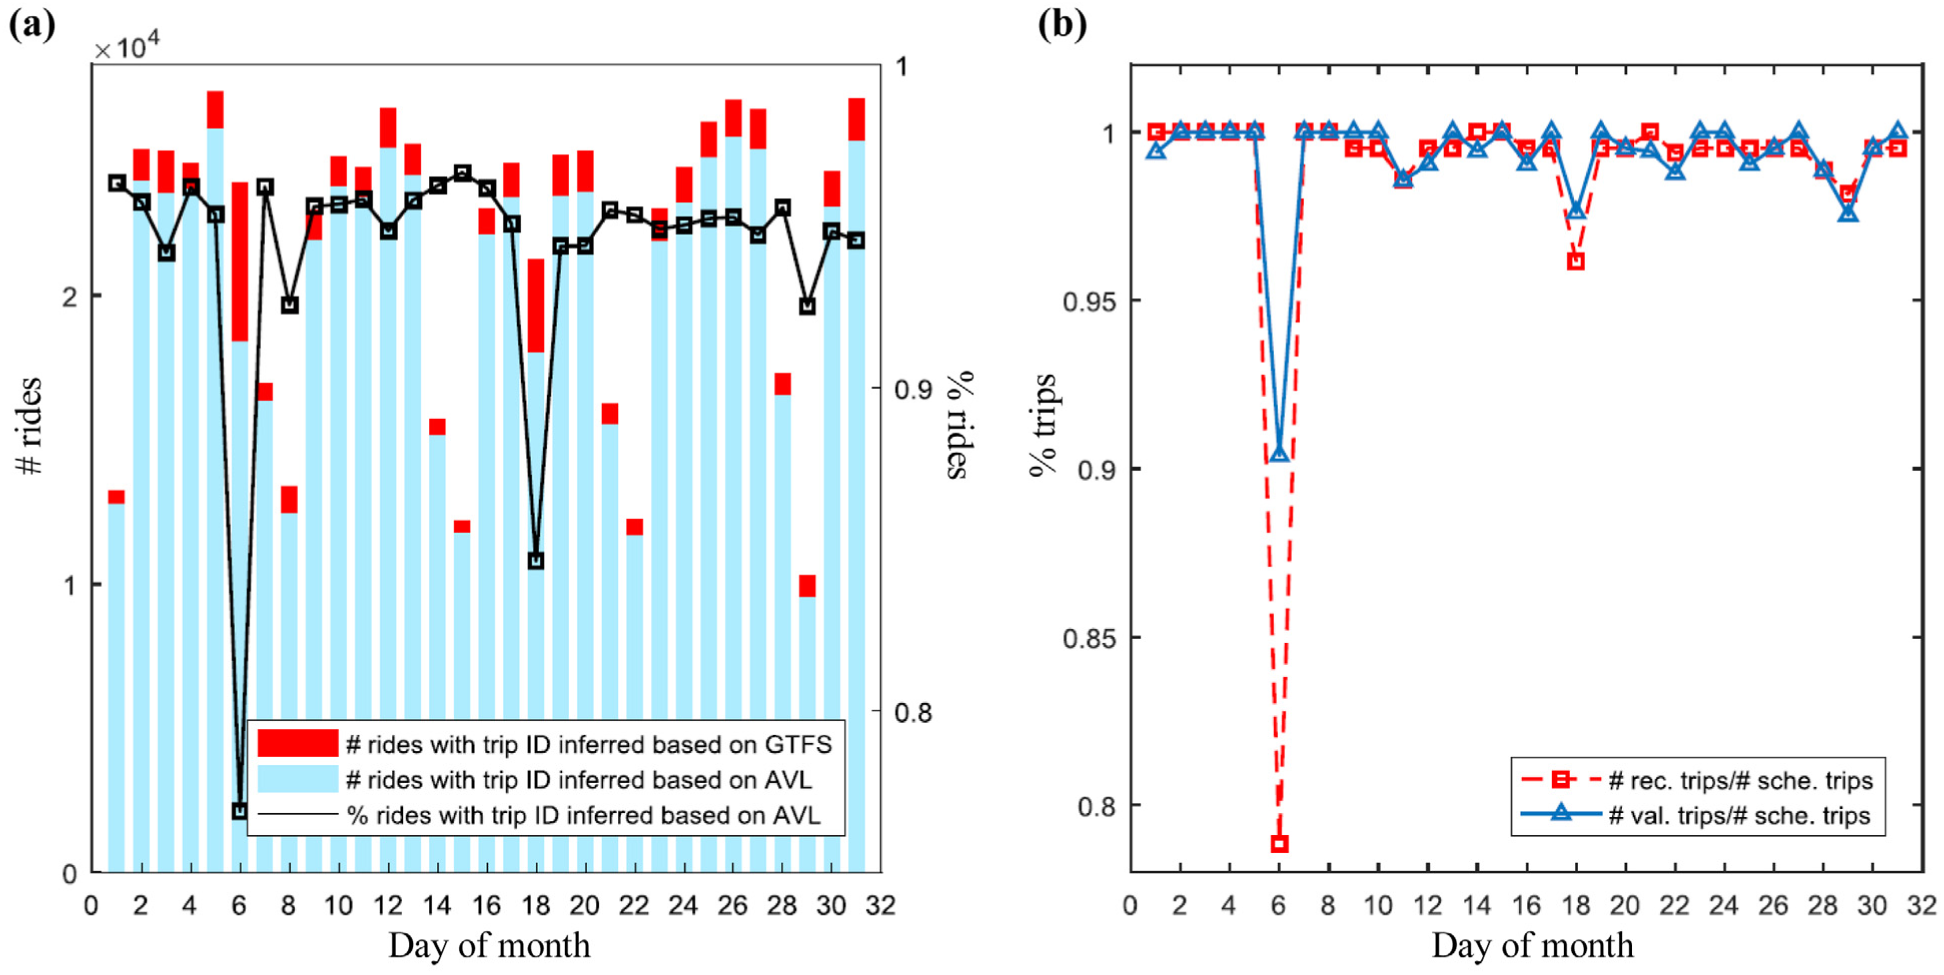
Results for trip ID inference of rides and trip validation. (a) Illustration of trip ID inference for rides that are based on recorded trajectories (AVL) and scheduled trajectories (GTFS), respectively. The line shows the percentage of rides of which trip IDs are inferred based on the recorded trajectories (AVL); (b) Comparison of numbers of scheduled trips, recorded trips and validated trips.
The percentages of recorded trips in the AVL data and the executed trips that are eventually validated compared with the total number of scheduled trips are calculated and displayed in Figure 5b. Both directions are considered at the same time. It can be seen that on many days, not all scheduled trips were executed. A significant plunge appears on the 6th of March, where fewer than 80% of scheduled trips are recorded in the AVL data, whereas over 90% trips could be validated when also using information from check-in/out activities on that day. In addition, the 18th and 29th also yield results that are clearly worse than the average. As a result of inconsistent and incomplete trajectories from the AVL data, trip ID inference of rides on these days become more unreliable, resulting in a stronger reliance on GTFS-based inference as shown in Figure 5a for March 18th and 29th.
The final output profiles are visualized by plotting so-called space-time vehicle seat occupancy graphs (Figure 6). These seat occupancy graphs relate the vehicle occupancy to the seating capacity. In the color schemes in Figure 6, 100% occupancy means that the number of passengers on board is equal to the number of seats (76 for all the vehicles running on line 1). Significant crowdedness is thus easily identified when the seat occupancy is higher than 100% (warmer color). The upper bound is set to 200%, corresponding to the maximal vehicle capacity (around 150 people). It should be emphasized that this visualization technique has great potential for decision support in transit planning and operations, ranging from timetable optimization, network and fleet scheduling, and designing sub-services running over partial lines, to name just a few. The graphs provide a single, information-rich, and intuitive global view of service quality.
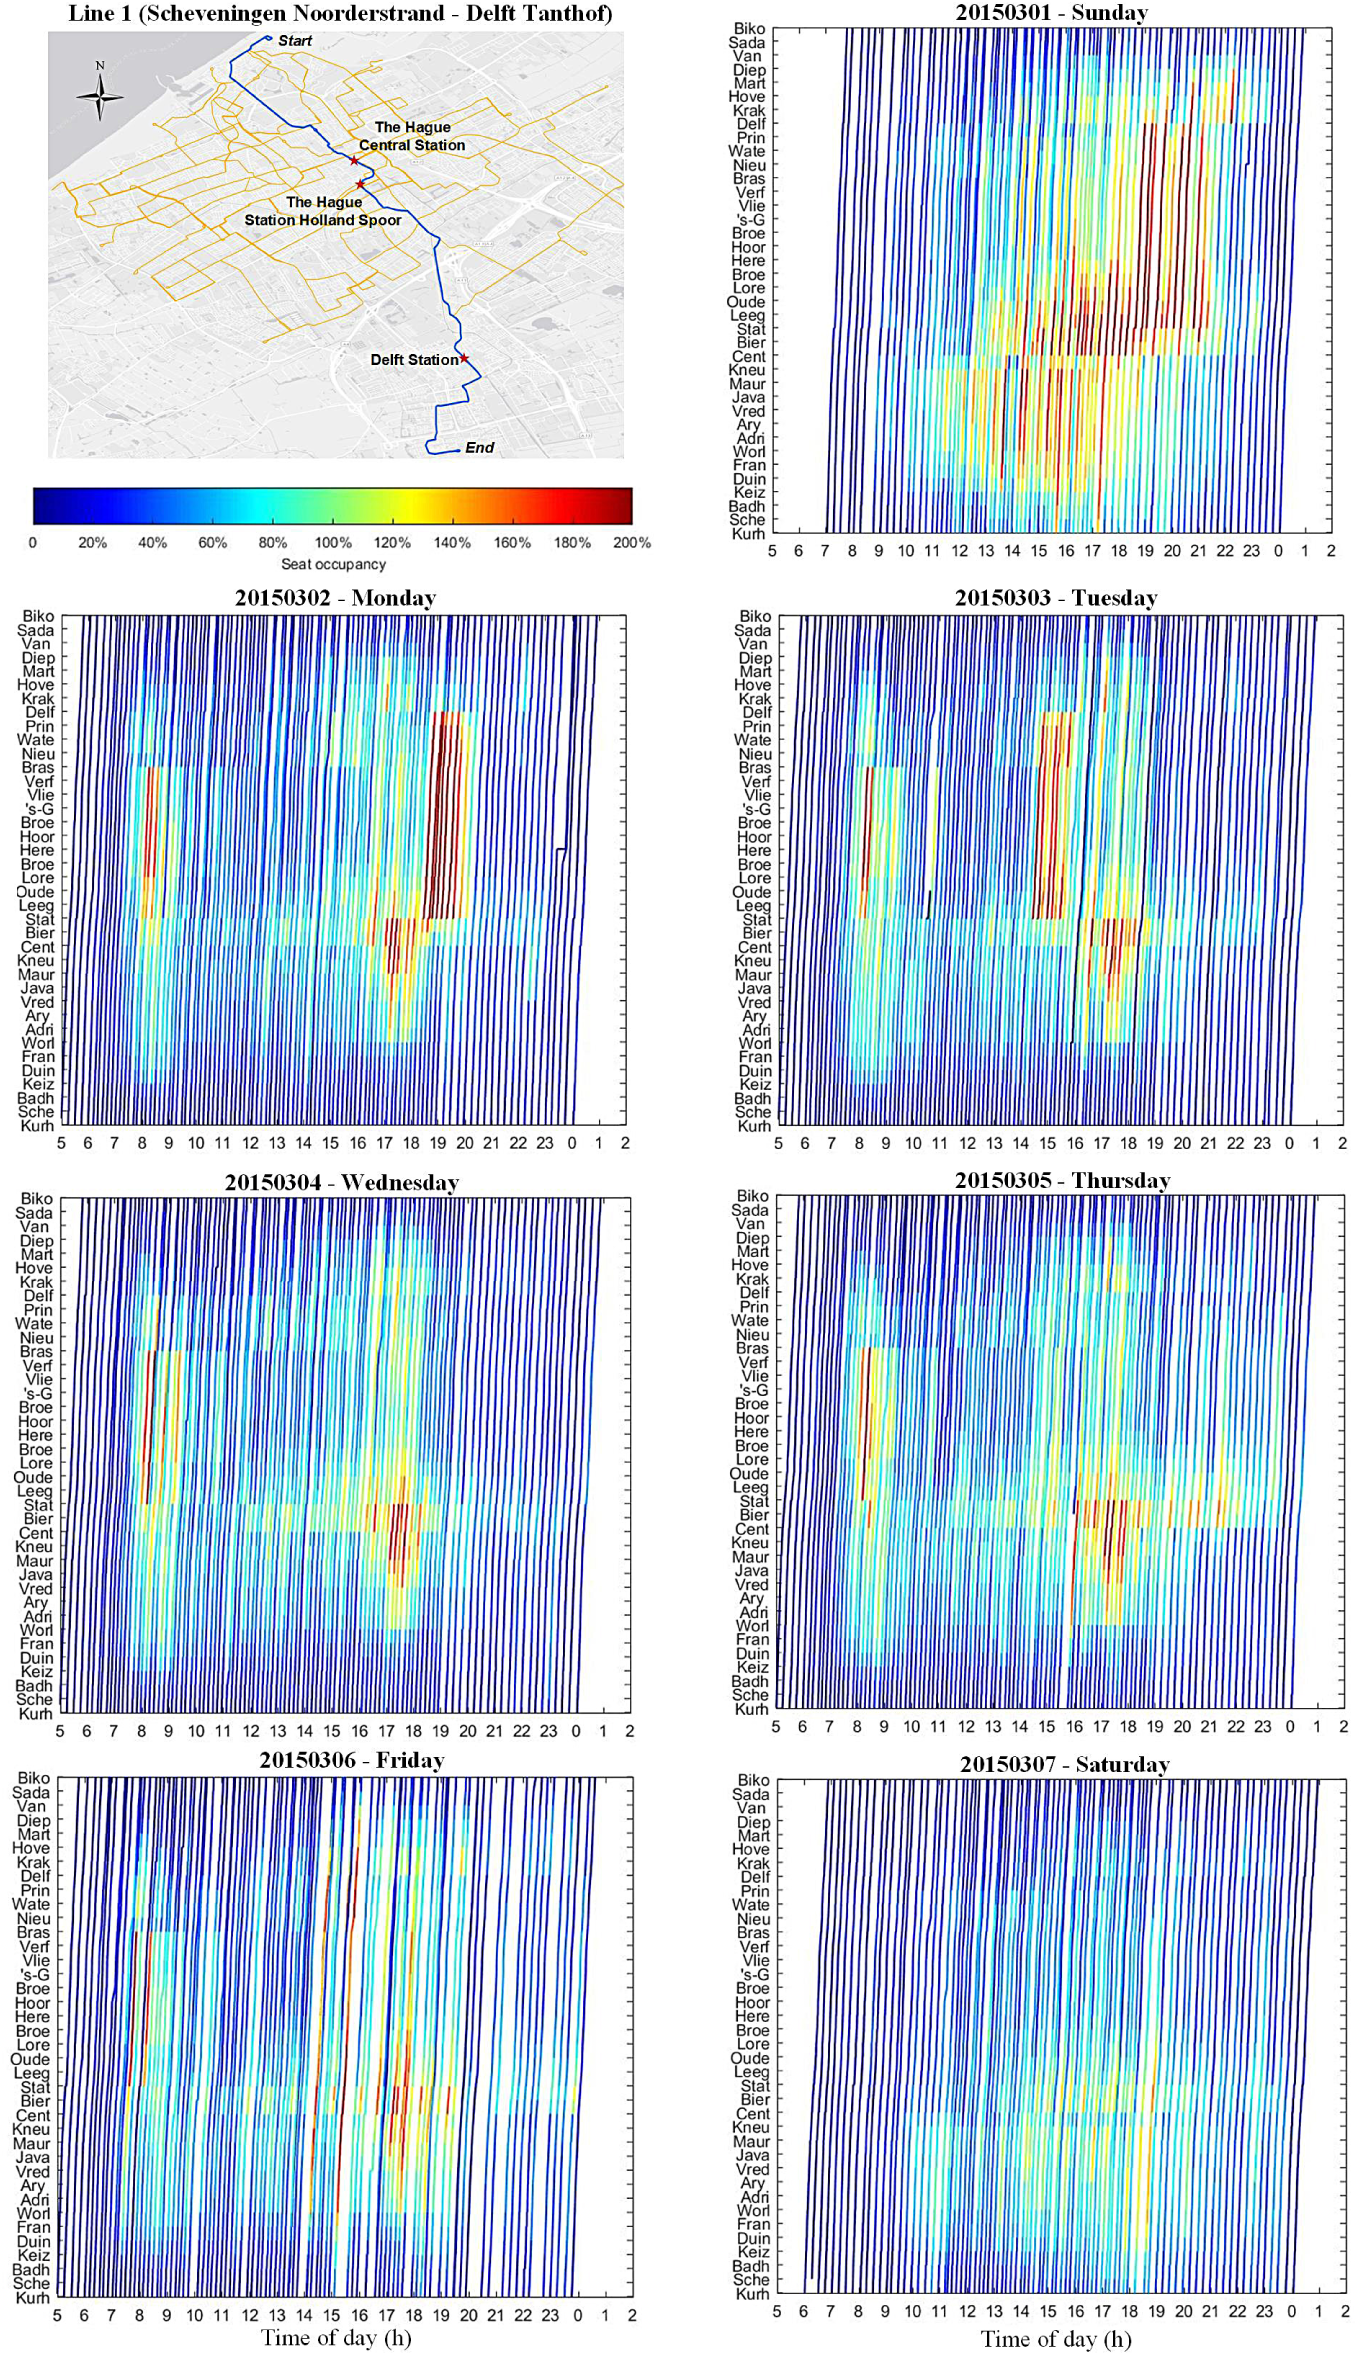
Illustrations of spatiotemporal seat occupancy of line 1 from Scheveningen Noorderstrand to Delft Tanthof over the first week of March 2015.
Although detailed analyses are beyond the scope of this exploratory study, example visualizations presented in Figure 6 (line 1 from Scheveningen Noorderstrand to Delft Tanthof over the first week of March 2015; March 1st is a Sunday) allow for identification of crowdedness over space and time. Overall, similar crowding patterns can be recognized on weekdays with clearly visible morning and afternoon peak-hour flows, while there are more variations during weekends. For instance, severe on-board crowding always occurs from Station Hollands Spoor to Badhuiskade in the morning, and from Vredespaleis to Station Hollands Spoor in the afternoon during this week.
Conclusions and Future Research
Obtaining on-board load profiles of transit vehicles has remained as a difficult task for operators in recent years as a result of technical and financial constraints. In this paper, a new methodology for constructing such profiles with multiple transit data sources is presented, including AFC, AVL, and GTFS. Difficulties of utilizing these data are discussed with the issues arising from a single or a combination of data sets specifically identified. The methodology consists of four steps through which the raw information from individual data sources is processed and corrected. The output profiles can convey integrated information regarding both vehicle trajectories and passenger demand on a large spatiotemporal scale. The methodology is demonstrated with data collected from the urban transit system in The Hague, The Netherlands. A key output is so-called space-time seat occupancy graphs, which provides operators with a compact and powerful reference to intuitively examine the on-board crowding patterns over time and space, thus helping to improve their services, such as timetable optimization, network and fleet scheduling, designing sub-services running over partial lines, and so forth.
The contribution of this study is twofold. First, the study aimed to integrate different transit data sources for obtaining state estimations for passenger loads. In this process, the issues related to each and the combination of different data sets, namely AFC, AVL, and GTFS, are specifically identified. Although based on data available in the Dutch context, most of their properties are universal, and this way of presenting all the issues can be beneficial for researchers and practitioners with different data formats but similar difficulties. Second, a methodology that solves these issues in a sequential manner is described and yields service profiles containing both vehicle trajectories and passenger loads. The complexity of approaches and algorithms in each step can vary depending on the availability of information.
On the basis of the current study, several research directions can be further explored. For example, more advanced techniques for correcting vehicle trajectories while assuring global coherence can be developed to replace the current rule-based approach. In addition, the resulting data set can significantly benefit network-wide transit flow analysis to deepen the understanding of transit system dynamics.
Footnotes
Acknowledgements
The authors thank HTM and Stichting OpenGeo for providing the AFC and AVL data sets, respectively. We also acknowledge the support of the SETA project funded by the European Union’s Horizon 2020 research and innovation program.
Author Contributions
The authors confirm contribution to the paper as follows: study conception and design: Ding Luo, Oded Cats, Hans van Lint and Loïc Bonnetain; data collection: Ding Luo; analysis and interpretation of results: Ding Luo, Loïc Bonnetain and Oded Cats; draft manuscript preparation: Ding Luo, Oded Cats, and Hans van Lint. All authors reviewed the results and approved the final version of the manuscript.
The Public Transportation Group (AP000) peer-reviewed this paper (18-02399)