
Abstract

Cephalalgia is introducing graphical abstracts to its publications. A graphical abstract is a visual summary, in a single representation, of the findings of a study. It must represent concisely and accurately the scientific content of the article. The aim of the graphical abstract is to summarise the main results of the study, to visually capture the essence of the research and to quickly attract and inform readers. The success of graphical abstracts, which are increasingly used in scientific journals, can be explained by the fact that the visual format is more attractive to readers, who capture the information more quickly and with a quality of comprehension comparable to reading a plain-language summary. In addition, our world is becoming brief and visual. As a result, readers tend to prefer graphical abstracts to full-text abstracts (1).
Graphical abstracts can be used in a variety of ways and should be used to the greatest advantage. Graphical abstracts should be prepared to communicate the results of a study simply, quickly, and effectively, as part of presentations at conferences or oral communications. It is a valuable teaching support for headache training at all levels, enabling the essential points of a scientific study to be conveyed quickly and effectively. The visually captivating format of the graphical abstract makes it a valuable support to share on the social medias on which Cephalalgia is active, such as LinkedIn, Facebook, Instagram and X (formerly Twitter). Disseminating the results of a research study with a graphical abstract improves engagement on social networks (2) and helps to increase the impact of a study (3). In addition, when science is generated with public funds, we owe an effective communication of the results to the general population. To this end, visual abstracts may reach journalists and the entire population more easily.
How to prepare the graphical abstract? When an article is submitted to Cephalalgia, the journal offers authors the opportunity to create a graphical abstract after the first revision round. The invitation to edit the graphical abstract is not sent at acceptance. There is a template, harmonised for all Cephalalgia graphical abstracts, with the title of the article, the names of the authors, the digital object identifier (DOI) and four boxes for the authors to fill in: aim, methods, results, key messages. The layout of the graphical abstract is designed to facilitate fluid reading: the title is placed at the top left and the key messages are placed at the top right, opposite the title to which they respond. The objective and methods are placed in the centre on the left, and the results on the right, which is larger to display the figure. The font (Calibri) is harmonised for the different sections and authors are advised to respect the template and the font of the template (Figure 1). The content must be self-explanatory for those who have not read the entire study yet, however, it may captivate the reader and make the full text even more attractive. The graphical abstract is not the appropriate support for discussing the results, but its purpose is to draw readers towards the full text to discover the specific details of the article and the elements of discussion.
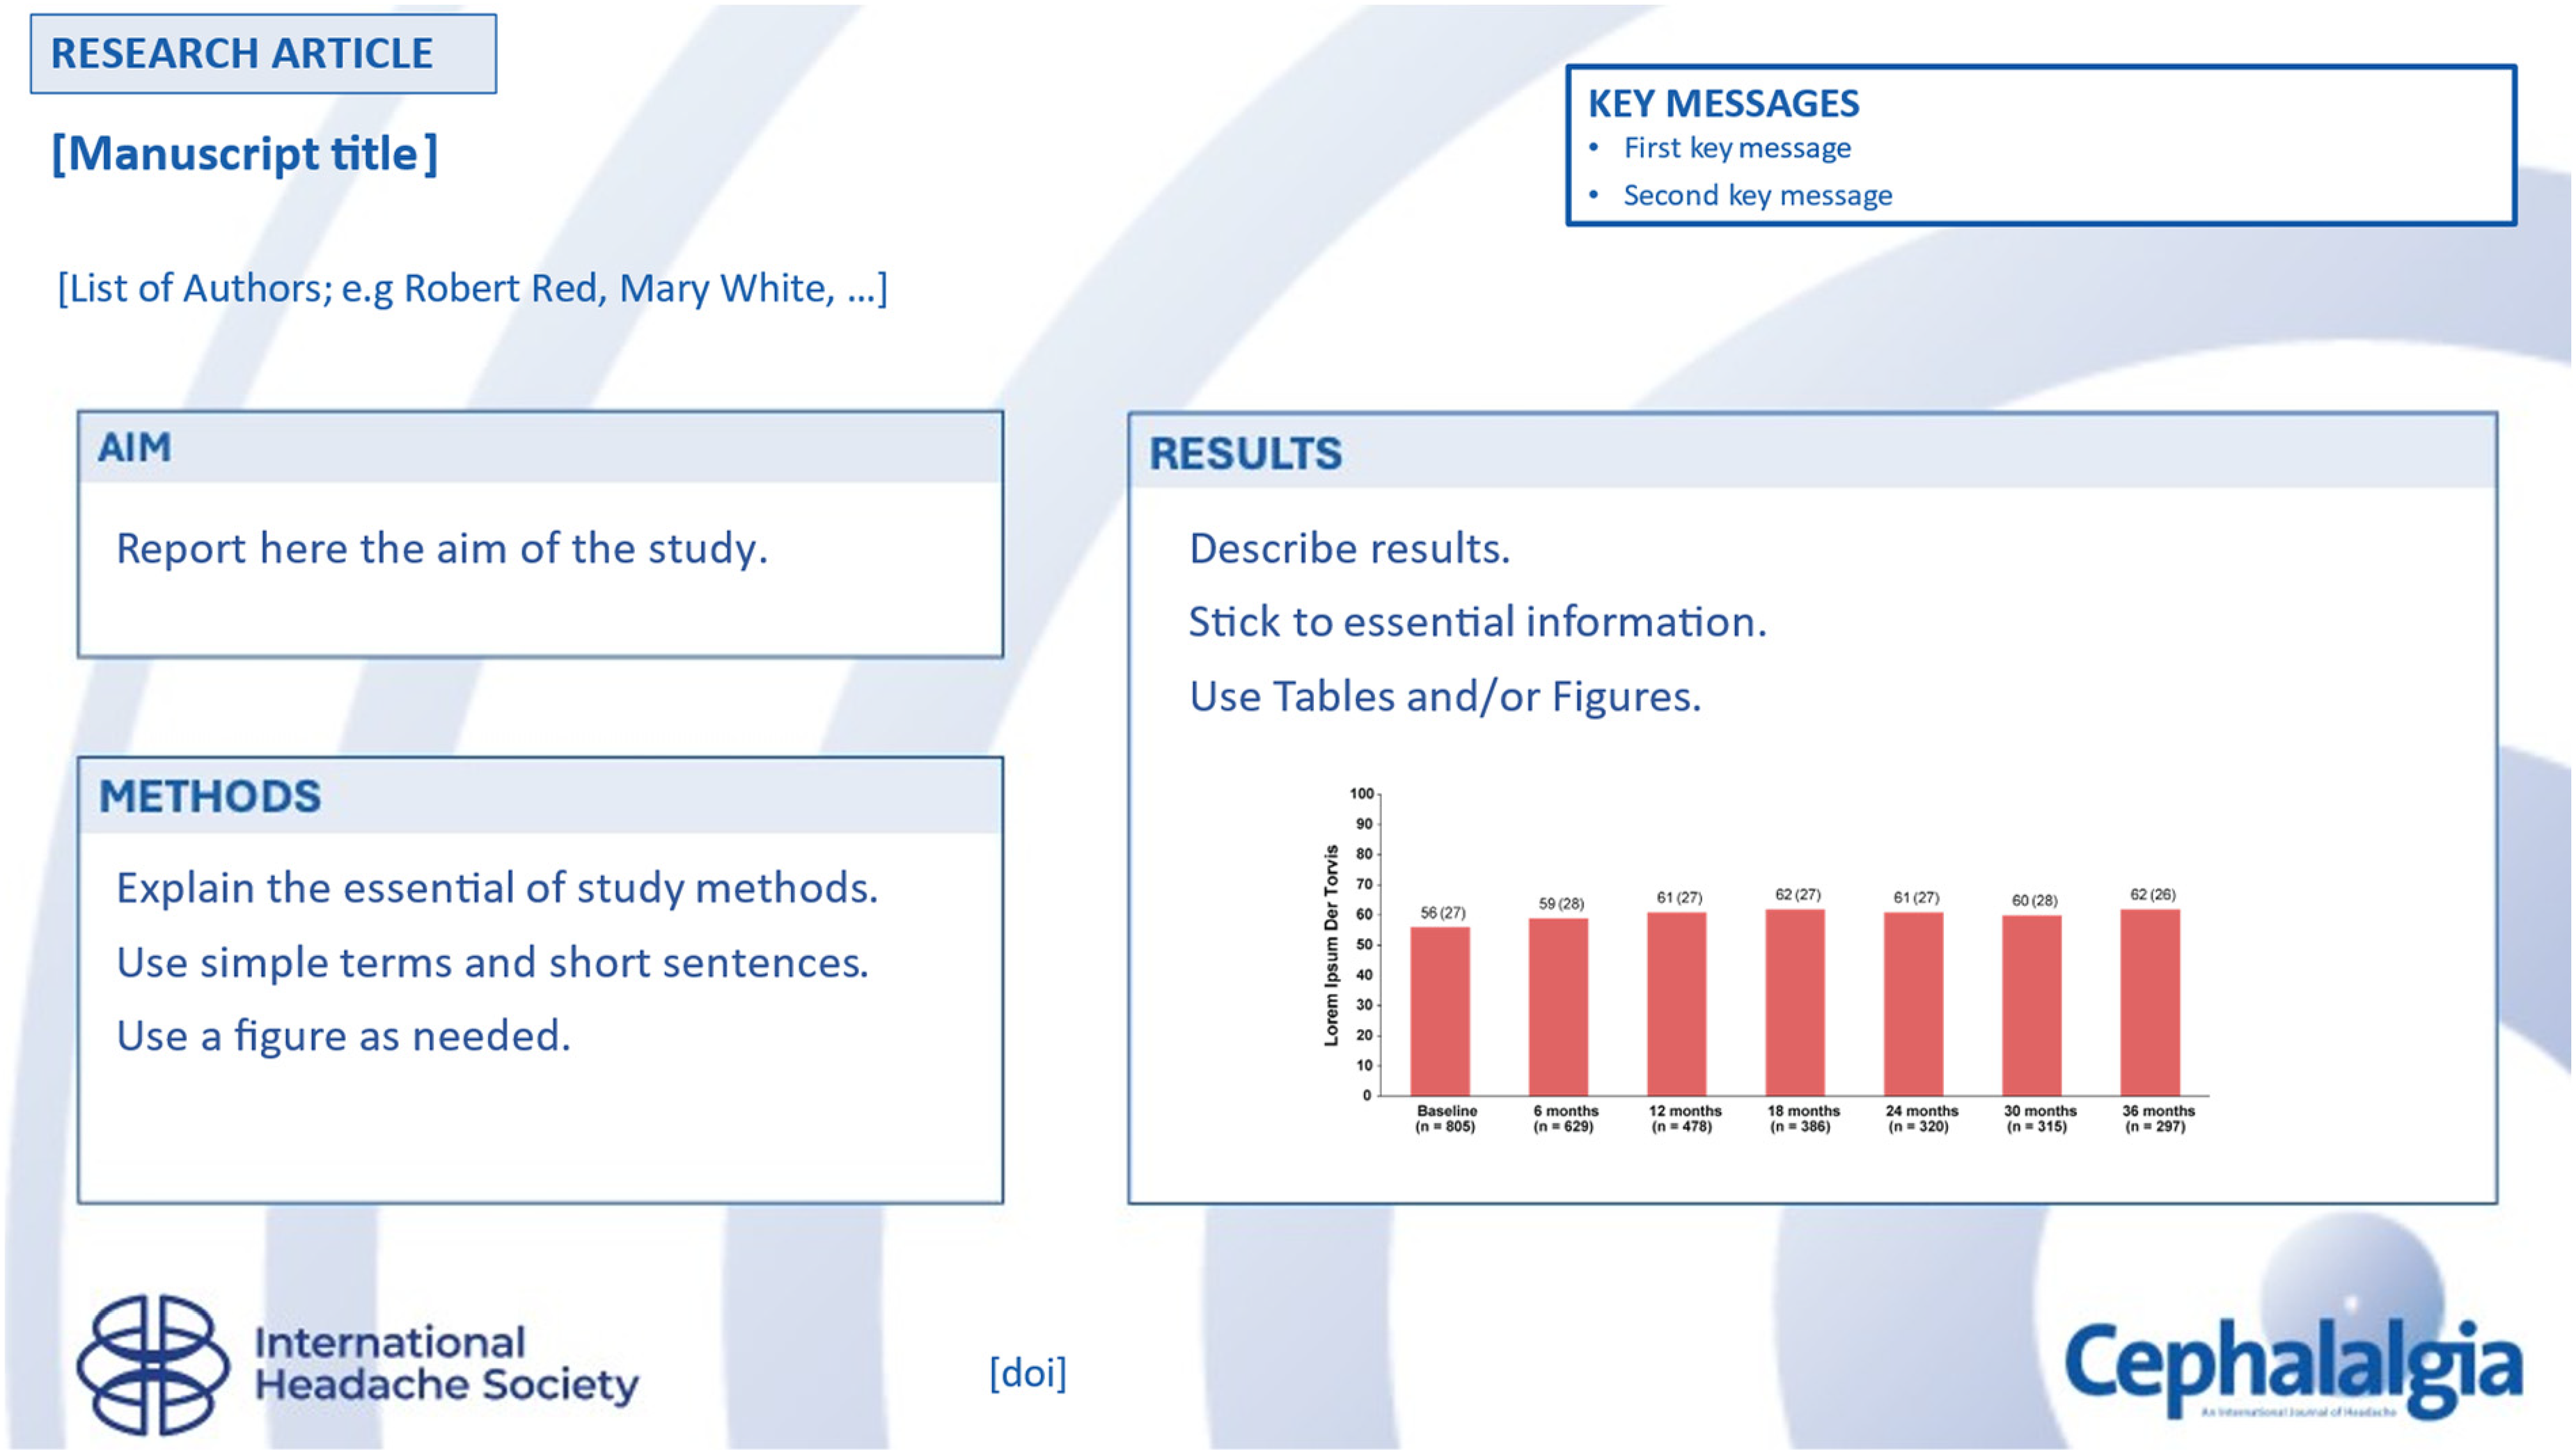
Template for Cephalalgia's graphical abstract.
What recommendations would you give us for designing the graphical abstract? We advise you to be concise, to get to the point and to present only the main results of the study, without seeking to show all the secondary or intermediate results. We encourage authors to state the aim in the form of a question. It is preferable not to overload the text, to respect the font, not to underline the text so as not to confuse it with a hypertext link, and to be as minimalist as possible in the presentation, with uniform spacing and alignment of the text. We recommend presenting the information as visually and pictorially as possible, using gender-neutral icons wherever appropriate and avoiding any icons that convey stereotypes or religious or political connotations. Tables can be used if they only present the key information. We advise you to take the time to design images or tables specifically for the graphical abstract and not to copy and paste figures and tables from the article (4). A visual abstract is definitely not a conference poster and should not be crowded with too much text. In this regard, less is more, and the most relevant information should be carefully selected. Clarity and simplicity are the watchwords of the graphical abstract!
Footnotes
Declaration of conflicting interests
The author(s) declared the following potential conflicts of interest with respect to the research, authorship, and/or publication of this article: C.G. received direct honorarium for board membership and/or speak from Novartis, Teva, Lilly, Pfizer, Abbvie, Lundbeck and Orkyn, and grants from IHS and SFETD/APICIL for academic research, not related to the submitted work. He is a board member of the French Headache Society.
D.G.-A. has received honoraria for speaker/advisory board/consultancy/research support from Novartis, Teva, Lilly, Pfizer, Abbvie, Lundbeck, and Organon. He has received grants from the International Headache Society, and competitive research funds from Carlos III Health Research Institute and Regional Health Administration, SACYL. He is a board member of the Spanish Society of Neurology and the European Union of Medical Specialists (UEMS).
Funding
The authors received no financial support for the research, authorship, and/or publication of this article.