
Abstract
Background
To date, a number of studies on migraine have cross-sectionally evaluated sensory sensitivity with aversion thresholds/scores along the migraine cycle, reporting a decreased tolerance to sensory stimuli in different sensory modalities. Our hypothesis was that patients with migraine would exhibit heightened sensitivity to sound, light, touch and smell on days where they reported greater headache intensity.
Methods
This is an exploratory, longitudinal study, carried out over the course of 27 days. Aversion thresholds or scores to sound, light, touch and smell were quantified in six patients with migraine (11.33 ± 6.53 headache days/month).
Results
Patients reported an increased sensitivity to light (padj = 0.0297), touch (padj = 0.0077), and smell (padj = 0.0201) on days with higher headache intensity. However, a greater sensitivity to sound on days with higher headache intensity was only reported when anxiety levels were high (padj = 1.4e−06). Interestingly, variable levels of tolerance to bothersome light over time can also influence the correlation between light sensitivity and headache intensity (padj = 1.4e−06).
Conclusions
Based on the present findings, future longitudinal studies evaluating sensory threshold changes along the migraine cycle in patients with migraine should account for the increased tolerance to bothersome light over time as well as the effect of anxiety on auditory sensitivity.
Introduction
Migraine is a cyclic brain disorder, characterized by the presence of recurrent and unpredictable headache, as well as a broad spectrum of fluctuating symptoms (1) including sensory processing alterations often marked by an increased sensory sensitivity (or decreased tolerance) to light (photophobia), sound (phonophobia), smell (osmophobia) and touch (cutaneous allodynia) (2). Sensory sensitivity can be quantitatively measured in a laboratory setting using either aversion (or discomfort) (i) thresholds, which consist of identifying the weakest stimulus intensity perceived as bothersome or (ii) scores, which quantify how bothersome a stimulus is perceived to be according to a visual analogue scale (3–13). Previous studies on patients with episodic migraine (EM) (<15 headache days/month) (1) found that sensory aversion thresholds change over the course of the migraine cycle. In particular, with regard to photophobia and phonophobia, aversion thresholds were found to be lower during the ictal (presence of headache) as compared to the interictal (at least ∼48–72 hours headache-free) phase (4,6,7,11). Furthermore, cutaneous allodynia, quantified using brush aversion scores, has been reported in 79% of EM patients ictally and 30% interictally (14). Few studies have quantified aversion ratings for smell, but those that have found that 35–63% of patients with EM report olfactory sensory sensitivity, which increases interictally (8,15).
To date, most studies have quantitatively measured only one or two sensory modalities at a time (3,5,7,14), and few papers have examined the relationship between modalities. Specifically, Demarquay et al. (8) found that patients with EM with greater olfactory sensory sensitivity also self-reported more photophobia. Meanwhile, Ashkenazi et al. (14) showed that patients with EM with cutaneous brush allodynia also had lower sound aversion thresholds. Additionally, studies quantifying sensory sensitivity were mainly cross-sectional (16), which might confound the results and miss important fluctuations, especially given the high interpersonal variance in sensory threshold estimation (17) and patient heterogeneity, particularly with regard to headache frequency and differing sensory sensitivity profiles (18).
Few studies have examined sensory aversion fluctuations over time. Schulte and May (19) studied a single patient with EM, and found differences in pleasant/unpleasant scores in response to gaseous ammonia and rose scents, as well as visual rotating checkboards when comparing ictal and interictal phases. Their results, however, were not replicated in a follow-up study (20).
To the best of our knowledge, no prospective longitudinal study focused on capturing daily changes in headache and aversion thresholds to multiple sensory modalities has been done. Therefore, in the present study, we quantified sensory aversion thresholds/scores to sound, light, touch and smell during 27 consecutive days. The study aimed to examine the cyclic behaviour of recurrent headaches and sensory sensitivities across modalities, as well as the potential effect of daily changes in anxiety levels, sleep quality and stimulus tolerance on the predicted association between pain intensity and sensory sensitivity. Specifically, we hypothesized that changes in headache intensity reports would correlate with changes in sensory aversion thresholds or scores across all sensory modalities. Specifically, we predicted that patients with migraine would exhibit heightened sensitivity to sound, light, touch and smell on days where they reported greater headache intensity. We argue that, if we can detect that changes in sensory sensitivity across all sensory modalities are correlated with headache and its intensity, then the causes underlying sensory sensitivity in migraine may implicate a central integrative system to coordinate activity from visual, auditory, somatosensory and olfactory modalities.
Methods
This is a prospective, longitudinal, exploratory study.
Participants
To avoid heterogeneity based on sex and age differences, all of the participants included in this research study were right-handed females with normal or corrected-to-normal vision and hearing. Participants suffering from hearing loss ≥25 dBA or tinnitus were excluded. Other exclusion criteria included the presence of neurological, psychiatric or other chronic pain conditions, a diagnosis of more than one headache disorder, as well as the use of preventive medication for migraine. Additionally, participants could not be pregnant or lactating at the time of the study. Patients were diagnosed by a neurologist that confirmed the criteria for migraine with or without aura according to the International Classification of Headache Disorders (ICHD-3) (1). All participants were recruited through the use of poster advertisements or social media posts between March 2021 and May 2021.
Migraine symptoms, headache presence and categorical reports of headache intensity (low, moderate or severe pain) for phase determination were confirmed using a digital headache diary (eDiary), which all of the participants completed over the course of 27 days at the end of every testing day (see supplementary Section 1). Additionally, one item within the eDiary was used to collect headache intensity using a numerical rating scale from 0 (no pain) to 10 (extremely painful) (21). A single number representing headache intensity was obtained for each day and participant, which was later included in all the linear mixed-effects regression models to test whether sensory thresholds or scores correlated with headache intensity scores. Included participants provided their informed consent and received monetary compensation for their participation (€200). This research study was approved by the Ethics Committee at the Vall d’Hebron Hospital (PR(AG)189/2018), and conducted in accordance with the Declaration of Helsinki.
Stimuli
Sound aversion thresholds
Auditory stimuli consisted of 1 kHz binaural pure tones, lasting 1.5 seconds (s) each.
Light aversion thresholds
Visual stimuli consisted of white light, lasting 0.19 s, presented through a calibrated projector.
Cutaneous brush allodynia scores
Tactile stimuli were presented by lightly brushing a gauze pad over a 5 cm area of skin in three different areas (frontal, posterior cervical, and medial forearm on both the right and left sides, separately) following the methodology from LoPinto et al., (22) and Ashkenazi et al., (23).
Smell aversion scores
Smoked (SC1126817), judged by patients as an unpleasant smell (24,25), lavender (SC1126818), judged as pleasant (25), and vanillin (SC1126819), with lower detection thresholds in patients (13), fragrances from IFF Spain, S.A. (Madrid, Spain) were used. An odorous solution (10%) was obtained by diluting the smell in propylene glycol. Fragrances were kept in the refrigerator, as recommended, when not in use. Three drops per odorant were separately dispensed each day through a plastic pipette to a cotton pad located inside a 250 ml glass bottle closed with a lid at room temperature, before the experiment began. To attempt to keep the intensity consistent across testing days, we used the same time intervals between preparation and subject evaluation.
Procedures and apparatus
Participants were interviewed and tested using an auditory detection task before entering the study to ensure normal hearing (auditory detection thresholds of >25 dBA were excluded; 0 participants excluded) following the same adaptive procedure previously published in our laboratory (9). They also completed the clinical and psychological questionnaires to assess common psychological comorbidities, as well as sensory symptoms in patients with migraine (see supplementary Section 1).
Participants completed five tasks every day at the same time of day (see deviations from time of examination in supplementary Section 2), leading to a temporal resolution of 24 hours of our measurements and data collection. Presentation order was fixed for all participants: (i) sound aversion threshold (Figure 1a); (ii) light aversion threshold (Figure 1a); (iii) cutaneous brush allodynia score (Figure 1b); (iv) smell aversion scores (Figure 1c) and (v) completion of the eDiary, and the State scale of the State-Trait Anxiety Inventory (26) (see supplementary Section 1).

Experimental design. (a) Sound and light aversion thresholds. Each trial began with the presentation of a white fixation cross for 1.5 s, followed by the onset of a 1 kHz tone lasting 1.5 s (or a white light lasting 0.19 s in a separate test). The first tone was presented at 65 dBA and the range of sound intensities could vary between 0 and 110 dBA, whereas the first light was presented at 107 lux and the range of light intensities could vary between 0 and 3960 lux. Participants were asked to judge how bothersome each tone (or light) was. The response screen displayed the corresponding labels for “left’’ and “right’’ buttons, which were randomly assigned either “bothersome’’ or “not bothersome’’ responses. Response buttons were counterbalanced throughout the experiment. Participants were instructed to wait until the response screen was presented and were informed that accuracy was preferred over speed. The duration of each task lasted five minutes. (b) Cutaneous brush allodynia scores. Each trial started with the presentation of a fixation cross for 5 s. Ten brushes were performed in each area (frontal, posterior cervical and medial forearm on both the right and left sides, separately). Brush rate stimulation was two times per second. Subjects were asked to judge how bothersome they perceived each stimulus to be using a horizontal, numerical rating scale (from 0 to 100; with 0 being quantified as not at all bothersome, and 100 as extremely bothersome) with the right/left arrows keys and (c) Smell aversion scores. Olfactory aversion scores were evaluated by passively presenting smells (smoked, lavender and vanillin) to both nostrils for 5 s at a rate of one per minute. A countdown (from 5 to 1), appearing at the top of the screen provided instructions to the researcher to allocate the smell at the participant’s chin height and subsequently uncover the lid, as per methodology used by Demarquay et al. (8). Then, subjects were asked to judge how bothersome each stimulus was using a horizontal, numerical rating scale (from 1 to 10; with 1 being not at all bothersome, and 10 being extremely bothersome) with the right/left arrows.
Sound aversion thresholds
Participants sat at a distance of 50 cm from a custom-made lampshade monitor (60 Hz, 1280 × 1800 pixels), with their head resting on a chin rest (Anatomical Concepts UK Ltd, Blantyre, UK). The room had a background lighting of 80 lux (Faraday cage, approximately 50 dB of external sound attention). Individual auditory calibration was performed using two ear-microphones (4101B; Hottinger Brüel & Kjaer) and a sonometer (2270-W; Hottinger Brüel & Kjaer, Virum, Denmark) before the determination of sound aversion thresholds to make sure participants were exposed to the same sound intensities (accuracy of <1.7 dBA). Accurate timing of auditory stimuli was achieved using the Black Box Toolkit (accuracy of <0.005 s); Black Box Toolkit, Ltd, Sheffield, UK). To evaluate their aversion to sound, participants responded using the right and left buttons on a four-button response pad (Black Box Toolkit Ltd). Participants were asked to judge how bothersome each sound was according to an adaptive procedure using a single-interval adjustment matrix (27) in which 50% of trials were absent of stimuli (noise) to decrease the predictability of stimulus intensity and reduce potential anticipation of bothersome stimuli (9). The previous trial’s sound intensity and consequent response determined the sound intensity of the next trial. The first sound was presented at 65 dBA and the range of sound intensities could vary between 0–110 dBA (in steps of 1 dBA). The response screen displayed the corresponding labels for “left” and “right” buttons, which were randomly assigned either “bothersome” or “not bothersome” responses. Response buttons were counterbalanced throughout the experiment. If the participant responded the stimulus was bothersome, the sound intensity was decreased according to the step size on the next trial. Whereas if they responded that the stimulus was not bothersome, the intensity was increased by the step size on the next trial. The step size increments or decrements varied as a function of the number of reversals. A reversal is a change in bothersomeness perception and this can occur, for example, when the subject responded in trial n “the stimulus was bothersome” and in trial n−1, “the stimulus was not bothersome”. Step size was set at 16 dBA and was multiplied by 0.5 for the first reversal (step size: 8), by 0.25 for the second (step size: 4), by 0.125 for the third (step size: 2) and then maintained at 1 dBA until all the reversals were completed. The procedure stopped after 12 reversals and the maximum number of trials was set at 300. The duration of the task was approximately five minutes. Throughout the experimental session, participants were instructed to fixate on a white, central fixation cross (0.5°) on a black background. For a detailed illustration of the paradigm, see Figure 1a.
Light aversion thresholds
The experimental environment (room and setup) was the same as for the sound aversion thresholds. The visual stimulation device was a projector (H116; OPTOMA, Hemel Hempstead, UK) calibrated using a spectrometer (C-7000; SEKONIC, Tokyo, Japan). The technical report behind this calibration is provided elsewhere (28). Accurate timing of visual stimuli was achieved using the Black Box Toolkit (accuracy of <0.005 s; Black Box Toolkit, Ltd). Once again, to evaluate aversion, the right and left buttons on a four-button response pad were used (Black Box Toolkit Ltd). We used the same adaptive procedure described in the sound aversion thresholds section, but this time light was presented. In this case, the intensity of light and subsequent response on the previous trial determined the light intensity on the next trial. The first light was presented at 107 lux and the light values (50 possible light intensities) were calculated using a cubic increment from 0 to the maximum monitor luminance (3960 lux). Step size was set at 8 and was multiplied by 0.5 for the first reversal (step size: 4), by 0.25 for the second (step size: 2), and then maintained at 1 until all the reversals were complete. Once again, participants were instructed to fixate on a white, central fixation cross (0.5°) on a black background. The duration of the task was approximately 5 minutes. For an illustration of the paradigm, see Figure 1a.
Cutaneous brush allodynia score
For this portion of the experiment, participants sat 50 cm from a wall, with a laptop monitor 50 cm to their right (60 Hz, 1366 × 768 pixels; Yoga 520; Lenovo, Hong Kong, China). The background lighting of the room was set at 200 lux. Cutaneous brush allodynia scores were quantified based on LoPinto et al. (22), where tactile stimuli were presented using a gauze pad to six different location on the participant’s body (right and left temple, right and left back of the neck, and right and left inner wrist). During this task, subjects were asked to judge how bothersome they perceived each stimulus to be using a horizontal, numerical rating scale. In our study, the order of stimulation was randomized each day and written at the top of the screen for researcher preparation. Participants were instructed to fixate on the white wall in front of them while the tactile stimuli were being delivered. Meanwhile, a dark square (4°; 159 pixels) on a grey background presented on the laptop computer to the right of the participant, was used to signal the duration of the stimulation to the researcher. For an illustration of the paradigm, see Figure 1b.
Smell aversion scores
The same setup and room conditions were used as for the cutaneous brush scores. The researcher was shown visual cues to present each odour at a specific time. Olfactory aversion scores were evaluated by passively presenting smells (smoked, lavender and vanillin) to both nostrils following Demarquay et al. (8). The order of presentation was randomized each day, and a reference table was used by the researchers to order the odorants prior to participant arrival. During the exposure to each fragrance, participants were instructed to fixate on the white wall in front of them. Meanwhile, a dark square (4°; 159 pixels) on a grey background presented on the laptop computer to the right of the participant, was used to signal the duration of the stimulation to the researcher. For further description of the paradigm, see Figure 1c.
Before the start of the study, participants were familiarized with the structure of the session a week before the official start. During the initial interview, participants were also encouraged to avoid taking acute medication at least 12 hours prior to the experimental session and to not reveal the presence/absence of headache to the researchers. The time and the intensity of both, sound maxima and light maxima were taken into account to avoid damage to participants hearing or vision (29,30).
The experimental paradigms were custom programmed using the Psychtoolbox toolbox v3.0.12 extensions (31) with MATLAB R2017 (MathWorks, Natick, MA, USA).
Data analysis
Demographic, clinical and psychiatric measurements
The mean ± standard error for the demographic data, as well as the clinical and psychiatric questionnaires were calculated. Migraine frequency and headache intensity were also reported.
We divided the migraine cycle into five categories using the data collected from the eDiary:
Ictal: Headache day Preictal: 48 hours before an ictal day Postictal: 24 hours after an ictal day Interictal: Headache-free days between preictal and postictal days, at least 72 headache-free hours Unclear: When the specific day meets the criteria for more than one phase
Auditory detection, sound and light aversion thresholds
Individual auditory detection thresholds as well as sound or light aversion thresholds were estimated using the average of the last four reversals (27). Lux values were transformed to log10 lux for the purpose of conducting regression analyses (5).
Cutaneous brush allodynia score
Individual cutaneous brush allodynia scores were estimated using the sum of each stimulation to the frontal, posterior-cervical and medial-forearm, for both right and left sides. Scores could range between 0 and 600. Allodynia scores were transformed using the equation Ynew = log10 (Y + 1) for use in regression analyses (22).
Smell aversion scores
The individual smell aversion scores were estimated for each smell separately (smoked, lavender and vanillin). Scores could range between 1 and 10.
Statistical analysis
To test the sensory aversion thresholds/scores, linear mixed-effects models were fit to the data. Fixed-effects were included for four experimental factors that were all considered to be continuous variables: Headache intensity (scale from 0 (no pain) to 10 (extremely painful) score), state anxiety (scores from 20 to 80, with higher scores denoting greater anxiety) (26), sleep quality (scores from 1 to 4, with higher scores denoting worse sleep quality), and tolerance to stimuli over time (ranging from 1 to 27 days, with the latter being the end day). Anxiety (32,33), sleep quality (34,35), tolerance (36), menstruation (37,38) and medication intake (39) have been linked to the modulation of pain thresholds in past studies. Menstruation and medication intake were not included in the models as a result of a low number of observations in one condition. State anxiety, sleep quality and tolerance were selected to assess their effects on modulating aversion thresholds/scores. We analysed all tested days (interictal, preictal, ictal, postictal and unclear) regardless of the phase of migraine. Only complete observations were analysed. Data were missing for two participants (two days in one patient and three days in another). Participant was included as a random factor (random intercept) and random slopes for headache intensity were considered in the models. Initially, a full fixed-effects model was considered to obtain the most parsimonious random-effects structure (we tested random intercepts and random slopes for headache intensity variance parameters, and the correlation parameter between intercepts and slopes). Once the random-effects structure was established, we selected the most parsimonious fixed-effects structure. Models were compared with and without each term using the Akaike information criterion and a chi-squared test on the model log-likelihoods (40). The fixed-effect headache intensity was included in all of our final models, whereas all of the remaining fixed factors (sleep quality, anxiety and tolerance over time) were tested and were only included in the final model if they improved its fit. Visual inspection of residual plots did not reveal deviations from homoscedasticity or normality for all sensory modalities after the specified unit transformations (light and touch) and the removal of some outlier observations (maximum of three per model). We have evaluated interaction effects by showing the mean ± 1.5 standard deviation for moderators using the sjplot library in R Software (R Foundation, Vienna, Austria), aligning with recommended methodologies (41). This approach ensured a comprehensive assessment, with selected points for moderators based on their dispersion, strengthening the validity and robustness of our findings.
Estimates were obtained using restricted maximum likelihood. Significance was calculated using t-statistics and the Satterthwaite degrees of freedom (42). p-values (padj) of the t-statistics for each model were adjusted for multiple comparisons using the false discovery rate (FDR). Estimates, t-statistics, p-values and padj values were reported, confidence level set to 0.95.
To examine the relationship between the continuous variables, we used the Pearson correlation and adjusted p-values were evaluated with the method of Holm. P-values (p), p-adjusted values (padj), t-values (t), W-values (W) and correlation values (r) are reported for each condition and comparison. p < 0.05 was considered statistically significant.
The statistical analyses were conducted using R software, the nlme package (https://rdocumentation.org/packages/nlme/versions/3.1-158) and MATLAB (MathWorks).
Results
Participant demographics and migraine characteristics
We included six patients with migraine (all female, 25.7 ± 0.6 years old) and the number of days in each migraine phase can be seen in Table 1. Patients had a mean headache frequency of 11.33 ± 6.53 headache days/month. We did not anticipate two of our patients presenting 17 and 21 headache days/month (Figure 3a; 2 bottom plots) compared to the other patients that ranged from three to nine headache days/month; however, given that we did not have any a priori hypothesis about the influence of headache days on sensory aversion thresholds, we have included them in the dataset. Please note that previous studies evaluating both, patients with EM and chronic migraine (CM, ≥15 headache days/month), did not find correlations between sensory thresholds and headache frequency (9,43). A Spearman correlation, with FDR adjusted p-values for patients with migraine revealed that headache intensity was correlated with anxiety (r = 0.31, padj < 0.0001) and sleep quality (r = 0.39, padj < 0.0001). With regard to cutaneous allodynia (measured at baseline using the ASC-12 questionnaire), we found five patients reporting mild allodynia (scores: from 3 to 5), and one patient not reporting any allodynia (score: from 0 to 2). For more information, see Tables 2 and 3 (see also supplementary, Section 3).
Global patient information

Demographic, baseline test and questionnaires for patients with migraine.

Continuous data is represented in mean ± standard error. ASC, Allodynia Symptom Checklist; STAI, State-Trait Anxiety Scale, Inventory; BDI-II, Beck Depression Inventory, second edition scale; GÜF/THS, Test de Hypersensibilidad al Sonido; SPQ, Sensory Perception Quotient; COII, Chemical Odour Intolerance Index; CH_II, Cortical Hyperexcitability.
Daily questionnaires for patients with migraine.
Continuous data is represented in mean ± standard error. STAI, State-Trait Anxiety Scale.
Sensory aversion thresholds or scores
Individual aversion thresholds or scores were reported for each sensory modality in Figure 2 and as z-scores in Figure 3. The final linear mixed-effects model for each sensory modality, as well as the estimates, confidence intervals, t-values and p-values for the fixed-effects can be seen in Table 4. Tables for model selection, control for influential observations and VIF values can be seen in supplementary sections 4 and 5.

Individual aversion thresholds or scores for each sensory modality. Sina plots of the sensory aversion thresholds or aversion scores. Filled dots represent the individual data of sensory aversion thresholds or scores.

Individual aversion thresholds or scores reported as z-scores for each sensory modality. Sound and light z-scores signs were reverted in this figure to facilitate interpretation. Headache (headache intensity), Sound (aversion threshold), Light (aversion threshold), Smoked, Lavender, Vanillin and Cutaneous brush (aversion scores). Missing data (black); presence of menstruation/medication (X); phase of the migraine cycle: ictal day (filled in violet), preictal (filled dark grey), postictal (filled light grey), interictal (outlined in black), unclear (blank) and Covid-19 vaccine dose (*).
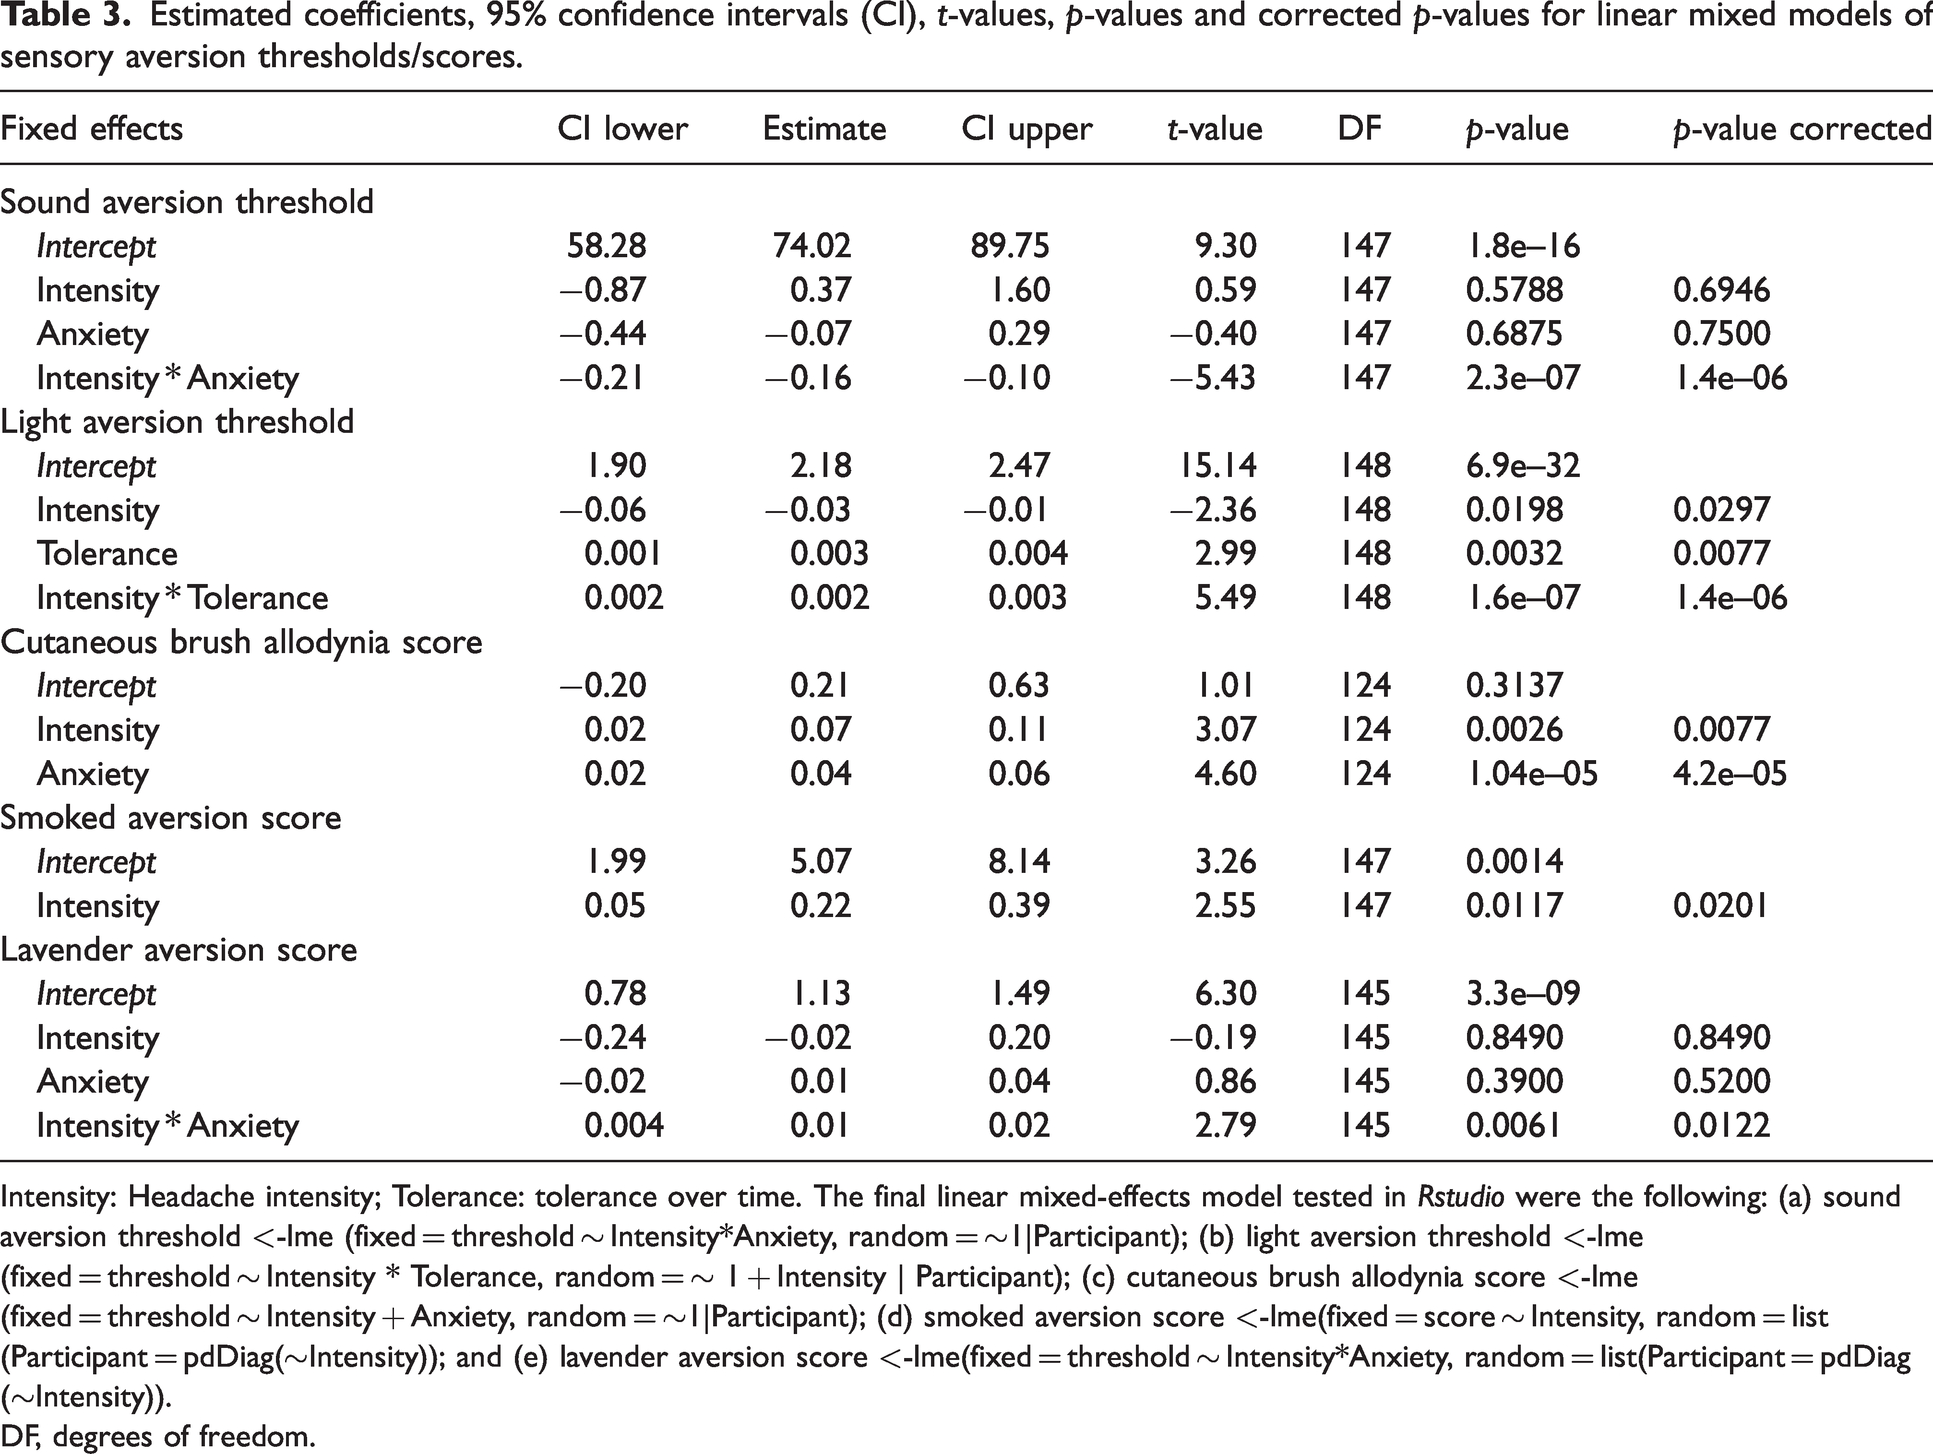
Estimated coefficients, 95% confidence intervals (CI), t-values, p-values and corrected p-values for linear mixed models of sensory aversion thresholds/scores.

Intensity: Headache intensity; Tolerance: tolerance over time. The final linear mixed-effects model tested in Rstudio were the following: (a) sound aversion threshold <-lme (fixed = threshold ∼ Intensity*Anxiety, random = ∼1|Participant); (b) light aversion threshold <-lme(fixed = threshold ∼ Intensity * Tolerance, random = ∼ 1 + Intensity | Participant); (c) cutaneous brush allodynia score <-lme (fixed = threshold ∼ Intensity + Anxiety, random = ∼1|Participant); (d) smoked aversion score <-lme(fixed = score ∼ Intensity, random = list(Participant = pdDiag(∼Intensity)); and (e) lavender aversion score <-lme(fixed = threshold ∼ Intensity*Anxiety, random = list(Participant = pdDiag(∼Intensity)).
DF, degrees of freedom.
Sound aversion thresholds
The effect of headache intensity on sound aversion thresholds was assessed in patients with migraine. All tested days were included (total observations = 158, two outlier observations were removed after verifying the assumptions of the mixed-effects linear model). Although we did not find a main effect of headache intensity (t147 = 0.59, padj = 0.6946), or state anxiety (t147 = –0.40, padj =0.7500), a significant interaction between headache intensity and anxiety (t147 = –5.43, padj = 1.4e–06) indicated that anxiety levels can influence the correlation between sound aversion thresholds and headache intensity. Specifically, on days where patients reported higher anxiety scores, greater headache intensity was correlated with lower sound aversion thresholds (i.e., increasing auditory sensitivity). On the other hand, we did not find a correlation between headache intensity and sound aversion thresholds on days that patients did not report anxiety (Figure 4 and Table 4).

Sensory aversion thresholds or scores and headache intensity in migraine. Lines represent the effect plots of the sensory aversion thresholds or scores along with headache intensity according to the selected moderators. Shadowed lines depict the 95% confidence interval.
Light aversion thresholds
The effect of headache intensity on light aversion thresholds was evaluated in patients with migraine. All tested days were included (total observations = 157, no outliers). We found a significant main effect of headache intensity (t148 = –2.36, padj = 0.0297) and of tolerance to stimuli (t148 = 2.99, padj = 0.0077). Moreover, a significant interaction between headache intensity and tolerance to stimuli (t148 = 5.49, padj = 1.4e–06) indicated that different levels of exposure to stimuli can influence the relationship between headache intensity and light aversion thresholds. In particular, earlier on in the study, patients reported greater headache intensity on days with a decreased light aversion threshold (i.e., increased visual sensitivity) whereas, towards the end of the study, greater headache intensity tended to cooccur with increased light aversion thresholds (i.e., decreased visual sensitivity) (Figure 4 and Table 4).
Cutaneous brush allodynia score
The effect of headache intensity on cutaneous brush allodynia scores was only evaluated in patients with migraine that reported allodynia (mean scores >0, n = 5 patients). All tested days were included (total observations = 131, no outliers). We found higher cutaneous brush allodynia scores (i.e., increased touch sensitivity) on the days that patients reported greater headache intensity increased (t124 = 3.07, padj = 0.0077). We also found a main effect of anxiety (t124 = 4.60, padj = 4.2e−05), showing that, on the days where patients reported greater anxiety scores, the cutaneous brush allodynia scores were higher (Figure 4 and Table 4).
Smell aversion scores
The effect of headache intensity on smell aversion scores was assessed in two models; one for the smoked smell and the other for lavender smell. All tested days were included (total observations = 157 per smell, three outlier observations were removed per smell after verifying the assumptions of the mixed-effects linear model). We found that patients reported greater aversion to the smoked smell (i.e., increased smell sensitivity) on days with higher headache intensity (t147 = 2.55, padj = 0.0201) (Figure 4 and Table 4). We did not find a main effect of headache intensity (t145 = –0.19, padj = 0.8490) or of state anxiety (t145 = 0.86, padj = 0.5200) for lavender. The interaction of headache intensity and anxiety for lavender data (t145 = 2.79, padj = 0.0122), on the other hand, suggested that when anxiety scores were high, patients reported a greater headache intensity on days with increased aversion to lavender (i.e., increased smell sensitivity). On days in which patients reported low anxiety levels, we did not find the correlation between lavender aversion and headache intensity (Figure 4 and Table 4). However, note that this interaction was biased by singular observations because the results only remained statistically significant 1% of the time when we controlled for influential observations (re-analyses of models removing one observation every time; see supplementary Table 5). Hence, this particular result should be taken with caution. We were unable to fit a model to the data in response to the vanillin smell; therefore, it was not considered for further analyses.
Discussion
The present study aimed to quantify sensory aversion threshold/scores to sound, light, touch and smell longitudinally, during 27 consecutive days, thus capturing changes in sensory sensitivity during the migraine cycle. We assessed the effect of anxiety state, stimulus tolerance over time and sleep quality on the outcome variable in our analyses. The results of our study demonstrate that, in patients with migraine, days with greater headache intensity were correlated to increased sensory sensitivity to light, touch and smell in line with Kelman et al. (44). However, our results suggest that this relationship between headache intensity and sensory sensitivity depends on the levels of anxiety for sound, as well as on stimulus tolerance over time for light. In particular, we found that, on days when patients with migraine reported higher levels of anxiety, greater headache intensity was correlated with an increased sensitivity to sound, which extends literature on the influence of anxiety on the perception of pain (33). Likewise, days with greater anxiety scores correlated with sensory sensitivity increases to brush touch. The findings indicating that both sensitivity to sound and touch were influenced by anxiety add to prior studies that have demonstrated a relationship between phonophobia and cutaneous allodynia in migraine (14). Remarkably, our results showed an increase in the light tolerance over time, which appeared to influence the association between sensitivity to light and headache intensity. Specifically, we found that, earlier on in the study, patients reported increased light sensitivity on days with greater headache intensity, whereas, towards the end of the study, greater headache intensity tended to cooccur with decreased light sensitivity. Pain habituation is a process where subjective pain intensity responses decrease after exposure to repetitive noxious stimuli (36). When there is persistent and unavoidable pain, an increased tolerance may act as an adaptive mechanism to future exposures. Lavender and vanillin were not perceived as bothersome by most of our participants and, in the case of vanillin, our models did not converge. For lavender, on the other hand, the results were biased by influential observations; therefore, they should be interpreted with caution. Further testing the correlation between non-aversive smells with headache intensity would be required.
The present findings are consistent with heightened sensitivity arising from an impaired conditioned pain modulation, leading to less efficient endogenous pain modulatory pathways and/or central sensitization in patients with migraine. We propose that heightened sensory sensitivity could result from alterations in central integrative systems, and represent an intrinsic symptom of migraine, persisting even on headache-free days.
Our study has several limitations. First, the small sample size of our sample is similar to previous longitudinal studies quantifying psychophysical measures in migraine (e.g. one and seven subjects tested in Schulte & May (19,20) and 11 subjects in Shepherd (45)). Second, both researchers who collected the experimental data (NI and AMM) were not blinded to participant diagnosis, although they were blinded with regard to the presence of daily headache. Third, we could not include medication intake in our models to control their effect. However, patients during the study were not taking preventive medication and were encouraged to not take acute medication 12 hours before the session. Fourth, we included an unequal number of ictal days per patient in the analyses, which may have caused unbalanced weight for patients with different attack frequency. We fit mixed-effect models to our data in an effort to control for these unequal number of days. Fifth, although longitudinal studies may offer researchers a chance to examine changes in metrics such as sensory sensitivity over the course of the migraine cycle, especially in headache free days, patients included did not register enough preictal (n = 20) or postictal (n = 12) days in our dataset to be able to carry out these analyses. We consider that this is something future research studies should continue to expand on, aiming to better understand the gradual changes that might happen before and after migraine days. Finally, although both EM and patients with headache frequencies ≥15 headache days/month were included, previous studies evaluating both patients did not find correlations between sensory thresholds and headache frequency (9,43).
To conclude, our study confirmed that patients with migraine, exhibited increased sensory sensitivity to multiple stimuli (light, touch and smell) on days when they reported greater headache intensity. However, the relationship between headache intensity and aversion thresholds to sound or light may not be as straightforward as previously assumed, appearing to involve a complex interplay of other cognitive factors such as anxiety and stimulus tolerance over time, which may suggest the involvement of a central integrative system. Levels of anxiety and tolerance to bothersome stimuli throughout the experiment should be accounted in future longitudinal studies on sensory sensitivity.
Clinical implications
A relationship between headache intensity, anxiety level, stimulus tolerance over time and changes in sensory threshold/score was demonstrated using psychophysics over the course of 27 days. Days with greater headache intensity were correlated to increased sensory sensitivity to light, touch and smell in patients with migraine. The relationship between headache intensity and sensory sensitivity depends on the level of anxiety in response to sound and on stimulus tolerance over time for light.
Supplemental Material
sj-pdf-1-cep-10.1177_03331024241230279 - Supplemental material for Quantifying sensory thresholds along the migraine cycle: An exploratory longitudinal study
Supplemental material, sj-pdf-1-cep-10.1177_03331024241230279 for Quantifying sensory thresholds along the migraine cycle: An exploratory longitudinal study by Nara Ikumi, Angela Marti-Marca, Anna de la Torre-Suñe, Xim Cerda-Company, Adrià Vilà-Balló, Victor J Gallardo, Edoardo Caronna, Alicia Alpuente and Patricia Pozo-Rosich in Cephalalgia
Footnotes
Acknowledgements
We thank all of the participants who came during 27 consecutive days to our laboratory (including weekends) and patiently collaborated with the researchers. The methodology behind the calibration of the visual stimulation device was prepared as part of a final Bachelor’s project by Miguel Descalzo Pérez, and was conducted in collaboration with Professor José M. Gómez Cama from the Universitat de Barcelona. The smells and glass bottles were offered by IFF Spain, S.A.
Author contributions
NI, AMM and PPR were responsible for the concept or design of the work. EC, NI and AMM were responsible for participant recruitment. NI and AMM were responsible for data acquisition. NI, ATS and VJG were responsible for data analyses. NI, AMM, ATS, XCC, AVB, VJG and PPR were responsible for data interpretation. NI and AMM were responsible for drafting the article. NI, AMM, ATS, XCC, AVB, VJG and PPR were responsible for critically revising the article. PPR was responsible for supervision and project administration. PPR, AA and EC were responsible for funding acquisition.
Data availability
The datasets used and/or analysed during the current study are available from the corresponding author on reasonable request.
Declaration of conflicting interests
NI, AMM, ATS, AVB, XCC and VJG declare that they have no competing interests. EC has received honoraria as speaker from Novartis. AA has received honoraria as speaker from AbbVie and for education from Novartis and Eli Lilly. PPR has received, in the last three years, honoraria as a consultant and speaker from Allergan/Abbvie, Almirall, Biohaven, Chiesi, Eli Lilly, Medscape, Neurodiem, Novartis and Teva Pharmaceuticals. Her research group has received research grants from La Caixa Foundation, Novartis, Teva Pharmaceuticals, AGAUR and FEDER RIS3CAT, and has received funding for clinical trials from Allergan/Abbvie, Amgen, Eli Lilly, Novartis and Teva Pharmaceuticals.
Ethical statement
This research study was approved by the Ethics Committee at the Vall d’Hebron Hospital (PR(AG)189/2018), and conducted in accordance with the Declaration of Helsinki. The participants provided informed consent.
Funding
The authors disclosed receipt of the following financial support for the research, authorship, and/or publication of this article: NI salary has been co-funded by the European Regional Development Fund (001-P-001682) under the framework of the FEDER Operative Programme for Catalunya 2014–2020, with €1,527,637.88. AMM salary has been partially financed by a predoctoral grant from the “Fundació Institut de Recerca Hospital Universitari Vall d’Hebron” (VHIR/BEQUESPREDOC/2020/MARTI). AVB salary has been partially financed by a Juan de la Cierva-Formación grant (FJC2018-036804-I) and Juan de la Cierva – Incorporación postdoctoral (IJC2020-043139-I) from the Spanish Ministry of Science and Innovation. EC salary has been funded by Río Hortega grant Acción Estratégica en Salud 2017–2020, instituto de Salud Carlos III (CM20/00217).
ORCID iDs
Supplemental material
Supplemental material for this article is available online.
References
Supplementary Material
Please find the following supplemental material available below.
For Open Access articles published under a Creative Commons License, all supplemental material carries the same license as the article it is associated with.
For non-Open Access articles published, all supplemental material carries a non-exclusive license, and permission requests for re-use of supplemental material or any part of supplemental material shall be sent directly to the copyright owner as specified in the copyright notice associated with the article.