
Abstract
Background
Quantitative sensory testing protocols for perceptions of pleasantness and unpleasantness based on the German Research Network on Neuropathic Pain protocol were recently introduced. However, there are no reliability studies yet published.
Aim
To evaluate the intra-examiner (test-retest) and inter-examiner reliability for orofacial pleasantness and unpleasantness quantitative sensory testing protocols.
Methods
Sixteen healthy participants from Aarhus University (11 women and five men, mean age 24, range 21–26 years) contributed. Two examiners were trained in performing the entire quantitative sensory testing protocols for pleasantness and unpleasantness, which included the additional dynamic tactile stimulation test using a goat-hair brush. Each participant underwent examination of both protocols by each examiner (inter-examiner reliability) on day 1. They returned at least 8 days following the testing to be re-examined by one examiner (intra-examiner reliability). All testing was performed on the skin of the right mandibular mental region. The intraclass correlation (ICC) was used to determine reliability.
Results
For the protocol investigating pleasantness, the majority of parameters had good to excellent intra-examiner (11/14: Intraclass correlation 0.67–0.87) and inter-examiner (13/14: Intraclass correlation 0.62–0.96) reliabilities. Similarly, the protocol investigating unpleasantness had good to excellent intra-examiner (intraclass correlation 0.63–0.99) and inter-examiner (intraclass correlation 0.65–0.98) reliabilities for most (13/15) of the parameters.
Conclusion
Intra and inter-examiner reliabilities in the majority of quantitative sensory testing parameters (apart from the summation ratio) investigating pleasantness and unpleasantness are acceptable when assessing somatosensory function of the orofacial region.
Abbreviations
CT cold threshold HT heat threshold TSL thermal sensory limen MT mechanical threshold MPT mechanical pinprick threshold MS mechanical sensitivity DMS dynamic mechanical stimulation SRPl summation ratio for pleasantness SRUp summation ratio for unpleasantness VT vibration threshold PT pressure threshold QST quantitative sensory testing DFNS German Research Network on Neuropathic Pain.
Introduction
The trigeminal nerve is susceptible to a number of factors that could result in its injury. Such factors are, for example, infection, pathology and iatrogenic consequences, to name a few (1). The latter is commonly associated with dental surgical procedures that may include lower third molar removal, implant placement and endodontics (2). With the vast structures that the trigeminal nerve innervates in the orofacial region (3,4), it is not surprising that the resultant effects from injury impact on an individual’s quality of life (5).
To diagnose a trigeminal nerve injury, access to an armamentarium of assessment techniques is possible (6–8). Specific attention has been paid to one technique, termed Quantitative Sensory Testing (QST), which utilises a reliable protocol devised by the German Research Network on Neuropathic Pain (DFNS) (9,10). Furthermore, adaptations to this protocol have been devised and validated to allow assessment of manifestations of trigeminal injury (11,12). However, the investigatory techniques focus on changes in sensitivity to mechanical and thermal stimuli, with particular emphasis on thresholds for detection and pain in order to test the function of the majority of peripheral afferent fibre types
For an even more complete overview of somatosensory function in the orofacial region, the adapted QST protocols were a recent development that included assessment of sensations of pleasantness and unpleasantness (13). These were also based on modified versions of the DFNS protocol (9), and included standardised instructions. The justification for why such perceptions should be considered essential was firstly the discovery of the C-Tactile afferent. This is an unmyelinated, low threshold C fibre afferent that has been linked to the sensation of pleasant touch (14), which is not specifically included in the DFNS protocol (9). Secondly, it has been argued that unpleasantness should be treated as a separate dimension from the pain experience (15). Interestingly, some of the standardised QST stimuli may be perceived as both pleasant and unpleasant at the same time in healthy volunteers (13). This is important to take into account when interpreting findings in clinical populations. With the inclusion of assessment of these perceptions, it is hoped that the multidimensional perception of stimuli can be better understood, potentially providing for a more refined diagnosis and treatment strategy.
A common method utilised to investigate pleasantness is to deliver dynamic brush strokes at velocities including, but not limited to, 0.3 cm/sec, 1 cm/sec, 3 cm/sec, 10 cm/sec and 30 cm/sec (for review see Taneja et al. (16)), with velocities of 1–10 cm/sec known to be CT favourable (14,17). However, to the authors’ knowledge, the reliability of the response to delivering these stimulations is unknown.
Reliability has been described to be an important scientific property, having been extensively tested for QST protocols for the face and upper and lower limbs (10,12). Yet there are no studies evaluating the reliability of the recently developed protocols investigating pleasantness and unpleasantness, a fundamental step if they are to be considered for regular practice.
The aim of the present study was to evaluate the intra-examiner (test-retest) and inter-examiner reliability for orofacial QST of both the recently developed pleasantness and unpleasantness protocols (13). The hypotheses were that inter and intra-examiner reliabilities of the pleasantness and unpleasantness protocol are acceptable, and that brush strokes delivered at CT favourable velocities will be perceived as most pleasant.
Materials and methods
Participants
Sixteen healthy participants, 11 women and five men (mean age = 24; range 21–26 years) were recruited by local posters at Aarhus Dental School. The participants identified their ethnicity as Caucasian. They were compensated 100 DKK per hour, with testing lasting approximately 3 hours. Participants had no prior knowledge of any QST techniques.
The exclusion criteria consisted of any orofacial pain conditions, undergoing dental treatment at the time of participation, neurological diseases/disorders, pregnancy, liver or kidney disease, current use of analgesic medication, or any psychiatric disease. The study was performed in accordance with the Helsinki Declaration II, and approved by the Scientific Ethics Committees and Research Projects, Central Denmark Region (reference 1-10-72-312-16).
Participants were provided with information leaflets regarding the study and information on their rights as a research participant, at least 24 hours prior to their attendance. At the first appointment, verbal information was provided and any questions answered. Written consent was obtained before the commencement of the study.
Study design
The study was undertaken as a randomised prospective crossover observational study. Each protocol (pleasantness and unpleasantness) was performed as described in Taneja et al. (13). The full tests were performed on the skin of the right mental region, innervated by the mandibular branch (V3) of the trigeminal nerve. The testing lasted approximately 30 minutes for each protocol and therefore a total time of 1 hour per examiner.
Two examiners (CKH and CJS) performed the tests and were trained in the pleasantness and unpleasantness examination protocols by PT, over a period of two days. Each participant was examined twice on the same day by the different examiners (inter-examiner reliability), with a 1 hour waiting period between each examination. Half of the participants were tested first by one examiner, and the other half were tested first by the second examiner. At least eight days after the first attendance, the same examiner (CKH) repeated the tests again (intra-examiner reliability). The examiners were blinded to each other’s and their own test results.
During each examination, verbal instructions were provided to patients in English and based on those provided by the DFNS protocol (9), having been modified slightly for pleasantness and unpleasantness (13).
Test procedure
Tests were performed in a quiet room with the participants lying horizontal on a dental chair. Participants were requested to turn their head to the left so that the right side of the face was easily accessible. They were asked to keep their eyes closed during the entirety of the experiment. The full pleasantness and unpleasantness protocols were performed.
Pleasantness and unpleasantness ratings
Participants rated the magnitude of pleasantness and unpleasantness on two separate 0–100 numerical rating scales with the anchor points: Pleasantness, 0 (no pleasantness of any kind) to 100 (the most pleasant sensation imaginable) and unpleasantness, 0 (no unpleasantness of any kind) to 100 (the most unpleasant sensation imaginable) (13).
Test stimuli
A standardised battery of QST was undertaken to investigate somatosensory function related to sensitivity to pleasantness and unpleasantness, comprising both mechanical and thermal testing procedures. The following text describes the QST protocol for pleasantness where, unless stated otherwise, the instructions and tests were similar for the unpleasantness protocol (but simply changing the verbal instructions). For a full explanation of the tests with instructions see Taneja et al. (13).
Thermal pleasantness thresholds and thermal sensory limen (TSL) for pleasantness
Thermal thresholds were determined using the Medoc Pathway (Medoc, Israel) device with a square cutaneous thermode (contact area of 30 × 30 mm, baseline temperature of 32°C and ramp of 1°C/sec to limits of 0°C or 50°C) was used for both QST protocols (13). First, the cold threshold (CT) and heat threshold (HT) were determined. Following this, the TSL for pleasantness consisted of investigating alternating pleasant heat and cold sensations (13). At the same time participants were instructed to indicate whether the perceived pleasant sensation was from heat or cold. If any perceived pleasant heat sensations to a cold stimulation, then this was recorded as a paradoxical heat pleasantness sensation (13). In the instance that no pleasant sensation was determined, participants could press a button that would discontinue the test and state that this was the reason why. A missing value was then recorded. Threshold measurements were repeated three times and an average taken (13).
Mechanical pleasantness detection threshold
A standardised set of von Frey filaments (OptiHair2, MARSTOCKnervest, Marburg, Germany) were utilised for detection thresholds (9,11–13,18). A total of 12 filaments were available, allowing for differing forces to be assessed. Starting at a force of 0.25 mN, each consecutive monofilament was double the force of its predecessor to a maximum of 512 mN (11–13,18,19). The filaments were pressed perpendicular to the cutaneous site until bending was achieved, at which point contact remained for 1 to 2 seconds (9,11–13,19). Pleasantness threshold determinations were made by a series of alternating ascending and descending forces providing five suprathreshold pleasantness and five subthreshold pleasantness estimates (12,13,19). A single threshold value was calculated from the geometric mean of 10 determinations (9,12,13,19).
Mechanical pinprick unpleasantness threshold
The mechanical pinprick unpleasantness threshold was determined by the use of seven custom made pinprick stimulators (The PinPrick®, Johannes Gutenberg University of Mainz, Mainz, Germany). The forces of each PinPrick ranged from 8 to 512 mN (9,11–13,18) with a flattened contact area (0.2 mm in diameter). A contact time of 2 seconds for each PinPrick was utilised and the same ascending-descending technique was applied as for the mechanical pleasantness detection threshold. Ten estimates were used to determine the geometric mean (13).
As these stimuli are adequate for cutaneous nociceptor activation, scores for pleasantness were not examined in this test.
Stimulus response (SR) function: Mechanical pleasantness sensitivity and pleasantness evoked by dynamic mechanical stimulation (DMS)
The SR function utilised stimuli applied in a pseudorandomised order for the investigation of the mechanical pleasantness sensitivity and the pleasantness evoked by dynamic mechanical stimulation. This approach was taken as in the SR function investigating pain as per the DFNS protocol (9,11–13,18). Mechanical sensitivity (MS) for pleasantness used the same weighted pinpricks as for the mechanical pinprick unpleasantness threshold, whereas three tactile stimulators: A cotton wool wisp (CW), cotton wool tip (QT) and a brush (9,13), were used for pleasantness evoked by dynamic mechanical stimulation (DMS). A single lateral stroke was delivered to the desired region (velocity not controlled (9,13). Pleasantness ratings were determined for 15 tactile and 35 pinprick (total = 50) stimuli. The mechanical pleasantness sensitivity and the pleasantness evoked by dynamic mechanical stimulation were calculated as the geometric mean from all of the pleasantness ratings across the stimuli (13).
Summation ratio for pleasantness (SRPl)
A repeated brush stroke was utilised to determine the summation ratio for pleasantness (13). Participants provided a score (0–100, NRS) for a single stroke, followed by a score for 10 repetitive strokes (in a single medial to lateral direction) at a rate of 1 Hz. The rate was maintained by an audio cue from a metronome (MA-30 Digital metronome, KORG, Tokyo, Japan). The test was repeated three times with the average used for analysis (13).
Summation ratio for unpleasantness (SRUp)
In the summation ratio for unpleasantness, the single and repeated stimuli were delivered in the same manner as for the summation ratio for pleasantness; however, using the 128 mN PinPrick (13). If eliciting an unpleasantness score of 0, a higher pinprick force was selected and the test repeated. The test was repeated three times with an average taken (13).
Vibration threshold (VT) for pleasantness
The VT for pleasantness was assessed using a Rydel-Seiffer graded tuning fork (64 Hz, 8/8 scale). Vibration was initiated and the participant indicated as soon as any pleasantness was noticed (initiation) and then when the pleasant sensation was no longer felt (disappearance and the determined threshold) (13). In all protocols, a missing value was recorded if no pleasantness/unpleasantness was felt. The test was repeated three times and an average taken (13).
Pressure pleasantness threshold
An electronic pressure algometer (SOMEDIC Algometer, SOMEDIC sales AB, Sweden) with a probe diameter of 1 cm2 was used for this test (13). The pressure pleasantness threshold was determined from a series of three ascending stimulus intensities (50 KPa/s), which was stopped at the first pleasant sensation (13). The same action was performed if the pressure was becoming uncomfortable and a missing value was recorded. The threshold was the average from the three tests (13).
Dynamic tactile stimulation using a goat-hair brush test (GHB)
An add on to the adapted QST protocols for pleasantness and unpleasantness was the dynamic stimulation with the GHB (13,14,20). This included stroking at a constant force of 0.4 N at five randomised velocities of 0.3, 1, 3, 10 and 30 cm/sec (20). The brush strokes were delivered by a robot (rotary tactile stimulator (RTS), Dancer Design, St Helens, UK), which was first calibrated prior to the test. This consisted of repeated strokes to the region to allow the robot to determine the position required to exert the required force and velocity. An interstimulus interval of 30 sec was selected to avoid fatigue of the CT afferents (21–23). The velocities were repeated four times with an average score taken for each (13).
Statistics
The sample size was determined by the method developed by Walter for reliability studies (24). The minimally defined level of acceptability was determined as ρ0 = 0.6 (H0), and the expected level of reliability ρ1 = 0.9 (H1), with an α = 0.05 and β = 0.20 (implying a power of 80%), n = 2 (intra-examiner), and n = 2 (inter-examiner), the sample size was estimated as 12. Therefore, to ensure sufficient power, a sample size of 16 was selected.
All results are presented as mean ± standard error of the mean (SEM) unless otherwise stated, calculated from the average of individual participant data. If a participant was not able to experience the desired perception in the parameters that did not utilise an NRS, then they were excluded from the group mean calculation.
Intra- and inter-examiner reliabilities were calculated using the intraclass correlation coefficient (ICC) with an ICC agreement of <0.4 considered as poor, 0.4–0.59 fair, 0.6–0.75 good and >0.75 excellent (25).
The intra-individual mean variation was calculated to identify the size of the difference between observations. This would highlight if the difference between examinations was of clinical relevance (12). The mean variation for intra-examiner observations were calculated by subtracting the QST data of the second assessment from the first assessment, for each protocol. The inter-examiner mean variation was calculated by subtracting the QST data of the second examiner from the first assessment by the first examiner.
Two-way repeated measures ANOVAs were performed, on the means of individual participant data from the dynamic tactile stimulation test using a goat-hair brush, between session and velocity for both pleasantness and unpleasantness ratings. Parametric model validation was achieved via Q-Q plots. Statistical significance was identified to p < 0.05, with a Bonferroni correction applied to account for multiple comparisons.
Results
Absolute values
All participants completed both pleasantness and unpleasantness protocols. Tables 1 and 2 list the mean and SEMs for the tests undertaken in both pleasantness and unpleasantness QST protocols respectively. The mean thermal detection thresholds (CT and HT) and TSL for pleasantness were closer to the baseline temperature (32°C) compared to the thermal detection thresholds and TSL for unpleasantness. Paradoxical heat pleasantness/unpleasantness sensations were not experienced by any of the participants.
Absolute mean ± SEM values, with the number of participants that provided a score, for all pleasantness QST parameters from the two examiners at each assessment.

aDifferences from baseline temperature.
CT: cold detection threshold; HT: heat threshold; TSL: thermal sensory limen; MT: mechanical threshold; MS: mechanical sensitivity; DMS: dynamic mechanical stimulation; SRPl: summation ratio for pleasantness; VT: vibration threshold; PT: pressure threshold; GHB: goat-hair brush; mN: millinewton; NRS: numerical rating scale; kPa: kilopascal.
Absolute mean ± SEM values, with the number of participants that provided a score, for all unpleasantness QST parameters from the two examiners at each assessment.
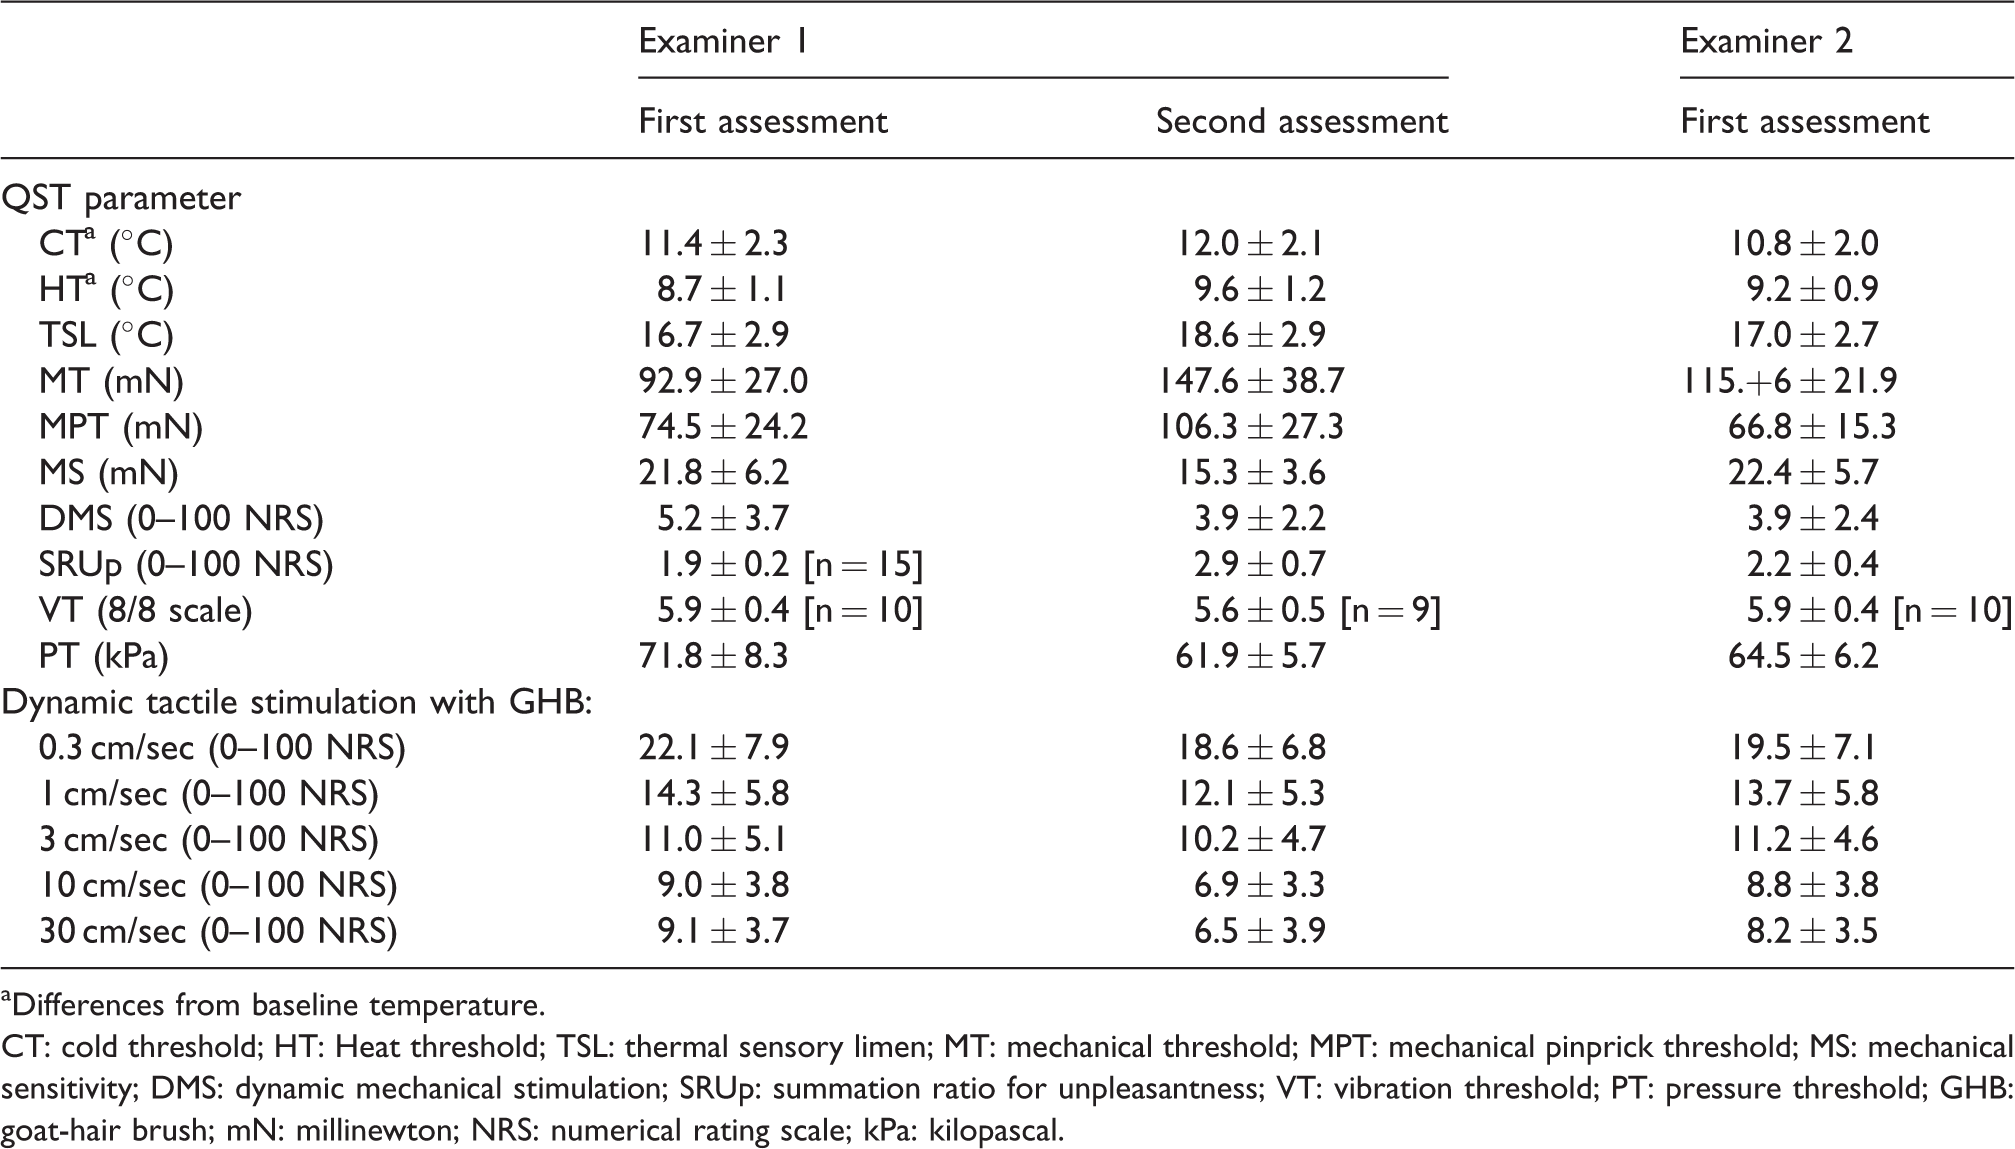
aDifferences from baseline temperature.
CT: cold threshold; HT: Heat threshold; TSL: thermal sensory limen; MT: mechanical threshold; MPT: mechanical pinprick threshold; MS: mechanical sensitivity; DMS: dynamic mechanical stimulation; SRUp: summation ratio for unpleasantness; VT: vibration threshold; PT: pressure threshold; GHB: goat-hair brush; mN: millinewton; NRS: numerical rating scale; kPa: kilopascal.
The mean mechanical threshold force required (MT) to elicit an unpleasant sensation was approximately five times higher than the mean force to detect pleasantness. In general, the perception of pleasantness was experienced at temperatures closer to baseline (CT, HT and TSL) or at lower stimulus intensities than that for unpleasantness (MT, MS and VT).
The mechanical sensitivity (MS) identified higher 0–100 NRS mean scores for unpleasantness compared to those for pleasantness. The converse was found for the dynamic mechanical stimulation (DMS) component and for the dynamic tactile stimulation using the goat-hair brush (GHB), with higher 0–100 NRS mean scores for pleasantness than for unpleasantness.
Dynamic tactile stimulation with the GHB
A significant effect of stroking velocity on the mean pleasantness ratings was found (p < 0.001). Post hoc analysis found that the mean pleasantness ratings at stroking velocities of 1 cm/sec, 3 cm/sec and 10cm/sec were significantly higher compared to the mean ratings for 0.3 cm/sec (p < 0.039), Figure 1. There was no significant difference between mean pleasantness ratings when stroking at 0.3 cm/sec and 30 cm/sec (p = 0.082).

Mean (±SEM) 0–100 NRS ratings for pleasantness and unpleasantness when stroked at different velocities utilizing the goat-hair brush.
There were, on average, 7–8 participants that experienced an unpleasant sensation when stroked at the velocities tested. A significant effect of stroking velocity on the mean unpleasantness ratings was found (p = 0.001). Post hoc analysis found that mean unpleasantness ratings were significantly lower when participants were stroked at velocities of 3 cm/sec, 10 cm/sec and 30 cm/sec compared to 0.3 cm/sec (p < 0.044). There was no significant difference in mean unpleasantness ratings between stroking at 0.3cm/s and 1 cm/sec (p = 0.359).
Intra-examiner reliability
The interval between the first and second assessment (intra-examiner) ranged from 8–26 days (mean = 13.8 days). In general, the intra-examiner ICCs for the pleasantness QST protocol ranged from good to excellent, with one parameter obtaining a fair score (CT) and two parameters scoring a poor ICC (MT and SRPl), see Table 3. Similarly, the ICC for the majority of parameters in the unpleasantness protocol ranged from good to excellent, with a poor and fair score obtained by only one parameter each (SRUp and MS, respectively).
Intra and inter examiner reliability (ICC) for QST parameters from pleasantness and unpleasantness protocols.

Note: ICC < 0.4 considered as poor reliability, 0.4–0.59 fair, 0.6–0.75 good and excellent > 0.75. MPT was not assessed in the QST protocol for pleasantness.
CT: cold threshold, HT: Heat threshold, TSL: thermal sensory limen, MT: mechanical threshold, MPT: mechanical pinprick threshold, MS: mechanical sensitivity, DMS: dynamic mechanical stimulation, SRPl: summation ratio for pleasantness, VT: vibration threshold, PT: pressure threshold.
Inter-examiner reliability
The ICCs calculated for the pleasantness protocol identified all but one parameter (PT: ICC = 0.51) to have good to excellent scores. There were two parameters scored with ICCs as poor (SRUp) and fair (MT) in the unpleasantness protocol, with all other parameters ranging between good and excellent.
The mean difference between each parameter from intra and inter-individual observations is provided in Table 4. This allows the size of the difference between each parameter to be determined and conveys if it is clinically relevant.
Absolute mean ± SEM intra-individual difference for each QST parameter between intra and inter-examiner assessments.

Note: Mean differences are displayed as absolute values. Shaded cells indicate those with a poor ICC score, which do not always indicate a clinically relevant difference between assessments.
Black cells represent parameters not investigated within the pleasantness protocol.
CT: cold threshold; HT: heat threshold; TSL: thermal sensory limen; MT: mechanical threshold; MPT: mechanical pinprick threshold; MS: mechanical sensitivity; DMS: dynamic mechanical stimulation; SRPl: summation ratio for pleasantness; SRUp: summation ratio for unpleasantness; VT: vibration threshold; PT: pressure threshold; GHB: goat-hair brush; mN: millinewton, NRS: numerical rating scale; kPa: kilopascal.
Discussion
The present study is the first to investigate the reliability of the QST protocols investigating pleasantness and unpleasantness (13), based from the DFNS protocol (9). The main findings were that the majority of values of intra- (pleasantness: 11/14, unpleasantness: 13/15) and inter-examiner (pleasantness: 13/14, unpleasantness: 13/15) reliability, in both protocols, were good to excellent. With specific reference to the dynamic tactile stimulation test using a GHB, reliability was also determined as good to excellent for all tested velocities. This signifies that the protocols are feasible and reproducible for investigating the elicited perceptions of pleasantness and unpleasantness in the orofacial region.
In accordance with previous results (13), the present study identified the large SEMs in determining pleasantness and unpleasantness from mechanical stimuli compared to thermal stimuli. In addition, the DMA and dynamic tactile stimulation with GHB tests had higher mean NRS scores for pleasantness compared to unpleasantness. However, all included tests resulted in participants providing scores for each perception investigated, further reinforcing that stimuli are able to provide a multidimensional perception, and such information can be limited in studies that only provide combined single rating scales; that is, ranging from unpleasant to pleasant (14,20,21).
As the QST protocol for pleasantness and unpleasantness have recently been described in the literature (13), there is a dearth of normative data available on these perceptions elicited from the majority of stimuli utilised. Although the present study did not investigate normative values, the large variation in each protocol for several parameters highlights the difficulty in generalising the data to an individual in eliciting the desired perception.
Reliability scores (ICCs) for the cold threshold (CT) for pleasantness and unpleasantness ranged from fair to good, and for the heat threshold (HT) ranged from good to excellent. This is an interesting observation, as other studies investigating the reliability of QST (based from the DFNS protocol) on the skin of the face report ICCs as poor to fair for the cold detection threshold (ICC = 0.27 and 0.45) and poor for the warm detection threshold (ICC = 0.14 and 0.30) (12). This suggests that detecting the perceptions of pleasantness and unpleasantness to thermal stimuli is more reliable compared to simply detecting a thermal stimulus.
The reliability of mechanical thresholds (MTs) ranged from poor to good for pleasantness and fair to good for unpleasantness. The intra-individual variation when investigating MT for pleasantness found an approximate 5–6 mN difference between examinations, which could be considered clinically relevant as filaments start at 0.25 mN and increase at increments of small forces (13). Thresholds for CT activation via indentation using von Frey hairs have been reported to be in the range of 0.3–3 mN (22,26); however, both Taneja et al. (13) and the present study found that pleasantness was detected at forces within the range for activation of C nociceptors (27), suggesting that pleasantness was not purely driven by the CT afferent system. Due attention to the focal application of a von Frey filament should be considered, whereby it may fail to contact the most sensitive region of the CT receptive field and miss the true minimal force required for activation (28). The wide standard error for the MT for unpleasantness (range = 21.9–38.7 mN) also suggests that attempting to identify a threshold for unpleasantness by blunt indentation greatly varied between participants. Hence, in general, using local indentation in the method of limits varied between participants in determining the MT for pleasantness and unpleasantness, therefore impacting on the ICCs, a similar finding and justification to the MT detected on the face by Pigg et al. (12).
The mechanical pinprick threshold (MPT) was only investigated in the unpleasantness protocol, with a good reliability identified. This would be expected as the pinprick stimuli are likely to evoke a painful response, particularly at increasing forces, which by definition is an “unpleasant sensory and emotional experience” (29).
The reliability for mechanical pleasantness sensitivity was found to be excellent and for mechanical unpleasantness sensitivity was found to range from fair to good. Reliability scores for dynamic mechanical stimulation (DMS) were good to excellent when investigating for pleasantness and excellent for unpleasantness. This finding is likely by virtue of activation of the CT afferent system, whereby delivering a dynamic stroke to healthy individuals has been found to elicit a pleasant sensation (14), therefore implying that the latter test is acceptable to measure pleasantness and low-level unpleasantness.
The summation ratio for pleasantness reliability ranged from poor to excellent, indicating inconclusive results. Furthermore, reliability was poor for the summation ratio for unpleasantness. This may have resulted from inadequate systematic variance arising from similar scores between individuals (10,12). As these ratios in the DFNS protocol are used to determine wind-up of pain and central sensitisation (9), the modified methods utilised in this test for pleasantness and unpleasantness may not be suitable.
The reliability scores for VT for pleasantness and unpleasantness were found to be excellent and good respectively. However, not all participants were able to associate a pleasant or unpleasant sensation to vibration, an observation previously described (13). Such a stimulus has been associated with activation of Aβ fibres and lacking of any affective quality (30), possibly accounting for the lack of participants that experienced the required perception.
The pressure threshold reliability scores ranged from fair to good for the pleasantness protocol and good to excellent in the unpleasantness protocol. Pleasantness was determined at lower force levels (range = 21.4 ± 4.0 kPa to 28.9 ± 5.5 kPa) and unpleasantness at higher force levels (range = 61.9 ± 5.7 kPa and 71.8 ± 8.3 kPa). Furthermore, there were fewer participants that experienced a pleasant sensation to a pressure stimulus compared to an unpleasant one (mean of all assessments = 12 and 16 participants, respectively).
Studies that have utilised the technique of microneurography have identified that the optimal velocity for activation of CT afferents is 1–10 cm/sec, providing peak pleasantness ratings within this range (14,21). The present study was able to determine significantly higher pleasantness ratings when participants were stroked at the velocities of 1 cm/sec, 3 cm/sec and 10 cm/sec compared to a velocity outside the optimum CT range (0.3 cm/sec). This association was not found in the study by Taneja et al. (13), potentially as a result of the different region of the face tested. However, the normative data in the DFNS QST protocol are not necessarily specific to the region, whereby QST data from the hand and foot have been utilised to represent for data of the upper and lower body, respectively (31). This in itself may constitute a limitation of the DFNS protocol for QST (32).
Limitations associated with the present study are the unequal gender distribution and narrow age range of included participants, limiting generalisability to the older population. Furthermore, differences in side-to-side comparisons of QST have been found in the trigeminal region (12). It would be reasonable to perform studies for the protocols of pleasantness and unpleasantness to provide normative data for side-to-side differences in a healthy population, which could then be used as a reference group when comparing with patients (19,31).
The authors understand that including assessment of pleasantness and unpleasantness will add to the time already spent undertaking QST examinations on patients. Therefore, further evaluation of different patient cases would need to be undertaken to identify which would benefit most from the information obtained against the extended evaluation time.
The present study had not defined specific forms of pain, pleasantness and unpleasantness, but investigated such sensations as perceived by the healthy participants, with normal somatosensory function. Therefore, these perceptions have been determined under experimental conditions and may differ from those experienced by patients.
The present study may have been further strengthened by the utilisation of more examiners and test repetitions for evaluating the inter examiner reliability scores. However, as several other reliability studies have used a similar methodology (10,12,19), the authors felt that the results obtained would be sufficient to evaluate the reliability of the pleasantness and unpleasantness protocols.
Conclusion
The majority of parameters from the recently developed protocols to assess pleasantness and unpleasantness provided good to excellent reliability, indicating the methods described are adequate for investigating such perceptions in the orofacial region. However, the summation ratio for pleasantness and unpleasantness resulted in low reliability scores, suggesting that this test was not suitable for measuring such perceptions. Utilising the RTS to deliver brush strokes at differing velocities provided good to excellent reliability values and identified that stroking the face at CT-optimal velocities was rated significantly more pleasant than slower velocities, supporting CT afferent literature. It would now be prudent to apply the protocols to patient populations with changes in trigeminal somatosensory function to better understand if a more refined diagnosis and treatment strategy could be elucidated by adding assessment of pleasantness and unpleasantness to standardised somatosensory stimuli. Furthermore, future research should include the evaluation of the value of the information obtained from the use of these QST protocols in patient populations, in order for them to be accepted into specialist clinical practice.
Clinical implications
Investigating perceptions of pleasantness and unpleasantness provides a more complete overview of somatosensory function. The protocols to investigate perceptions of pleasantness and unpleasantness have good to excellent reliability for the majority of QST parameters investigated. The investigation of such perceptions potentially provides for a more refined diagnosis and refined treatment strategy in conditions effecting the orofacial region.
Footnotes
Acknowledgements
PT recruited participants for the study, performed all of the sensory testing, performed data entry and data analysis, wrote the manuscript, discussed the results and commented on the manuscript. HO, MT and PS provided feedback on the design of the study, discussed the results and commented on the manuscript. LV provided feedback on the design of the study, in particular with the selection of questionnaires. LBH conceived the idea of the study and designed the study, contributed to the analysis of data and writing of the manuscript, discussed the results and commented on the manuscript.
Declaration of conflicting interests
The authors declared no potential conflicts of interest with respect to the research, authorship, and/or publication of this article.
Funding
The authors disclosed receipt of the following financial support for the research, authorship, and/or publication of this article: This work was supported by the Aarhus University Research Foundation and the Danish Dental Association.