
Abstract
Objectives
Sarcoma family kinase activity is associated with multiple diseases including ischemia and cancer; however, its role in the mechanism of migraine aura has been less well characterised. This study aims to investigate whether sarcoma family kinase is required for cortical spreading depression.
Methods
Cortical spreading depression was induced by topical application of K+ to the cerebral cortex and was monitored using electrophysiology in rats, and intrinsic optical signal in mouse brain slices. Drugs were perfused into the contralateral cerebral ventricle for pharmacological manipulations in rats. Western blot analysis was used for detecting the level of phosphorylated, and total, sarcoma family kinase in the ipsilateral cortex of rats.
Key results
The data demonstrate that a single cortical spreading depression in rats induced ipsilateral cortical sarcoma family kinase phosphorylation at the Y416 site. Deactivation of sarcoma family kinase by its inhibitor (3-(4-chlorophenyl) 1-(1,1-dimethylethyl)-1H-pyrazolo[3,4-dpyrimidin-4-amine) suppressed the elevated enzyme activity and cortical susceptibility to cortical spreading depression. Interestingly, the inhibitory effect of the N-methyl-D-aspartate receptor antagonist NVP-AAM077 on cortical spreading depression was reversed by the sarcoma family kinase activator pYEEI (EPQY(PO3H2)EEEIPIYL), suggesting a link between this enzyme and N-methyl-D-aspartate receptors. Similarly, after deactivation of sarcoma family kinase, a reduction of sarcoma family kinase phosphorylation and cortical susceptibility to cortical spreading depression was observed with NVP-AAM077.
Conclusions
We conclude that activation of sarcoma family kinase is required for cortical spreading depression, and this process is regulated by recruiting N-methyl-D-aspartate receptors. This study provides novel insight for sarcoma family kinase function in the mechanism of migraine aura.
Introduction
Sarcoma family kinases (SFK) are a family of non-receptor protein tyrosine kinases. Five members of SFK are expressed in the mammalian central nervous system: Src, Fyn, Yes, Lck and Lyn (1). SFK phosphorylation acts as a regulatory hub converging multiple intracellular signaling cascades and membrane proteins including N-methyl-D-aspartate (NMDA) and neuronal purinergic P2X7 receptors (2–6). SFK is associated with multiple diseases including neuropathic pain (7), stroke (2) and cancer (8). A recent study shows that a SFK selective inhibitor, 3-(4-chlorophenyl) 1-(1,1-dimethylethyl)-1H-pyrazolo[3,4-d]pyrimidin-4-amine (PP2), reduces the frequency of multiple cortical spreading depression (CSD) in mice. However whether the SFK activity is involved in a single CSD, the putative underlying mechanism of migraine with aura (9) has not been elucidated.
The link between SFK and NMDA receptors is well documented. SFK can couple to the NMDA receptor, forming a complex in a rat stroke model (4), and the activated SFK and NMDA receptor interaction is thought to be via the adapter protein, NADH dehydrogenase subunit 2 (ND2) (10). During anoxia/ischemia, SFK can be recruited by the activation of the NMDA receptor, leading to the opening of the neuronal hemi-channel pannexin 1 (Panx1) (2); this correlates with the fact that Panx1 channels can be opened after CSD induction in mice (11). It was reported that NMDA receptor coupling with Src and the sustained neuronal depolarization during ischemia can be suppressed by the competitive NMDA receptor antagonist, (2R)-amino-5-phosphonopentanoate acting on the ligand-binding site for glutamate (4). Given that competitive antagonists targeting the NMDA receptor NR2 major subunit suppress CSD genesis and propagation (12–14), NR2A and NR2B may be key subunits of the receptor involved in any potential SFK activity in CSD.
In this report, we have investigated whether cortical SFK can be activated by a single CSD in rats. We subsequently examined whether deactivation of SFK phosphorylation reduces the likelihood of CSD occurrence and if it correlates with a reduction of SFK phosphorylation. To complement that model, we investigated a functional link between SFK activity and NMDA receptors during CSD. We reason that SFK phosphorylation, if it occurred, would likely be increased after CSD, which in turn is required for CSD propagation. SFK signaling during CSD is regulated, at least in part, by activation of NMDA receptors.
Materials and methods
Animals
A total of 34 adult male Sprague Dawley rats (328.1 ± 30.8 g, mean ± SD) and 20 adult male C57BL6 mice (21.4 ± 1.5 g, mean ± SD) were purchased from Shanghai SLAC Laboratory Animal Corporation Ltd. The sample size of animals was estimated based on previous studies on cortical spreading depression susceptibility. Animals were housed in the Experimental Animal Centre of Soochow University under agreement with Xi’an Jiaotong-Liverpool University (XJTLU) for at least 1 week with food and water available ad libitum before use. Animal procedures were approved by the Ethical Review Panels of Soochow University and performed during the light phase of the cycle in accordance with relevant national and provincial guidelines.
In vivo experiment
Animal surgery and CSD induction
Rats were anaesthetized with isoflurane (5% for induction, 2.5-3.5% during surgery, 1–1.5% for maintenance) in O2:N2O, with the animal breathing spontaneously as previously reported (14). The depth of anesthesia was monitored and adjusted through examination of the electroencephalogram (EEG) signal and by absence of whisker movements and lack of reaction to brief tail pinches. Rectal temperature of animals was maintained at 37℃.
Three burr holes were drilled in the parietal bone. One of these burr holes (1 mm, i.d, coordinates: 0.8 mm posterior and 1.8 mm lateral to bregma) was drilled in the left side, which was used for implanting a stainless steel cannula (0.38 mm i.d, RWD Life Science) into the intracerebral ventricle (i.c.v., 3.5 mm deep from the cortical surface) which was used for drug perfusion (Figure 1(a)). The other two burr holes were drilled in the right side (Figure 1(a)): The posterior one (1 mm, i.d, coordinates: 5 mm posterior and 2 mm lateral to bregma) with dura intact for CSD induction; and the anterior one (0.8 mm, i.d, coordinates: 3 mm anterior and 2 mm lateral to bregma) was used for the implantation (0.9 mm deep from the cortical surface) of an Ag/AgCl electrode (0.1 mm, i.d, Applied Neuroscience). The EEG and direct current (DC) potential were derived between the Ag/AgCl electrode and a reference electrode placed under the scalp. The subsequent experimental procedure was carried out after at least one hour of stabilization.
Effects of the NMDA receptor antagonist, NVP, perfused into contralateral ventricle on CSD in rats. (a). CSD was induced by topical application of 1 µl of 3 M KCl for 5 minutes onto cortex with dura intact via the posterior burr hole on the right parietal bone. The ipsilateral anterior hole was used for CSD recording. NVP (i) or ACSF (ii) was perfused through a cannula implanted in the contralateral ventricle (i.c.v.) at 120 minutes prior to CSD induction. In the sham group (iii), only ACSF was perfused in the absence of KCl application as the control. The whole ipsilateral cortical tissue was subsequently used for detecting SFK activity after the in vivo experiment. (b). A representative trace showing CSD propagation wave after i.c.v. perfusion of ACSF. CSD magnitude (mV × minute, dashed area) and latency (L, minute) were used for quantifying CSD. The effect of 0.3 nmol NVP on CSD magnitude are shown in panel (c) and latency in panel (d). All the values shown are median (range). *p < 0.05, **p < 0.01, Mann-Whitney test with one-tailed calculation was used for comparison of ACSF and NVP groups.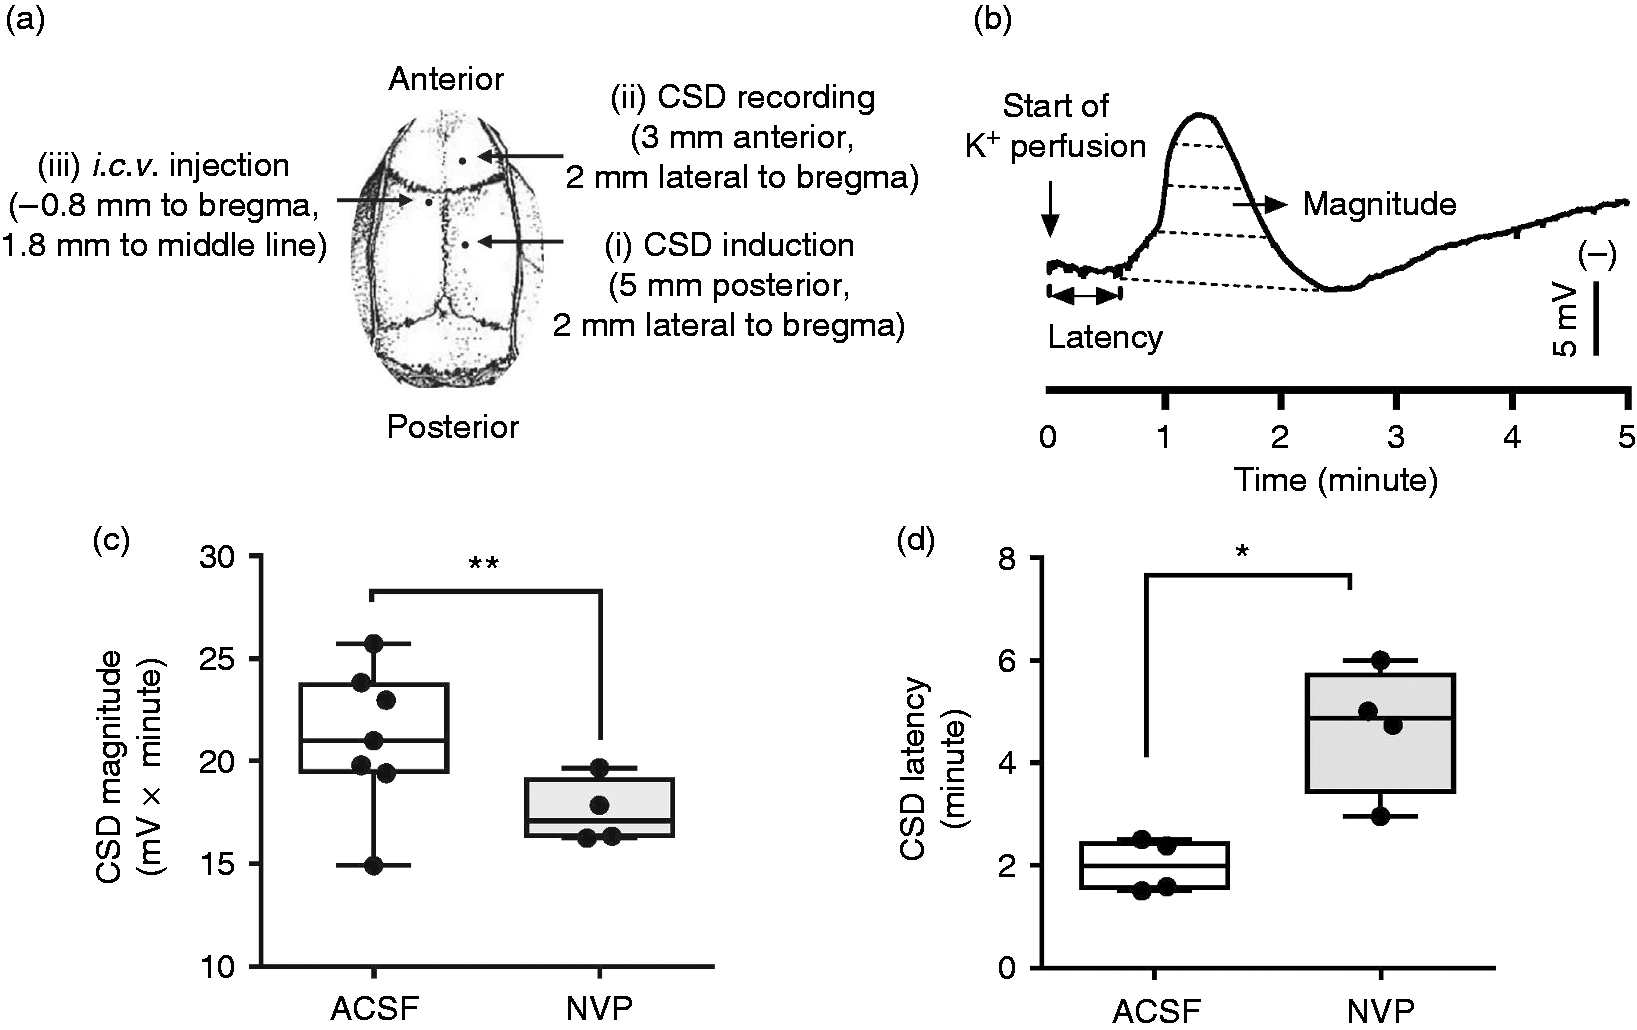
As described previously (14), a single CSD was induced by topical application of 1 µl of 3 M KCl (Sigma-Aldrich) for 5 minutes, although occasionally two CSD waves were observed. After CSD induction, KCl was quickly replaced by artificial cerebrospinal fluid (ACSF) (composition in mM: 2.5 NaCl, 250 KCl, 1.18 MgCl2, 1.26 CaCl2; pH 7.3 adjusted with 1 M NaOH, not buffered) for 5 minutes to enable CSD propagating across the ipsilateral cortex (14).
Recording of EEG and extracellular DC potential
As reported previously (14), EEG and DC signals were amplified using an AC/DC pre-amplifier (NL834, Digitimer Ltd). The alternating current component in 1–30 Hz provided the EEG (×5000 overall amplification) (15). The DC component in 0–30 Hz provided the DC potential (×250 overall amplification). All the recorded variables were continuously displayed and recorded by Labview 11.0 (NI Instruments) during the experiment. The spreading depolarization wave of CSD was recognized as a transient negative shift (Figure 1(b)), demonstrating successful CSD induction.
In vivo experimental design
Series 1: Our previous study shows that the NR2A-preferring NMDA receptor antagonist, NVP-AAM077 (NVP), perfused through microdialysis probes suppresses CSD in rats (14). In this study, we investigated whether the drug perfused i.c.v. also suppresses CSD and cortical SFK phosphorylation induced by CSD in rats. Three groups were designed: (i) the known anti-CSD drug, NVP (synthesized by Yi Li from XJTLU) (n = 5) with a total 0.3 nmol NVP applied. (ii) ACSF was used for both the CSD group (n = 7); and (iii) the sham group (n = 5).
Series 2: We examined whether CSD could induce SFK activation, and if so, whether the activation of SFK after CSD and the cortical susceptibility to CSD could be suppressed by SFK inhibition. Four groups were designed: (i) The SFK selective inhibitor, PP2 (#1407, Tocris) (16) with final 2.5 nmol used (n = 7); (ii) the negative control for PP2, PP3 (1-Phenyl-1H-pyrazolo[3,4-d]pyrimidin-4-amine, #2794, Tocris) with total 2.5 nmol used as the negative control (n = 7); (iii) ACSF was perfused for CSD group (n = 7) and (iv) sham group (n = 5) where no KCl was applied. In order to minimize animal use, both the CSD and sham groups from series 1 were also used in this series.
In the above two series, each drug or ACSF was perfused i.c.v. using a syringe pump (CMA100, CMA/Microdialysis) at 0.5 μl/minute for 10 minutes starting at 120 minutes before CSD induction. Rats in each group were immediately sacrificed as soon as CSD recordings were completed. Rat cortices were dissected for subsequent detection of levels of SKF phosphorylation in order to address whether CSD induced SFK phosphorylation, and if so, whether this elevation was altered with SFK or NMDA receptor inhibition.
Protein preparation
Ipsilateral cortices from rats were homogenized in the presence of protease inhibitor (04693116001, Roche) and phosphatase inhibitor (#5870, CST) for subsequent detection of SFK phosphorylation. Total protein was harvested from supernatant after tissue lysate was centrifuged at 13,000 rpm for 10 minutes at 4℃. Protein concentration was determined using Bicinchoninic Acid Protein Assay Kit (P0010, Beyotime).
Western blotting
Proteins were denatured with 4 × NuPAGE® LDS Sample Buffer (NP0007, Invitrogen) by boiling for 5 minutes, separated on a 10% sodium dodecyl sulfate–polyacrylamide gel and subsequently transferred onto nitrocellulose membranes. Non-specific binding of antibody was blocked with 5% milk in Tris-Buffered Saline with Tween-20 (TBST) for 1 hour at room temperature (RT).
The level of SFK (∼60 kDa) phosphorylation at Y416 amino acid (PY416 SFK), a strong indicator of SFK activation (17), and β-actin (∼45 kDa) as the reference under CSD condition (18) were detected using western blot analysis. Each membrane was cut into two parts horizontally, which were incubated with anti-PY416 monoclonal SFK antibody (anti-rabbit, #6943, CST, 1:500) and β-actin monoclonal antibody (anti-rabbit, #4970, CST, 1:1000) separately overnight at 4℃. Excess primary antibody was removed by TBST, membranes and the membranes incubated with horseradish peroxidase-labeled secondary antibody (AB10058, Sangon Biotech) at 1:5000 for 1 hour at RT. Proteins were detected by Western bright enhanced chemiluminescence working solution (K-12045-D50, Advansta). In order to further detect the level of total SFK (∼ 60 kDa), the anti-PY416 SFK antibody on the nitrocellulose membrane was stripped away using 0.2 M NaOH for 15 minutes at 37℃. The membrane was then washed using TBST and the same process repeated, starting from non-specific binding blocking except that anti-SFK monoclonal antibody (anti-rabbit, #2109, CST) at 1:1000 but not anti-PY416 SFK antibody was used. Protein expression level was subsequently quantified using ImageJ software, and data was normalized to β-actin for comparison.
In vitro experiment
Mouse brain slice preparation
The mouse brain slice model of CSD was established by referencing those reported previously in the mouse brain slice (19,20), rat brain slice (21) and chick retina (22) with modifications as below. Briefly, the mouse brain was removed and the cerebrum was cut along the midline and coronal sections (400 µm) were prepared using a vibratome (7000 smz-2, Campden, UK) with coordinates between 1 to 3 mm posterior to bregma, each containing somatosensory and visual cortices that are highly associated with migraine aura (9,23). Brain slices were quickly transferred into ice-cold oxygenated NMDG-HEPES cutting solution (24) with minor modifications to maintain osmolality around 300 mOsm and improve tissue survival time. Of these, HEPES was added into the modified cutting solution (composition in mM: 93 NMDG, 2.5 KCl, 1.2 NaH2PO4, 30 NaHCO3, 20 HEPES, 25 glucose, 5 L-ascorbic acid, 2 thiourea, 3 sodium pyruvate, 10 MgSO4, 0.5 CaCl2ċ2H2O; bubbled with 95% O2 and 5% CO2; pH 7.4) in order to prevent tissue edema (25). After 15 min stabilization at room temperature, brain slices were transferred into Kreb’s solution (composition in mM: 126 NaCl, 2.5 KCl, 2.4 CaCl2ċ2H2O, 1.3 MgCl2ċ6H2O, 18 NaHCO3, 1.2 NaH2PO4, 10 Glucose; bubbled with 95% O2 and 5% CO2; pH 7.4) and maintained for 80 minutes prior to carrying out further procedures. In order to reduce the animal use, at least two brain slices from each mouse were used and they were assigned to different experimental groups.
CSD induction and imaging of mouse cortical slice
Each brain slice was placed in a chamber and submerged in Kreb’s solution with a perfusion rate of 3 ml/minute using a peristaltic pump (Reglo ICC, Ismatec). Unless otherwise stated, CSD was induced in the somatosensory region by ejection of 33 µl of 260 mM KCl at 25 µl/minute using a syringe pump (CMA/400, CMA/ Microdialysis). The coronal slice was illuminated for 50 ms, starting when CSD was elicited, using a high-power LED spotlight (625 nm peak wavelength, SLS-0307-A, Mightex) driven by a computer-controlled power supply (LED controller, SLC-SA04-US, Mightex). For each KCl application, changes in the reflected intrinsic optical signal in each cortical slice were recorded for 15 minutes at 2 Hz with a charge-coupled device monochrome camera (Rolera-XR, ROL-XR-F-M-12, Qimaging) using Image Pro Plus software (IPP7; Media Cybernetics) (22). Camera exposure and illumination were synchronized using an external trigger (TG1006, TTI).
Intrinsic optical imaging of CSD was captured from each 1800-frame sequence, in which an area of interest (AOI) parallel to the CSD wave front was delineated manually in layers 4 to 6 of the somatosensory cortex that were distant from the site of KCl application. For each picture within the sequence, gray levels of the pixel constituting the AOI were corrected by subtracting the respective dark background. Changes in this value were plotted against time (i.e. 1800 data points over 15 minutes), providing the dynamic changes within the AOI. This signal is synchronous with the sudden cellular depolarization that characterizes the excitation phase of CSD (26).
In vitro experimental design
Series 3: In order to explore a functional link between SFK and NMDA receptor during CSD, we investigated whether the inhibitory effect of NVP on CSD could be altered by co-application of an SFK activator in the mouse brain slice. Four groups were designed: (i) Kreb’s control (n = 6); (ii) NVP, at 0.1 μM (n = 7); (iii) NVP and the SFK activator, pYEEI (27) (sequence: EPQY(PO3H2)EEEIPIYL, APeptide Ltd, China) at 0.3 μM (n = 7); and (iv) NVP and the negative analog of SFK activator, YEEI (sequence: EPQYEEEIPIYL, APeptide Ltd, China) at 0.3 μM (n = 8). Two CSD episodes were elicited in each experiment with a 45-minute interval for tissue recovery. The drug or vehicle was perfused 45 minutes prior to the second CSD induction for 1 hour, that is, the first CSD was under Kreb’s perfusion in both the control and drug groups; however, the drug replaced Kreb’s solution in the drug group prior to the second CSD.
Data presentation and statistical analysis
For in vivo data analysis, electrophysiological data on CSD was quantified as described previously (14) using the Labview program. The following parameters were defined: (i) Area under the curve (AUC, mV × minute) of CSD waves was used to reflect CSD magnitude. Although very occasionally, in the case where more than one CSD wave was elicited, the AUC of the first CSD wave in each rat was used for comparison; and (ii) latency (minute), the time difference between the start of KCl application to the starting point of the rising phase of the first CSD wave. Both CSD magnitude and latency were used to reflect cortical susceptibility to CSD.
For the image analysis, intrinsic optical imaging of CSD was quantified as reported previously (22), for each CSD wave. Latency was calculated by the time interval between the starting point of KCl ejection and that of CSD elicitation. AUC was calculated by gray levels × minute. In each image sequence related to a given CSD, the distance of 1 mm between two images in the same CSD wave, divided by the difference in their exposure time, allowed the calculation of CSD propagation rate (mm/minute). In order to eliminate variations of AOI chosen in each individual experiment, CSD magnitude and latency within each different test were given in delta intensity between the second CSD and the first CSD episode relative to that of the first CSD wave (i.e. initial control) respectively.
The abnormal distribution test using Shapiro-Wilk was confirmed using Prism software. All values were given in median (range). The Mann-Whitney test was used for comparing two independent groups with two-tailed calculation, except for one-tailed calculation for investigating the effects of NVP on CSD in rats. Significant differences are shown as *p < 0.05 and **p < 0.01. Correlation analysis was carried out between CSD characteristics and levels of SFK phosphorylation of individual experiments with NMDA receptor inhibition or SFK deactivation.
Results
NMDA receptor inhibition suppressed CSD in rats
We investigated whether the NMDA receptor antagonist, NVP, perfused i.c.v suppresses CSD in rats. In the ACSF group, topical application of 3 M KCl for 5 minutes typically elicited one CSD wave that was identified by a transient negative shift of DC potential (Figure 1(b)); however, two CSD waves were observed in two out of seven rats. The CSD magnitude and latency was 20.99 (10.82) mV × minute (n = 6) and 1.98 (1.00) minutes (n = 4), respectively (Figure 1(c), (d)). Compared with the CSD group, 0.3 nmol NVP perfused into contralateral i.c.v. markedly reduced CSD magnitude to 17.10 (3.42) mV × minute (n = 4, p = 0.009, Figure 1(c)). In addition, CSD latency was significantly prolonged to 4.86 (3.04) minutes (n = 4, p = 0.014, Figure 1(d)). Overall, these data are consistent with that reported previously in the chick retina (22,28) and rat (14).
CSD-induced ipsilateral cortical SFK activation
Results regarding whether CSD could induce SFK phosphorylation demonstrate that both phosphorylated SFK at amino acid Y416 and total SFK were detected in the ipsilateral cortex of rats with a molecular weight of 60 KDa (Figure 2(a)). In the sham group, the relative intensity of PY416 SFK and total SFK was 0.27 (0.22) (n = 5) and 0.95 (0.18) (n = 4) respectively (Figure 2(b)). In the CSD group, the relative intensity of PY416 SFK was 0.97 (0.7) (n = 5), which was significantly increased compared with that of the sham group (p = 0.008), demonstrating that a single CSD is sufficient to induce SFK phosphorylation. In contrast, the level of total SFK was not different to that of the sham group CSD (n = 6).
Detection of SFK activity after CSD and effects of PP2 on SFK activation induced by CSD in the ipsilateral cortex of rats. (a) Representative immunoblotting of PY416 SFK and total SFKs treated with i.c.v. perfusion of ACSF, PP3 or PP2 in response to CSD. Equal loading of samples was indicated by the β-actin intensity. Phosphorylation at Y416 amino acid (PY416) levels indicated activated SFK and total SFK levels indicated SFK expression. Samples without CSD induction from the sham group are used as control. (b) Quantitative analysis of relative intensity of PY416 SFK and total SFK normalized to β-actin. All the values shown are median (range). *p < 0.05, **p < 0.01, Mann-Whitney test, two-tailed calculation, was used for the comparison of PY416 SFK or total SFK levels between sham vs. CSD only group; ACSF vs. PP3 or PP2 group; as well as PP3 vs. PP2 group.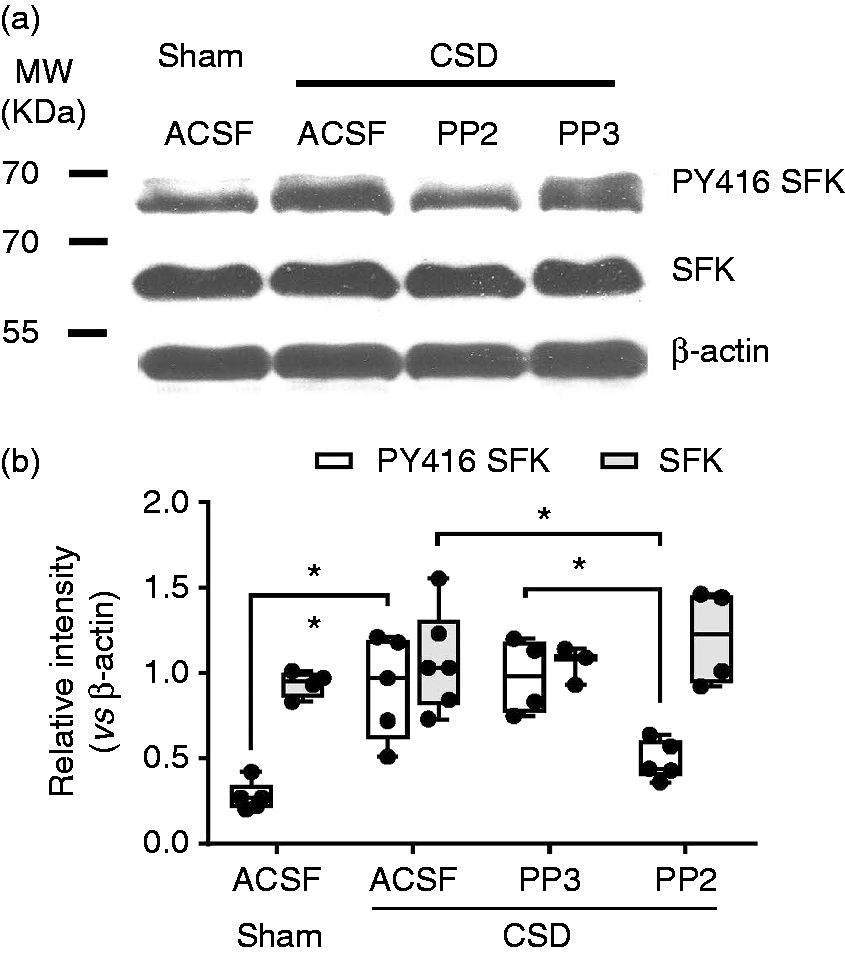
SFK inhibition suppressed CSD-induced SFK activation
We examined whether SFK phosphorylation induced by CSD could be suppressed by the SFK selective inhibitor, PP2. When 2.5 nmol PP3, the negative control for PP2, was perfused into i.c.v, the level of phosphorylated SFK in the ipsilateral cortex was 0.98 (0.45), which is similar to that of the CSD-only group (n = 4, Figure 2(b)). Similarly, total SFK level with 1.09 (0.21) was not altered (n = 3). However, 2.5 nmol PP2 perfused into the i.c.v markedly reduced the level of phosphorylated SFK to 0.44 (0.28) (n = 5). This reduction was significantly different from that of either the PP3 group (p = 0.016) or CSD group (p = 0.032). In contrast, the level of total SFK was not altered by PP2 (n = 4).
SFK inhibition suppressed CSD
To further our analysis, we addressed whether inhibition of SFK activity by PP2 could suppress cortical susceptibility to CSD in rats. In the ACSF group, the CSD magnitude and latency were 20.99 (10.82) mV × minute (n = 7), 1.98 (1) minutes (n = 4) respectively (Figure 3). PP3 at 2.5 nmol perfused into i.c.v. did not alter all these parameters (Figure 3). In contrast to PP3 but similar to NVP (Figure 1), PP2 at 2.5 nmol markedly suppressed the magnitude of CSD to 13.68 (4.93) mV × minute (n = 7) compared with either the PP3 group (n = 7, p = 0.011) or ACSF group (n = 7, p = 0.002, Figure 3(a)). In addition, PP2 also prolonged CSD latency to 3.05 (3.06) minutes (n = 7), which was significantly different to that of the PP3 group (n = 6, p = 0.014, Figure 3(b)).
Effects of SFK inhibition on the magnitude (a) and latency (b) of CSD in rats. The SFK inhibitor PP2 at 2.5 nmol, its negative analog PP3 at 2.5 nmol or ACSF was perfused into the contralateral i.c.v. 2 hours prior to CSD induction. All the values shown are median (range). *p < 0.05, **p < 0.01, Mann-Whitney test, two-tailed calculation, was used for the comparison of CSD latency and magnitude between ACSF vs. PP3, ACSF vs PP2, and PP3 vs PP2 groups. Effects of SFK activation on the suppression of CSD by NVP in the mouse brain slice. (a) Representative images of mouse cortical slice before ((a), upper) and after ((a), lower) K+-induced CSD in the mouse coronal slice. CSD was plotted by the kinetic changes in gray level intensity within the selected area of interest (AOI, area within the red rectangle). The same AOI along CSD wave front (indicated by the short arrow) was selected and used for all images of the sequence under study. (b) Representative traces shows CSD wave treated with bath perfusion of Kreb’s. All the averaged gray levels within the AOI were plotted against time to generate the CSD wave showing a biphasic pattern. CSD magnitude was indicated by the area under the curve of CSD wave. CSD latency is the time interval required for eliciting depolarization from the start point of KCl application. Propagation rate of CSD (mm/minute) reflects the velocity of CSD wave propagating across cortex. Panels (c)–(e) show effects of the SFK activator, pYEEI, at 0.1 μM on the CSD magnitude (c), latency (d) and propagation rate (e) in the presence and absence of NVP at 0.3 μM. YEEI at 0.1 μM was set as the scramble control of pYEEI. In order to minimize data variation, CSD magnitude (c) and latency (d) were presented as changes in reflected difference in light intensity between CSD2 and CSD1 (i.e. delta CSD magnitude and latency) relative to the initial control. All the values shown are median (range). *p < 0.05, **p < 0.01, Mann-Whitney test, two-tailed calculation, was used for the comparison between two independent groups.

The inhibitory effect of NMDA receptor antagonist on CSD was reversed by SFK activation
The mouse brain slice CSD model was validated using NVP. In the Kreb’s group, changes in CSD magnitude and latency in the second episode over the first CSD were −5.30 (32.58) (n = 5) and 29.0 (90) (n = 6) respectively (Figure 4(c), (d)). The propagation rate was 6.29 (4.07) mm/minute (n = 5) (Figure 4(e)). Compared with the Kreb’s group, perfusion of NVP at 0.3 μM significantly suppressed the magnitude of CSD and CSD propagation rate with the reduction to −35.89 (20.89) (n = 5, p = 0.008) and 4.55 (3.33) mm/minute (n = 7, p = 0.018) (Figure 4(c) and (e)). These results are consistent with the previous studies in chick retina (22) and rats (14), suggesting the mouse brain slice CSD model is valid for investigating NMDA receptor pharmacology. In contrast to that reported previously in rats (14), the CSD latency was not altered by NVP compared with the Kreb’s group (Figure 4(d)). The mechanism for this difference is not known, but may be associated with different tissues used in these studies, that is, the rat cortex in vivo versus the mouse brain slice in this experiment.
We utilized this model to address whether the inhibitory effect of NVP on CSD could be reversed by the SFK activator. The brain slice treated with the negative control, YEEI, at 0.1 μM in the presence of NVP, resulted in changes in the magnitude and latency of CSD, which were −23.25 (34.62) (n = 7, Figure 4(c)) and 100 (274.4) (n = 7, Figure 4(d)) respectively. The propagation rate was 4.05 (3.18) mm/minute (n = 5, Figure 4(e)). These results were similar to the result of the NVP group. Interestingly, exposing a cortical slice to pYEEI at 0.1 μM (n = 5) reversed the suppressive effect of NVP on CSD magnitude, which was significant compared with the NVP + YEEI group (p = 0.018) or NVP alone group (p = 0.008, Figure 4(c)). However, neither the CSD latency (Figure 4(d)) nor CSD propagation rate (Figure 4(e)) was altered by pYEEI.
The NMDA receptor antagonist suppressed CSD-induced cortical SFK activation
Whether CSD-induced elevation of SFK phosphorylation was suppressed by NMDA receptor inhibition was further examined. In the sham group, the relative intensity of phosphorylated SFK and total SFK of the ipsilateral cortex were 0.31 (0.22) (n = 5) and 0.84 (0.25) respectively (n = 5, Figure 5(b)). As described above, CSD significantly increased the level of phosphorylated SFK to 0.59 (0.67) (n = 8, p = 0.002), but it did not alter the level of total SFK (n = 8, Figure 5(b)). Compared with that of the CSD group, 0.3 nmol NVP perfused into i.c.v. significantly reduced the level of phosphorylated SFK induced by CSD to 0.32 (0.27) (n = 5, p = 0.006, Figure 5(b)). However, the level of total SFK was not altered by application of NVP (n = 5, Figure 5(b)).
Effects of NMDA receptor inhibition on CSD-induced SFK activation in the ipsilateral cortex of rats. (a) Representative immunoblotting of PY416 SFK and total SFKs treated with i.c.v. perfusion of NVP at 0.3 nmol (i) or ACSF (ii) in response to CSD. Samples without CSD induction (iii) from the sham group were used as control. Equal loading of samples was indicated by the β-actin intensity. PY416 levels indicated activated SFK and total SFK levels indicated SFK expression. (b) Quantitative analysis of relative intensity of PY416 SFK and total SFKs normalized to β-actin. All the values shown are median (range). **p < 0.01, Mann-Whitney test, two-tailed calculation, was used for the comparison of PY416 SFK or total SFK levels between ACSF groups with vs. without CSD; and ACSF vs. NVP groups with CSD.
Reduced cortical susceptibility to CSD correlates with a lower level of SFK phosphorylation by PP2 and NVP
We further carried out correlation analysis of CSD latency and magnitude with levels of ipsilateral cortical SFK phosphorylation with and without NMDA receptor inhibition or SFK deactivation in rats. The results showed that after PP2 perfusion i.c.v at 120 minutes prior to CSD induction, lower levels of SFK phosphorylation showed a tendency for negative correlation with the increased CSD latency (Figure 6(a)) and a positive correlation with the reduced magnitude (Figure 6(c)). Similarly, after perfusion of NVP at 120 minutes prior to CSD induction, the lower levels of SFK phosphorylation also showed a strong negative correlation with the increased CSD latency (Figure 6(b)), whereas its correlation with the reduced CSD magnitude was not pronounced relative to the control (Figure 6(d)).
Correlation analysis of CSD characteristics with levels of ipsilateral cortical SFK phosphorylation at Y416 site with and without SFK deactivation or NMDA receptor inhibition in rats. ((a), (b)). The increased CSD latency strongly negatively correlated with the reduction of SFK phosphorylation after PP2 (a) or NVP (b) perfusion i.c.v at 120 minutes prior to CSD induction. ((c), (d)); the reduced CSD magnitude positively correlated with a lower SFK phosphorylation after perfusion of PP2 (c) or NVP (d) at 120 minutes prior to CSD induction. Black lines show correlation between each CSD parameter and respective level of SFK phosphorylation of individual experiments. Red dotted lines indicate the averaged correlation between CSD latency and SFK phosphorylation. Green dotted lines indicate the averaged correlation between CSD magnitude and SFK phosphorylation.
Discussion
In this study, we used in vivo and in vitro approaches to show that a single CSD rapidly promotes SFK phosphorylation while deactivation of SFK reduces the likelihood of CSD occurrence, which coincides with the lower level of SFK phosphorylation. Further investigation shows that this can be regulated by NMDA receptors. This finding provides novel insight into SFK signaling in the mechanisms underpinning migraine aura, indicating that SFK may be a potential target for migraine prophylaxis.
A key finding of our study is that SFK activity is required for CSD propagation. A single CSD rapidly promoted the ipsilateral cortical SFK phosphorylation at its active Y416 site, and this elevation of SFK phosphorylation was prevented by the SFK inhibitor perfused into the contralateral i.c.v. of rats (Figure 2). Consistent with this, SFK inhibition also reduced cortical susceptibility to CSD as PP2 suppressed CSD magnitude and prolonged CSD latency in rats (Figure 3). We conclude that a single CSD induces rapid SFK activation, which in turn contributes to CSD propagation. Further correlation analysis demonstrated that the reduction of cortical susceptibility to CSD showed stronger positive correlation with a lower level of SFK phosphorylation after PP2 was perfused 2 hours prior to CSD induction than after PP3 application (Figure 6(a) and (c)). These data suggest that deactivation of SFK was able to reduce the likelihood of CSD occurrence, which coincides with a lower level of SFK phosphorylation. Given that migraine aura is believed to involve only a single CSD event (29), the critical role of SFK activity in CSD suggests that SFK activation is involved in the pathophysiology of migraine aura. These data extend a recent study in mice showing that intraperitoneal injection of PP2 inhibited the frequency of multiple CSD (6). The finding is also consistent with SFK activation being induced by multiple cell stresses (30) and tissue damage (31).
SFK activity is a known regulatory hub at which multiple signaling pathways converge, for example, coupling intracellular and membrane proteins including P2X7 and NMDA receptors (2,3,32). One explanation to account for a key role of SFK activity in CSD is a link with the P2X7 receptors, as tyrosine kinase plays a pivotal role in P2X7 receptor-mediated cellular responses and is involved in the initial steps leading to Panx1 channel opening (33), which can be opened by CSD (11). Alternatively, SFK activity in CSD could be regulated by the activation of NMDA receptors. Firstly, SFK is known to couple with the NMDA receptor, forming an SFK-NMDA receptor complex (4). Secondly, in this study, we demonstrated a functional link between SFK and NMDA receptors during CSD. The reduced CSD magnitude in the mouse brain slice with NVP was no longer observed when the SFK activator was co-applied (Figure 4). Additionally, elevation of SFK phosphorylation at Y416 amino acid induced by a single CSD was prevented by NMDA receptor inhibition by NVP (Figure 5), which is consistent with that observed with the SKF inhibitor, PP2 (Figure 3). Interestingly, the increase in CSD latency showed a strong negative correlation with a lower level of SFK phosphorylation after NVP was perfused 2 hours prior to CSD induction (Figure 6(b)). This indicates that NMDA receptor inhibition reduces the likelihood of CSD occurrence, which subsequently further reduces SFK phosphorylation. Collectively, these data, together with the fact that NMDA receptor and its major subunits, NR2A and NR2B, contribute to CSD genesis and propagation in vivo (13,14,22), supports the model that we propose, that SFK activity contributing to CSD propagation is regulated by recruiting NMDA receptors. This is consistent with the previous finding that SFK can be recruited by activation of NMDA receptors leading to Panx1 channel opening during anoxia/ischemia (2).
The mechanism by which SFK activity is regulated by NMDA receptors in CSD is not known, but one candidate might be a Ca2+ influx as the synaptic NMDA receptor contributes to K+-triggered CSD via calcium entry (34); and accumulation of cytoplasmic calcium can activate SFK through multiple signaling, including the NMDA receptor (3,35). Alternatively, SFK may directly act on the NMDA receptor by phosphorylation of NR2A/B subunits (1), which are known key players in CSD genesis and propagation (12–14). Interestingly, the fact that uncoupling Src from the ND2-NMDA receptor by Src40-49 (10) did not alter CSD magnitude or the cortical susceptibility to CSD in the mouse brain slice (data not shown) does not support any involvement of Src (10). It is possible that Fyn might be involved in this process, as PP2 preferentially inhibits Fyn, but not Src, at nanomolar concentrations (36).
In summary, our data provides strong evidence that a single CSD is sufficient to induce SFK phosphorylation, which in turn regulates cortical susceptibility to CSD. This positive feedback loop associated with CSD can be regulated by NMDA receptors. It remains to be resolved if elevation of SFK activity by CSD would subsequently trigger Panx1 channel opening. Given that CSD is the accepted underlying cause of migraine with aura, our finding gives new clues about the molecular and cellular mechanism of migraine with aura and may constitute a new strategy for migraine prophylaxis.
Article highlights
A single CSD is sufficient to rapidly increase SFK phosphorylation, which in turn facilitates CSD propagation. Deactivation of SFK reduces the likelihood of CSD occurrence, which coincides with lower level of SFK phosphorylation. SFK activity required for CSD propagation is regulated by activation of NMDA receptors. This is the first in vivo evidence showing SFK activity may play a pivotal role in the mechanism of migraine aura.
Footnotes
Acknowledgements
The authors thank Wangwenli Charitable Foundation and XJTLU research development fund for financial support. We are grateful for the provision of NVP from Yi Li at Department of Chemistry, XJTLU.
Declaration of conflicting interests
The authors declared no potential conflicts of interest with respect to the research, authorship, and/or publication of this article.
Funding
The authors received no financial support for the research, authorship, and/or publication of this article.