
Abstract
Although Australian regulators recommend that remuneration committees (RC) comprise directors who are independent, we argue that independence is not sufficient to avoid agency problems and counter managerial power. We evaluate a range of RC characteristics associated with executive compensation packages. We show that when independent directors, an independent chair or other firms’ CEOs sit on the RC, excess pay is likely to be lower. Furthermore, pay-performance sensitivity is higher when there are more senior directors on the RC. However, when directors are busy or the RC is diverse, executives are more likely to be overpaid. Overpayment and lower pay-performance sensitivity are also associated with the RC being influenced by the CEO, such as when the CEO sits on the RC or has appointed a high proportion of directors. Our results indicate that RC independence alone is insufficient for effective executive remuneration and we recommend appointing senior, experienced and less busy directors to increase RC effectiveness.
1. Introduction
The level and the drivers of executive compensation have been of concern to academics, policy-makers and investors around the world for several decades. 1 To ensure that executive remuneration incentivises value creation for shareholders and aligns the executives’ interests with the organisation’s values and risk appetite, good corporate governance practice is to establish an independent remuneration committee (RC). However, research has found that executive compensation packages are inefficient as incentive schemes, because the executives’ managerial power allows them to exercise significant influence over the board and RC when their own compensation is being determined (Bebchuk and Fried, 2003). This article proposes that independence alone is not a sufficient characteristic for an RC to effectively mitigate agency conflict and avoid managerial power problems inherent in the setting of executive remuneration. An effective RC may need to do more than just appoint independent members to design a remuneration contract that motivates the executives to perform in areas that are important to shareholders (Bender, 2007). This leads to the question we address in this study: what characteristics does an effective RC require to design such a contract?
In Australia, the Australian Securities Exchange (ASX) has attempted to resolve the conflicts of interest surrounding executive compensation by recommending/requiring an independent RC. The earliest ASX Principles of Good Corporate Governance recommendations issued in 2003 included Recommendation 9.2, which states that all companies listed on the ASX should (1) establish an RC consisting of a minimum of three members with the majority including the chair being independent, (2) have a formal charter for the RC, and (3) make the RC responsible for reviewing and recommending remuneration policy that motivates directors and managers to pursue long-term growth and success, with a clear link between executive performance and compensation. On 1 July 2011, the ASX amended the Listing Rule 12.8 to require S&P ASX300 companies (ASX300) to form an RC comprising solely non-executive directors. The Listing Rule requirements were focused on the ASX300 because these companies are considered to have the resources and ability to form an RC (ASX, 2011; Australian Government Productivity Commission, 2009). 2 The latest ASX’s Corporate Governance Principles and Recommendations (CGPR) published in 2019 include Principle 8 which basically echoes the recommendations regarding RC composition in its 2003 version. It states that executive remuneration should align senior executives’ interests with value creation for security holders and with the organisation’s values and risk appetite.
Several Australian studies (Capezio et al., 2011; Cybinski and Windsor, 2013; Kent et al., 2018) have investigated whether the formation of an independent RC is effective in constraining executive compensation and creating sufficient incentives for the executives to act in shareholders’ interests. Their results are inconclusive, failing to demonstrate that the attribute of independence is sufficient for an effective RC. Furthermore, while some papers report a strong association between independent and experienced directors and good company performance (Cohen et al., 2012), others find that having fully independent members may reduce the effectiveness of the RC (Aldamen et al., 2012; Kent et al., 2018). Independent directors are not involved in the company’s daily operations so they are not familiar with the executive performance and may make poor judgements when they design executive compensation packages.
In this study, we incorporate a broader and richer set of RC characteristics than has been considered in the prior literature, to examine what type of RC is associated with setting executive remuneration packages that avoid agency problems and counter managerial power. We use nine RC characteristics drawn from the literature and theory, each of which is expected to affect the RC’s ability to resolve the conflict of interest around executive compensation. Those characteristics are RC independence, RC chair independence, committee size, gender diversity, the presence of long-serving directors, the presence of busy directors, having the company’s current chief executive officer (CEO) as a member, the proportion of members appointed by the CEO, and the proportion of members who are CEOs of other companies (Aldamen et al., 2012; Appiah and Chizema, 2015; Conyon and Peck, 1998; Erhardt et al., 2003; Gregory-Smith, 2012; Kanapathippillai et al., 2016; Kent et al., 2018; Kuo and Yu, 2014; Sun and Cahan, 2009).
We use two key measures to capture the effective design of executive remuneration by the RC. As recommended and discussed in the CGPR, an effective remuneration package should attract, retain and motivate senior executives and align their interests with the creation of value for security holders and with the entity’s values and risk appetite. A less effective remuneration package might result from senior executives being able to divert the RC’s purpose to their benefit, leading to excess pay that is not reflected in higher returns to shareholders. To check if certain RC characteristics play a role in preventing senior executives from diverting the RC’s purpose, we first examine the associations between RC characteristics and excess pay for CEOs and chief financial officers (CFOs), measured in relation to the expected level of compensation based on industry average compensation and firm characteristics. Second, we examine whether the CEO’s and CFO’s total pay is effectively linked with firm performance measures, employing pay-performance sensitivity. As a sensitivity check, we also consider the associations between RC characteristics and components of top executives’ pay, including cash bonuses, options and stocks, and total performance-related pay.
Using 3249 firm-year observations of ASX300 companies with an RC, we find that the first measure of RC effectiveness, excess pay, decreases with RC independence and RC chair independence. Furthermore, excess pay is positively associated with RC characteristics that measure their lack of independence from the CEO, such as CEOs sitting on RCs and CEO-appointed directors, while its relation with RC characteristics that measure directors’ attributes and experience is mixed. Such pay is positively associated with RC gender diversity and director busyness, indicating conditions under which the RC is unable to counter the executives’ power over setting their remuneration. Having an external CEO on the RC, on the other hand, is found to reduce the excess pay of senior executives, especially CFOs. Our results show that the second measure of RC effectiveness, pay-performance sensitivity, is greater when there are more senior directors on the RC and lower when CEOs sit on the RC and when there are CEO-appointed directors. This result confirms that the RC’s lack of independence from the influence of the CEO reduces its effectiveness. Notably, none of the RC characteristics specified in the ASX CGPR, that is, RC independence, RC chair independence, and RC size, have statistically significant results for pay-performance sensitivity. Overall, we find that relations between RC characteristics and incentivising remuneration are complex. Merely having an independent RC is not sufficient to provide remuneration that motivates top executives to improve firm value.
This research contributes to the literature in the following ways. First, although corporate governance studies on the effectiveness of the board of directors are plentiful, research on the effectiveness of the RC is relatively limited within the Australian setting. This is the first study to explore the effects of multiple RC characteristics on top executive compensation in Australia, using two measures of RC effectiveness. Consistent with the amendment to ASX Listing Rule 12.8 in 2011, which focused on the presence and independence of the RC, most prior studies have explored only the independence of the RC (Capezio et al., 2011; Cybinski and Windsor, 2013; Lawrence and Stapledon, 1999). The studies that have explored other RC characteristics have chosen measures that are recommended by ASX CGPR for RC governance: the chairperson’s independence, RC size and meeting frequency (Kanapathippillai et al., 2016, 2019; Kent et al., 2018). In contrast, our choice of nine RC characteristics goes beyond those recommended or regulated, enabling us not only to draw conclusions about current regulations, but also to make suggestions on how to best establish an effective RC in the future.
We also contribute to the broader literature on how performance-based compensation for executives mitigates agency costs. Prior studies of the link between executive total compensation and return on assets (ROA) are inconclusive (see, for example, Capezio et al., 2011; Guthrie et al., 2012; Kanapathippillai et al., 2019; Kent et al., 2018). Unlike the prior studies, we employ two key measures for the effectiveness of the RC, to include the various ways in which CEO and CFO compensation can motivate the pursuit of firm growth and success, as recommended by the CGPR. We also conduct sensitivity tests to provide insights into how the incentives and components of top executive compensation are affected by the RCs’ key characteristics.
Our choice of Australia as a setting allows us to make an incremental contribution to the literature over related studies set in the United States and United Kingdom. In terms of strictness, Australian regulation is between that of the United States and the United Kingdom. Regulation for ASX300 companies examined in this study is slightly more specific than regulation in the United Kingdom. While both countries require RCs to comprise only non-executive directors, this requirement is a listing rule for ASX300 companies in Australia, while in the United Kingdom it is part of the corporate governance guidelines which take a less onerous ‘comply or explain’ approach. Yet compared with the United States, the Australian setting is less strict. US regulation requires companies to establish RCs with independent directors, whereas Australia only specifies that RC directors be non-executives.
Section 2 reviews the literature and develops the hypotheses. Section 3 describes the study’s sample and model development, while section 4 shows the results. Finally, section 5 summarises our study, draws conclusions and identifies limitations.
2. Literature background and hypotheses
2.1. Theoretical framework
The relation between top executive behaviour and firm performance can be explained by a number of theories, including agency theory, stewardship theory, stakeholder theory, managerial hegemony theory, upper echelon theory, strategic choice theory and resource dependency theory. ‘The most well-applied and longest established theory’ (Ong and Lee, 2000) is agency theory, which is ‘grounded on the self-interest of CEOs and other managers’ (Ong and Lee, 2000). Agency theory assumes that the CEO will act in his or her own interests unless he or she is restrained from such actions or unless he or she is motivated towards better actions (Core et al., 1999). This key assumption has motivated the introduction of various governance regulations and practices to restrain CEO power. It has also motivated the design of executive remuneration packages to align the CEO’s interests to those of the firm’s shareholders (Bebchuk and Fried, 2003), although such alignment cannot be complete (Jensen and Meckling, 1976).
To more fully reflect the principal–agent relationship in the modern corporation, Conyon and He (2004) note that the principal delegates monitoring rights to another party (e.g. board of directors) who monitors and evaluates the agent. One example of this is the design of executive compensation contracts being delegated to the RC. RC members are entrusted to effectively monitor, evaluate and reward executive performance. To be effective in addressing the agency conflicts between owners and managers, they need to be diligent and trustworthy stewards of the collective interest (Capezio et al., 2011). This could be why non-executive or independent directors are frequently appointed to serve on the RC (Anderson and Bizjak, 2003; Sapp, 2008). Having independent directors on the RC is seen as a way to avoid the abuse of managerial power because independent directors are deemed to be more adept at optimal contracting and interest alignment (Conyon, 2006, 2011).
Executive remuneration contracts that align the interests of top executives and the firm’s shareholders frequently include a risky portion that depends on the firm’s performance (Miller et al., 2002). However, managerial power theory suggests that risk-averse executives want less variance in their compensation (Elsaid and Davidson, 2009). Research shows that they will negotiate for a higher fixed component of their compensation (Otten, 2008), and they will try to change their performance benchmarks to ones that are less risky and easier to achieve (Geiler and Renneboog, 2011). Similarly, Guthrie et al. (2012) document that managerial power has a dominant adverse effect on CEO compensation even in the presence of independent directors and effective shareholder monitoring. Similar doubts about the effectiveness of independent directors are raised by several studies (for example, Capezio et al., 2011; Conyon, 2014; Gregory-Smith, 2012). Independent directors may not be truly independent from management in the board selection process (Appiah and Chizema, 2015), may assume a tick-box approach or may not want to be troublemakers for the CEO. These directors may be more interested in considering the CEO’s preferences (Gregory-Smith, 2012) and securing a longer tenure. Thus, although directors may be classified as independent, the managerial power of the CEO may still influence RC decision-making.
Overall, the literature contains a dilemma, because incentivising compensation is both essential for principal and agent interest alignment and is also the cause of a further unresolved agency problem within the remuneration-setting process (Gregory-Smith, 2012). Appointing independent directors to the RC has not completely resolved this dilemma. Motivated by this background of theory and research findings, we empirically investigate what characteristics of an RC are associated with executive remuneration packages that do not excessively compensate senior executives while aligning their interests with shareholder value creation and with the organisation’s values and risk appetite.
2.2. RC characteristics
The role of the RC is to review and make recommendations to the board in relation to executive compensation. According to the ASX CGPR, the RC must be able to deliver transparent, focused and independent judgement needed for remuneration decisions in an efficient manner (ASX CGC, 2019). Directors on the committee should be effective at monitoring the CEO and should not have a personal relationship with the CEO (Armstrong et al., 2012; Boyd et al., 2011). Going beyond responsibility for CEO remuneration alone, RC members are responsible for assessing all senior executives’ performance and determining appropriate compensation packages (Daily et al., 1998). Boards recognise the importance of aligning the interests of all top management with those of the shareholders.
In this study, we consider a broader set of RC characteristics than just the independence of RC directors included in many prior studies. We include nine characteristics, which we divide into three sets. The first set of RC characteristics that we investigate relates to compliance features of the RC as a whole. These include RC independence, RC chair independence and committee size. The second set of RC characteristics reflects individual RC members’ attributes and capabilities such as gender diversity, length of service on the RC, serving on multiple boards and having external CEOs on the RC. The third set of RC characteristics relates to the independence of RC members from the CEO. These include having the current CEO on the RC and having RC members appointed by that CEO.
The RC is responsible for addressing the agency problem by producing an effective contract that includes sufficient incentives to encourage the top executives to undertake their duties with consideration for shareholder value creation. However, top executives may prefer contracts that contain less contingent remuneration and more fixed components to increase the certainty of their pay package. Consistent with managerial power theory, powerful executives’ dominance of the remuneration-setting process may disrupt its effectiveness and weaken the link between executive compensation and shareholder returns. Thus, there is a dilemma inherent in setting top executive remuneration, and we expect that the outcome depends partly on several RC characteristics. On the one hand, appointing an RC that is consistent with the ASX CGPR is likely to identify and limit CEO disruption and dominance. On the other hand, various RC director attributes and capabilities may impact the design of effective remuneration and appointing RC members who are too close to the CEO may encourage CEO dominance. Evidence from the literature regarding key RC characteristics that capture these offsetting and uncertain effects is described below.
Having an independent RC and appointing an independent RC chairperson are recommended by ASX CGPR. Independent RC directors are expected to exercise independent judgement and to actively monitor executive remuneration and performance. However, empirical findings in the literature about the effect of an independent RC are mixed. Cybinski and Windsor (2013) confirm that an independent RC is related to greater CEO performance-based compensation. Furthermore, Kent et al. (2018), using a group of companies beyond the ASX300, find that companies with any independent RC directors have a stronger link between performance and CEO pay level. However, other findings support the alternative prediction that powerful CEOs may weaken the link between CEO compensation and shareholder returns, even in the presence of independent directors. Capezio et al. (2011) find that an independent RC is likely to award high non-incentive bonuses to their CEO, and O’Reilly et al. (1988) conclude that CEOs can have a significant informal impact on the selection of independent members, preventing the selection process itself from being truly independent from management. A third group of studies indicate that the percentage of RC independence is not related to CEO compensation (Gregory-Smith, 2012; Sapp, 2008). Similarly, the limited empirical evidence on having an independent RC chair does not clearly support the guidelines provided to companies. Kanapathippillai et al. (2016) measure the RC’s effectiveness based on narrative remuneration disclosures. Using the top 200 Australian listed companies from 2007 to 2011, they find that remuneration information disclosures are enhanced by an independent RC but are not related to the independence of the RC chairperson. In a similar vein, Kent et al. (2018) also find that the RC’s chair independence is not effective in coordinating a CEO pay–performance link.
The ASX CGPR suggest that companies should include three or more directors on the RC. Because of the paucity of prior evidence on the specific relation between RC size and top executive compensation, we base our expectations on findings for the board or subcommittees generally. It has been established that the effectiveness of independent directors’ governance differs between large and small committees. For example, Adams and Mehran (2012) and Khanna et al. (2015) suggest that companies with larger boards perform better than companies with smaller boards, because small boards do not have sufficient advisors and monitors of management. On the other hand, because of lower coordination and free-rider issues, smaller committees may perform better than larger committees (Jensen, 1993; Yermack, 1996). Jensen (1993) indicates that CEO control can be limited more effectively when boards and their subcommittees are kept small. Board size also may have an impact on top executive compensation. For instance, Core et al. (1999) and Chalmers et al. (2006) find that the size of the board is positively related to the CEO’s total compensation. The greater difficulty of holding open and frank discussions in a large committee may dilute directors’ decision-making power enabling the top executive to manipulate his or her remuneration package. Bachmann et al. (2020) confirm the impact of a large board on CEO compensation, finding a positive association between more easily achieved CEO cash bonuses and a measure of CEO power that includes board size.
The ASX CGPR also suggest that a listed company should have a diversity policy for the board or a relevant subcommittee to achieve its gender diversity objective. Some prior research has shown that a higher level of female involvement on the board or the top management team is associated with better financial performance (Dezsö and Ross, 2012). Adams and Ferreira (2009) show that female directors have better attendance records than male directors and are more likely to join a monitoring committee. Applying these arguments for the benefits of a diverse board, Bugeja et al. (2016) report that CEO compensation levels are negatively related to the gender diversity of the RC. On the other hand, Usman et al. (2018) find that CEOs are more powerful when the board is gender-diverse, allowing the CEO to positively influence their own remuneration.
Vafeas (2003) presents two competing arguments about the benefits of directors’ length of service. The expertise argument suggests that long-serving directors have greater experience, abilities and commitment to the company as they have accumulated knowledge about the company and its business environment. This argument is supported by Sun and Cahan (2009) and Sun et al. (2009) who argue that long-serving directors are more effective because of their greater experience in governance and business leadership. For a sample of US companies, Sun and Cahan (2009) show that CEO cash compensation is more positively related to accounting earnings when the proportion of senior directors on the RC is higher. Sun et al. (2009) find that long-serving directors strengthen the association between CEO stock option grants and future firm performance. On the other hand, Vafeas’ management-friendliness argument proposes that long-serving directors are more likely to establish friendly relationships with management as they become less mobile and less employable over time.
Busy directors with appointments on other boards may be more effective at monitoring managerial decisions to maintain their reputation (Fama, 1980; Fama and Jensen, 1983; Shivdasani, 1993). RC directors with several directorships are argued to be more experienced and better connected, and therefore better positioned to advise on senior executive compensation packages (Field et al., 2013). However, busy directors are also associated with weak corporate governance (Core et al., 1999; Fich and Shivdasani, 2006) because they do not have enough available time to fulfil their monitoring role.
Prior research shows that CEOs reciprocally sitting on other companies’ boards benefits the CEOs rather than their shareholders (Fich and White, 2005) and that RC members who are CEOs of other companies may lower governance quality (Daily et al., 1998). Prior research also suggests that as a group, corporate CEOs tend to be collegial, supporting peer CEOs in their board decisions. Consequently, external CEOs serving on the RC may review and recommend a remuneration package that is more reflective of their support for the CEO than the interests of shareholders (O’Reilly et al., 1988). On the other hand, other companies’ CEOs may have helpful perspectives of what is happening across industries and may reflect their experience and knowledge in the design of executive remuneration, ensuring that pay is not excessively granted to senior managers compared with the common practices of peer firms. Supporting this argument, research has shown that market reactions to board director appointments are significantly positive when the appointed directors are CEOs of other companies (Fich, 2005) and having these CEO directors on corporate boards is negatively associated with the chance of bankruptcy (Platt and Platt, 2012). Upadhyay and Öztekin (2021) further demonstrate that influential outside directors/CEOs are more likely to serve on RCs and enhance CEO pay-performance sensitivities in appointing firms.
CEOs serving on their own RC are able to have direct input into their own compensation, which is shown in the literature to result in lower CEO performance-based compensation. When the CEO is able to exercise executive power over the board and RC members, sitting on his or her own RC results in greater CEO compensation (Bebchuk et al., 2002; O’Reilly et al., 1988). Having the CEO sit on board subcommittees such as the RC is a factor included by Bachmann et al. (2020) in their CEO power index, which they find is positively related to cash bonuses. When CEOs are removed from the RC, the proportion of performance-based compensation increases (Sapp, 2008).
Those RC members who are appointed by the current CEO may act in his or her favour based on their closer relationship with that person (Sun and Cahan, 2009). This is confirmed by Bachmann et al. (2020) who also include CEO tenure and having RC directors appointed by the serving CEO in their CEO power index. The two factors are related because longer tenure increases the chances of having current CEO-appointed RC members. Bachmann et al. find that CEO power is positively related to a higher level of CEO cash compensation.
2.3. Executive remuneration
Executive remuneration schemes can be categorised into two types: contingent (consisting of performance-based compensation to improve top executive and shareholder interest alignment, such as bonuses, stock options, and equity compensation) and non-contingent (consisting of compensation that is not related to performance, such as fixed salary).
The dilemma of how to determine an appropriate remuneration contract to incentivise managers without allowing them to divert its purpose, as explained in section 2.2, is unresolved in the literature and in practice. In practice, organisations use a range of executive remuneration schemes with different combinations of contingent and non-contingent compensation, which exposes CEOs and other executives to different levels of risk and produces different financial and risk outcomes for the executives and the organisation. For example, a higher proportion of non-contingent remuneration exposes them to far less risk than packages largely made up of contingent items (Gomez-Mejia and Wiseman, 1997).
In this study, to evaluate the RCs’ determination of appropriate remuneration, we use two key measures: excess pay and pay-performance sensitivity. Excess pay compares the total remuneration of the current CEO with the industry median. We have chosen this measure because paying more than the industry median may indicate that the top executive has diverted the purpose of the RC. However, in itself, excess pay is not sufficient evidence of an inappropriate remuneration contract. So we also employ a measure of pay-performance sensitivity which reflects how the pay level of the executive varies with the firm’s performance. Higher pay-performance sensitivity is considered effective in aligning interests of executives and shareholders. In sensitivity analysis, we also examine the components of total remuneration.
2.4. Hypotheses development
Based on the literature discussed, we develop three hypotheses about the effects of RC characteristics on CEO and CFO remuneration.
Consistent with agency theory and some prior studies (e.g. Cybinski and Windsor, 2013; Kent et al., 2018), we hypothesise that three RC characteristics recommended in the ASX CGPR – the presence of independent directors on the RC, an independent RC chair, and having a larger RC – will improve how CEO and CFO remuneration aligns their interests to those of shareholders. We expect these RC characteristics to be associated with less excess pay and greater pay-performance sensitivity. We hypothesise as follows:
H1: Characteristics of the RC that are recommended in ASX CGPR decrease excess compensation and increase pay-performance sensitivity.
Although we state a negative relation above, we note that several prior studies find a positive or no relation between these RC characteristics and excess compensation (e.g. Capezio et al., 2011; Gregory-Smith, 2012; Kanapathippillai et al., 2016; Sapp, 2008). Thus, we empirically test whether these RC characteristics indeed improve RC effectiveness as stated in the ASX CGPR.
We also consider the impact of RC directors’ attributes and experience on the design of executive compensation packages. For each of the characteristics we consider, there is some evidence for its benefits and other evidence of its drawbacks. In the framework presented by Vafeas (2003), the competing views on the importance of length of service by senior directors are the expertise argument and the management-friendliness argument. The literature is also divided on the issue of busy directors, with some evidence that directors’ reputational concerns keep them focused on the work of the RC (Field et al., 2013), and other evidence that lack of time may prevent directors from performing their duties with sufficient scrutiny, resulting in excessive executive compensation packages (Core et al., 1999; Fich and Shivdasani, 2006). On the issue of gender diversity, some studies suggest that it can undermine RC effectiveness (Faccio et al., 2016), while others refute this gendered difference in director behaviour (Adams and Funk, 2012). Likewise, there is mixed evidence about the impact of having external CEOs on the RC. Their presence might lead to increased excess pay if they support their peer CEOs (O’Reilly et al., 1988). However, their knowledge and experience of compensation practices in other companies will enhance their work on the RC (Fich, 2005; Platt and Platt, 2012; Upadhyay and Öztekin, 2021). Because there is mixed evidence on how these characteristics support or undermine the effectiveness of the RC, we do not hypothesise a directional relation between RC members’ attributes and experience and the design of remuneration structures which aligns the interests of top executives with shareholder value creation. Accordingly, we hypothesise:
H2: Characteristics of the RC that indicate their attributes and capabilities are associated with excess compensation or pay-performance sensitivity.
Consistent with managerial power theory, we hypothesise that a lack of independence between RC members and the CEO may result in executive remuneration not aligning with the interests of shareholders. When RC members are closely connected to the CEO, they are more likely to prioritise the CEO’s interests over those of shareholders (Bachmann et al., 2020; Bebchuk et al., 2002; Sapp, 2008; Sun and Cahan, 2009). Characteristics that reflect close connections between the RC and the CEO are having the current CEO on the RC and having RC members appointed by that CEO. We hypothesise these relations as follows:
H3: Characteristics of the RC that indicate their lack of independence from the CEO increase excess compensation and decrease pay-performance sensitivity.
3. Model and data
3.1. Data and sample
The sample includes all ASX300 companies each year from 2012 to 2022. We start our data collection in 2012 to avoid the impacts of two changes affecting remuneration in 2011: a Listing Rule change for ASX300 companies and the ‘two strikes rule’. 3 Effective 1 July 2011, ASX directed ASX300 companies to establish an RC under the amended listing rule. Also, effective 1 July 2011, the Corporations Amendment (Improving Accountability on Director and Executive Remuneration) Act 2011 introduced re-election of the board of directors (except the CEO) if the company’s remuneration report receives 25% or greater dissenting votes in two consecutive years.
We collect individual characteristics of RCs and executive compensation data from Connect4 Boardroom. We focus on the compensation of the two key executive members of a company, the CEO and the CFO, following previous studies that have documented both CEOs and CFOs influencing important corporate outcomes and decisions such as firm value, reporting quality and executive compensation (Friedman, 2014). All other financial data are extracted from DataStream and Worldscope. A summary of our sample selection process is presented in Table 1. From an initial sample of 7078 executive-year observations from 626 individual ASX300 companies with a CEO/managing director, CFO, or joint managing directors, we exclude 2725 observations that did not disclose total executive compensation or had missing financial data. We exclude 584 executive-year observations for newly appointed CEO/managing director or CFO and another 507 executive-year observations where the CEO or CFO left the company before the end of the financial year. These exclusions are due to the executives’ compensation being paid for less than a full year. Finally, we remove 13 observations with any negative component of performance-related compensation. This results in a final sample of 3249 observations from 433 companies over 11 years.
Summary of sample selection process. This table presents a summary of the process of sample selection. The final sample consists of 3249 firm-year observations from 2012 to 2022.
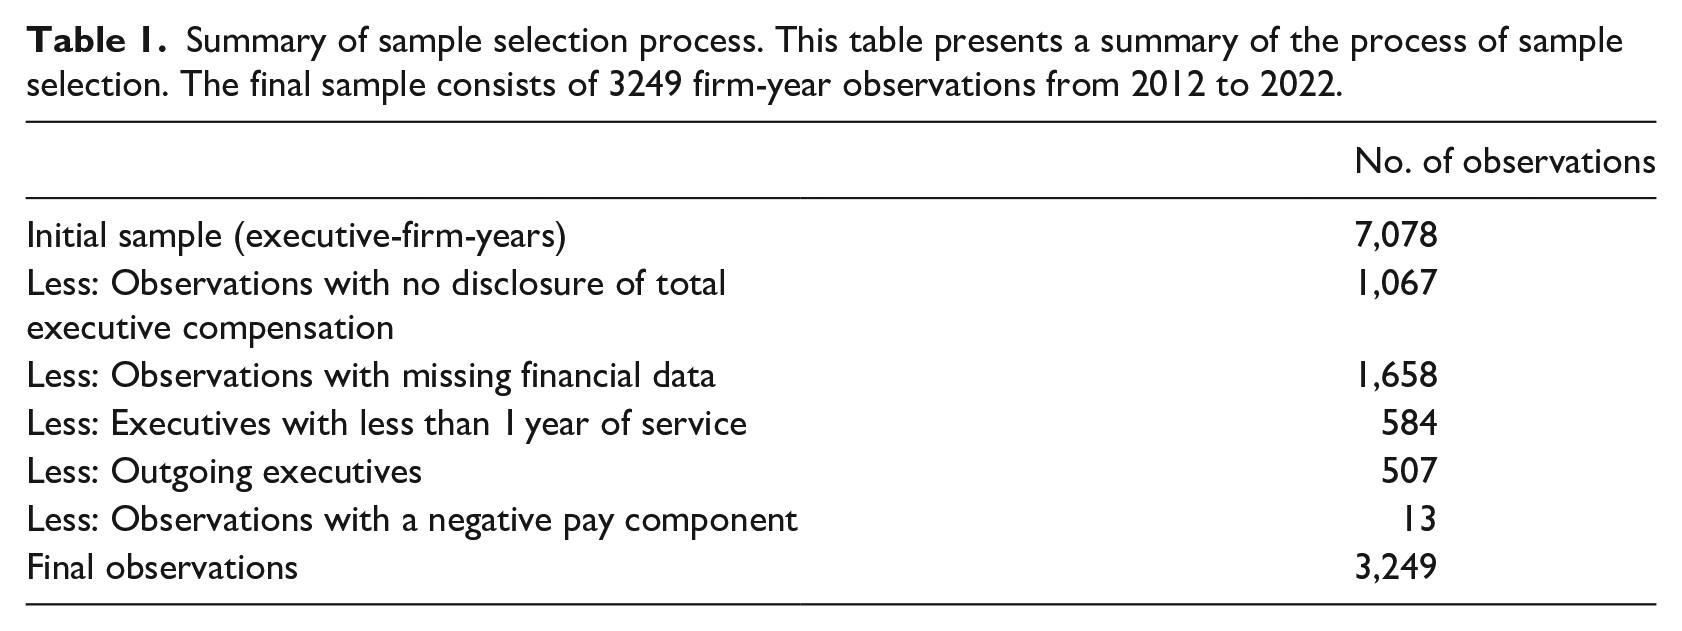
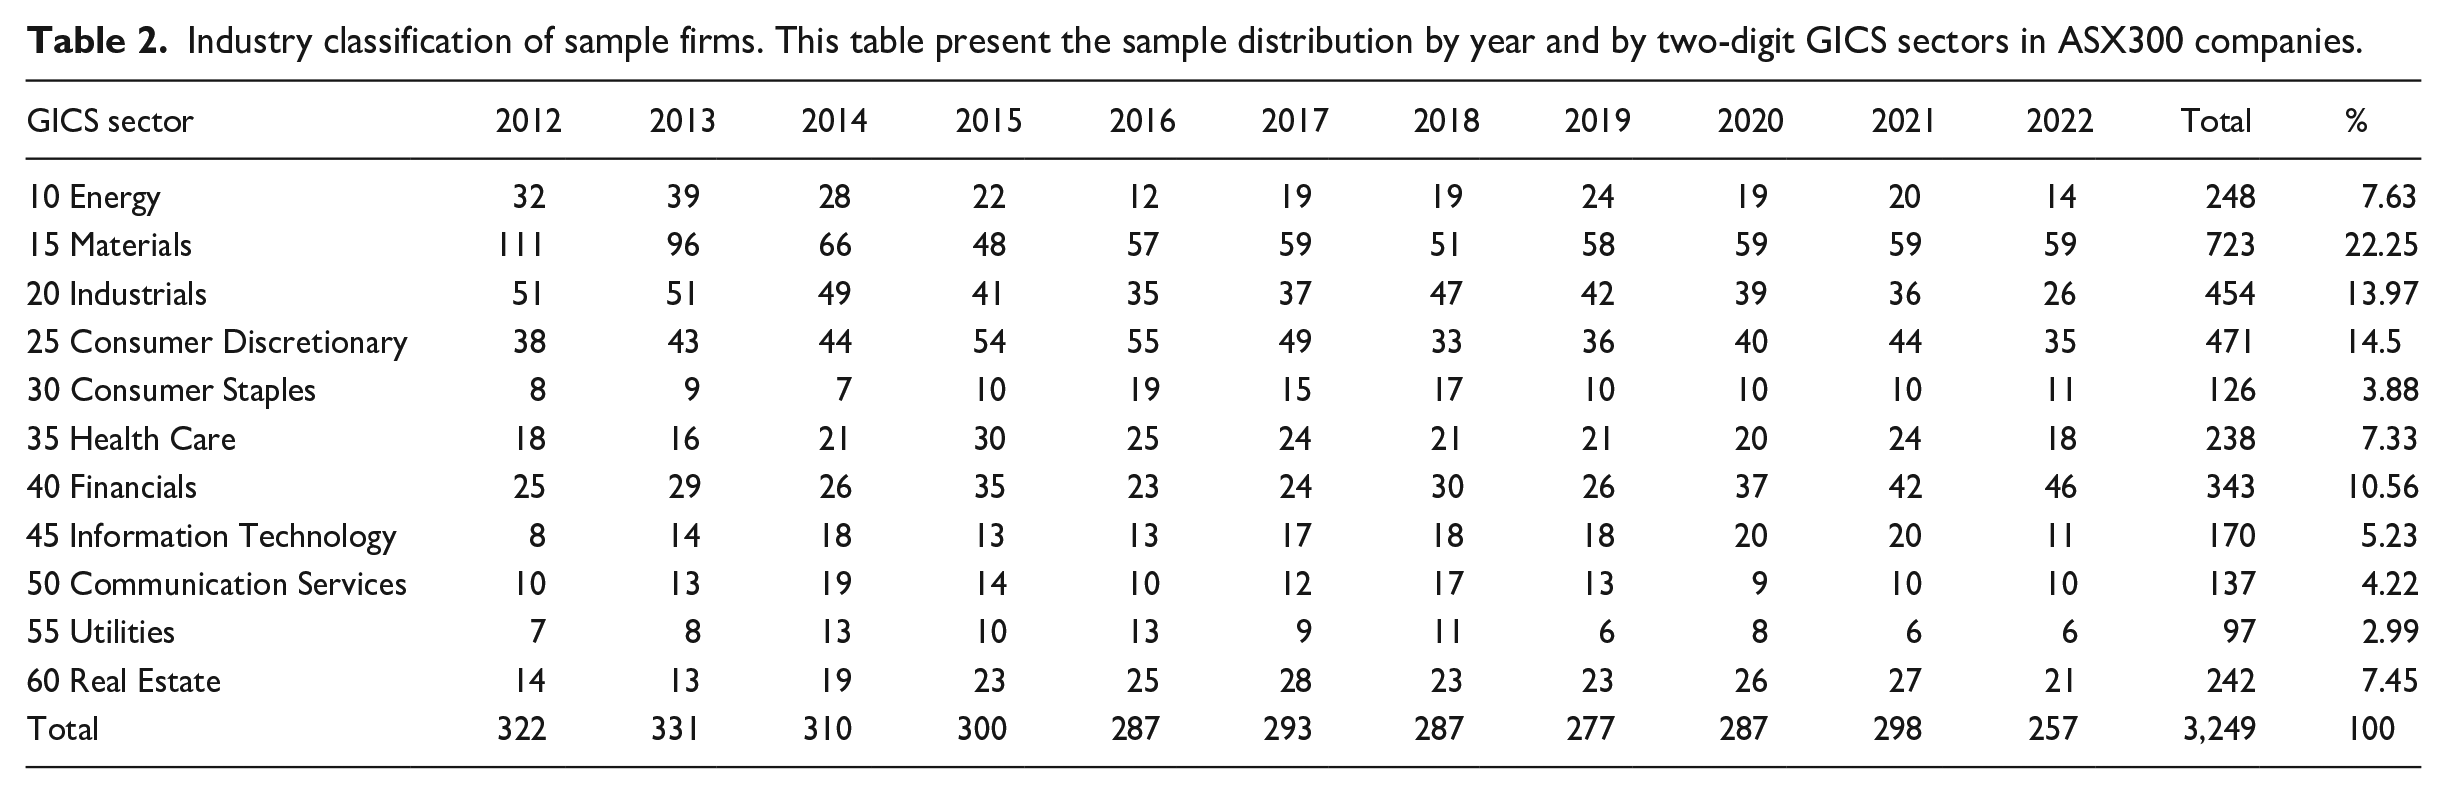
Table 2 classifies the final sample by industry, based on two-digit GICS codes. The largest sector in our sample is Materials (GICS code 15), representing 22.25% of the sample, followed by Consumer Discretionary (GICS code 25), Industrials (GICS code 20), and Financials (GICS code 40), representing 14.50%, 13.97% and 10.56%, respectively. The smallest sectors are Consumer Staples (3.88%) and Utilities (2.99%). All other sectors are in the range of 4% to 8%.
Industry classification of sample firms. This table present the sample distribution by year and by two-digit GICS sectors in ASX300 companies.
3.2. Research models
To examine the relations between RC characteristics and top executive excess compensation, we employ two methods. First, we measure the excess pay as the difference between executives’ actual compensation and the industry medians of the executive pay in the same year and estimate the following model (equation 1)
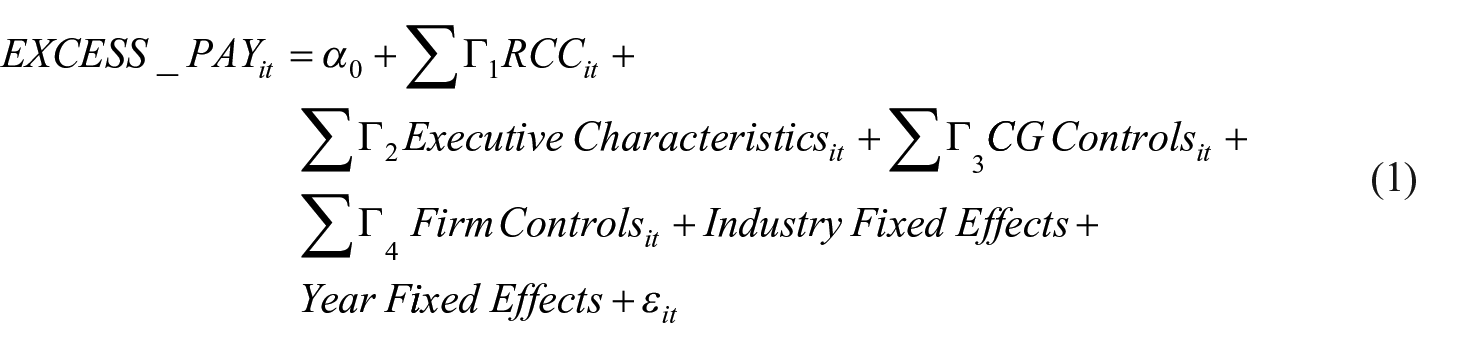
where Γ represents the vector of coefficients for individual RC characteristics (RCC). The variables included in the equations are explained in the following section and in Appendix 1. Ordinary least squares (OLS) regression analysis is applied to test the hypotheses. We include industry- and year-fixed effects to control for cross-sectional and time-varying factors.
Second, we measure excess pay as the difference between the actual pay and the predicted pay based on firm characteristics. Prior studies have followed Core et al.’s (2008) two-stage calculation approach, which uses the residual from a first-stage regression of total pay on firm characteristics as a proxy for unexplained pay (i.e. excess pay) in a second-stage regression. However, using residuals as dependent variables in regression models may lead to biased coefficients and standard errors (Chen et al., 2018, 2022). To avoid such bias, we apply a one-step model following Jackson (2022). We first identify control variables for firm characteristics which can affect total pay (Appiah and Chizema, 2015; Capezio et al., 2011; Daily et al., 1998; Guthrie et al., 2012; Kent et al., 2018; Sun and Cahan, 2009; Sun et al., 2009). Our chosen control variables are a firm’s ROA, its size (FIRM_SIZE) measured by a logarithm of total assets, its growth opportunities (GROWTH) proxied by market value of equity divided by book value of equity, and its liquidity ratio (LIQUIDITY) calculated as working capital divided by total assets. We incorporate both the control variables and main explanatory variables in one regression model (equation 2) as follows
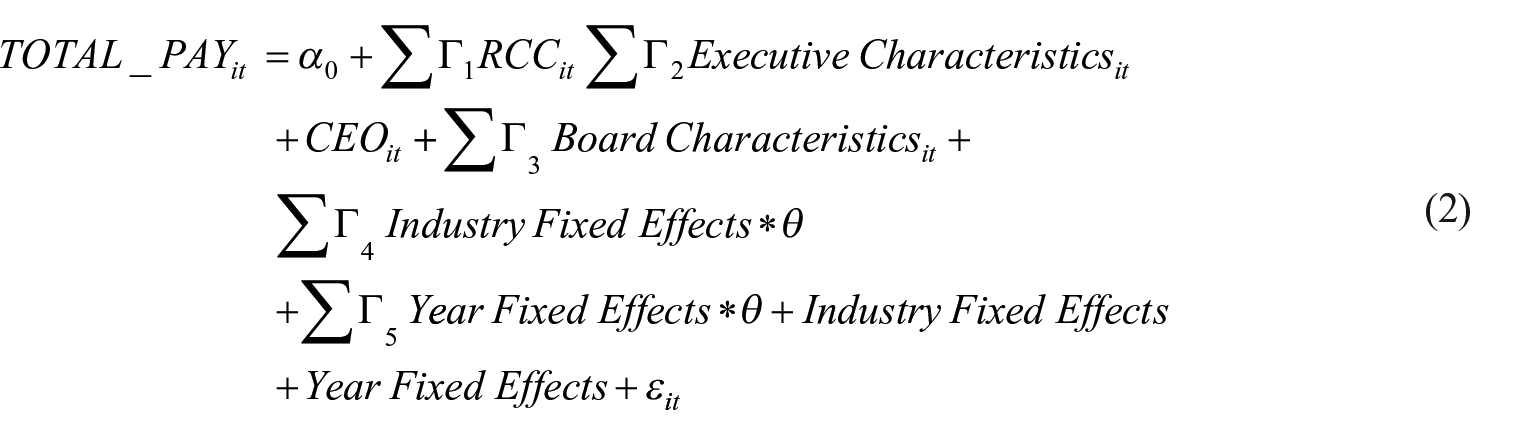
where θ indicates the set of first-step control variables, comprising ROA, FIRM_SIZE, GROWTH, and LIQUIDITY. The indicator variables for year and industry, along with interaction terms between each year and industry dummy variable and each of the first-step control variables, that is, θ are included in the model. 4
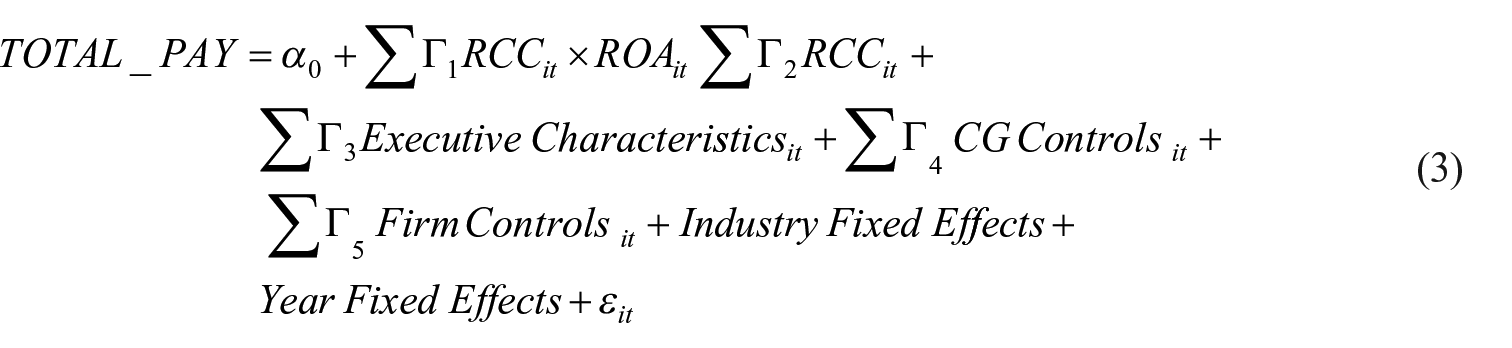
Next, we test the relations between RC characteristics and pay-performance sensitivities of the executives using equation (3) as follows
3.3. Variable measurement
3.3.1. CEO and CFO compensation
In equation (1), the dependent variable is the excess compensation of the CEO or CFO, calculated as the difference between the natural logarithm of the executive’s total compensation (TOTAL_PAY) and the industry median of the natural logarithm of executive total pay. Total compensation includes base salary, superannuation, fringe benefits, cash bonus, options and stocks (Cybinski and Windsor, 2013; Kent et al., 2018; Sun and Cahan, 2009). To account for differences in overall pay and responsibilities, separate estimations of excess compensation are conducted for CEOs and CFOs, using position-specific industry medians. In equations (2) and (3), the dependent variable is the natural logarithm of the total pay of the CEO or CFO. Pay-performance sensitivity uses firm performance which is proxied by ROA, measured as earnings before interest and taxes (EBIT) divided by total assets.
3.3.2. RC characteristics
Our independent variables of interest in equations (1) and (2) are the individual RC characteristics, and in equation (3), they are the individual RC characteristics and their interactions with firm performance. The individual RC characteristics include independence of the RC (RCI_D), measured as a dummy variable if the company follows ASX CGPR to have a majority of independent directors on the RC and 0 otherwise; independence of the RC chairperson (RCCHAIR_D), measured as a dummy variable taking a value of 1 if the chairperson of the RC is independent and 0 otherwise; committee size (RC_SIZE), measured as the number of directors on the RC; gender diversity (GENDER_D), measured as a dummy variable taking the value of 1 if the RC committee has at least one female director and 0 otherwise; senior directors (SENIOR), measured as the proportion of the RC comprised of directors with 10 or more years’ service with the current company; busy directors (BUSYDIR), calculated as the proportion of the RC comprised of directors who sit on boards of three or more other companies; current CEO director (INCEODIR_D), measured as a dummy variable taking a value of 1 if the CEO or managing director serves on the RC and 0 otherwise; CEO-appointed directors (APPOINT), measured as the proportion of the RC appointed by the current CEO; and external CEO directors (EXTCEODIR), calculated as the proportion of the RC who are CEOs of the other companies.
3.3.3. Control variables
The control variables used in this study include the following characteristics: executive-specific characteristics, corporate governance firm characteristics and industry.
Executive-specific characteristics include executive tenure (EXE_TEN), executive gender (EXE_GEN) and whether the executive is CEO or managing director (CEO). Longer tenure increases the executives’ influence on the RC and is associated with higher executive compensation (Kent et al., 2018; Kuo and Yu, 2014). Also, the CEO is expected to receive higher pay than the CFO.
We include several variables to control for other corporate governance characteristics known to influence CEO and CFO compensation: board size (BOD_SIZE), the proportion of independent board directors (BOD_IND), CEO duality (CEO_DUAL), institutional ownership (INS_OWN) and CEO links to other companies’ RCs (#CEO_OUT_RC). A larger and less independent board is less effective at monitoring managerial decisions, resulting in higher executive compensation (Appiah and Chizema, 2015; Armstrong et al., 2012; Kent et al., 2018). CEO duality may increase agency issues (Kent et al., 2018; Kuo and Yu, 2014; Sapp, 2008). Firms with higher outside ownership are more likely to have effective governance (Lim et al., 2007), and are more likely to experience monitoring of management and lower executive compensation. A CEO with more links to other companies, particularly by serving on their RCs, may have more influence over the design of his or her own remuneration. We follow Bose et al. (2022) in measuring this variable as the number of other organisations’ RC boards that the CEO serves on (Bose et al., 2022).
We include several variables in the equations to control for firm characteristics. Company accounting performance (ROA), company size (FIRM_SIZE) and growth opportunities (GROWTH) are controlled, as companies with higher performance are associated with higher executive compensation (Kent et al., 2018). Also, large companies and high-growth companies normally pay more to their top executives and have a less independent RC (Capezio et al., 2011; Daily et al., 1998; Guthrie et al., 2012; Sun and Cahan, 2009; Sun et al., 2009). We control for liquidity by including the liquidity ratio (LIQUIDITY) (Appiah and Chizema, 2015). In addition, to control for differences in CEO and CFO remuneration arrangements between industry sectors, we include industry dummy variables, based on two-digit GICS codes (Cybinski and Windsor, 2013; Kent et al., 2018; Sapp, 2008).
3.4. Descriptive statistics
Table 3 presents the descriptive statistics of all variables: 94% of RCs have a majority of independent directors, and 87% of RCs have an independent chairperson. On average, there are 3.45 directors on the RC, and 65% of RCs include at least one female director. 12% of RC directors have at least 10 years’ board experience with the company, 34% of RC directors have three or more directorships in other listed companies. 7% of firms have an external CEO in the RC which makes the average proportion of external CEOs around 2% across the sample. Two percent of our sample has CEOs who serve on their own RC, 5 and 43% is the average proportion of directors on the RC who are appointed during the tenure of the current CEO.
Descriptive statistics. This table presents descriptive statistics for the variables used in the study. All variables are defined in Appendix 1. The sample period is 2012 to 2022. All continuous variables are winsorised at the 1st and 99th percentile level.
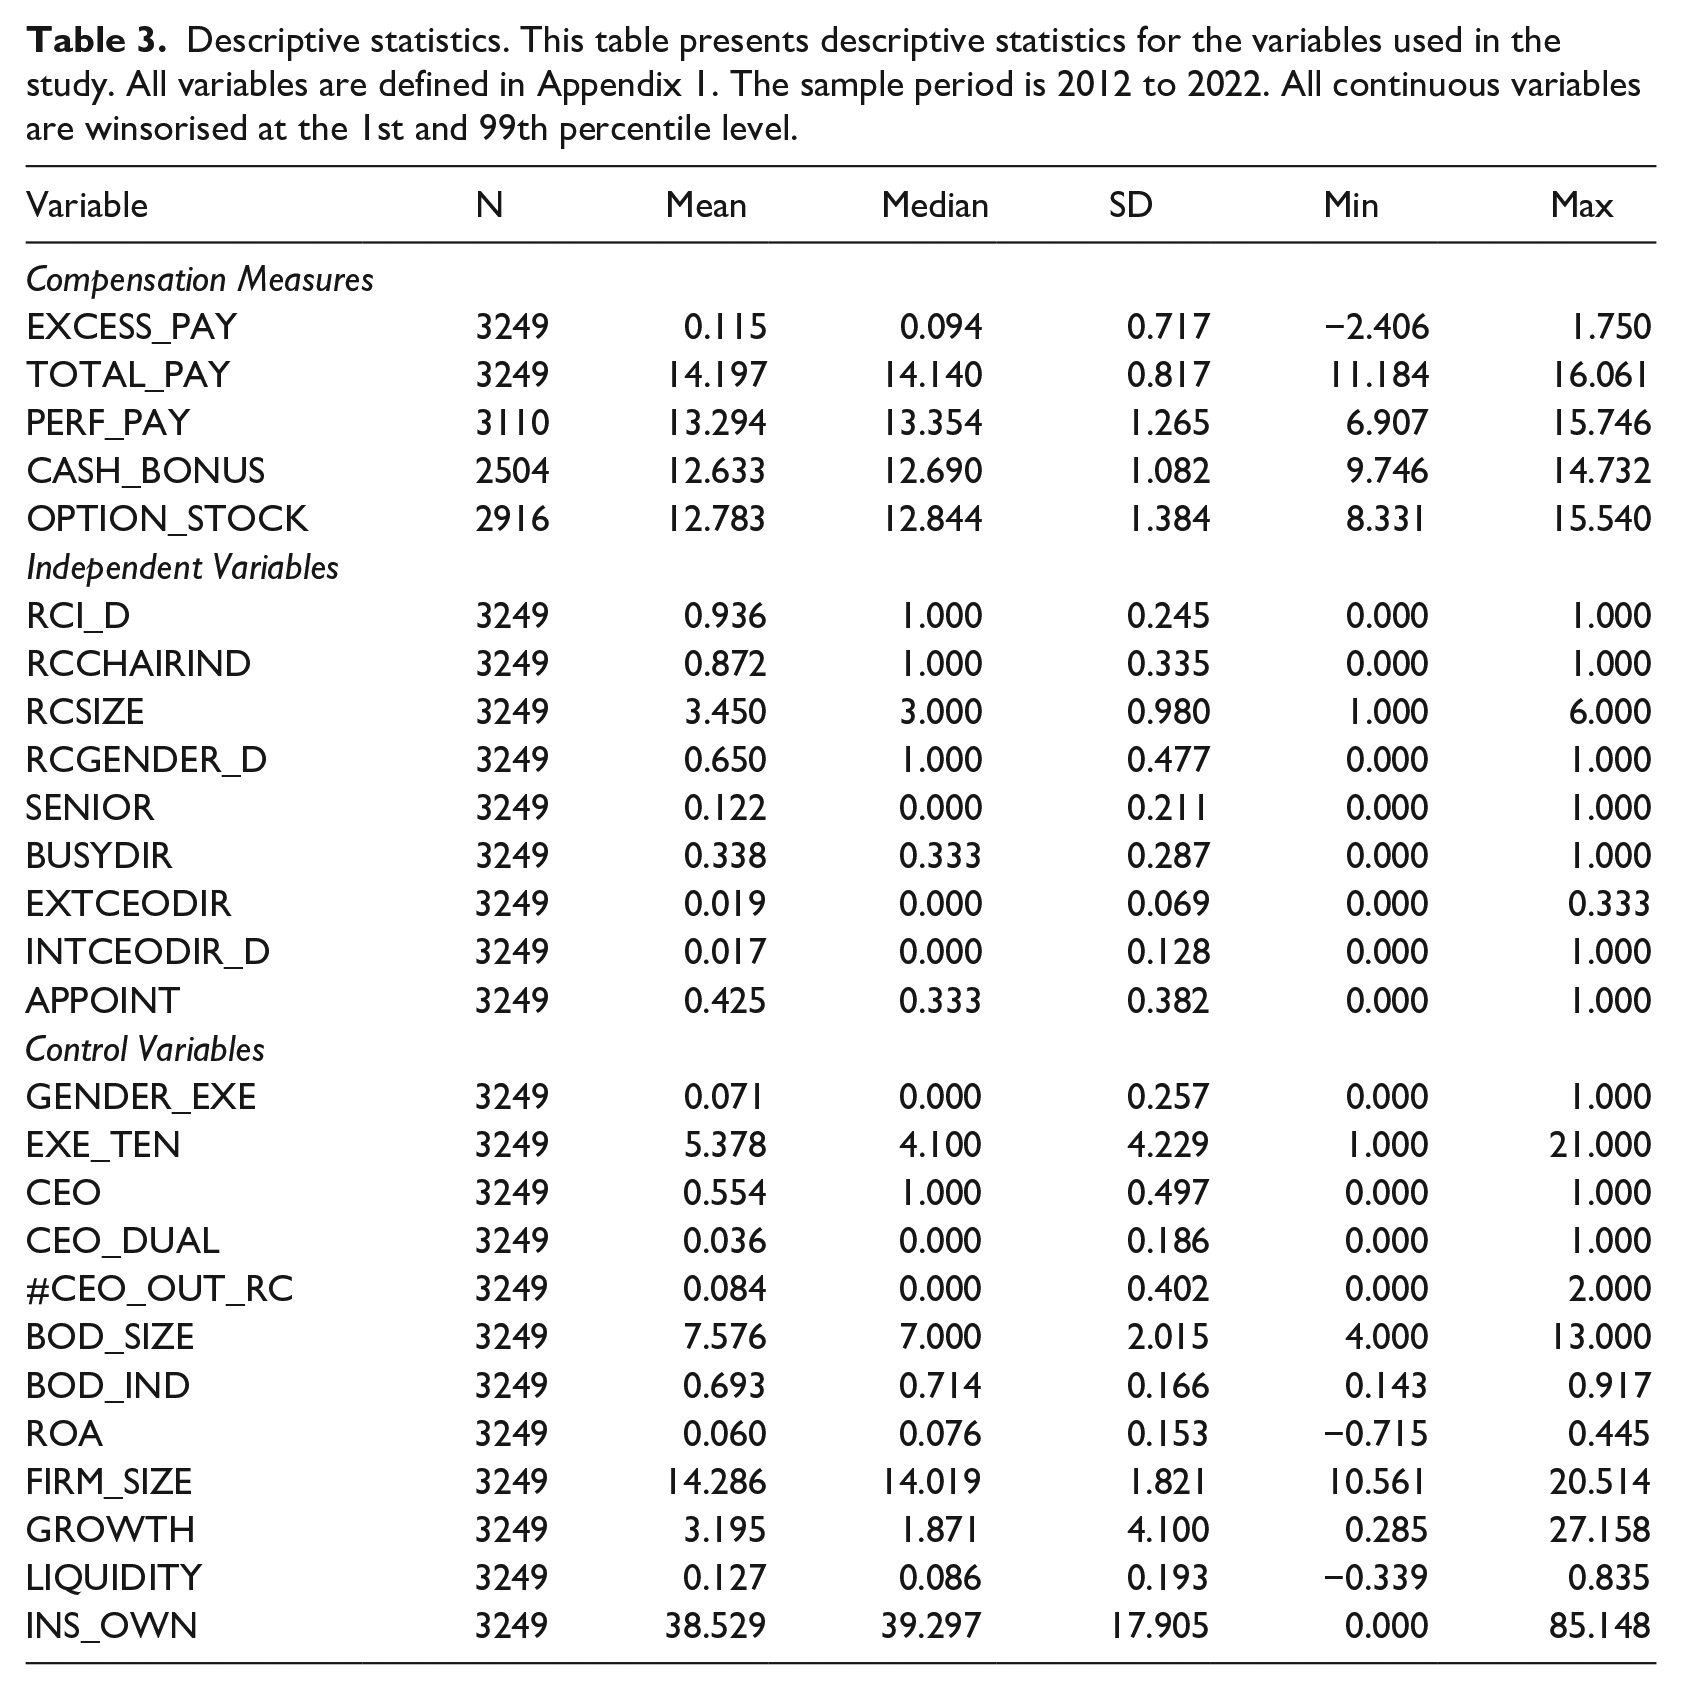
For the executive-specific characteristics, 7% of executives are female, 55% of executives are the CEO and the mean executive tenure is 5.4 years. For other corporate governance variables, the average board size is 7.6 directors and 69% of board directors are independent. On average, 4% of our sample firms have their CEOs serving as chairman of the board. The mean number of RCs that the CEO serves on is 0.084 and its median is 0, which indicates that a typical company has no links created by the CEO serving as a member of other companies’ RCs. On average, institutional ownership accounts for 39% of a company’s shares. For the firm characteristics control variables, on average, companies earn 6% ROA, the growth rate is 3.2% and the liquidity ratio is 0.13.
3.5. Correlations
Table 4 reports the correlation matrix for all variables. The correlations are all below 0.6, mitigating multicollinearity concerns. We use the variance inflation factors (VIFs) to further test for multicollinearity. We find that the highest value of executive total compensation is 2.87 and the median is 1.67. Thus, multicollinearity is not a significant issue in this analysis. In the univariate correlation tests, the size of the RC, whether a female is included in the RC, and busy directors on the RC have positive and significant correlations with excess pay, total pay and performance pay. However, RC independence has no significant correlation with excess pay.
Correlation matrix.
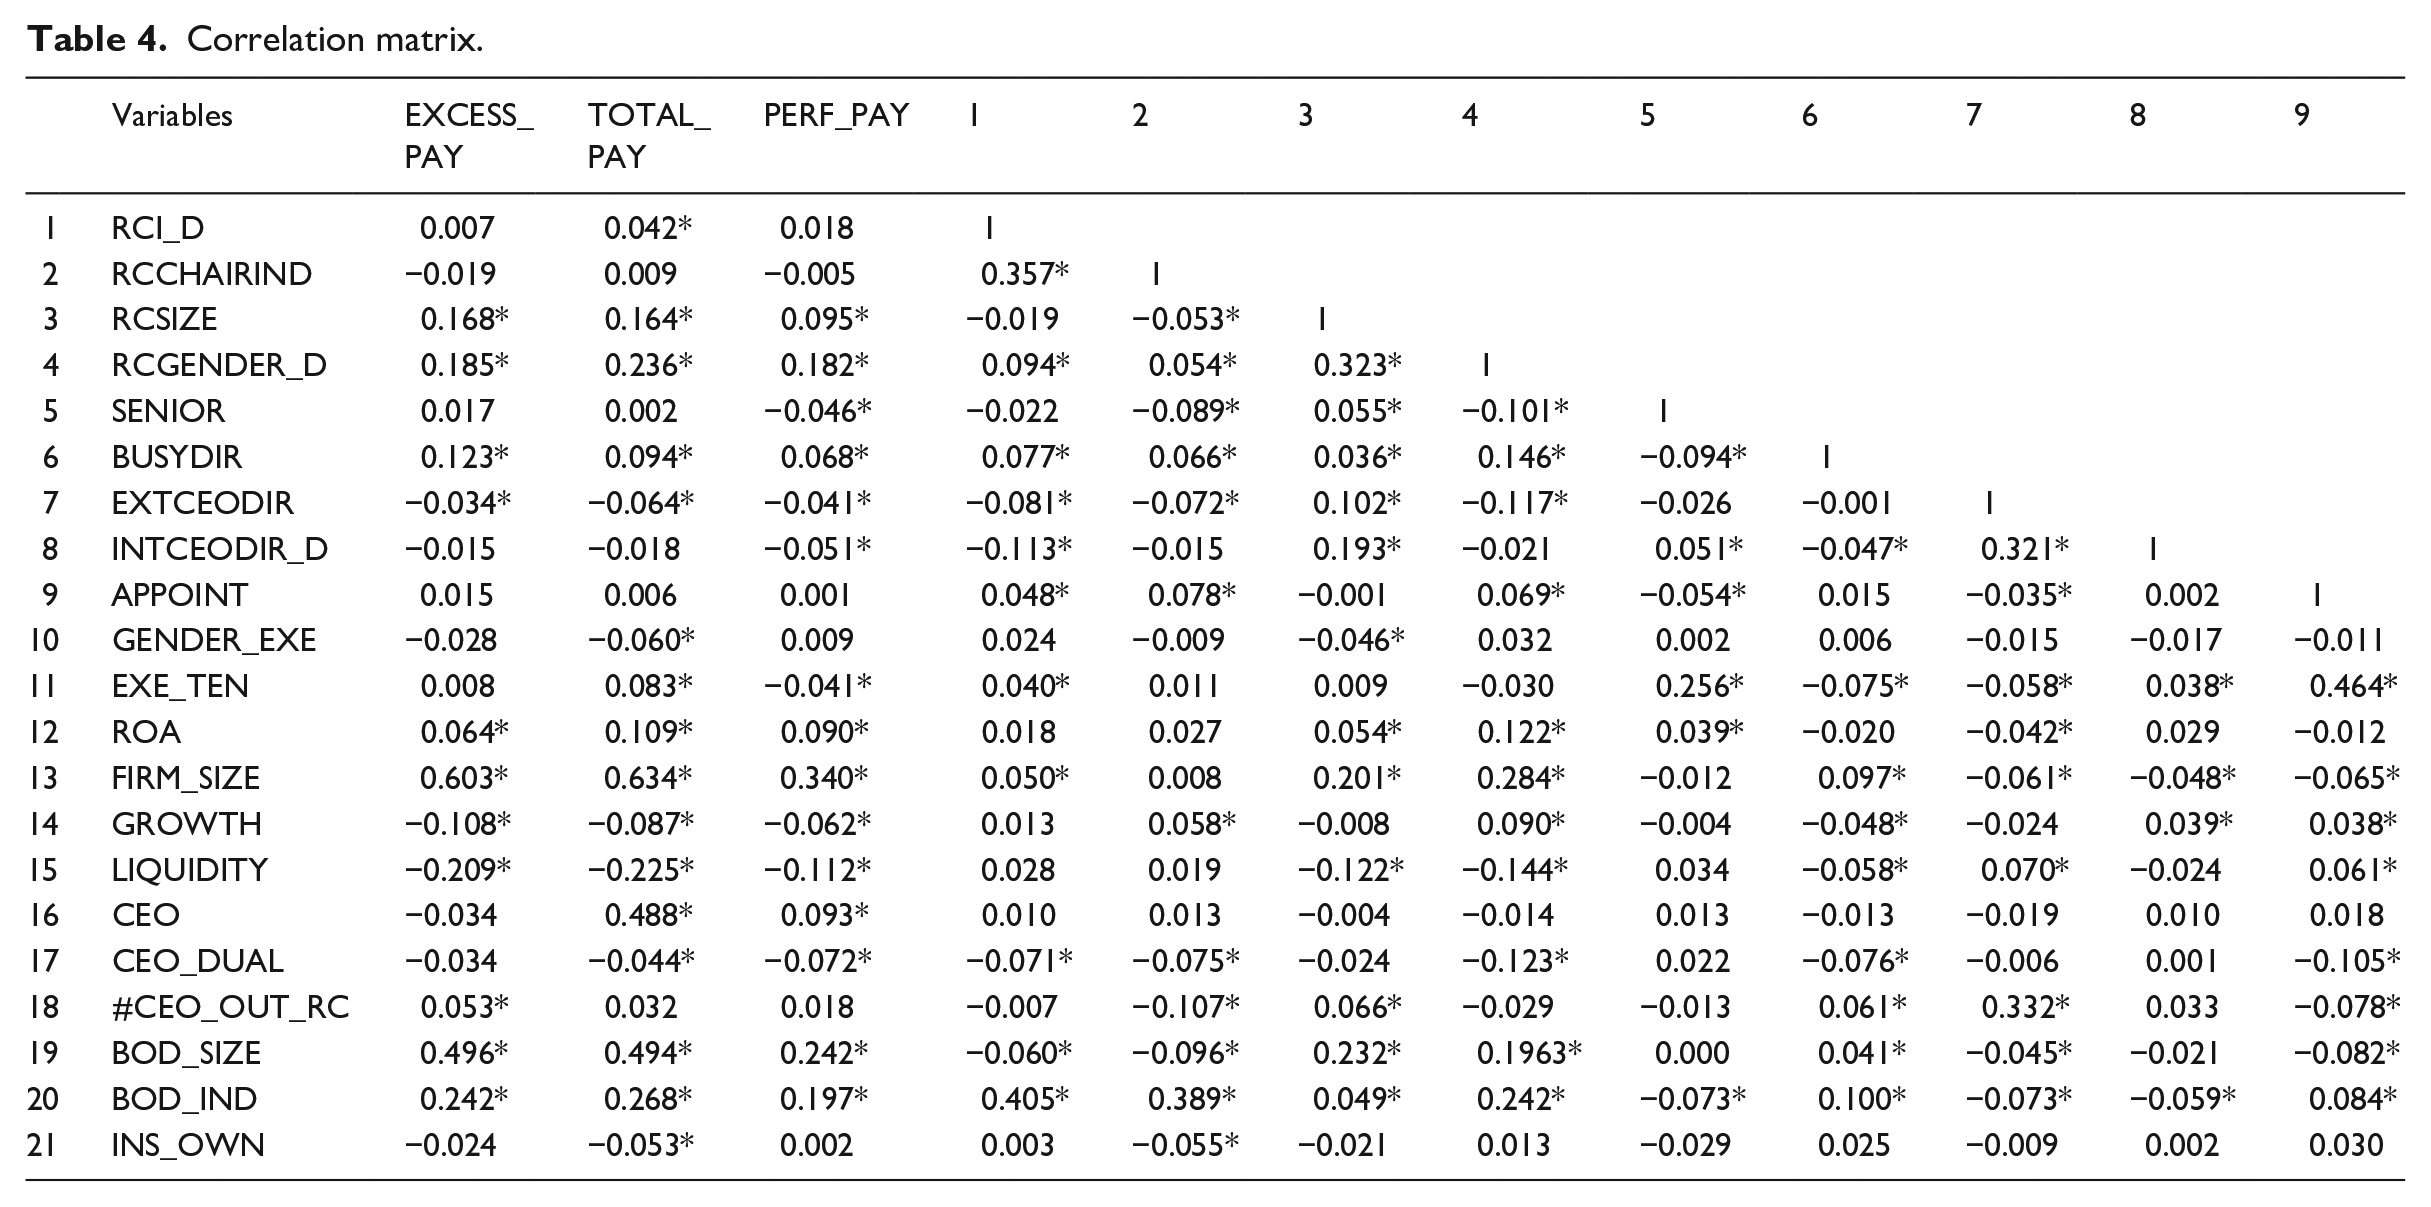
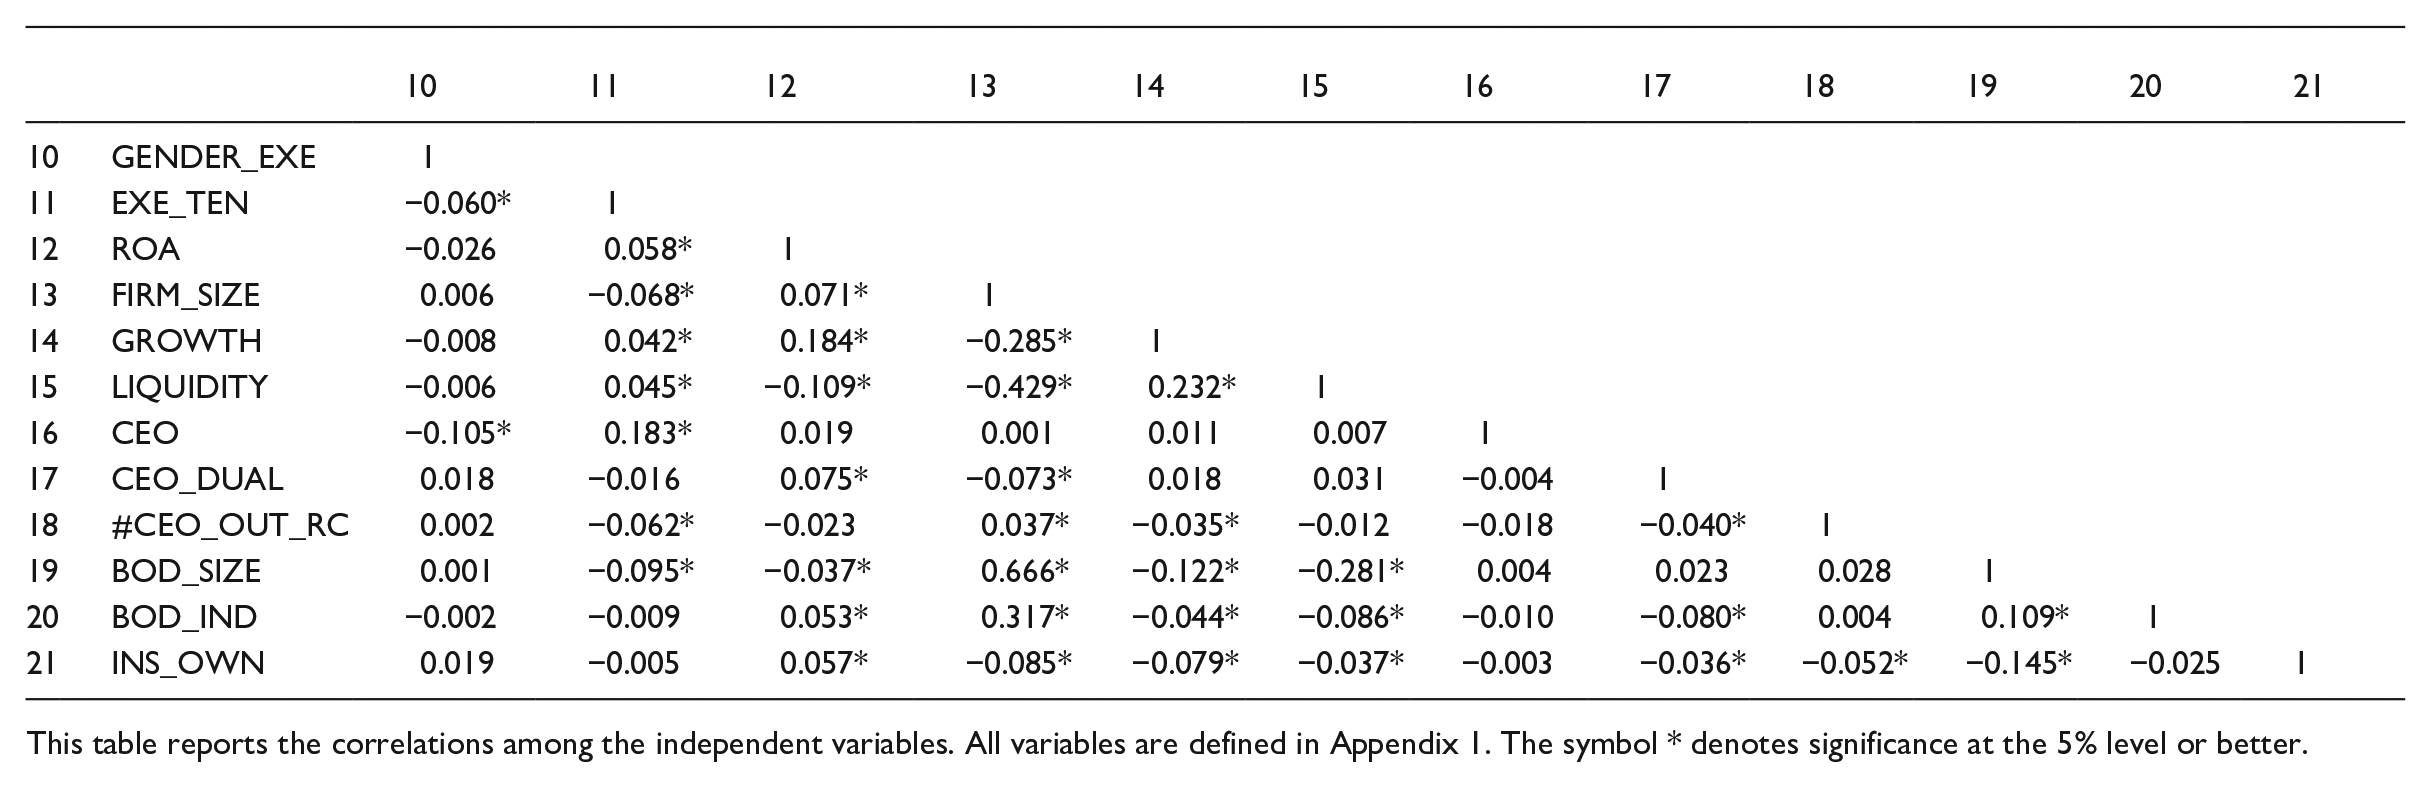
This table reports the correlations among the independent variables. All variables are defined in Appendix 1. The symbol * denotes significance at the 5% level or better.
4. Results
4.1. Excess pay
Our results testing equation (1), which is the effect of RC characteristics on excess CEO and CFO compensation, are presented in Table 5. We investigate whether different RC characteristics deter or induce excess pay of top executives. As previously explained, excess pay for CEOs and CFOs are calculated separately. Column (1) reports the results for the full sample combining CEOs and CFOs. In columns (2) and (3), we show the separate subsample tests for CEOs and CFOs, respectively.
Excess executive pay.
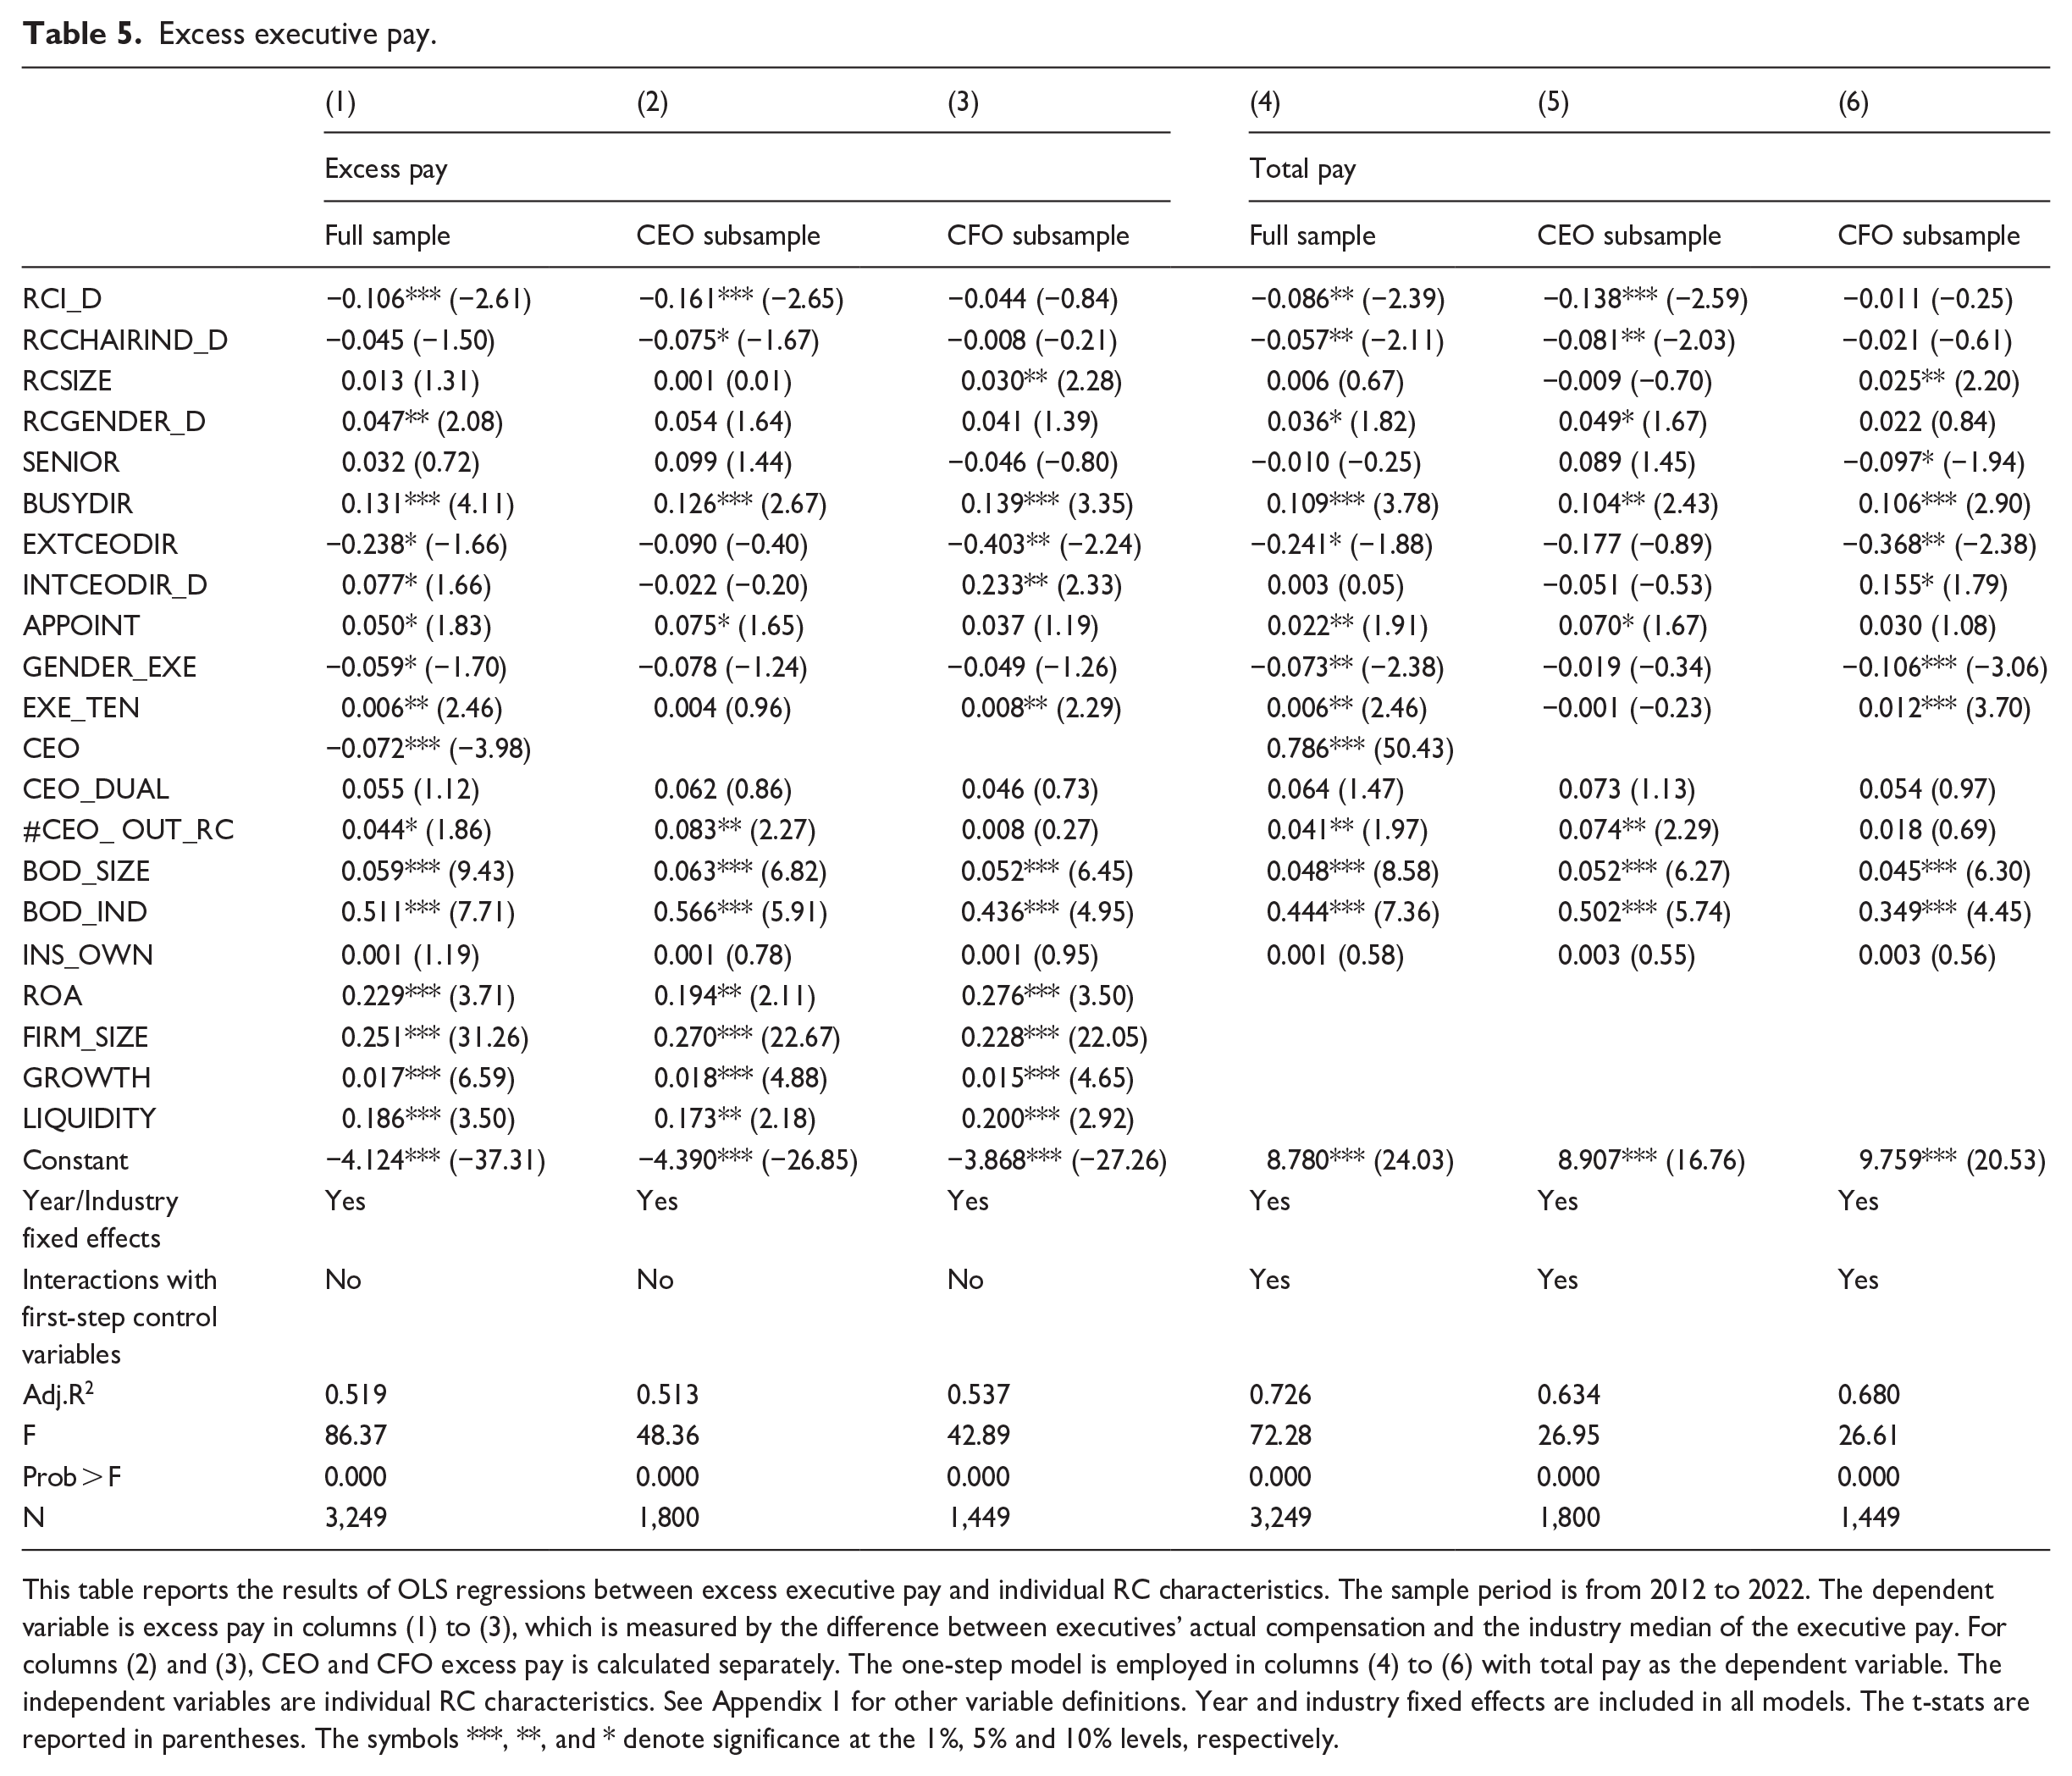
This table reports the results of OLS regressions between excess executive pay and individual RC characteristics. The sample period is from 2012 to 2022. The dependent variable is excess pay in columns (1) to (3), which is measured by the difference between executives’ actual compensation and the industry median of the executive pay. For columns (2) and (3), CEO and CFO excess pay is calculated separately. The one-step model is employed in columns (4) to (6) with total pay as the dependent variable. The independent variables are individual RC characteristics. See Appendix 1 for other variable definitions. Year and industry fixed effects are included in all models. The t-stats are reported in parentheses. The symbols ***, **, and * denote significance at the 1%, 5% and 10% levels, respectively.
In column (1), of the three RC characteristics specified in ASX CGPR, only RC independence (RCI_D) is significantly negatively related to excess pay. From the second group of characteristics that represent the attributes and experience of RC directors, we find that gender diversity and busy directors are more likely to approve excess pay, and external CEOs are more likely to reduce excess pay. A gender-diverse RC might not be effective in decreasing the excess pay as CEOs with gender-diverse boards are more powerful (Usman et al., 2018). The finding for the busy directors suggests that RC directors with multiple directorships have limited time to thoroughly assess the overall executive pay. This result is consistent with Pathan et al.’s (2019) study that director’s ‘busyness’ impairs the monitoring ability of directors. The finding for external CEOs indicates that an external CEO is an effective monitor on the RC who discourages the awarding of excess pay. This suggests that external CEOs may reflect their experience and knowledge in the design of executive remuneration, guarding against the awarding of pay to senior managers that is excessive compared with the common practices of peer firms. Both variables that measure the RC’s lack of independence from the CEO show a positive relation with excess executive pay. Excess payment can result from having a CEO sit on their own RC, and from having an RC comprised of directors mainly appointed during the current CEO’s term.
We conduct subsample tests to investigate the relations between RC characteristics and CEO and CFO separately. In columns (2) and (3), the results indicate that busy directors are associated with excess pay for both the CEO and the CFO. However, other RC characteristics exert their impact on only CEO or CFO excess pay. For example, less CEO excess pay is associated with RC independence and RC chair independence, and greater excess CEO pay is associated with more RC directors being appointed by the CEO. Less CFO excess pay is associated with external CEOs, and greater CFO excess pay is associated with RC size and having the current CEO on the RC. It is interesting to note that when a CEO sits on the RC, it is CFO excess pay rather than their own pay that is affected. Likewise, external CEOs have no impact on the CEO’s excess pay (consistent with the findings of Fich and White, 2005), but decrease the excess pay of the CFOs.
The results from the one-step model based on equation (2) are presented in columns (4) to (6). For brevity, we do not present the results for the interaction terms of indicators and first-step control variables. Overall, the findings from the one-step model are consistent with our OLS results shown in columns (1) to (3). Some exceptions include the coefficient of RCCHAIRIND_D becoming significantly negative for the full and CEO samples, indicating that having an independent chairperson on the RC may mitigate excess pay. However, the coefficient of INTCEODIR_D becomes insignificant for the full sample but remains marginally significant for the CFO subsample, indicating weak support for the influence of internal CEOs in excess pay. In all columns, most of the control variables have a significant association with the dependent variable of excess pay. For the executive level variables, a female executive and whether the executive is the CEO are negatively associated with excess pay while excess pay is higher when the executive has a long tenure in the company and when the CEO serves as an external RC member for one or more companies. Other firm characteristics in columns (1) to (3) and corporate governance variables in all columns, including ROA, firm size, growth, liquidity, board size and board independence, are positively significant determinants in the regressions.
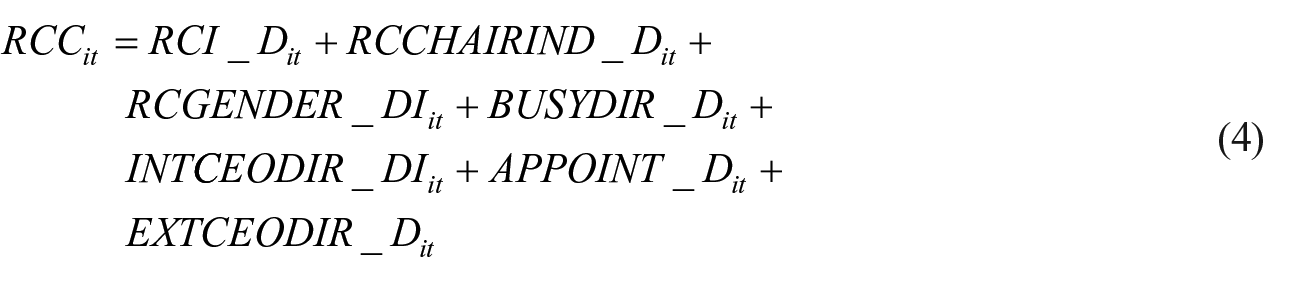
We use several approaches to determine whether our results might be driven by other firm characteristics that affect RC composition and executive compensation at the same time. First, we apply propensity score matching (PSM) to address potential endogeneity driving our results. For the PSM first-stage regression, a score is calculated based on whether a company has a better-quality RC or not. To do so, an RC index (RCC) is constructed, using the RC characteristics that are significantly associated with excess pay from the results shown in Table 5 for the whole sample in columns (1) and (4). These characteristics include RC independence (RCI_D), RC chair independence (RCCHAIRIND_D), RC gender diversity (RCGENDER_D), directors with multiple directorships (BUSYDIR), CEOs sitting on the RC (INTCEODIR_D), CEO-appointed directors (APPOINT), and external CEOs (EXTCEODIR). We also consider the signs of the variables in constructing the index. For example, the impacts of RC gender diversity, busy directors and CEO-appointed directors indicate a positive association with the level of excess pay. Therefore, these continuous variables are inversed and converted into dummy variables RCGENDER_D, BUSYDIR_D and APPOINT_D respectively, being coded as 1 if they are less than their own median value in each year and 0 otherwise. For the RCGENDER_D and INTCEODIR_D variables, we create inverse variables, RCGENDER_D1 and INTCEODIR_D1. These variables have the value of 1 if the RC does not have a female director or if the CEO does not sit on the RC committee, and 0 otherwise. The remaining two variables (RCI_D and EXTCEODIR) have negative associations with excess pay, which demonstrate that they effectively restrain excessive executive compensation. We create a dummy variable EXTCEODIR_D by assigning the value of 1 if the RC has an external CEO as a director and 0 otherwise. Equation (4) shows how the index is constructed
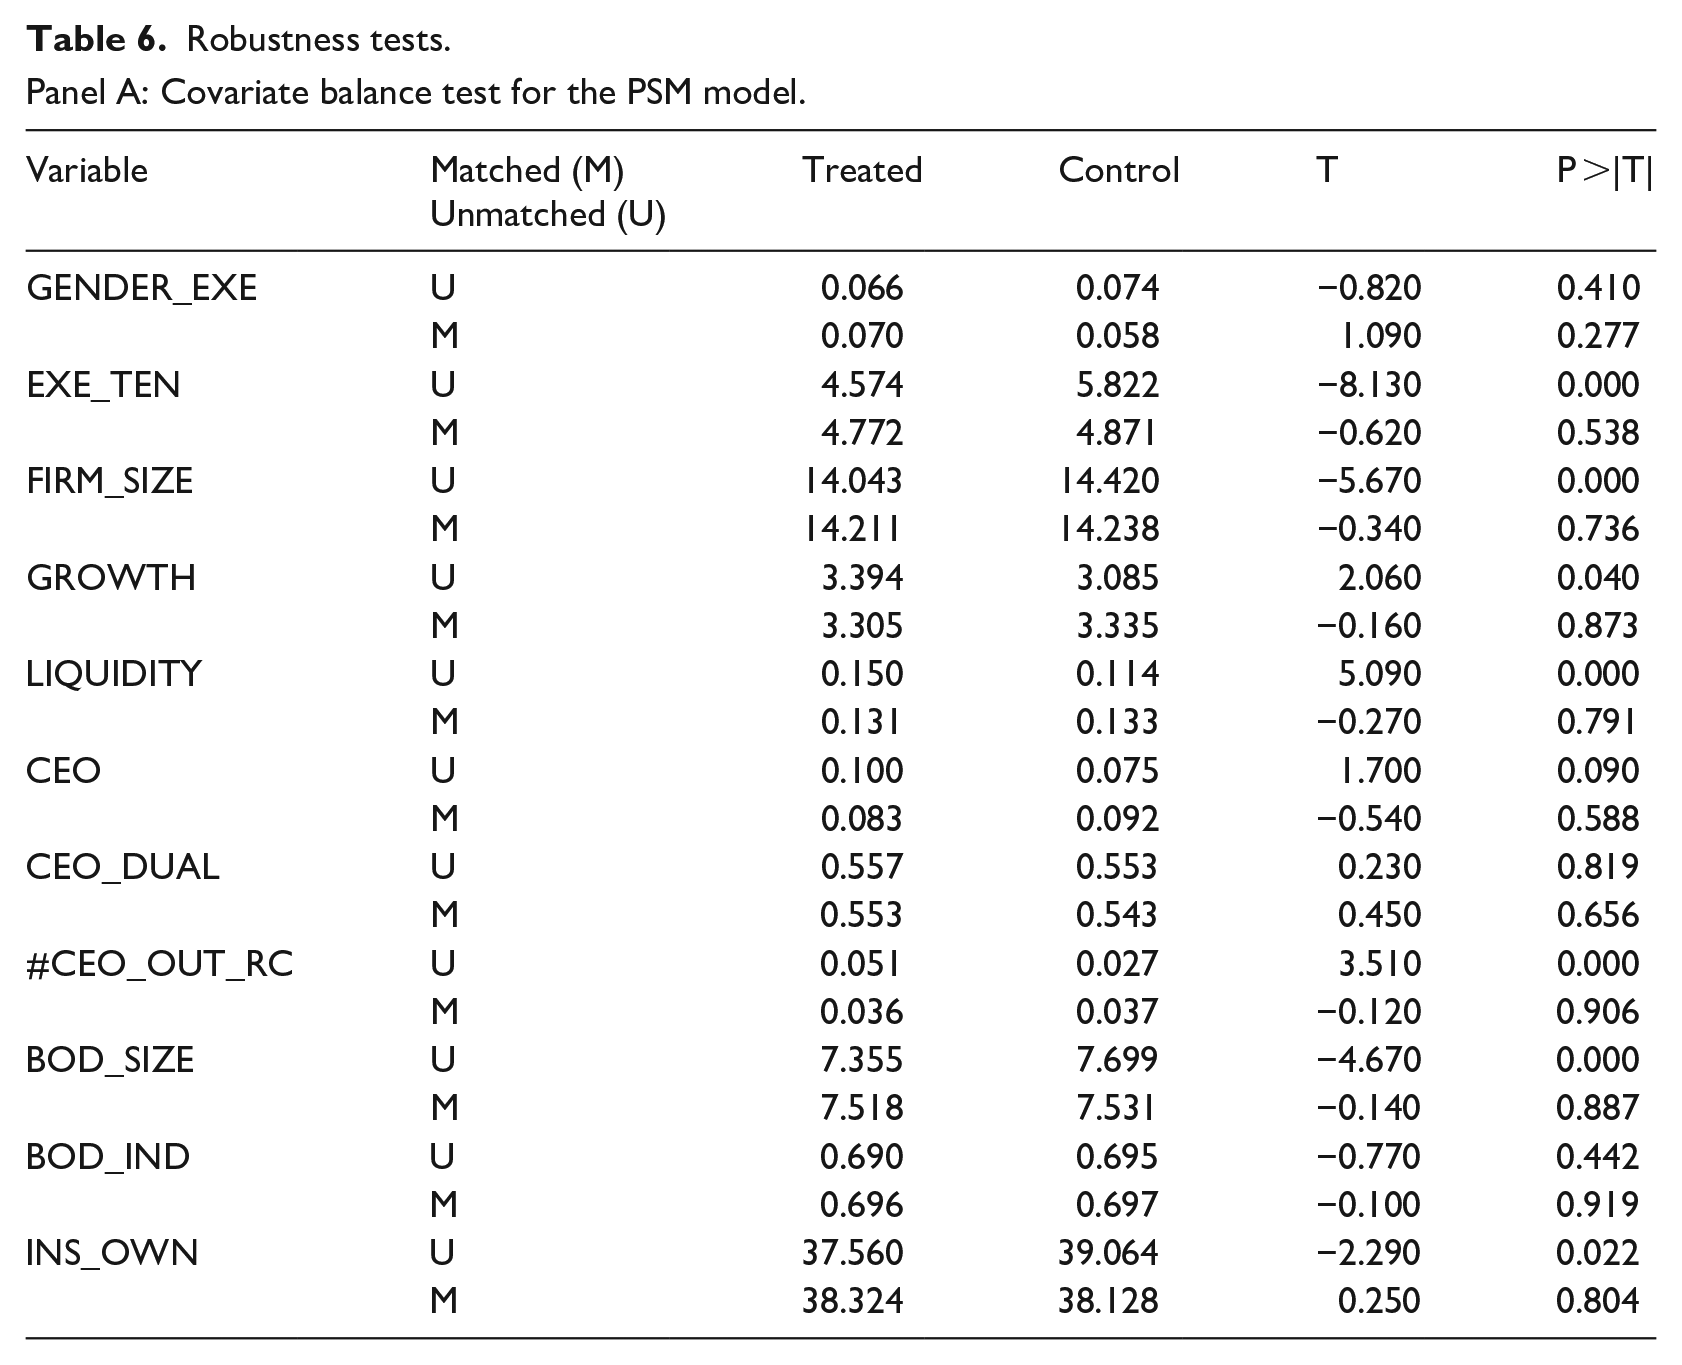
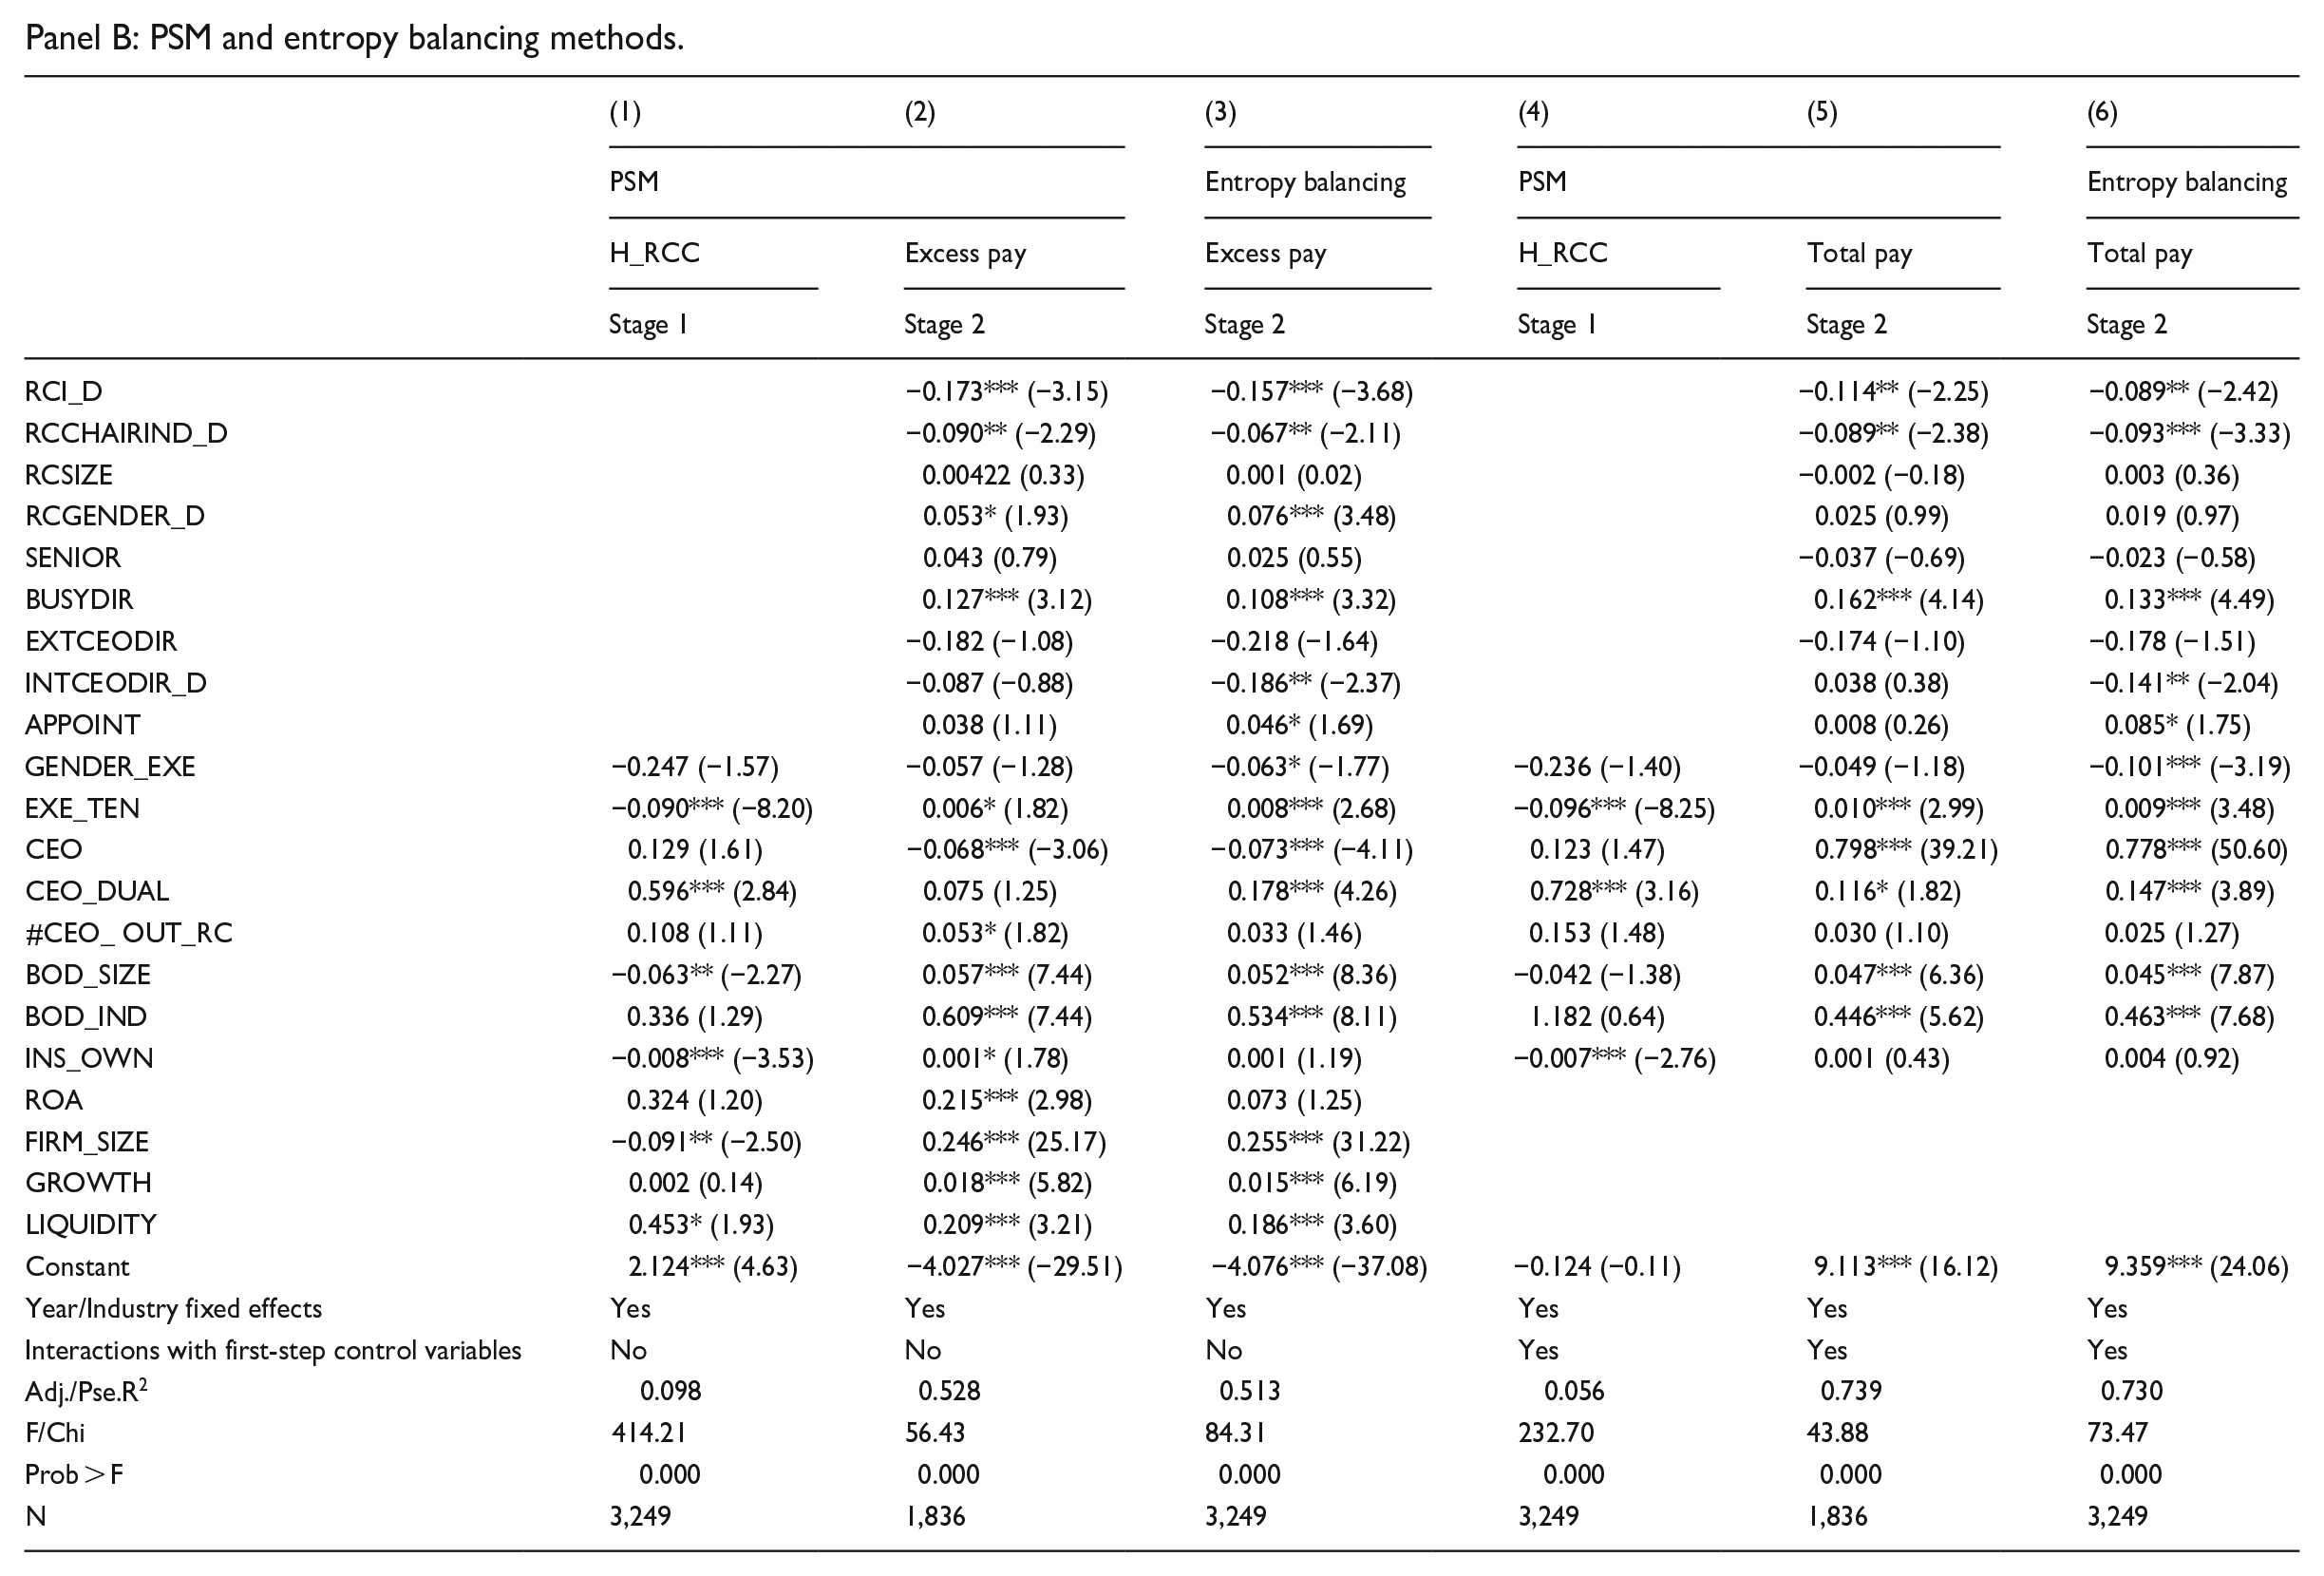
In our matching process, we apply a calliper of 0.05 with a non-replacement condition, meaning that each control firm is used only once for matching. Panel A displays the covariate balance test results for control and treatment groups before and after matching. All 11 control variables between the two groups are well matched with none of the differences being statistically significant, indicating the success of our matching procedure. Panel B of Table 6 presents the results of using the PSM and entropy matching approaches. Column (1) depicts the logit regression results for a H_RCC dummy which has a value of 1 for companies having RCC index levels higher than the yearly median. Column (2) presents the result for the second stage, focusing on the effect of individual RC characteristics on excess pay. Consistent with the findings presented in Table 5, these results show that RC committees associated with less excess pay are independent and have independent RC chairs, at least one female director, and busy directors. However, when the CEO or an external CEO sits on the RC, or when directors have connections with the CEO, the RC has weaker or no impact on excessive executives’ remuneration payments. The results from entropy balancing in column (3) are qualitatively consistent with those in column (2). In the case of column (3), two out of the three variables specified by the CGPR, namely, RC independence and RC chair independence, are linked to lower excess pay.
Robustness tests.
Panel A: Covariate balance test for the PSM model.
Panel B: PSM and entropy balancing methods.
Panel C: Lagged control variables.
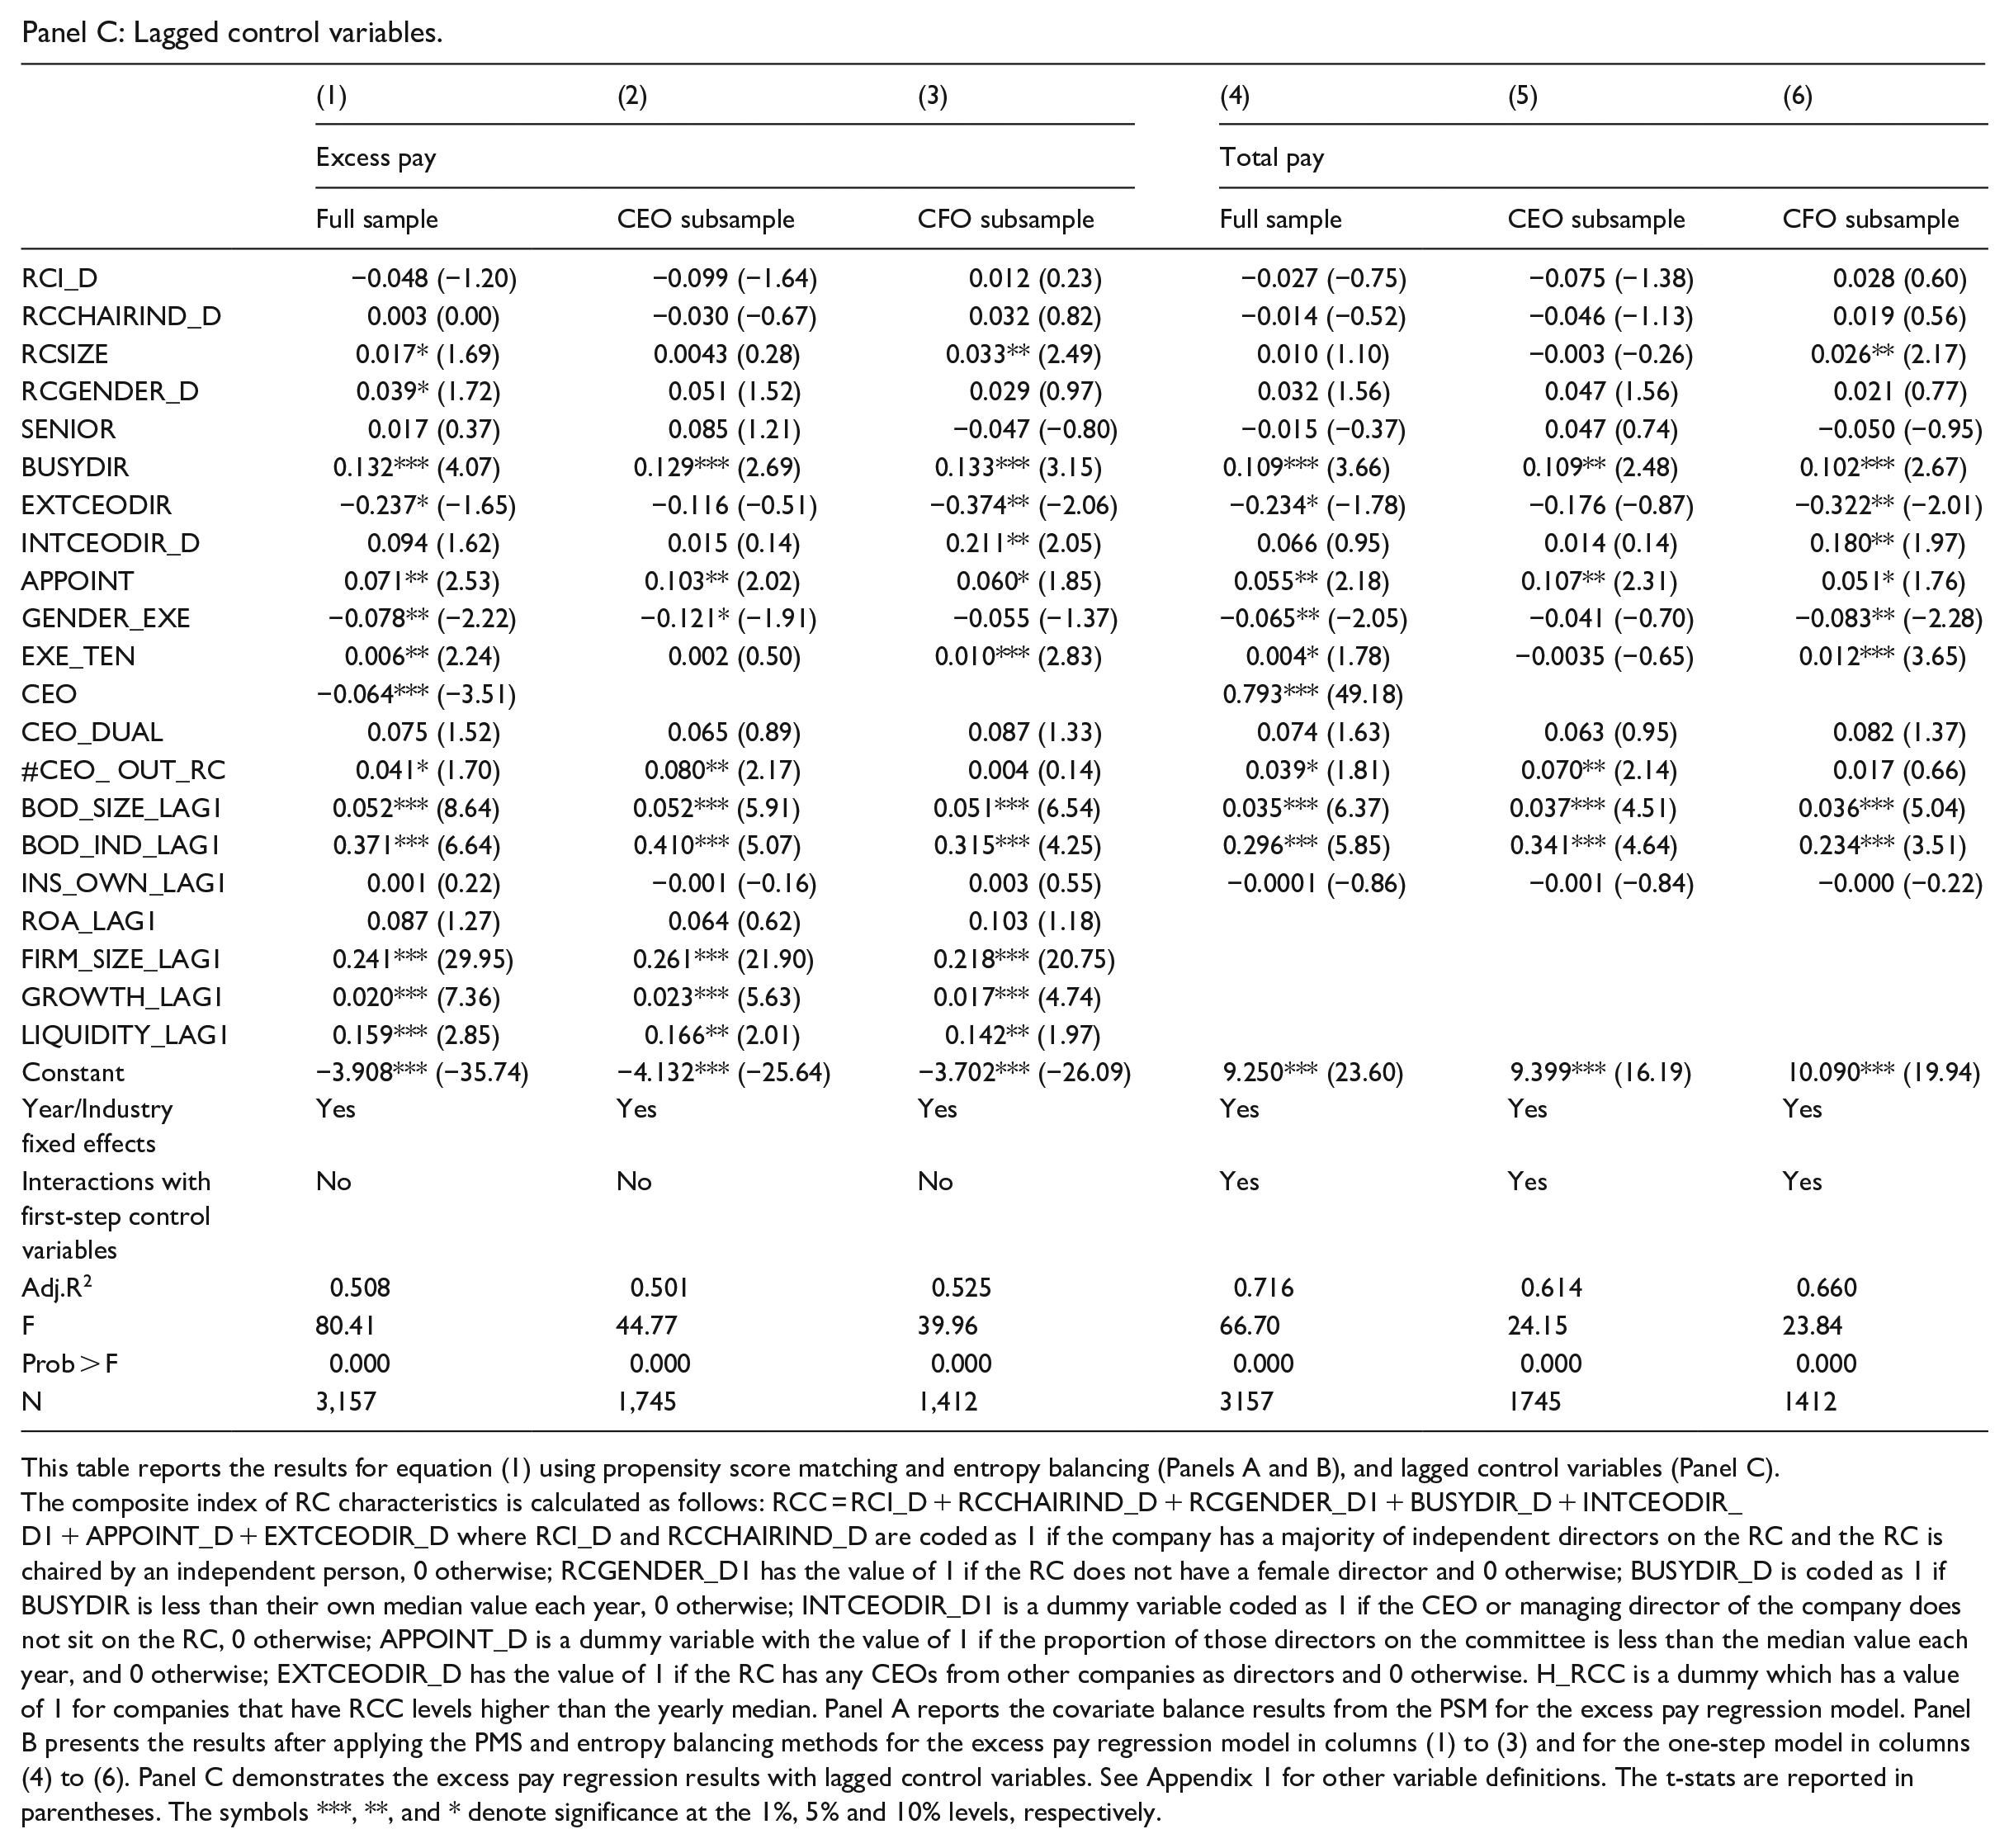
This table reports the results for equation (1) using propensity score matching and entropy balancing (Panels A and B), and lagged control variables (Panel C). The composite index of RC characteristics is calculated as follows: RCC = RCI_D + RCCHAIRIND_D + RCGENDER_D1 + BUSYDIR_D + INTCEODIR_D1 + APPOINT_D + EXTCEODIR_D where RCI_D and RCCHAIRIND_D are coded as 1 if the company has a majority of independent directors on the RC and the RC is chaired by an independent person, 0 otherwise; RCGENDER_D1 has the value of 1 if the RC does not have a female director and 0 otherwise; BUSYDIR_D is coded as 1 if BUSYDIR is less than their own median value each year, 0 otherwise; INTCEODIR_D1 is a dummy variable coded as 1 if the CEO or managing director of the company does not sit on the RC, 0 otherwise; APPOINT_D is a dummy variable with the value of 1 if the proportion of those directors on the committee is less than the median value each year, and 0 otherwise; EXTCEODIR_D has the value of 1 if the RC has any CEOs from other companies as directors and 0 otherwise. H_RCC is a dummy which has a value of 1 for companies that have RCC levels higher than the yearly median. Panel A reports the covariate balance results from the PSM for the excess pay regression model. Panel B presents the results after applying the PMS and entropy balancing methods for the excess pay regression model in columns (1) to (3) and for the one-step model in columns (4) to (6). Panel C demonstrates the excess pay regression results with lagged control variables. See Appendix 1 for other variable definitions. The t-stats are reported in parentheses. The symbols ***, **, and * denote significance at the 1%, 5% and 10% levels, respectively.
The one-step model is also re-estimated using both PSM and entropy matching approaches. For PSM, to match control variables across the first-stage and the second-stage regressions, we adopt the same control variables used in the one-step model, including interactions between year and industry dummies and first-step control variables, to estimate the RC index (RCC) in the first-stage regression. The results presented in columns (4) to (6) are consistent with those reported in columns (1) to (3) except for the insignificant coefficient of RCGENDER_D.
We conduct several robustness tests. We replace our concurrent control variables with 1-year lagged control variables, to rule out this form of endogeneity concern. A further 92 firm-year observations are lost due to the requirement of lagged control variables. The results in Panel C of Table 6 are mostly consistent with Table 5, although RC independence is insignificant, as is chair independence which was significant for the CEO subsample. For the whole sample, RC size is significantly positive and the CEO sitting on the RC is insignificant.
Next, we estimate excess pay following a traditional two-stage procedure used in Core et al. (2008). In the first-stage regression, we estimate the expected pay level with four firm characteristics, including ROA, FIRM_SIZE, GROWTH and LIQUIDITY, consistent with the first-step control variables used in equation (2), and industry- and year-fixed effects. In the second-stage regression, we re-run the regression model in equation (1) using the residual estimated in the first stage as the dependent variable. The results from the two-stage regression analysis (untabulated) are consistent with our main findings presented in Table 5.
Finally, we control for the effect of CEO power on RC effectiveness. Although we do not directly compare CEO and CFO pay, the size of the pay gap between the CEO and other senior executives may indicate the level of CEO power. We use the measure of CEO Pay Slice, that is, the fraction of the aggregated total compensation of top executives that is paid to the CEO, to capture rents acquired by the CEO because of agency problems (Bebchuk et al., 2011). In our study, we calculate the CEO pay slice as a fraction of the total compensation of the two top executives, that is, the CEO and the CFO. Our results (untabulated) remain robust after controlling for this additional variable. 6
4.2. Pay-performance sensitivity
The previous section established that certain RC characteristics are positively or negatively associated with excess pay, measured as pay above industry median for the top executive. However, higher pay is not necessarily a bad outcome for stakeholders. For the individual firm and its executives, higher pay may be justified by higher firm performance. It may represent the price of talent at the top level. To further investigate whether certain RC characteristics are associated with justifiable contracts for top executive talent, we examine the link between different RC characteristics and pay-performance sensitivity for the firm, as modelled in equation (3). The results are presented in Table 7. Column (1) reports the results for the full sample test, and columns (2) and (3) show the results for subsample tests for CEOs and CFOs, respectively. Columns (4) and (5) report the results for the full sample using the propensity score matching method and the entropy balancing method, respectively.
Pay-performance sensitivity.
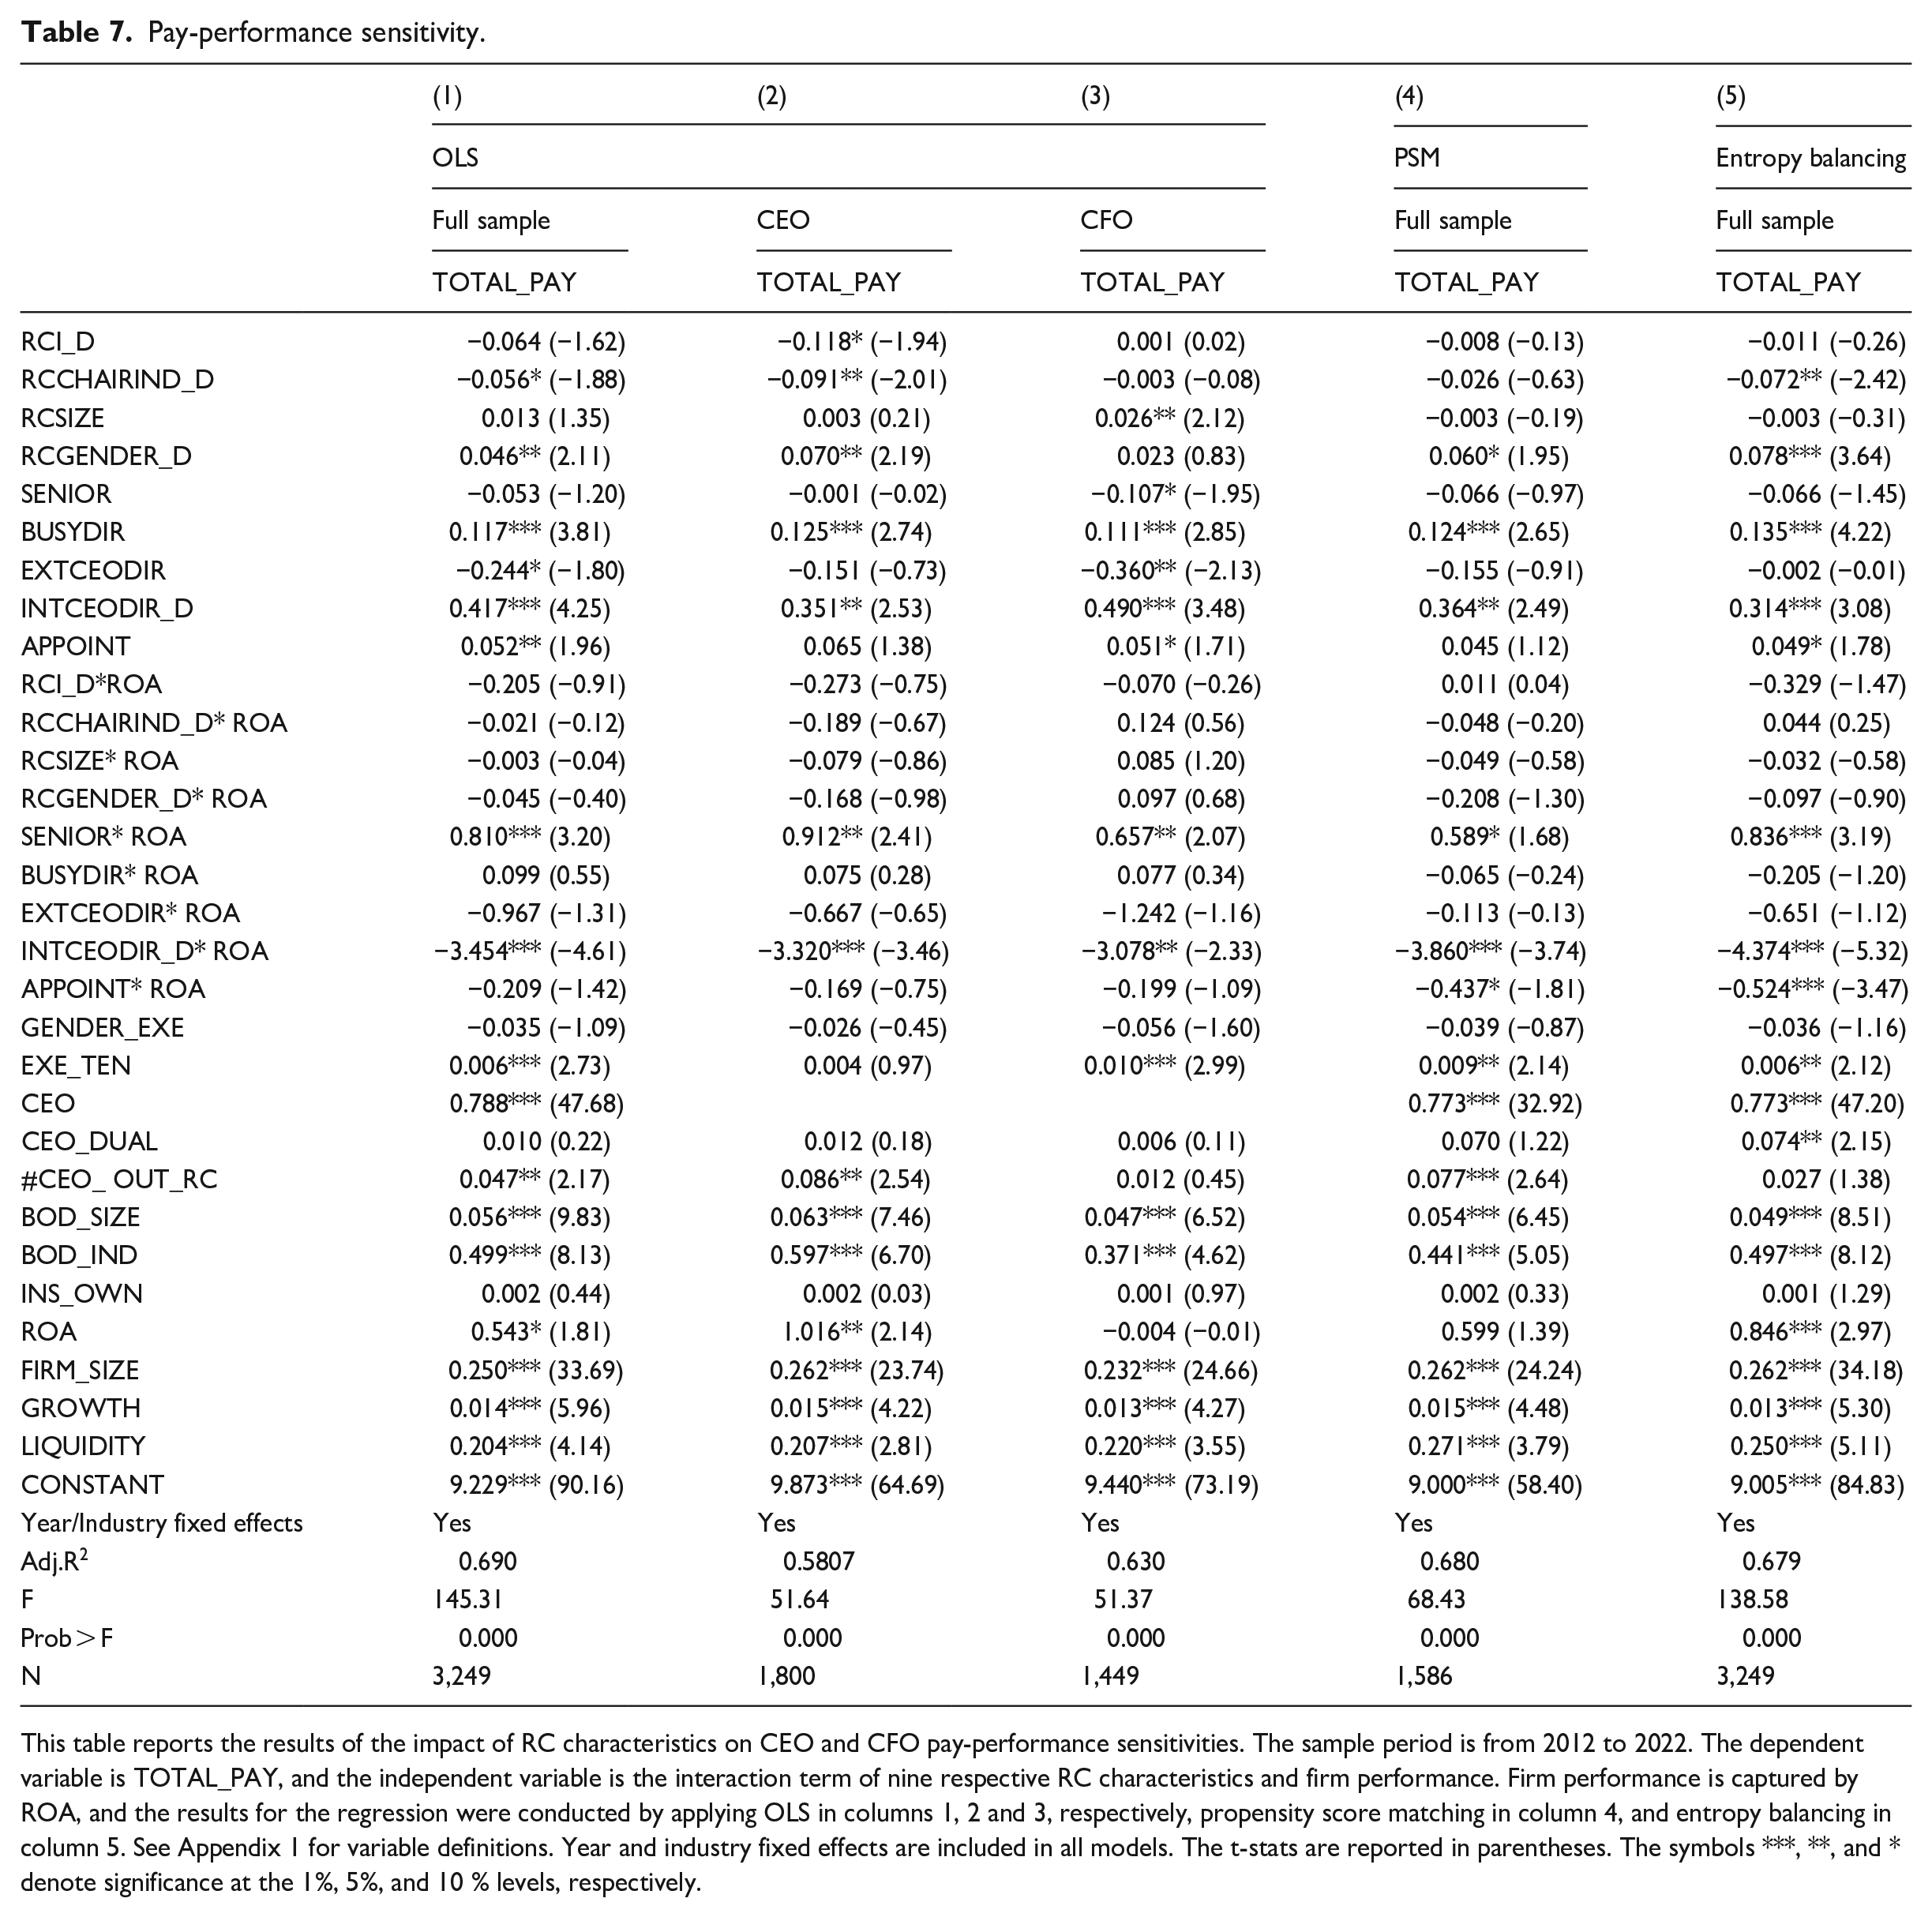
This table reports the results of the impact of RC characteristics on CEO and CFO pay-performance sensitivities. The sample period is from 2012 to 2022. The dependent variable is TOTAL_PAY, and the independent variable is the interaction term of nine respective RC characteristics and firm performance. Firm performance is captured by ROA, and the results for the regression were conducted by applying OLS in columns 1, 2 and 3, respectively, propensity score matching in column 4, and entropy balancing in column 5. See Appendix 1 for variable definitions. Year and industry fixed effects are included in all models. The t-stats are reported in parentheses. The symbols ***, **, and * denote significance at the 1%, 5%, and 10 % levels, respectively.
The results in column (1) show that having senior directors on the RC increases the pay-performance sensitivity, while having a CEO on the committee is negatively related to pay-performance sensitivity. Specifically, the presence of senior RC members is associated with the total pay of top executives being more sensitive to firm performance, as demonstrated in the significantly positive coefficient for the interaction term, SENIOR* ROA. However, having the serving CEO on the RC results in the pay of the CEO or CFO being less tied to firm performance, indicating that this characteristic can compromise the RC’s effectiveness. In the subsample test, we find that having senior directors on the RC continues to affect pay-performance sensitivity for both the CEO and CFO subsamples. Furthermore, the results in columns (4) and (5) are consistent with those in column (1). We also note that the coefficient for CEO-appointed directors becomes negatively significant, which is consistent with our findings reported in Table 5 that having CEO-appointed directors on the RC is not effective for the design of executive remuneration compensation packages.
Contrary to our expectations, we note that none of the three variables specified by the CGPR, RC and chair independences and committee size, are statistically significant in any of the columns. These characteristics of the RC’s form are explicitly mentioned in the CGPR to describe the preferred calibre of an RC. The CGPR characteristics include having at least three members, the majority of whom are independent directors, and appointing an independent director as chair. However, we cannot find evidence that these characteristics impact the relation between firm performance and top executives’ remuneration, indicating that they are not successful in aligning the interests of top executives with those of stakeholders. We also note that the RC chair independence variable itself has a negative association with total pay. In the following section, we further examine the individual components of the compensation structure and their relations with various RC characteristics.
As for Tables 5 and 6, a similar set of control variables have significant associations with top executive total pay. Firm size, growth, liquidity, board size, board independence and ROA are all positively significant determinants in all regressions. For these regressions, whether the executive is the CEO and how long the position has been held have significant and positive associations with total compensation, which means that CEOs receive a higher level of compensation than CFOs, and longer executive tenure is associated with higher compensation.
4.3. Pay components
In sensitivity tests, we estimate equation (1) using four different dependent variables in separate analyses: natural logarithms of total compensation (TOTAL_PAY), performance-based pay (PERF_PAY) and two components of performance-based pay: cash bonuses (CASH_BONUS) and stocks and options (OPTION_STOCK). The results are reported in Table 8. We test whether different RC characteristics deter or induce the inclusion of various components of top executives’ pay.
Component of total pay.
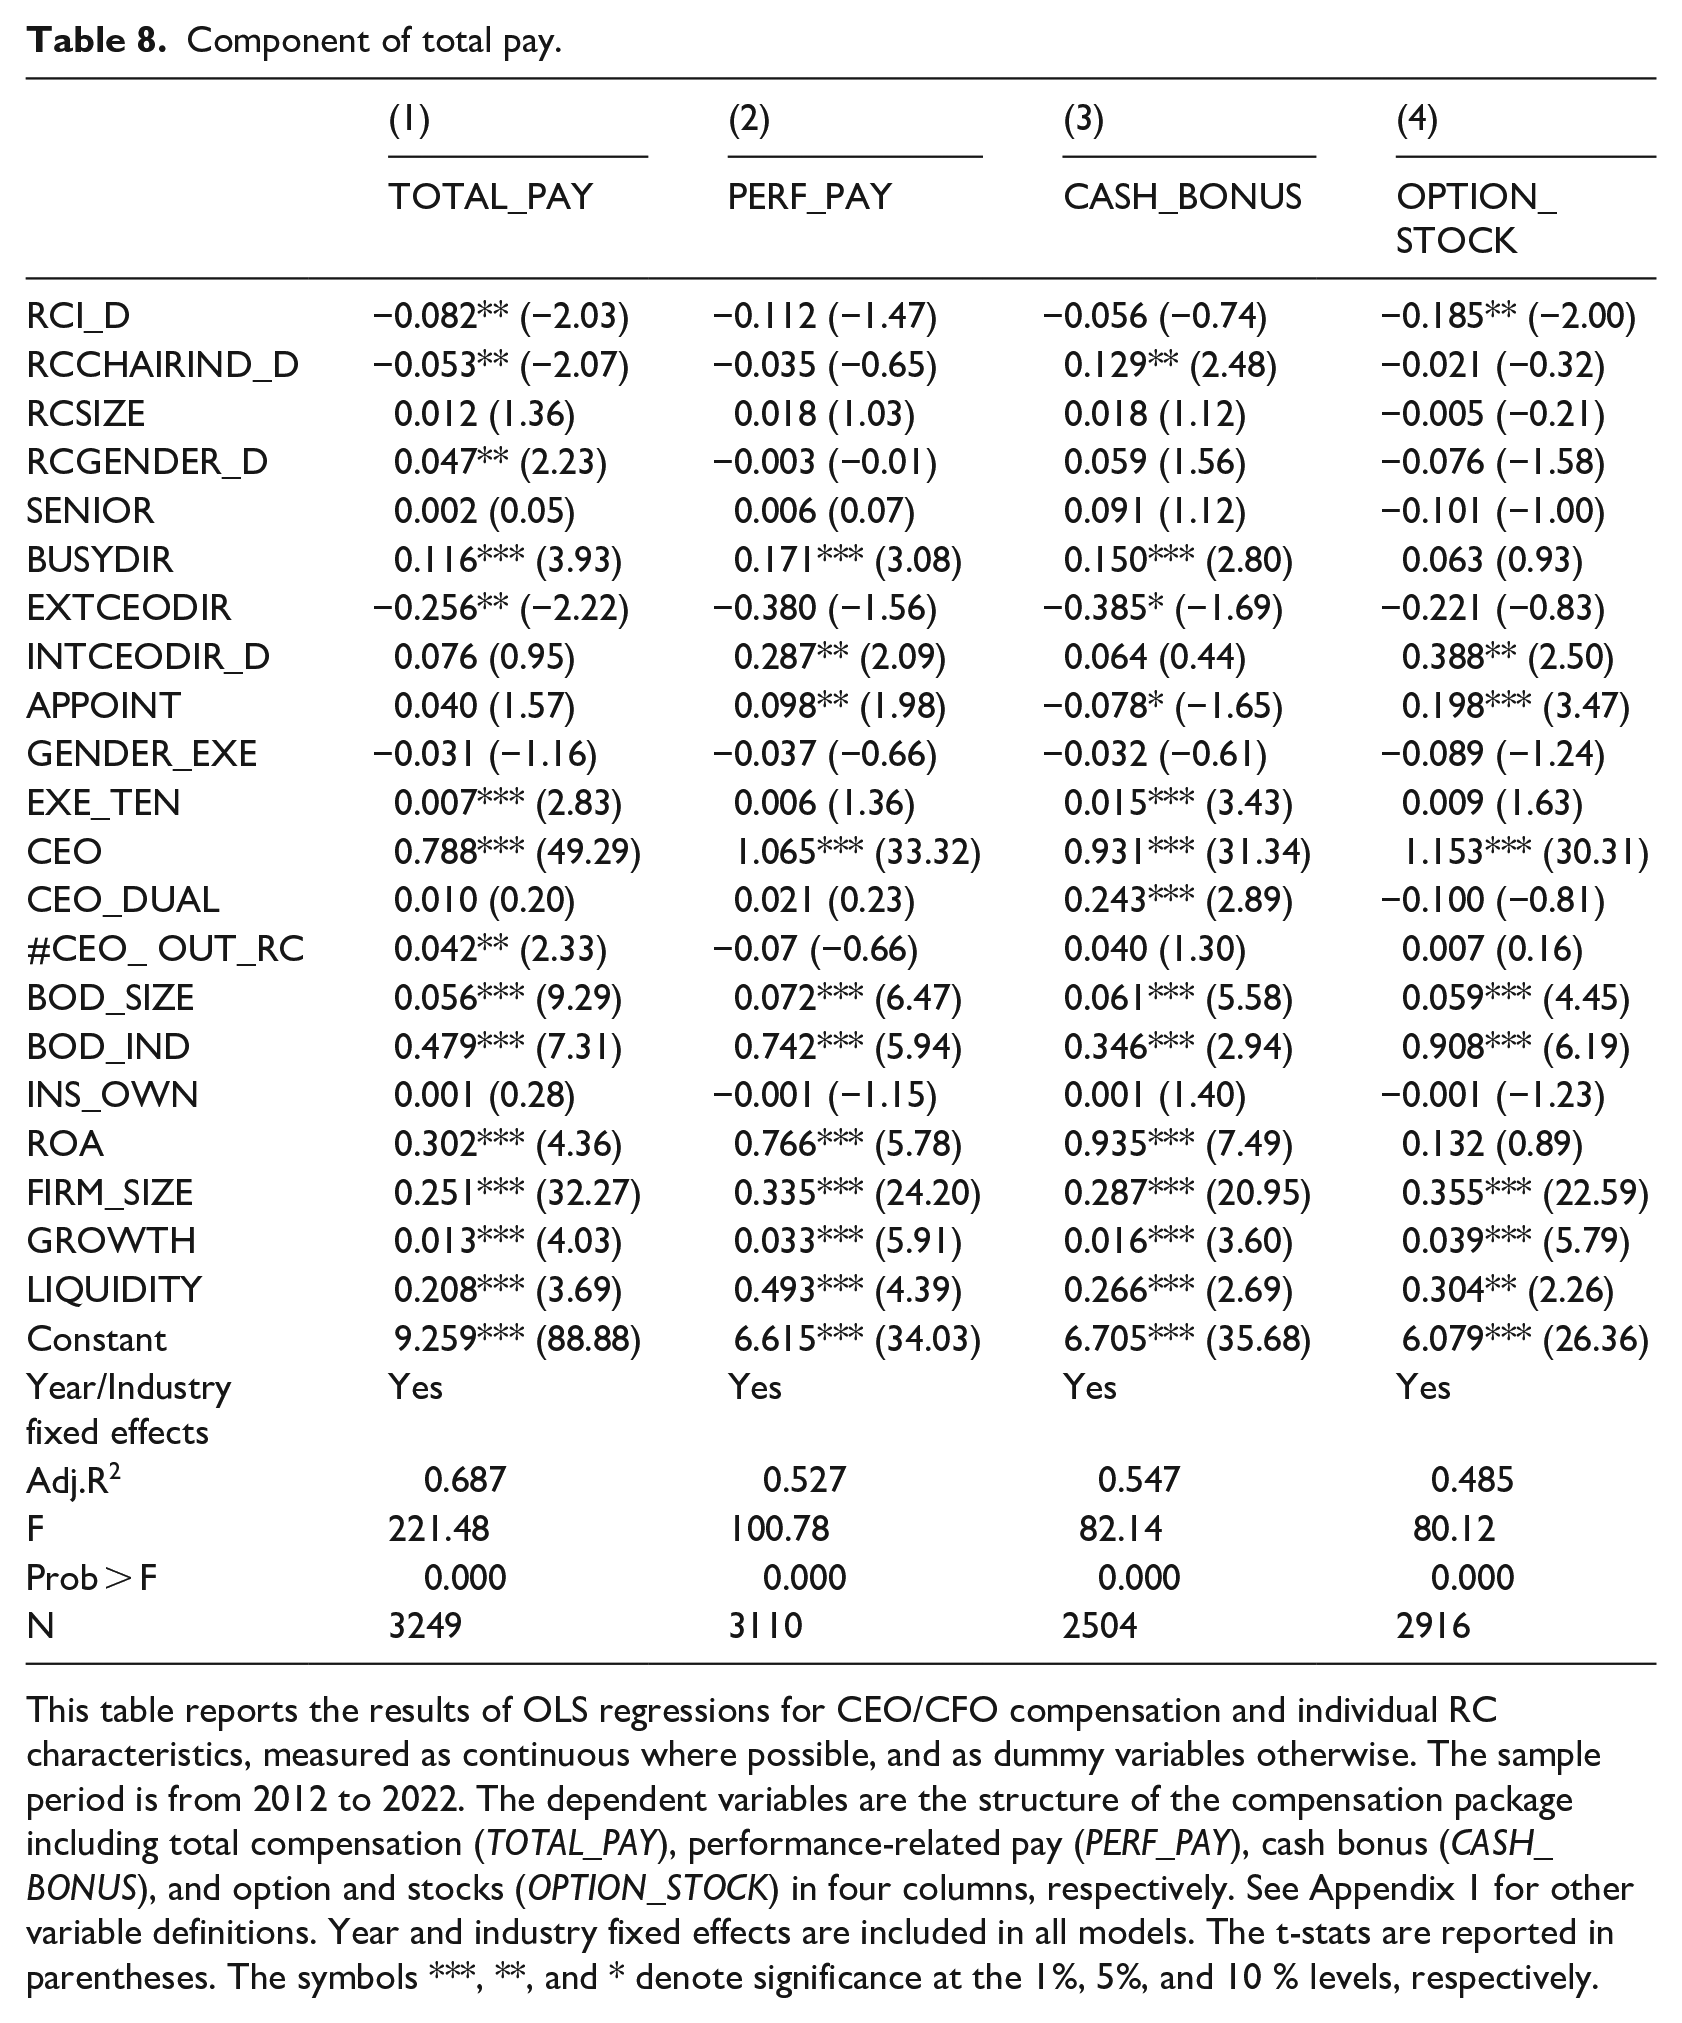
This table reports the results of OLS regressions for CEO/CFO compensation and individual RC characteristics, measured as continuous where possible, and as dummy variables otherwise. The sample period is from 2012 to 2022. The dependent variables are the structure of the compensation package including total compensation (TOTAL_PAY), performance-related pay (PERF_PAY), cash bonus (CASH_BONUS), and option and stocks (OPTION_STOCK) in four columns, respectively. See Appendix 1 for other variable definitions. Year and industry fixed effects are included in all models. The t-stats are reported in parentheses. The symbols ***, **, and * denote significance at the 1%, 5%, and 10 % levels, respectively.
For total pay, there is a negative association with RC independence, RC chair independence and having external CEOs on the RC, and a positive association with a gender-diverse board and busy directors. This result indicates that RC independence, RC chair independence and external CEOs are likely to decrease total executive compensation, and female RC members and busy directors are likely to increase it or allow it to increase.
When we examine whether these associations are with all components of total pay, or only some components, we find that an independent RC is associated with lower stocks and options, while an independent RC chair is associated with greater cash bonus. 7 The finding for lower stocks and options and higher cash bonuses is consistent with prior literature reporting that the majority of independent directors prefers more conservative and risk-averse compensation structures, which include less excessive options and stock compensation (Dong et al., 2010).
The association of busy RC members with increases in the total pay of top executives is mostly because they increase performance-based pay, especially cash bonuses. This result supports the view that busy directors are weak monitors. Pathan et al. (2019) argue that according to the trade-off theory, executive compensation will be optimally designed to counterbalance such weak monitoring by busy directors. They find that having busy directors on boards is associated with high total pay and high performance-based pay. In our case, total pay increases are mainly associated with higher cash bonuses.
Having CEOs of other firms as RC directors is associated with a reduction in total pay and also cash bonus (marginally significant at the 10% level). On the one hand, the decrease in performance-based pay might indicate a preference by external CEOs for fixed payments for their fellow CEOs. On the other hand, lower performance and cash bonuses could be downwards adjustments after external CEOs identify poor performance by top executives. To this extent, our results might indicate that an independent RC and an external CEO work as effective monitors on the RC.
Finally, although they are not associated with total pay, having the CEO sitting on the RC and having RC directors appointed by the CEO both provide a pay structure that favours the granting of options and restricted stocks for CEOs and CFOs (and fewer cash bonuses in the case of CEO-appointed directors), which leads to increases in performance pay. Our results show that chair independence increases cash bonuses, whereas the RC’s closeness with the CEO results in higher equity-based pay. In relation to these findings, previous empirical research also raises doubts about the widely accepted rationale for granting option or stock-based compensation to enhance firm performance. For example, Daily and Dalton (2002) conduct a meta-analysis of 229 published studies and conclude that there is no systematic relation between executive equity and firm performance. Bebchuk and Grinstein (2005) find that in the U.S., executive pay has grown extensively over the period 1993 to 2003, a growth rate that cannot be explained by firm size, performance or industry characteristics. They note that this substantial increase in executive pay has been mainly achieved through increases in equity compensation while the proportion of non-equity compensation has decreased. Moreover, Dong et al. (2010) have documented that executive stock options encourage managers to take on too much risk and to pursue suboptimal capital structure policies. Our findings, to some degree, are consistent with these results, indicating that influential CEOs and RC directors who are not independent of the CEO use equity-based compensation to inflate the total pay of CEOs and other top executives such as CFOs. Furthermore, studies have found that cash bonuses are more closely related to firm performance. Jackson et al. (2008), for example, report a highly significant relation between accounting fundamentals and the level of and change in CEO bonus compensation. Such a relation holds even when earnings are negative or declining.
Turning to control variables, a similar set of variables have a significant association with the dependent variables of total pay and its components. As for Table 5, executive tenure, ROA, firm size, growth, liquidity, whether the executive is the CEO, board size and board independence are all positively significant determinants in the regressions. In addition, CEO duality and the number of other RCs that the CEO sits on are positively associated with the cash bonus component and total pay, respectively.
4.4. Discussion
The first hypothesis tested in this study concerns three RC characteristics that are recommended by CGPR: RC and chair independences, measured as dummy variables, and committee size, measured as the number of directors on the RC. Our results partially support H1 which proposes a positive relation between these characteristics and measures of RC effectiveness. When RC effectiveness is measured as excess executive pay, RC independence and chair independence tend to reduce it, but when RC effectiveness is measured as pay-performance sensitivity, it is not associated with any of the characteristics. For committee size, we find that a larger committee tends to result in excess CFO’s pay, which does not support the CGPR that the RC should consist of three or more directors.
The second hypothesis tested in this study concerns the proportion of the RC with certain attributes and experience: serving on multiple boards, serving more than 10 years, female, and external CEOs. While H2 is non-directional, our results suggest some directional relations between these characteristics and measures of RC effectiveness. When RC effectiveness is measured as excess executive pay, it is positively associated with the gender diversity of the RC and director busyness, and negatively associated with having external CEOs on the RC. On the other hand, when RC effectiveness is measured as pay-performance sensitivity, it is positively associated with the length of director service. In particular, we find that busy directors are associated with compensation for both the CEO and the CFO that exceeds those of industry peers.
The third hypothesis concerns the lack of independence of RC directors from the CEO. We measure this by the CEO sitting on the RC (a dummy variable) and the proportion of the RC comprising CEO-appointed directors. Our results support H3 which proposes a negative relation between these characteristics and measures of RC effectiveness. For both measures of lack of RC independence and both measures of RC effectiveness, we do observe a negative relation. Having the current CEO or CEO-appointed directors on the RC is associated with increased excess pay and lower pay-performance sensitivity of top executives.
Overall, we find that an RC’s effectiveness varies in designing CEO and CFO remuneration. Having a majority of independent directors on the RC is effective in constraining excess pay of CEOs, while having external CEOs on the RC keeps CFO pay to a moderate level. Moreover, the effectiveness of the RC deteriorates when it includes busy directors, the current CEO and a higher level of CEO-appointed directors. Our results indicate that the links between RC characteristics and incentivising remuneration are complex, and more than just the independence of the RC matters for motivating top executives. Our results contribute to future improvements in the definition of an effective RC by suggesting that a broader set of RC characteristics may achieve better compensation practices.
5. Summary and conclusion
This article examines how a comprehensive set of RC characteristics that are hypothesised to improve RC effectiveness are related to CEO and CFO compensation for ASX300 companies. Whereas previous studies primarily focus on the role of RC independence in CEO compensation, we analyse nine RC characteristics that reflect the scrutiny the RC can exercise over the top executives’ remuneration, its attributes and experience, and whether it has a close connection with the current CEO.
Using a sample of 3249 observations of ASX300 companies that report an RC over the period 2012 to 2022, we find that an RC’s effectiveness varies in designing different top executives’ remuneration packages. Its effectiveness decreases when a director has multiple directorships, when the serving CEO sits on the RC, and when a higher proportion of directors are appointed by the current CEO. Having external CEOs on the RC does not necessarily make remuneration sensitive to firm performance but the directors are less likely to approve excess pay for top executives. Overall, we find evidence that the ASX CGPR can decrease excessive pay to CEOs and CFOs but find no evidence that the recommendations align remuneration with performance, which is important for shareholders of the company.
The findings of this study have important implications for policy-makers and shareholders. Our evidence shows that executive compensation would be more aligned to the interests of shareholders if corporate governance recommendations in Australia encouraged focus on a wider range of RC director characteristics such as their experience either with the organisation or on other boards, rather than only their independence. Having the current CEO and directors appointed by the CEO sit on the RC should be discouraged whereas having external CEOs sit on the RC can bring some positive benefits. Shareholders and investors should seek to appoint directors to the board and the RC with this broader set of characteristics in mind.
As explained in section 3.1, in this study we have excluded observations from 2011 and 2012 due to regulatory changes that affect CEO or other executives’ compensation during 2011. Future research might consider the impact of those regulatory changes (including the change in the ASX listing rule and the ‘two strikes rule’ under the Corporate Amendment Act 2011) by including observations from these years and evaluating their impact on CEO/executive remuneration.
Key Practical and Research Implications
Footnotes
Appendix
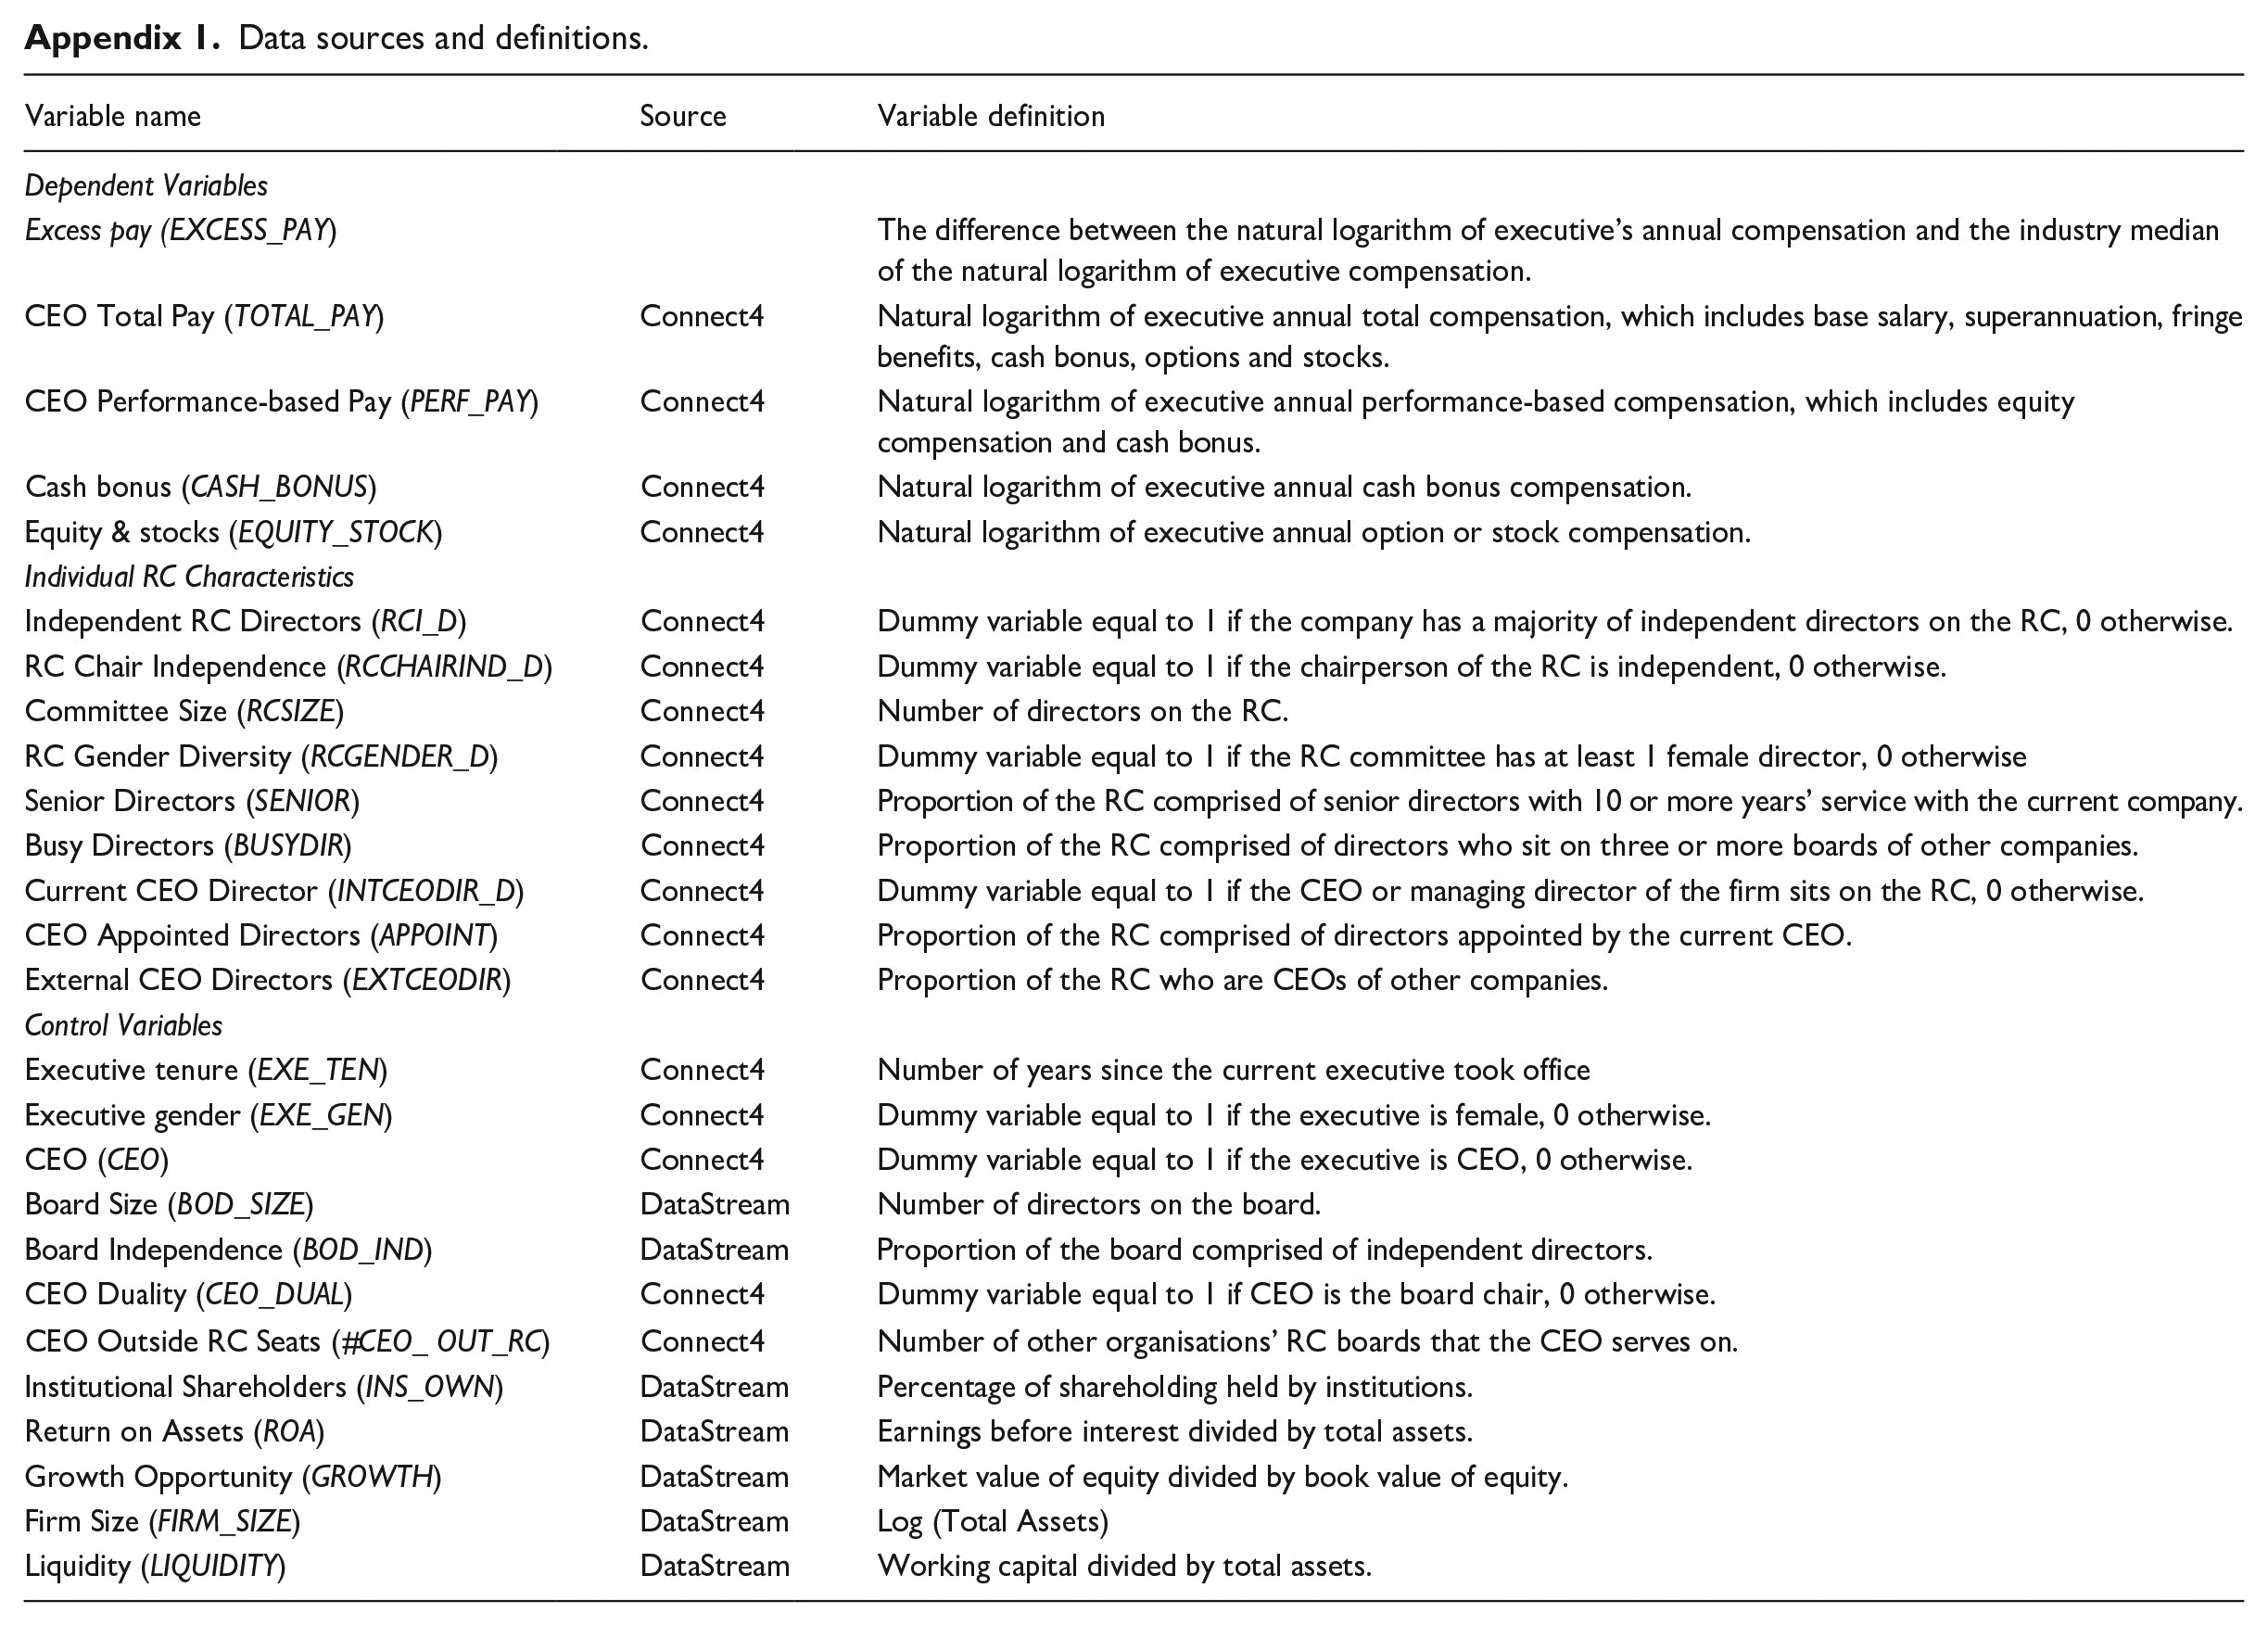
Data sources and definitions.
| Variable name | Source | Variable definition |
|---|---|---|
|
|
||
| Excess pay (EXCESS_PAY) | The difference between the natural logarithm of executive’s annual compensation and the industry median of the natural logarithm of executive compensation. | |
| CEO Total Pay (TOTAL_PAY) | Connect4 | Natural logarithm of executive annual total compensation, which includes base salary, superannuation, fringe benefits, cash bonus, options and stocks. |
| CEO Performance-based Pay (PERF_PAY) | Connect4 | Natural logarithm of executive annual performance-based compensation, which includes equity compensation and cash bonus. |
| Cash bonus (CASH_BONUS) | Connect4 | Natural logarithm of executive annual cash bonus compensation. |
| Equity & stocks (EQUITY_STOCK) | Connect4 | Natural logarithm of executive annual option or stock compensation. |
|
|
||
| Independent RC Directors (RCI_D) | Connect4 | Dummy variable equal to 1 if the company has a majority of independent directors on the RC, 0 otherwise. |
| RC Chair Independence (RCCHAIRIND_D) | Connect4 | Dummy variable equal to 1 if the chairperson of the RC is independent, 0 otherwise. |
| Committee Size (RCSIZE) | Connect4 | Number of directors on the RC. |
| RC Gender Diversity (RCGENDER_D) | Connect4 | Dummy variable equal to 1 if the RC committee has at least 1 female director, 0 otherwise |
| Senior Directors (SENIOR) | Connect4 | Proportion of the RC comprised of senior directors with 10 or more years’ service with the current company. |
| Busy Directors (BUSYDIR) | Connect4 | Proportion of the RC comprised of directors who sit on three or more boards of other companies. |
| Current CEO Director (INTCEODIR_D) | Connect4 | Dummy variable equal to 1 if the CEO or managing director of the firm sits on the RC, 0 otherwise. |
| CEO Appointed Directors (APPOINT) | Connect4 | Proportion of the RC comprised of directors appointed by the current CEO. |
| External CEO Directors (EXTCEODIR) | Connect4 | Proportion of the RC who are CEOs of other companies. |
|
|
||
| Executive tenure (EXE_TEN) | Connect4 | Number of years since the current executive took office |
| Executive gender (EXE_GEN) | Connect4 | Dummy variable equal to 1 if the executive is female, 0 otherwise. |
| CEO (CEO) | Connect4 | Dummy variable equal to 1 if the executive is CEO, 0 otherwise. |
| Board Size (BOD_SIZE) | DataStream | Number of directors on the board. |
| Board Independence (BOD_IND) | DataStream | Proportion of the board comprised of independent directors. |
| CEO Duality (CEO_DUAL) | Connect4 | Dummy variable equal to 1 if CEO is the board chair, 0 otherwise. |
| CEO Outside RC Seats (#CEO_ OUT_RC) | Connect4 | Number of other organisations’ RC boards that the CEO serves on. |
| Institutional Shareholders (INS_OWN) | DataStream | Percentage of shareholding held by institutions. |
| Return on Assets (ROA) | DataStream | Earnings before interest divided by total assets. |
| Growth Opportunity (GROWTH) | DataStream | Market value of equity divided by book value of equity. |
| Firm Size (FIRM_SIZE) | DataStream | Log (Total Assets) |
| Liquidity (LIQUIDITY) | DataStream | Working capital divided by total assets. |
Acknowledgements
We gratefully acknowledge helpful comments from the editor and anonymous reviewers, and from participants and discussants on earlier versions of this work presented at Newcastle Business School Colloquium 2019, Accounting and Finance Association Accounting and Finance (AFAANZ) Online Conference 2020, and Australasian Finance and Banking Conference 2021.
Final transcript accepted 7 May 2025 by Andrew Jackson (Editor-in-Chief).
Funding
The author(s) received no financial support for the research, authorship and/or publication of this article.