
Abstract
This article finds a negative trend in the unit cost of financial intermediation in Australia. The result is remarkable given the seemingly low competition in the Australian banking system and contrasts the relatively constant costs identified for the United States. However, the negative trend is related to falling interest rates highlighting the fact that Australian loans are generally more exposed to interest rate changes than US loans. We also compare the cost of financial intermediation across five types of financial institutions in Australia: shareholder-owned deposit-taking institutions, customer-owned deposit-taking institutions, non-deposit-taking lending institutions, deposit-taking and non-deposit-taking FinTechs. Our analysis suggests that the costs of financial intermediation could decrease through improved operational efficiency and profits passed on to consumers instead of shareholders.
Keywords
1. Introduction
Financial intermediation is an essential service for a country’s economy and its people. Therefore, whether financial intermediation is provided at a reasonable cost for consumers is an important question. Philippon (2016) introduces a methodology to measure the unit cost of financial intermediation by ‘dividing the income of the finance industry by the quantity of intermediated assets’ and concludes that it remains high in the United States despite technological advancements. 1 We follow this approach and calculate the unit cost of financial intermediation for the finance industry of Australia. The resulting cost curve indicates a negative trend, which contrasts with the constant cost curve for the United States.
Investigating the cost of financial intermediation, profits, and consumer welfare in Australia is crucial because financial intermediation plays a significant role in economic development as it channels resources from savers to borrowers. Australia’s financial sector is diverse, comprising various types of institutions with distinct cost structures, operational efficiencies, and risk profiles, influencing their respective intermediation costs. Studying unit costs of financial intermediation helps identify more efficient institutions, thereby informing policies aiming at balancing banking-sector competition and cost reduction. The rise of neobanks and FinTech lenders introduces technology-driven efficiencies, creating new dynamics in the financial intermediation sector. Including an analysis of intermediation costs for these emerging institutions offers further insight into their implications for traditional banks.
This article consists of three parts. First, we calculate the cost of financial intermediation for the Australian financial sector using the definition introduced by Philippon (2016) and followed by Bazot (2018). Second, we examine the relationship between the cost of financial intermediation and interest rates for the entire financial sector and the banking sector including an analysis of determinants of the cost of financial intermediation at the bank level. Third, we analyse five different types of financial institutions to better understand the factors of the cost of financial intermediation.
We show that the unit cost of financial intermediation has decreased over time in Australia for both the financial sector and the banking sector, whereas Philippon (2016) documents that these costs remained constant at about 2% for the United States from 1886 to 2015. We also find a positive relationship between intermediation costs and interest rates for Australia and the United States. However, interest rates explain substantially less of the variations of the intermediation costs in the United States than in Australia. This is consistent with the dominance of long-term fixed-interest mortgage loans in the United States. Since most loans in Australia are on variable interest rates, variations in the cost of financial intermediation are better explained by the policy rate in Australia than in the United States. Our results are consistent with Brassil’s (2022) assertion that variable-rate loans in Australia enhance the interest rate pass-through compared to other countries with a higher portion of long-term fixed-rate loans. In additional analyses, we also control for macroeconomic variables and monetary policy changes.
Our analysis at the Authorised Deposit-taking Institution (ADI) level further reveals that shareholder ADIs have a lower cost of financial intermediation proxied by net interest margin (NIM), compared to customer-owned ADIs. Other ADI-specific variables such as capital ratio and credit risk are positively associated with NIM, whereas income diversification, competition and size are negatively associated with NIM. The concentration of the ‘Big 4’ banks and macroeconomic variables such as interest rate and credit growth are positively associated with NIM, whereas GDP growth is negatively associated. Through the analysis of the five types of financial institutions, we find that the customer-owned ADIs and the technologically advanced FinTechs do not perform as well as shareholder-owned ADIs. Scale advantages could be one of the underlying reasons for the differences across financial institutions.
This article contributes to the literature on the costs of financial intermediation. To the best of our knowledge, a unit cost calculation for the Australian financial sector, particularly with an analysis of the relationship between intermediation costs and interest rates, has not been undertaken to date. As such, we are extending the research conducted by Philippon (2015), Philippon (2016), Bazot (2018), Hiroshi et al. (2023) and Bazot (2024) to Australia. Relevant studies carried out on the Australian banking sector focus on bank profitability, technological advancements, interest margin and foreign-owned banks (Gangopadhyay et al., 2022; McShane and Sharpe, 1985; Williams, 1998, 2007; Williams and Rajaguru, 2013). Yet, no recent studies provide a comprehensive assessment of the cost of financial intermediation for the entire financial sector of Australia. Given the unique characteristics of the Australian financial sector, this study aims to broaden our knowledge of financial intermediation costs.
The article also contributes to the literature with a disaggregated analysis of the cost of financial intermediation for different types of financial institutions. We identify constraints that hinder financial institutions from providing improved benefits for consumers.
The remainder of the article is organised as follows. Section 2 provides an overview of the Australian banking sector. Section 3 summarises the literature. Section 4 describes the data and methodology. Section 5 presents the main results followed by a summary of the main findings and conclusions in Section 6.
2. Australian banking industry
2.1. Composition of the banking industry
The Australian financial sector that engages in banking business can be broadly divided into two categories: deposit-taking institutions and non-deposit-taking institutions. As of December 2021, ADIs had a market share of 92.1% and non-ADIs had a market share of 7.9%. Figure 1 presents the overall composition of the Australian financial sector based on total assets.
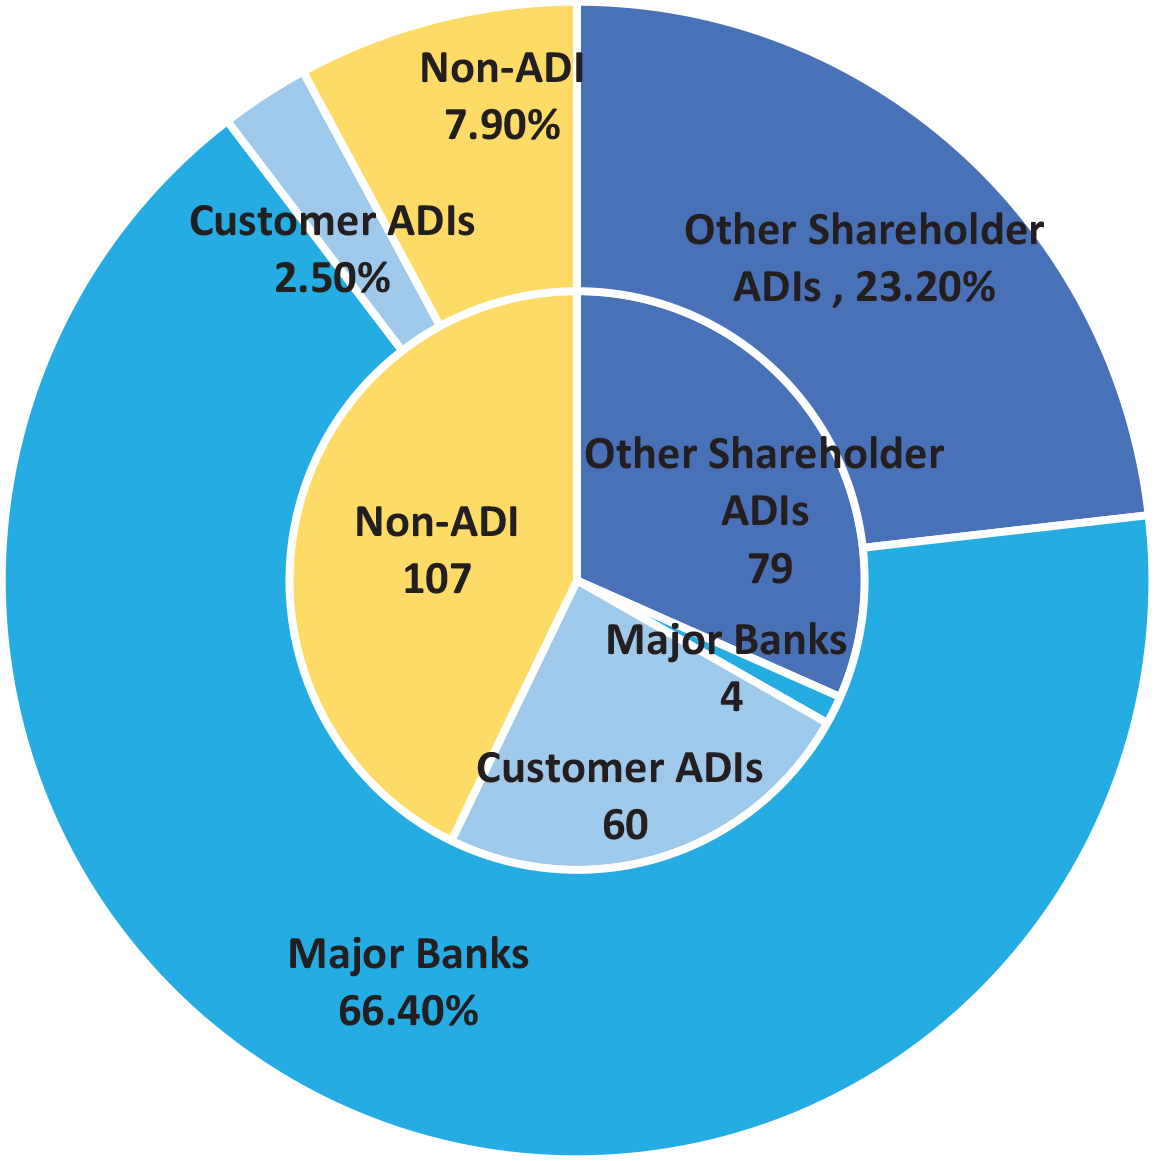
Market share of financial institutions in Australia as of December 2021.
2.1.1. Deposit-taking institutions
Authorised deposit-taking entities in Australia can be banks, credit unions, or building societies. As of March 2022, 144 ADIs operated in Australia, of which 97 were banks. The number of ADIs declined from 157 in December 2015 to 144 in March 2022, as shown in Table 1. ADIs can also be categorised as shareholder-owned ADIs and customer-owned ADIs. Customer-owned ADIs do not have shareholders and are not profit-oriented.
Classification of ADIs in Australia.
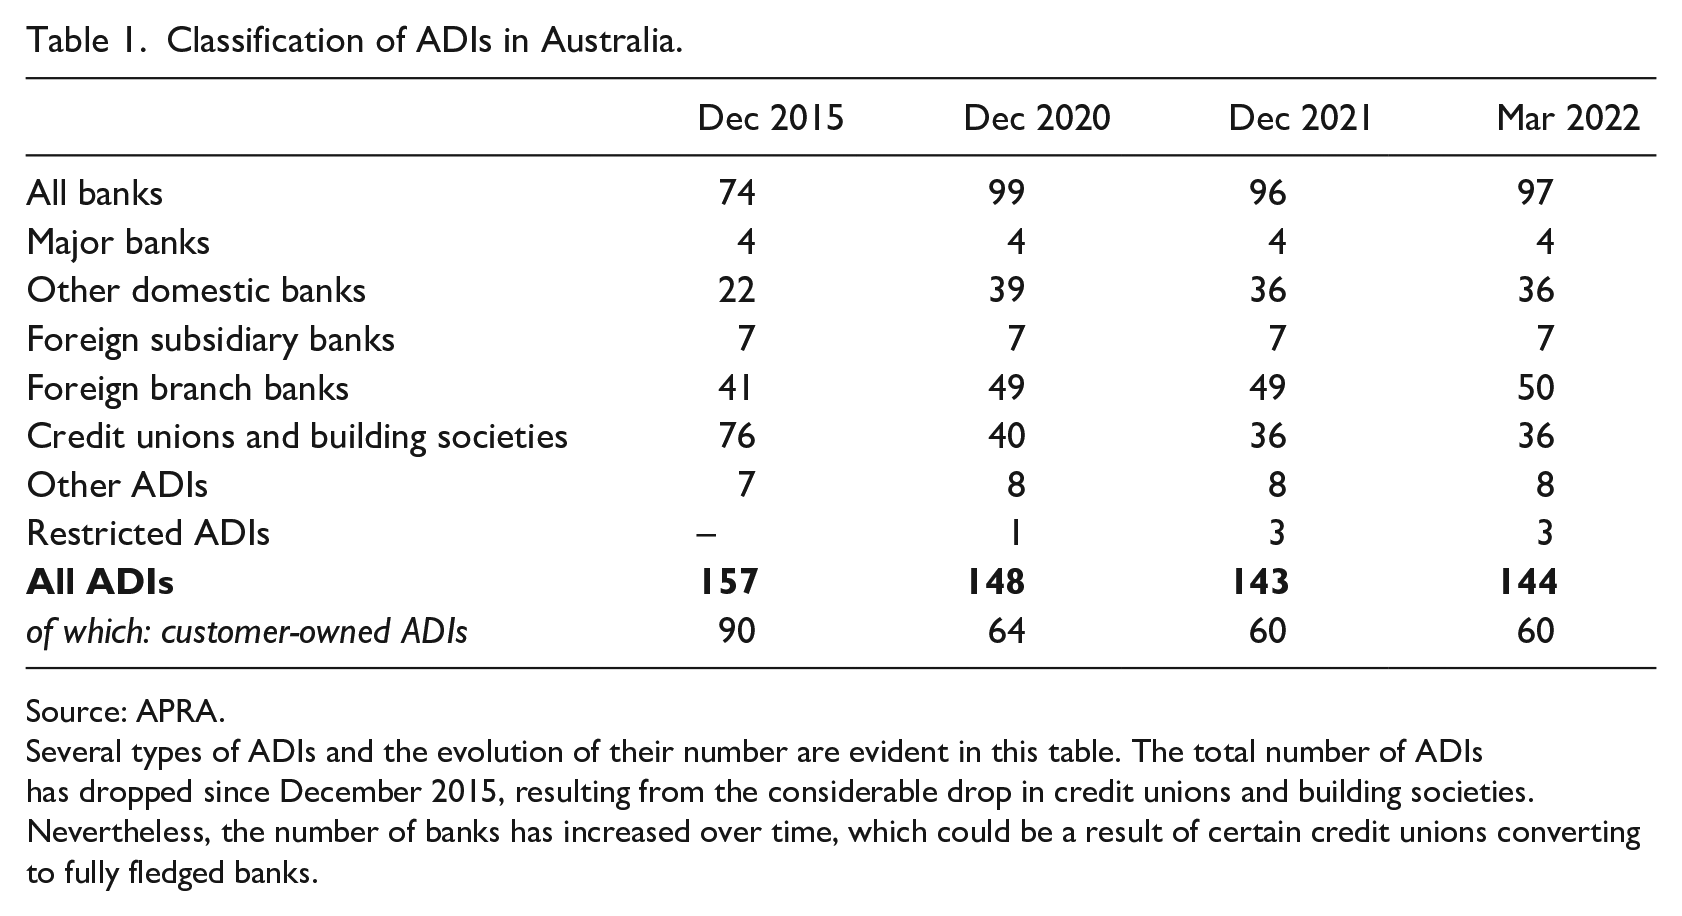
Source: APRA.
Several types of ADIs and the evolution of their number are evident in this table. The total number of ADIs has dropped since December 2015, resulting from the considerable drop in credit unions and building societies. Nevertheless, the number of banks has increased over time, which could be a result of certain credit unions converting to fully fledged banks.
There were 60 customer-owned ADIs as of March 2022, as per APRA statistics. The decline in the number of customer-owned ADIs, as shown in Table 1, is due to mergers and acquisitions and demutualisation. Jain et al. (2015) analyse credit unions in Australia converting to mutual banks. They attribute such conversion to technological advancements and difficulty in meeting the complex demands of consumers, such as financial planning and wealth management. As a result, the number of credit unions decreased from 76 in 2015 to 36 in 2021.
2.1.2. Non-ADIs
Non-ADIs are entities that engage in money market operations and lending using wholesale funds without obtaining deposits. As illustrated in Figure 1, there were 107 non-ADI financial institutions in Australia as of December 2021, representing a mere 7.9% of the overall lending business in Australia.
2.1.3. FinTechs
FinTechs in Australia operate in various forms, including payment platforms (e.g. digital wallets), lending institutions (e.g. Buy Now Pay Later services, SME lending, consumer lending) and neobanks authorised to mobilise deposits. The COVID-19 pandemic has improved the performance of FinTechs in Australia with consumers seeking digital banking solutions (KPMG, 2022). The Consumer Data Rights Act, enacted in 2019 to facilitate Open Banking, has also facilitated FinTechs (Goldbarsht et al., 2021).
2.2. Regulation of the Australian financial sector
The Twin Peaks regulatory architecture regulates the Australian financial sector. Under this system, there are two regulatory bodies responsible for prudential regulation and market conduct. APRA oversees the prudential regulations ensuring the resilience and soundness of financial institutions, and the ASIC oversees the market conduct and consumer protection aspects (Salim et al., 2016). The 2018 Royal Commission Report on Misconduct in the Financial Sector documents instances of unfair and unethical practices of financial institutions and emphasises deficiencies in regulatory oversight (Gilligan, 2018). However, this report also recommends continuing the Twin Peaks regulatory structure with improved communication between the regulators.
Accordingly, APRA regulates and supervises all ADIs. Hence, customer-owned ADIs, which focus mainly on consumer welfare and operate on a smaller scale compared to shareholder-owned entities, are also required to meet the stringent prudential regulations enforced by APRA. Meanwhile, ASIC regulates the market conduct of all institutions that conduct consumer lending under the National Credit Code. Lending institutions and Buy Now Pay Later forms of lending are not considered under this code and, therefore, do not require an Australian Credit Licence for such operations (K&L Gates, 2022).
Regulation of FinTechs is complex due to the diversity of FinTechs in Australia. No specific regulation applies to FinTechs affiliated with regulated financial institutions. FinTechs conducting lending for consumer purposes are regulated by the ASIC. Neobanks operating similarly to ADIs are regulated by the APRA. Features and regulatory distinctions for different types of financial institutions in Australia are presented in Table 2.
Features of financial institutions in Australia.
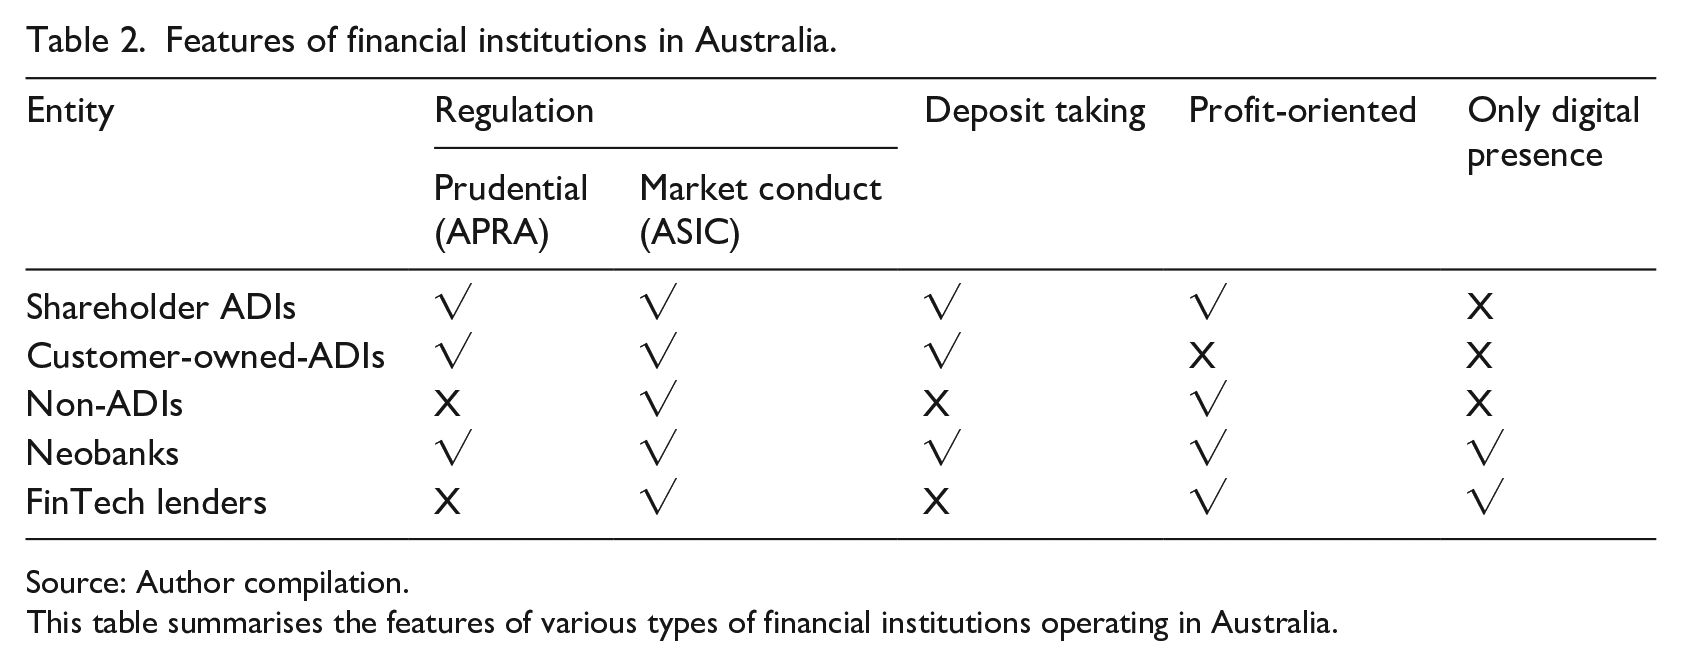
Source: Author compilation.
This table summarises the features of various types of financial institutions operating in Australia.
2.3. Bank concentration in Australia
Four banks 2 – also labelled ‘Big 4’ – dominate the Australian banking sector among other ADIs, several neobanks and other non-bank institutions. The ‘Big 4’ comprise 67% of the total assets of the financial sector as of December 2021 (see Figure 1). Healey and Nicholls (2015) argue that deregulation before the 2008 financial crisis contributed to the crisis in Australia. This led to more regulation resulting in decreased competition in the Australian banking sector.
3. Literature review
There are a few prominent studies conducted on the unit cost of financial intermediation. Philippon (2015) documents constant costs for the United States, and Philippon (2016) argues that the finance sector has gone through large technological innovations but has not passed on any savings to consumers as financial institutions continue to set relatively high interest spreads between deposits and loans. Bazot (2018) finds that financial deregulation has not led to a decline in financial intermediation costs in several European countries. Bazot (2024) extends this study and reports a decreasing trend for eight countries (Belgium, Denmark, Finland, France, Italy, Japan, New Zealand and Sweden) and mixed evidence for seven countries (Canada, Germany, Korea, Norway, Spain, the United Kingdom and the United States).
Extant literature also attempts to identify determinants affecting the unit cost of financial intermediation. Bazot (2024) concludes that the effect of deregulation on financial intermediation costs is low when market power is high. Philippon (2016) argues that stringent regulations act as barriers to entry and thus favour established and larger financial institutions, as regulatory compliance cost discourages new entrants and limit the operations of established or incumbent smaller firms.
The emergence of FinTechs is another factor influencing the unit cost of financial intermediation. Philippon (2016) notes that FinTechs can minimise costs, provide better consumer satisfaction and enable better competition in the financial sector, disrupting traditional banks’ operations. Carney (2017) argues that the FinTech revolution benefits individuals, industries and traditional banking institutions alike through cost advantages, risk management and expediting processes.
Given that the banking sector is the most prominent segment of the financial sector, there is a large volume of literature on the determinants of intermediation cost of the banking sector. Most studies use NIM as the dependent variable in identifying the determinants for bank profitability and intermediation cost 3 (Calice and Zhou, 2018; Jarmuzek and Lybek, 2018). Studies on the Australian banking sector include McShane and Sharpe (1985), Williams (1998, 2007), Williams and Rajaguru (2013) and Gangopadhyay et al. (2022).
The determinants of NIM fall into three categories. The first category includes macroeconomic factors such as GDP growth and inflation (Kohlscheen et al., 2018), short-term and long-term interest rates (Claessens et al., 2018; Cruz-García et al., 2019), governance indicators (Jarmuzek and Lybek, 2018) and credit infrastructure (Calice and Zhou, 2018). The second category is related to banking sector structural factors, for example, competition (Maudos and De Guevara, 2004). The third category comprises bank-specific factors; bank size, efficiency and liquidity levels (Kohlscheen et al., 2018; López-Espinosa et al., 2011).
4. Data and methods
This section comprises three parts. First, we outline Philippon’s (2015) methodology for calculating the unit cost of financial intermediation for Australia. Second, we present the regression specifications for determinants of the unit cost of financial intermediation, banking sector NIM and ADI-level NIM, respectively. We focus on the intermediation costs of the banking sector/ADI sector as this sector represents 81% of the total assets of the financial sector (excluding superannuation funds) in Australia as of December 2021 (Reserve Bank of Australia (RBA), 2022). Third, we compare five types of financial institutions in Australia and analyse their financial statements to highlight components that contribute to the cost of intermediation.
4.1. Unit cost of financial intermediation
We follow Philippon (2015, 2016) and Bazot (2018) to calculate the unit cost of financial intermediation for the Australian financial sector. The unit cost of financial intermediation is defined as the cost incurred by a financial consumer to obtain one unit of financial service. Financial services comprise many forms such as loans, deposits and investments. The cost financial consumers incur in obtaining these services can be approximated by the income generated by financial institutions in providing such services. Therefore, the numerator in the equation used to estimate the unit cost of financial intermediation is the ‘Income of the Finance Industry’, which approximates the cost of financial services (Philippon, 2015). The total values of financial services used by financial consumers are aggregated to determine the volume of financial intermediated assets. Accordingly, the unit cost of financial intermediation (UC) is calculated as the ‘Income of the Finance Industry’ divided by the ‘Financial Intermediated Assets’, shown below

For the numerator of equation (1), Philippon (2015, 2016) and Bazot (2018) use the value added by the finance and insurance industries to the economy, as the income of the finance industry. This provides a holistic approximation of the entire income generated by the financial service providers of a country. We use the quarterly financial income of the Australian finance and insurance sector obtained from the Australian Bureau of Statistics website.
For the denominator of equation (1), namely, the quantity of intermediated assets that measure all financial services provided by financial institutions, Philippon (2015) sums up credit, equity and liquid assets of the household and non-financial businesses sector. Bazot (2018) also follows this approach and considers credit to the private sector, money supply, public debt and market capitalisation to account for the output of financial services. 4 Both these approaches consider the liquidity creation function and financial services provided by financial intermediaries. In addition, several quality adjustments are carried out by both Philippon (2015) and Bazot (2018) in adjusting this measure to represent financial intermediation more appropriately

We use a variety of data sources for aggregating the financial intermediated assets in Australia. Money (M3) and credit to the private sector data are obtained from the monetary aggregate data provided by the RBA, market capitalisation data from the Australian Stock Exchange and public debt data from the Australian Office of Financial Management. Following Bazot (2018), we use a 10% normalised intensity of intermediation for public debt as a risk adjustment. Since the market capitalisation (Market Cap) data are only available from the year 2010, we limit our analysis to the data from 2010 onward. Panel A of Appendix 1 provides the variable definitions and data sources.
4.2. Determinants of intermediation costs
We estimate regression models to identify determinants of intermediation costs of (1) the Australian financial sector, (2) the banking sector of Australia and the United States and (3) the ADI-level data of Australia


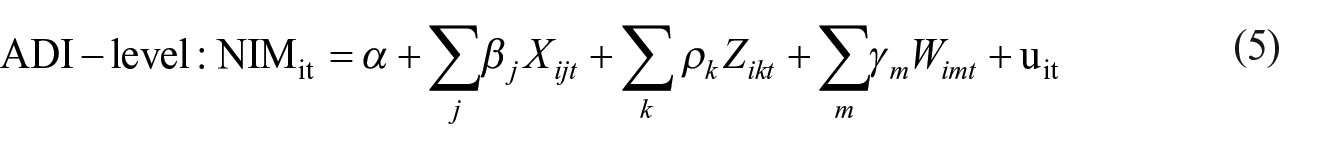
where c = AU or US, i = Individual ADIs. Xijt = ADI-specific variables, Zikt = ADI sector variables, Wimt = Macroeconomic variables. In regression specification (3), we use the unit cost of financial intermediation. Regarding the banking sector, we use the NIM 5 in specification (4). The NIM is the intermediation cost of banks as it directly accounts for a bank’s lending and deposit mobilising operations. Interest rates are proxied by overnight interbank rates. 6 Appendix 1 provides variable definitions and data sources.
To find the determinants of the cost of financial intermediation on an ADI level, in specification (5) we regress ADI’s NIM on ADI-specific, ADI sector-specific, and macroeconomic variables. Based on prior studies, we select the most widely used variables such as capital, liquidity, income diversification, credit risk, operational efficiency, size of ADI, Lerner index, concentration ratio, GDP growth, inflation, interest rate and credit growth (Calice and Zhou, 2018; Carbó-Valverde et al., 2021; Cruz-Garcia and De Guevara, 2020; Cruz-García et al., 2019; Jarmuzek and Lybek, 2018; Kohlscheen et al., 2018; Naceur and Omran, 2011). The ADI-specific variables are winsorised at the 1% and 99% levels.
In addition, we use the dummy variable ‘Type’ for shareholder-owned banks. This variable enables us to determine whether intermediation costs differ between shareholder ADIs and customer-owned ADIs. Altunbas et al. (2001), Maudos and de Guevara (2004) and Iannotta et al. (2007) include dummy variables for bank ownership (government or private) and type (mutual or not).
ADI-level data were collected from the income statements and statements of financial position of annual financial reports. We browsed through the respective ADIs’ websites and archives to locate their Annual Reports for the past 20 years. The definition and data source of each variable for the ADI-level regression is given in Panel D of Appendix 1. We collected data from 66 ADIs from 2002 to 2021, out of which, 230 observations are from shareholder-owned ADIs, and 422 observations are from customer-owned ADIs. Altogether our sample comprises 652 observations. To represent competition, we calculated the Lerner index for individual ADIs following Berger et al. (2009) and Beck et al. (2013); Appendix 2 provides the details. Summary statistics of the variables and correlation matrix are presented in Tables 3 and 4. Macroeconomic data were extracted from government websites.
Summary statistics.
Panel A.
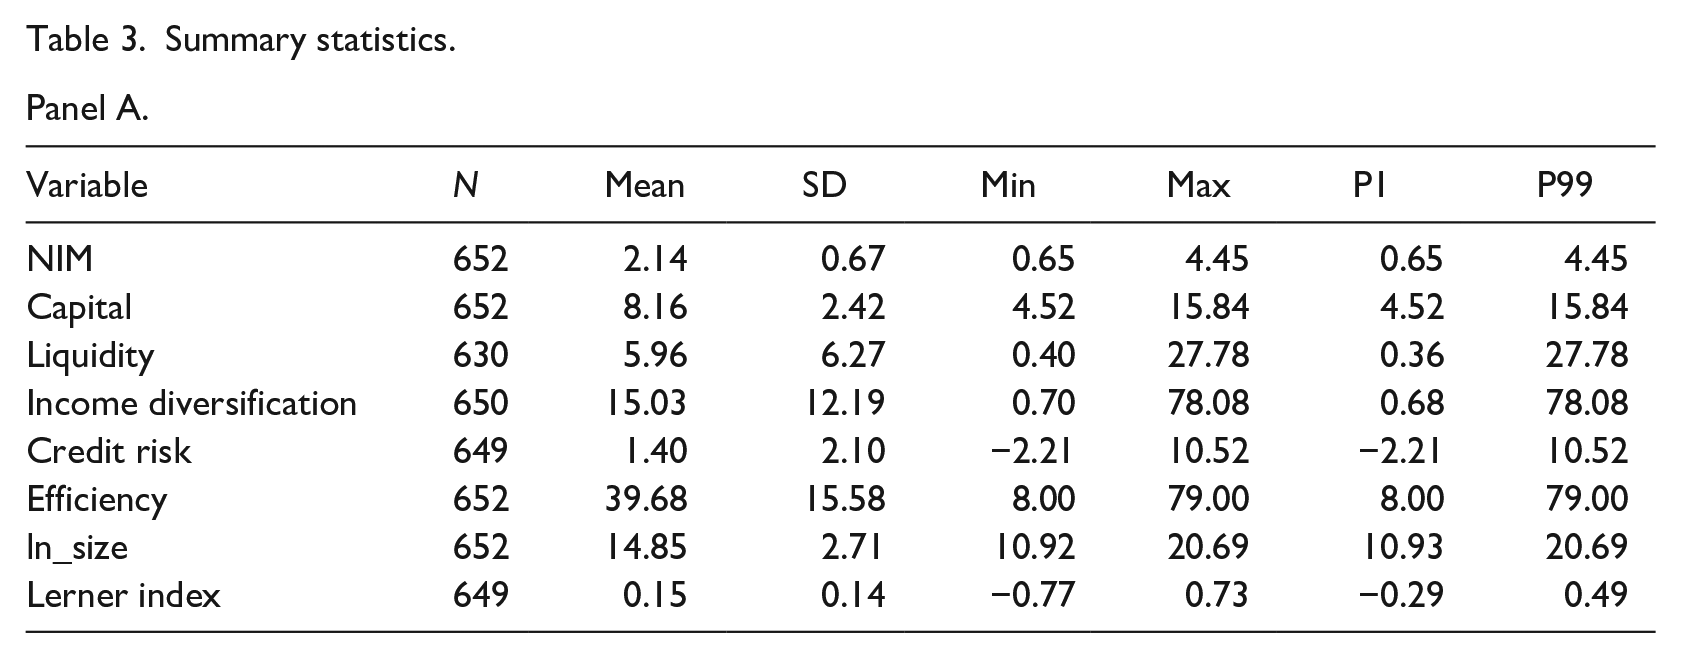
Panel B: Number of ADIs each year.
Panel A shows the summary statistics of the ADI-specific variables used in this study and Panel B shows the number of observations per year segregated based on the type of ADI; shareholder-owned ADI or customer-owned ADI.
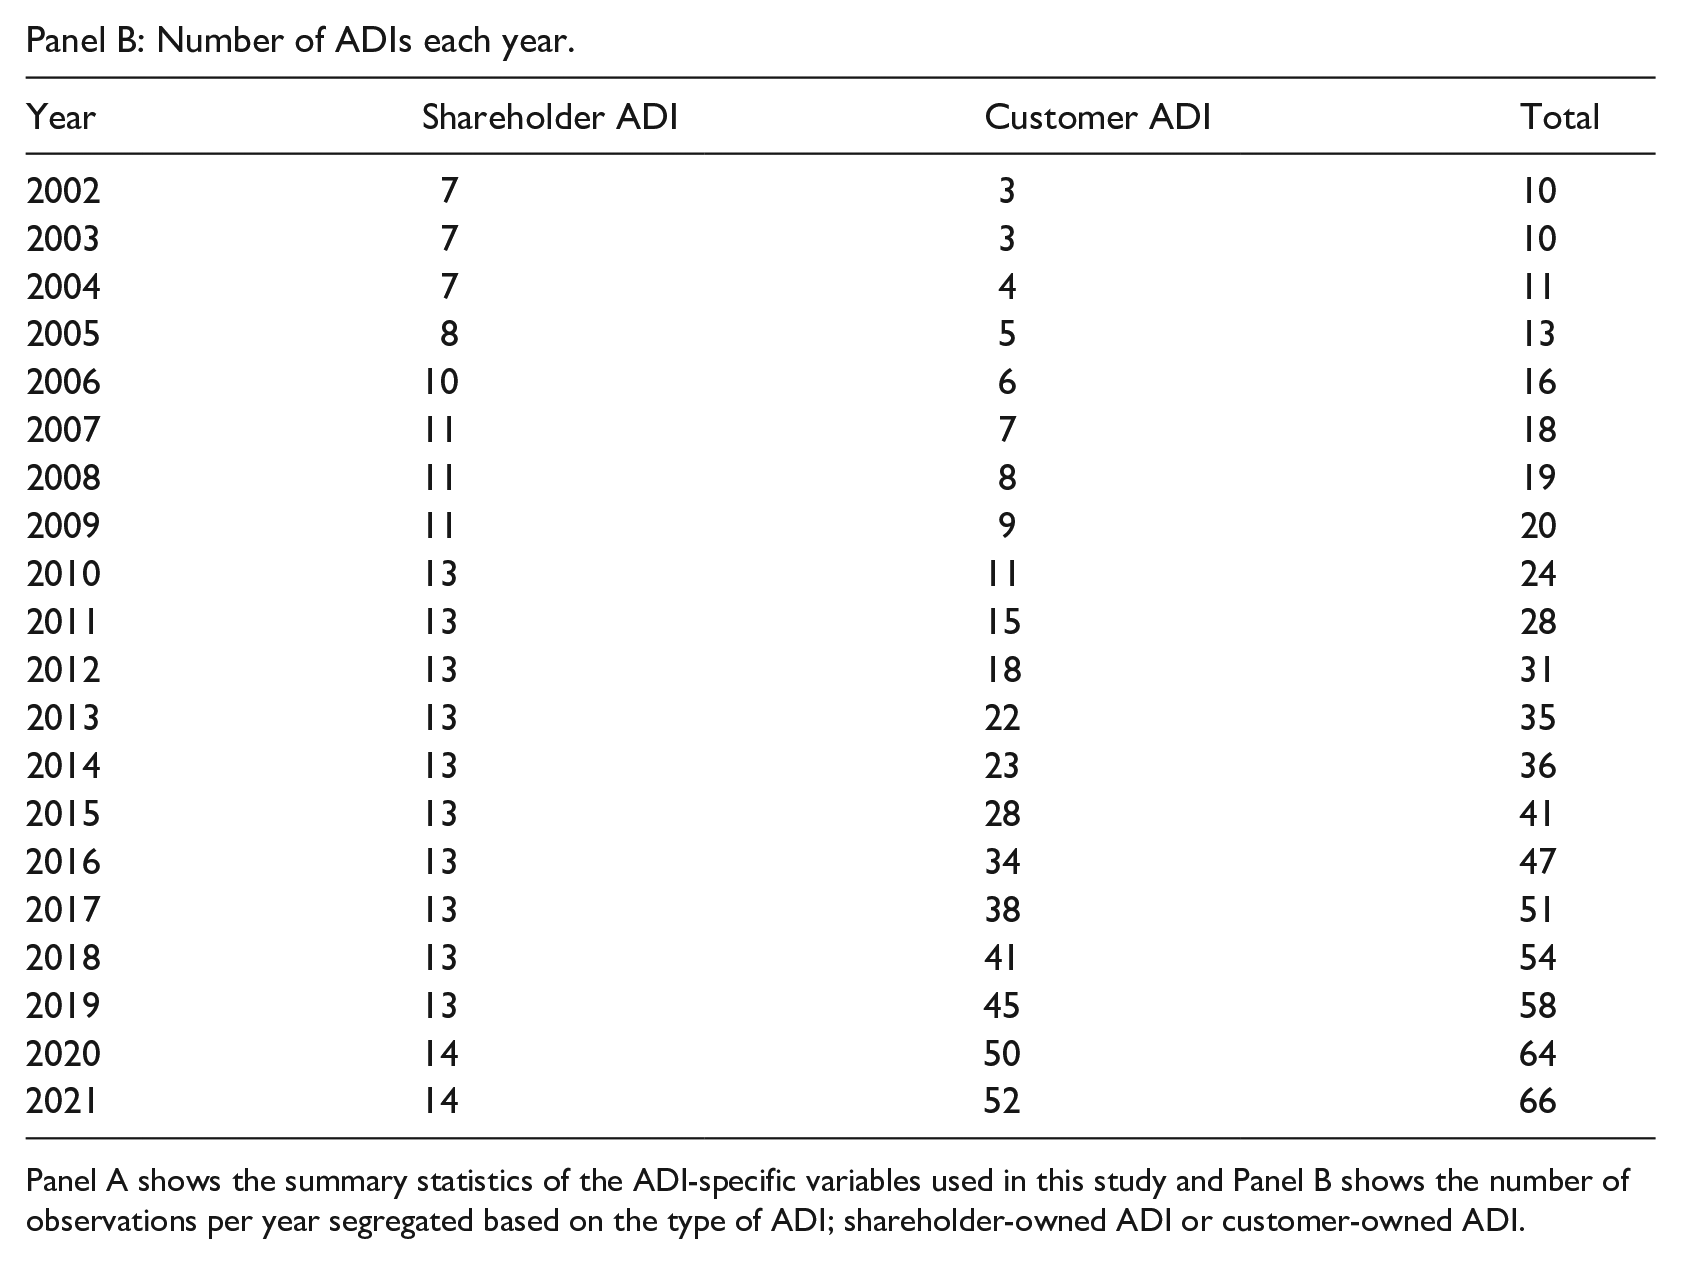
Correlation matrix.
This table shows the correlation between ADI-specific variables used in the study. Variable definitions are given in Appendix 1.
4.3. Comparing financial statements of different types of financial institutions
We analyse the weighted average financial statements of five types of financial institutions in Australia: shareholder ADIs, customer-owned ADIs, non-ADI lenders, neobanks and FinTech lenders. We used the list of regulated financial institutions of APRA, the members list of the Customer Owned Banking Association of Australia and the ASX website and identified a list of 51 financial institutions, consisting of 12 shareholder ADIs, 24 customer-owned ADIs (covering 90% of total assets), 7 non-ADIs, 2 neobanks and 6 FinTech lenders.
We collected data from financial statements of the 51 financial institutions for four financial years from 2019 to 2022 and constructed weighted average financial statements for a representative financial institution of each type. Finally, for each type of financial institution, we expressed income statement items as a percentage of interest income, and statement of financial position items as a percentage of total assets to allow for meaningful comparisons among types of institutions of varying sizes. This process essentially yields the normalised weighted average financial statements. Appendix 3 contains the details and provides the theoretical background on financial statement components and profits for each type of financial institution.
5. Results
5.1. Unit cost of financial intermediation of the Australian financial sector
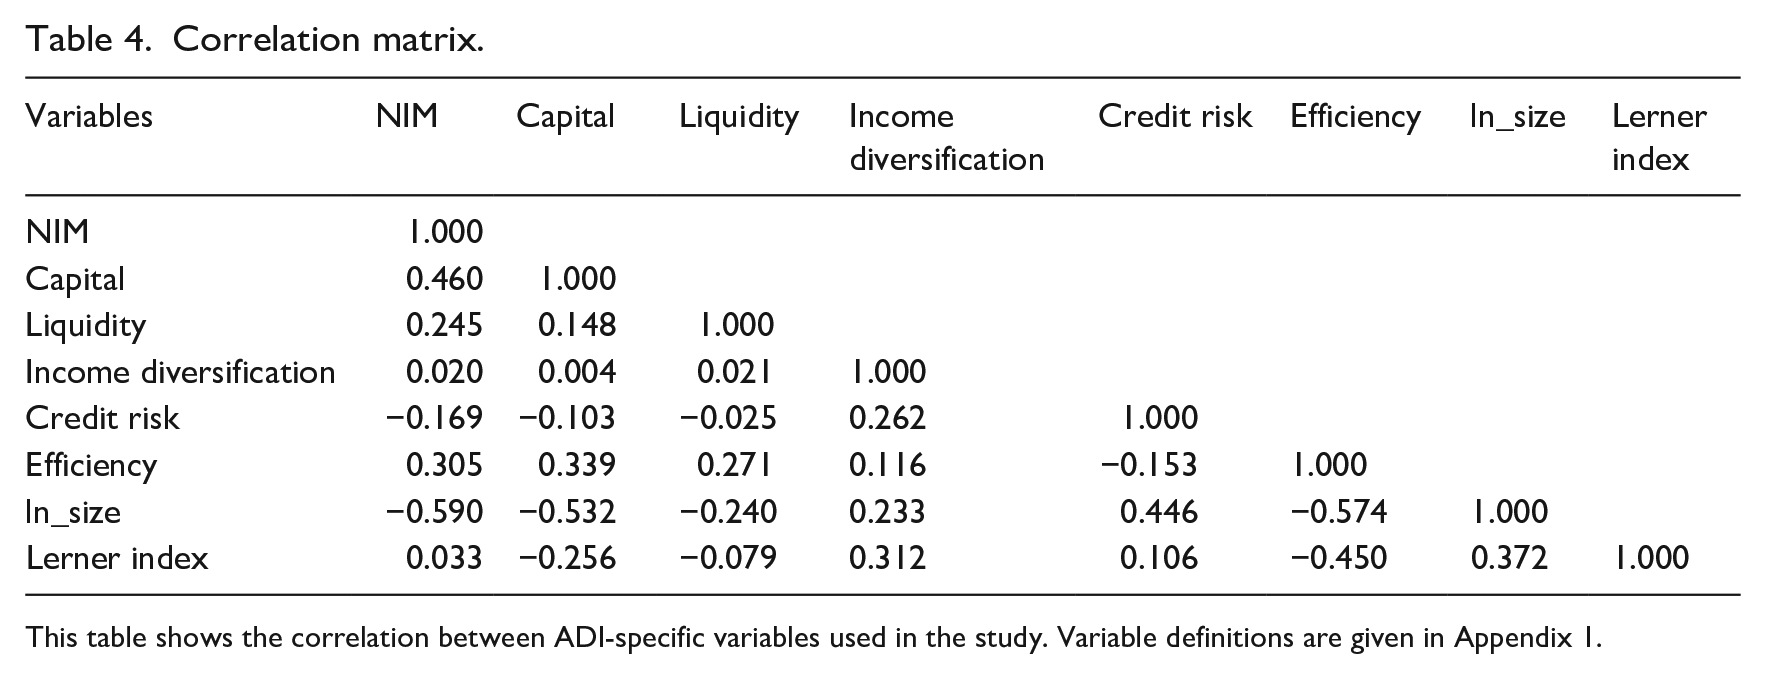
Following Philippon (2015) and Philippon (2016), we calculate the income share of finance and intermediated assets as a percentage of GDP, respectively, using the nominal GDP data extracted from the RBA database under ‘Gross Domestic Product and Income – H1’. Panel a of Figure 2 illustrates that the income share of finance and insurance is on a declining trend, whereas financial output (financially intermediated assets) is on an increasing trend. These opposite trends suggest that the cost of financial services for consumers is decreasing over time.
Cost of financial intermediation of Australia.
Panel b in Figure 2 shows that the unit cost of financial intermediation is trending downward in the Australian financial sector from a maximum of 2.36% in June 2010 to a minimum of 1.41% in March 2022. This contrasts with the United States (Philippon, 2015, 2016) where the cost is relatively constant at around 2%. The declining financial income share in Australia could be due to technological advancements and lower operational costs leading to lower costs for consumers.
5.2. Regression analysis for cost of financial intermediation
5.2.1. Financial sector
The unit cost of financial intermediation in Australia is positively associated with interest rates, as shown in Panel A of Table 5, implying that the declining cost of financial intermediation is a result of the declining interest rate environment, consistent with the findings of Bazot (2018). Furthermore, the coefficient for the lagged unit cost variable suggests the persistence of the unit cost. Dickey–Fuller and Breusch–Godfrey tests on the residuals indicate stationarity and no autocorrelation.
Regression results of unit cost (UC) and net interest margin (NIM).
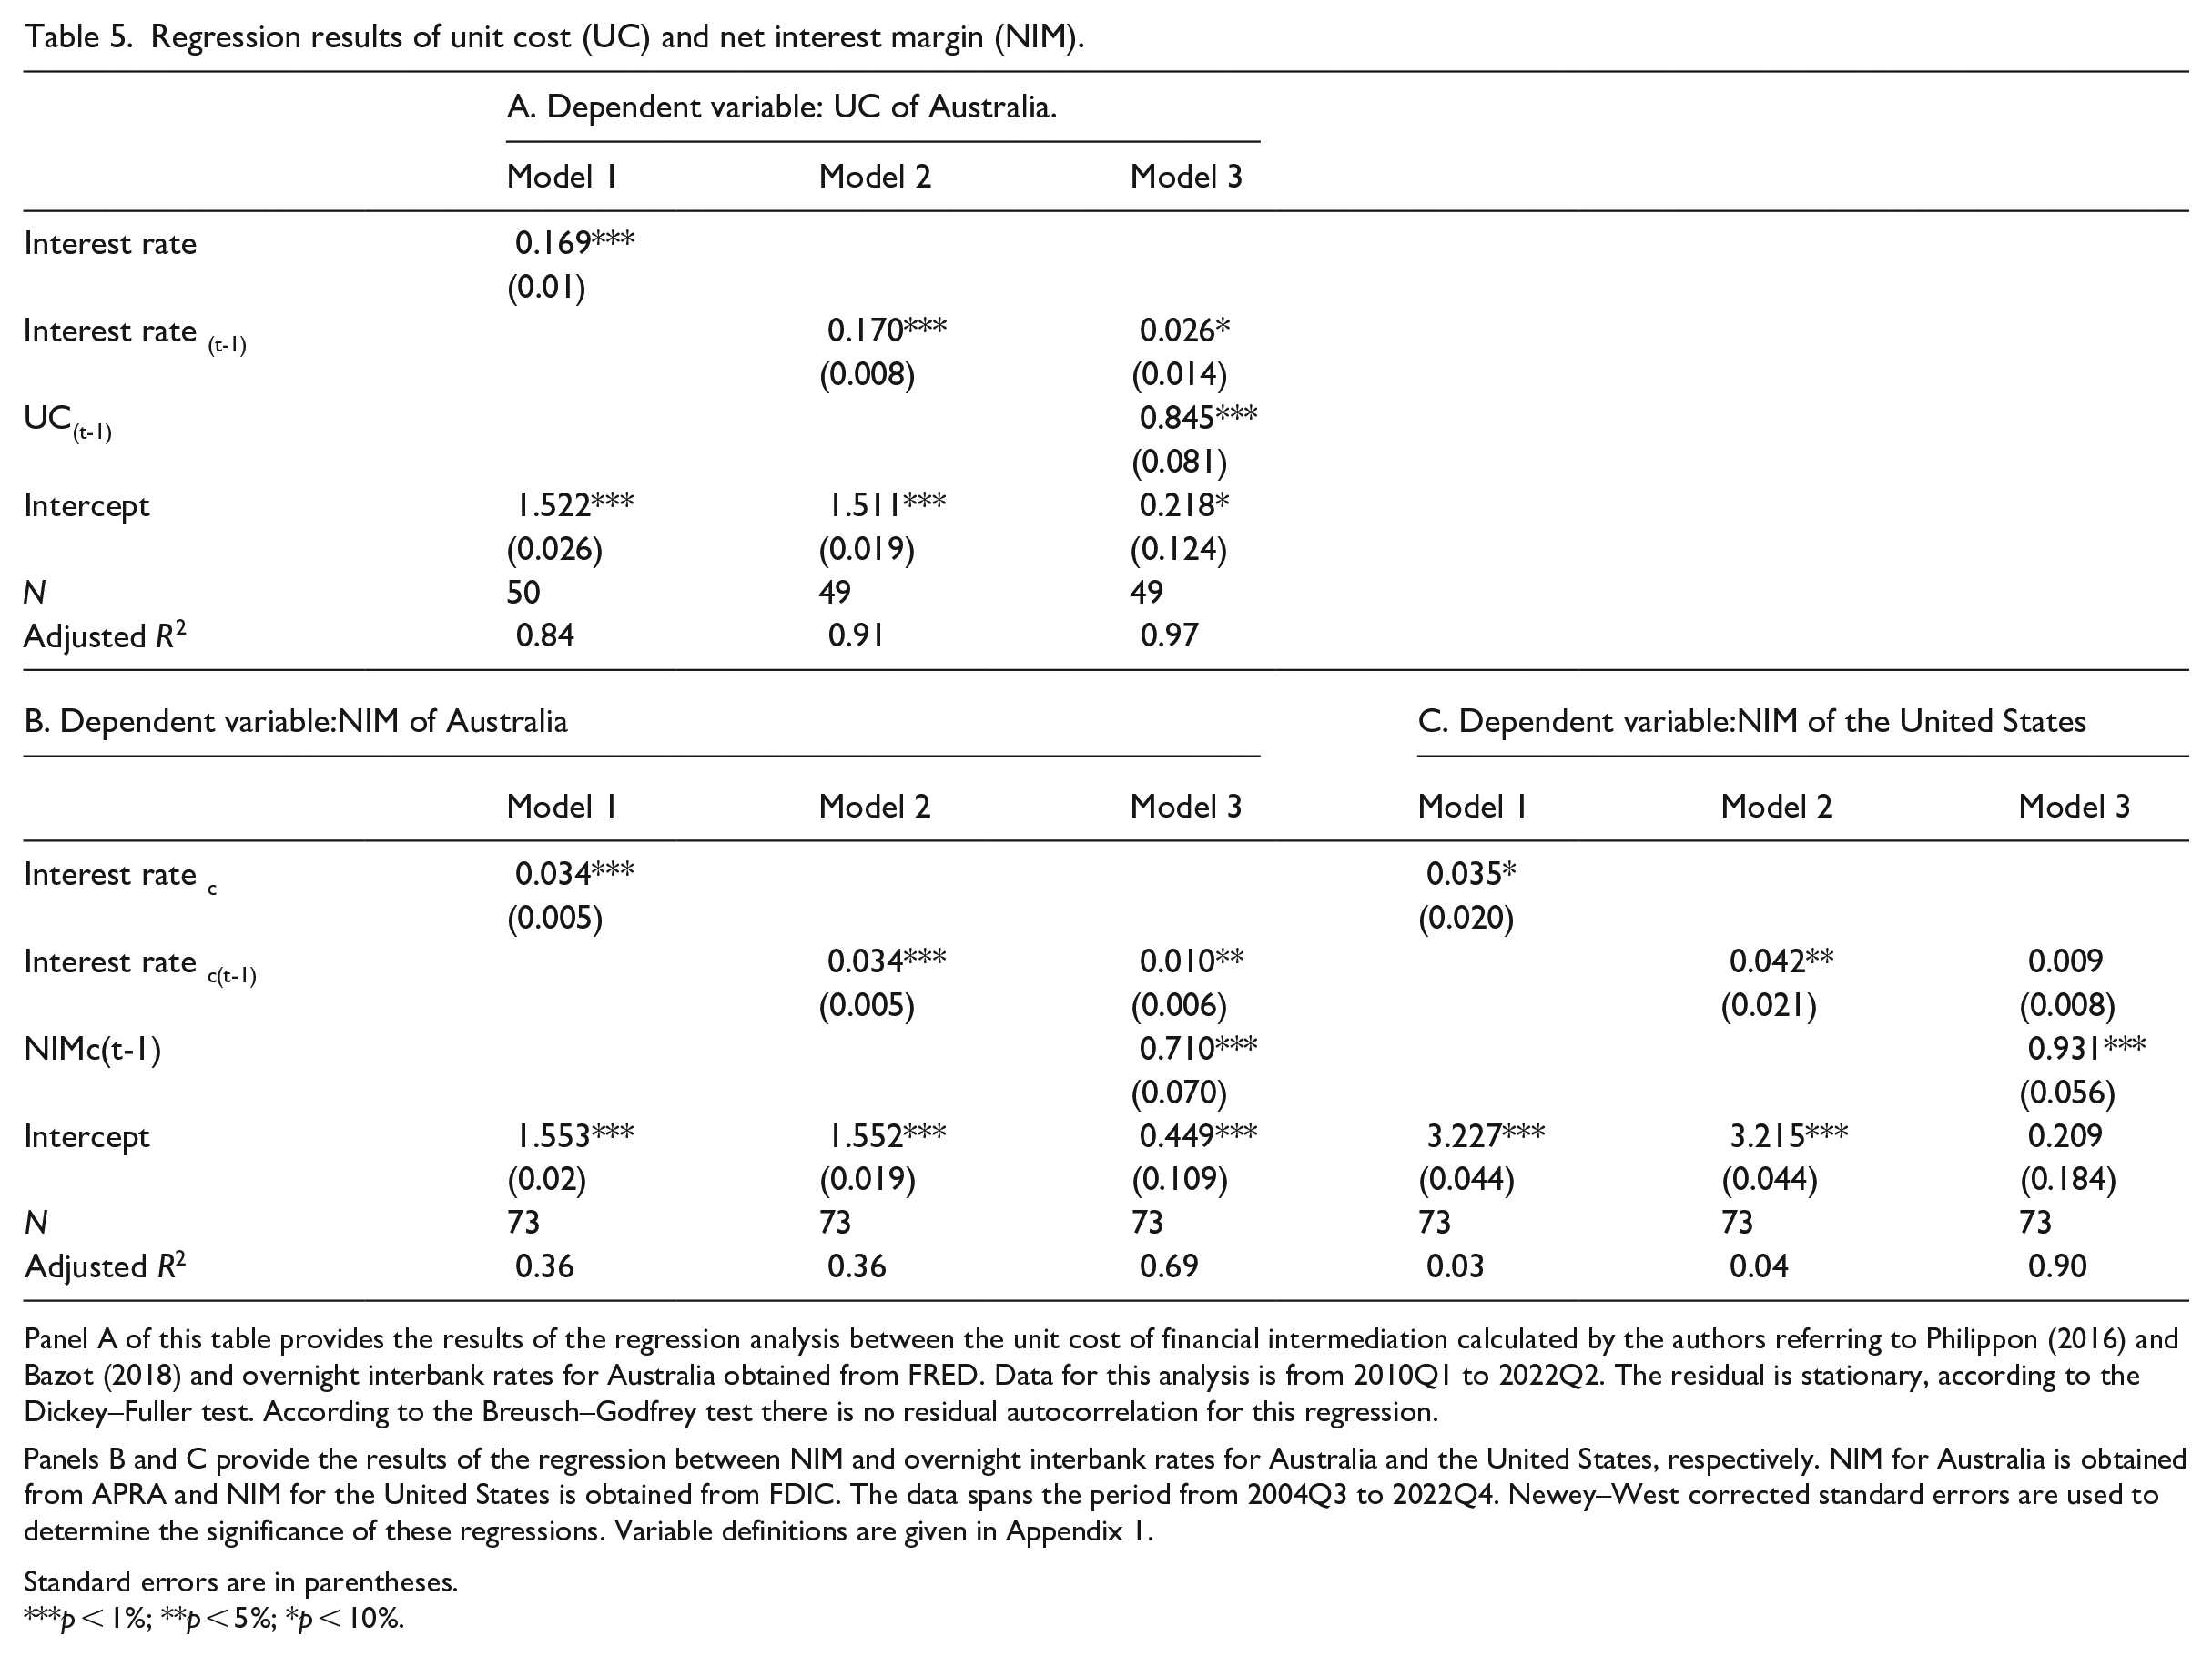
Panel A of this table provides the results of the regression analysis between the unit cost of financial intermediation calculated by the authors referring to Philippon (2016) and Bazot (2018) and overnight interbank rates for Australia obtained from FRED. Data for this analysis is from 2010Q1 to 2022Q2. The residual is stationary, according to the Dickey–Fuller test. According to the Breusch–Godfrey test there is no residual autocorrelation for this regression.
Panels B and C provide the results of the regression between NIM and overnight interbank rates for Australia and the United States, respectively. NIM for Australia is obtained from APRA and NIM for the United States is obtained from FDIC. The data spans the period from 2004Q3 to 2022Q4. Newey–West corrected standard errors are used to determine the significance of these regressions. Variable definitions are given in Appendix 1.
Standard errors are in parentheses.
p < 1%; **p < 5%; *p < 10%.
5.2.2. Banking sector
Figure 3 shows that the NIM of banks is downward trending in both Australia and the United States. A major difference between Australia and the United States is that most of the mortgage loans in the Australian financial sector are on variable interest rates compared with long-term fixed-rate loans dominant in the United States. Hence, we hypothesise that interest rates have higher explanatory power for NIMs in Australia than in the United States.
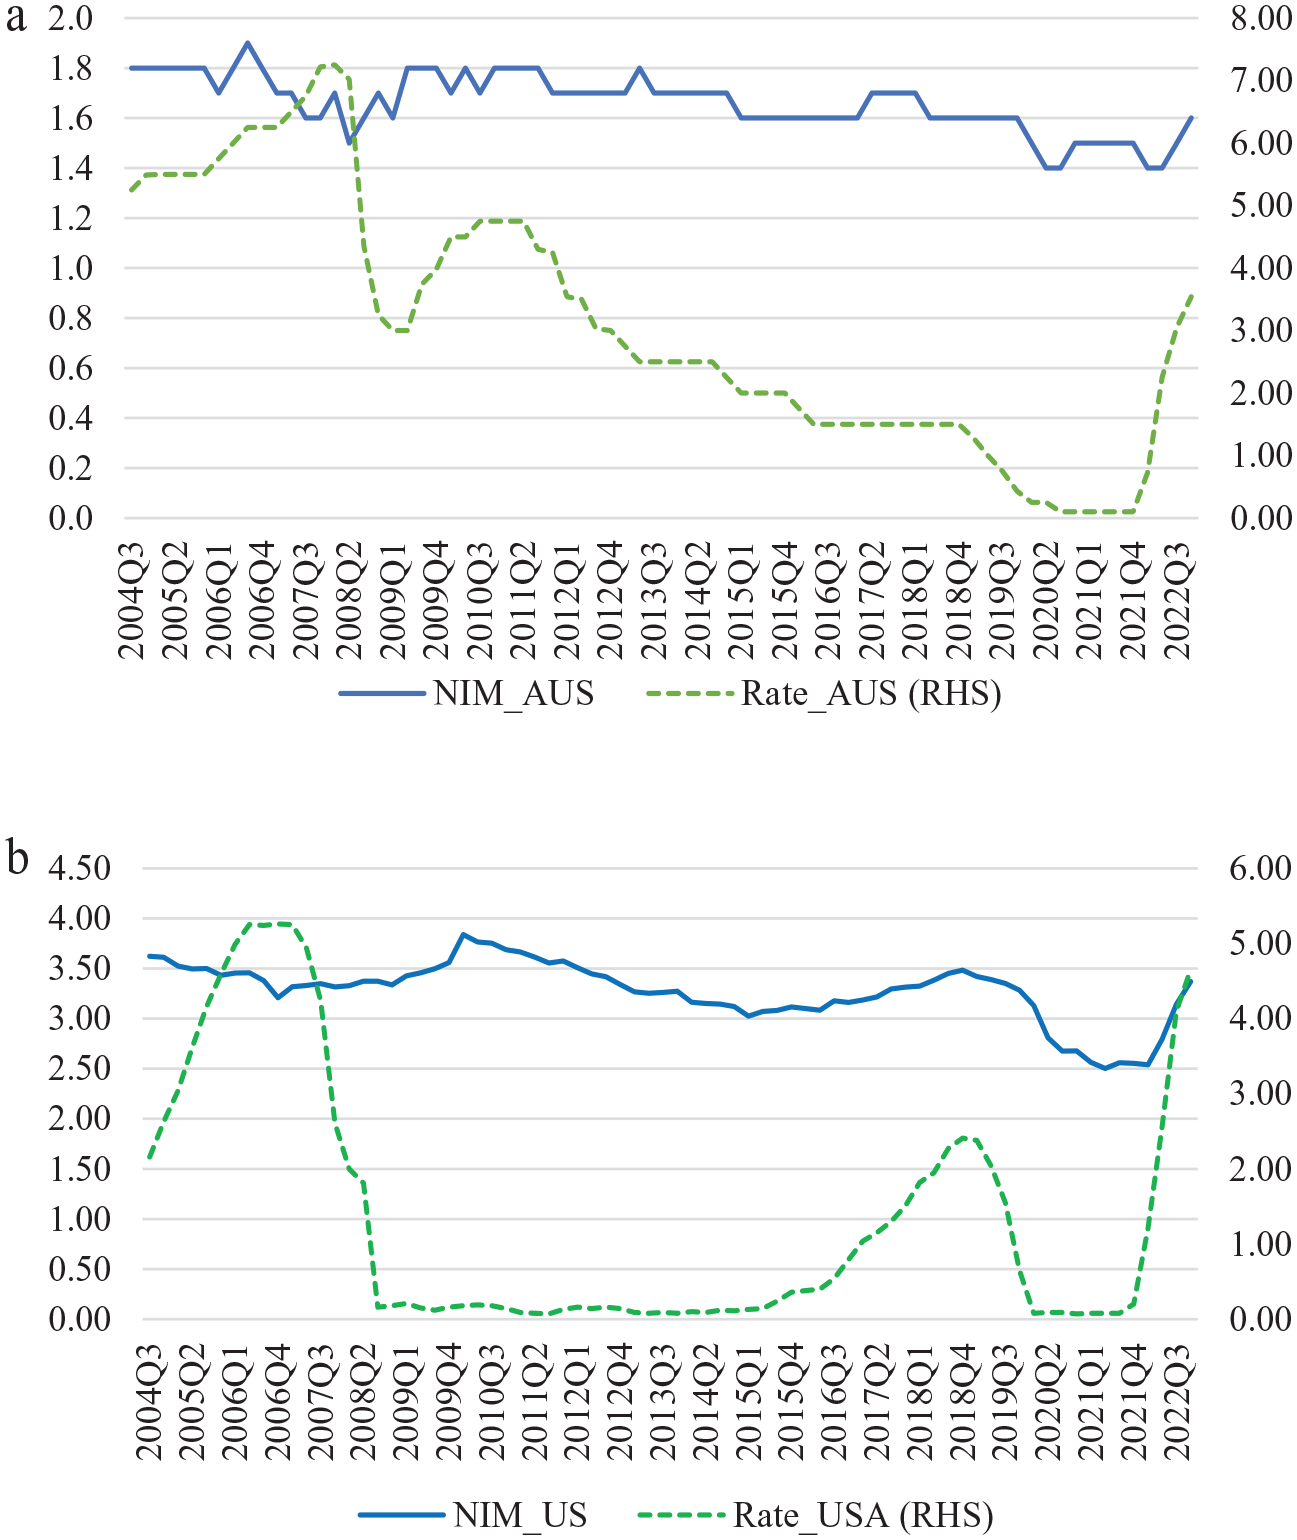
NIM and rates. Panel a – Australia. Panel b – the United States.
The regression analysis for the NIM and the interest rates presented in Table 5 Panels B and C confirm this hypothesis as the adjusted R2 is considerably higher for Australia than for the United States in model 1, which does not include the lagged NIM. 7 The lagged interest rates and NIMs have a positive relationship in Australia. Furthermore, the NIM exhibits persistence, as evidenced by its lagged coefficient of 0.71. While interest rates also have a significant positive relationship with NIM in the United States in model 1, when lagged NIM is included in the model, there is no statistically significant relation between interest rates and the NIM. The persistence of the NIM is also higher in the United States than in Australia. This result is in line with Campbell’s (2023) assertion that monetary policy transmission is ineffective in the United States given that a majority of the loans are on a fixed-rate basis, compared with countries where variable interest rate loans prevail.
In contrast, the RBA (2023) claims that monetary policy transmission through changing policy interest rates is carried out effectively via financial institutions in Australia. Brassil (2022) notes that the spread (interest rate on loans – interest rate on deposits) has been constant in Australia amid declining interest rates. Even when the spread is constant, the NIM falls when interest rates fall and rises when interest rates rise. Brassil (2022) argues that this relationship ‘mechanically results’ because the loan base is larger than the deposit base. Our finding is also consistent with Busch and Memmel (2017) who report a positive association between policy rates and the cost of financial intermediation in Germany.
In additional analyses shown in Table 6, we add indicator variables for changes in monetary policy, their interaction terms with interest rates and macroeconomic variables; the results remain qualitatively the same. When we compare the adjusted R2 of the regression results in model 1, it is clear that the independent variables explain a substantial fraction (69%) of the NIM in Australia. Since interest rates are insignificant for the United States, the higher adjusted R2 for model 1 (90%) implies that the NIM is mostly explained by its lag.
Regression analysis: Associations between net interest margin (NIM), interest rate and other variables.
A. Australia.
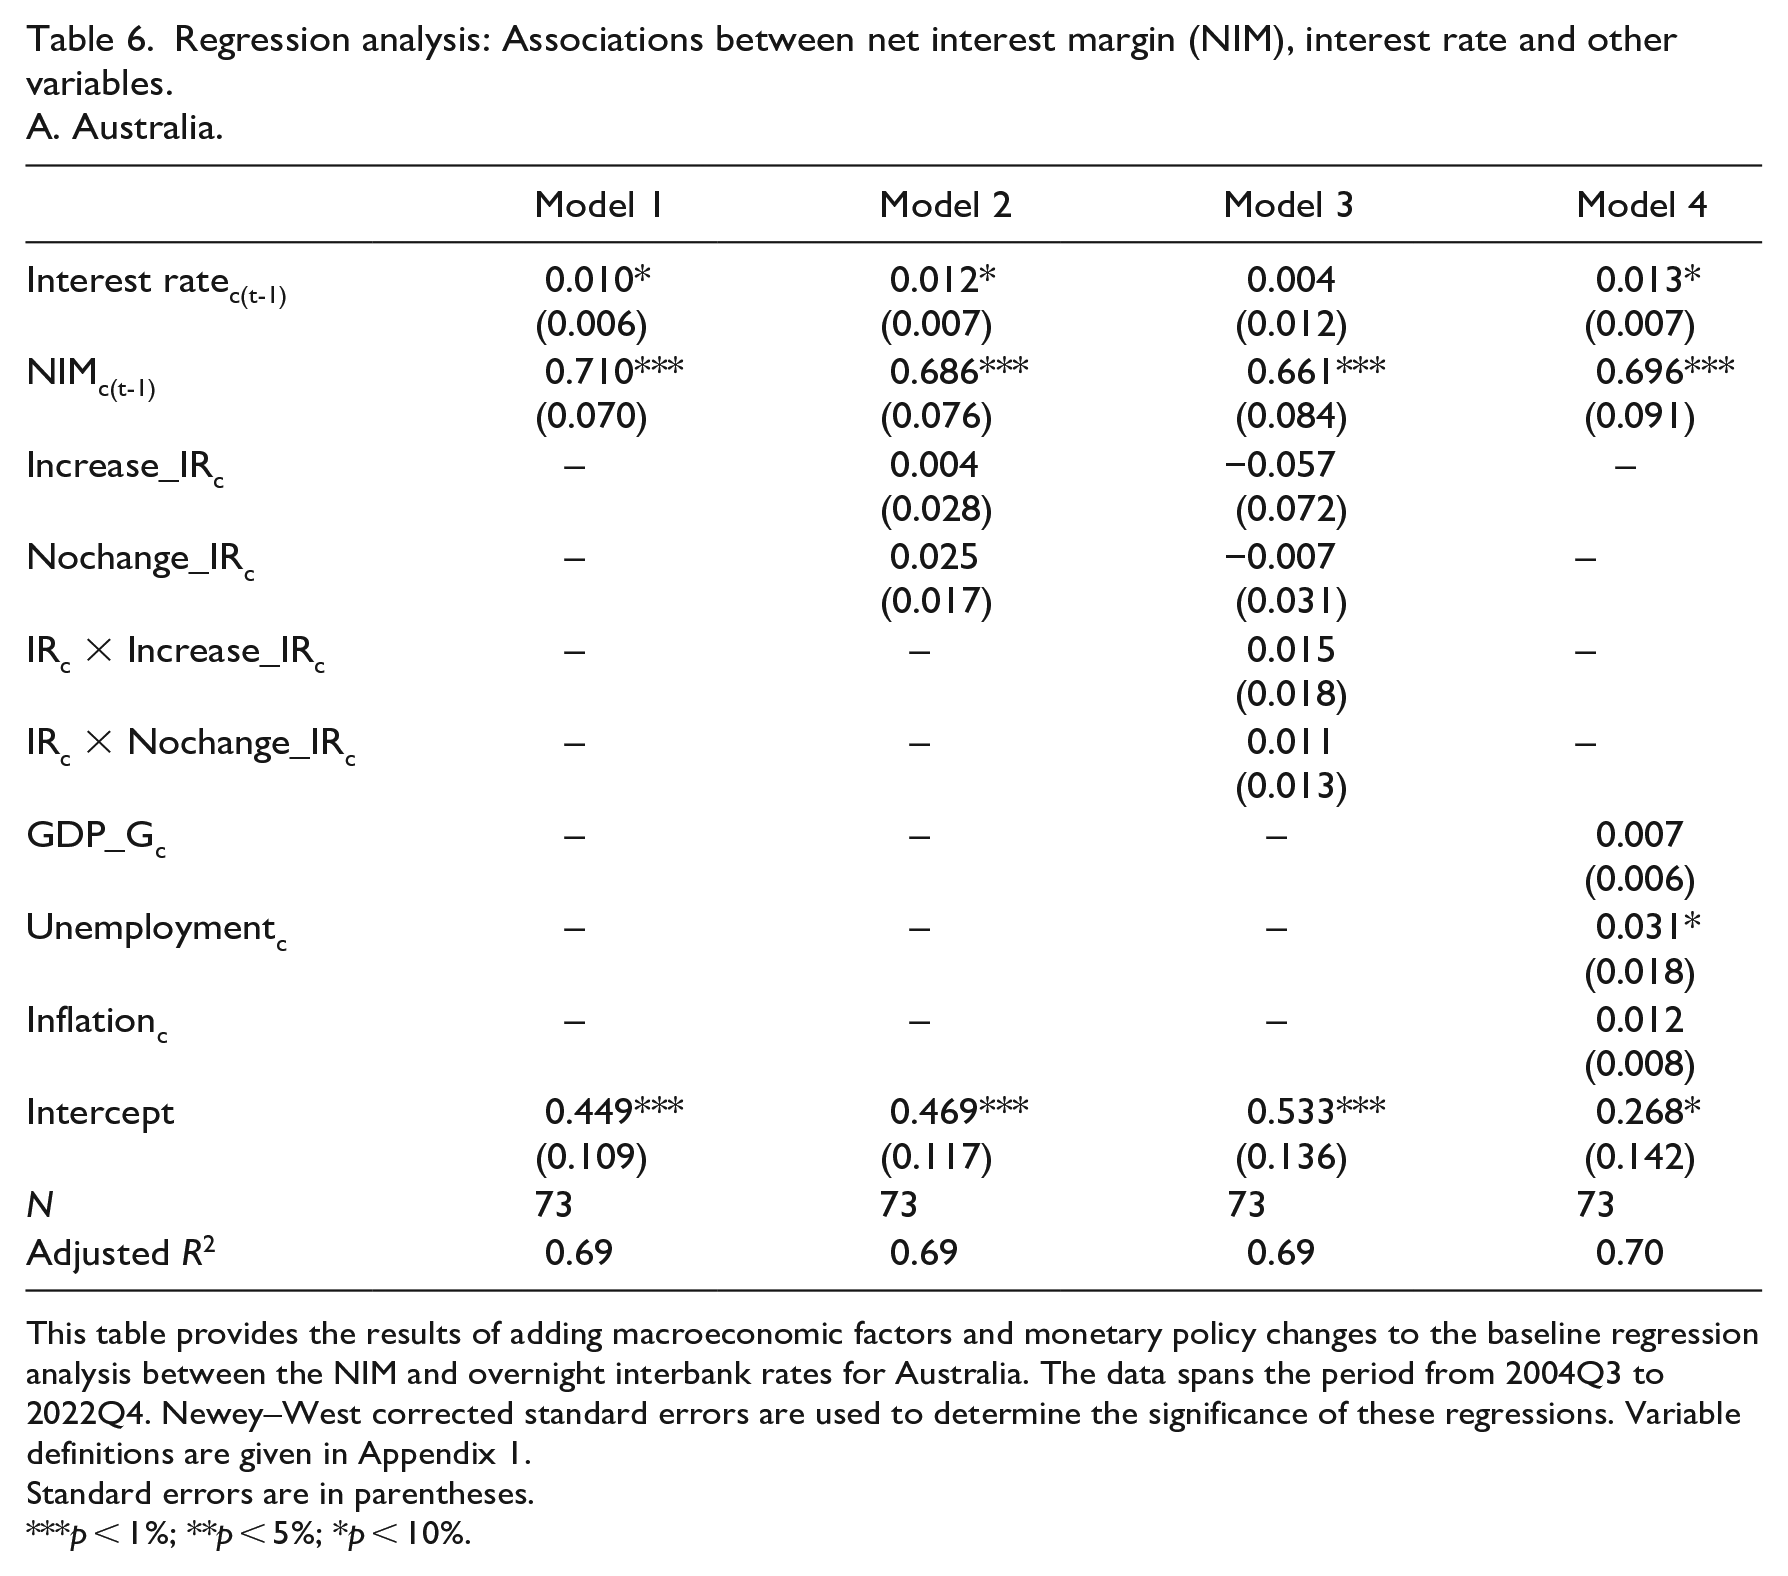
This table provides the results of adding macroeconomic factors and monetary policy changes to the baseline regression analysis between the NIM and overnight interbank rates for Australia. The data spans the period from 2004Q3 to 2022Q4. Newey–West corrected standard errors are used to determine the significance of these regressions. Variable definitions are given in Appendix 1.
Standard errors are in parentheses.
p < 1%; **p < 5%; *p < 10%.
Panel B. The United States.
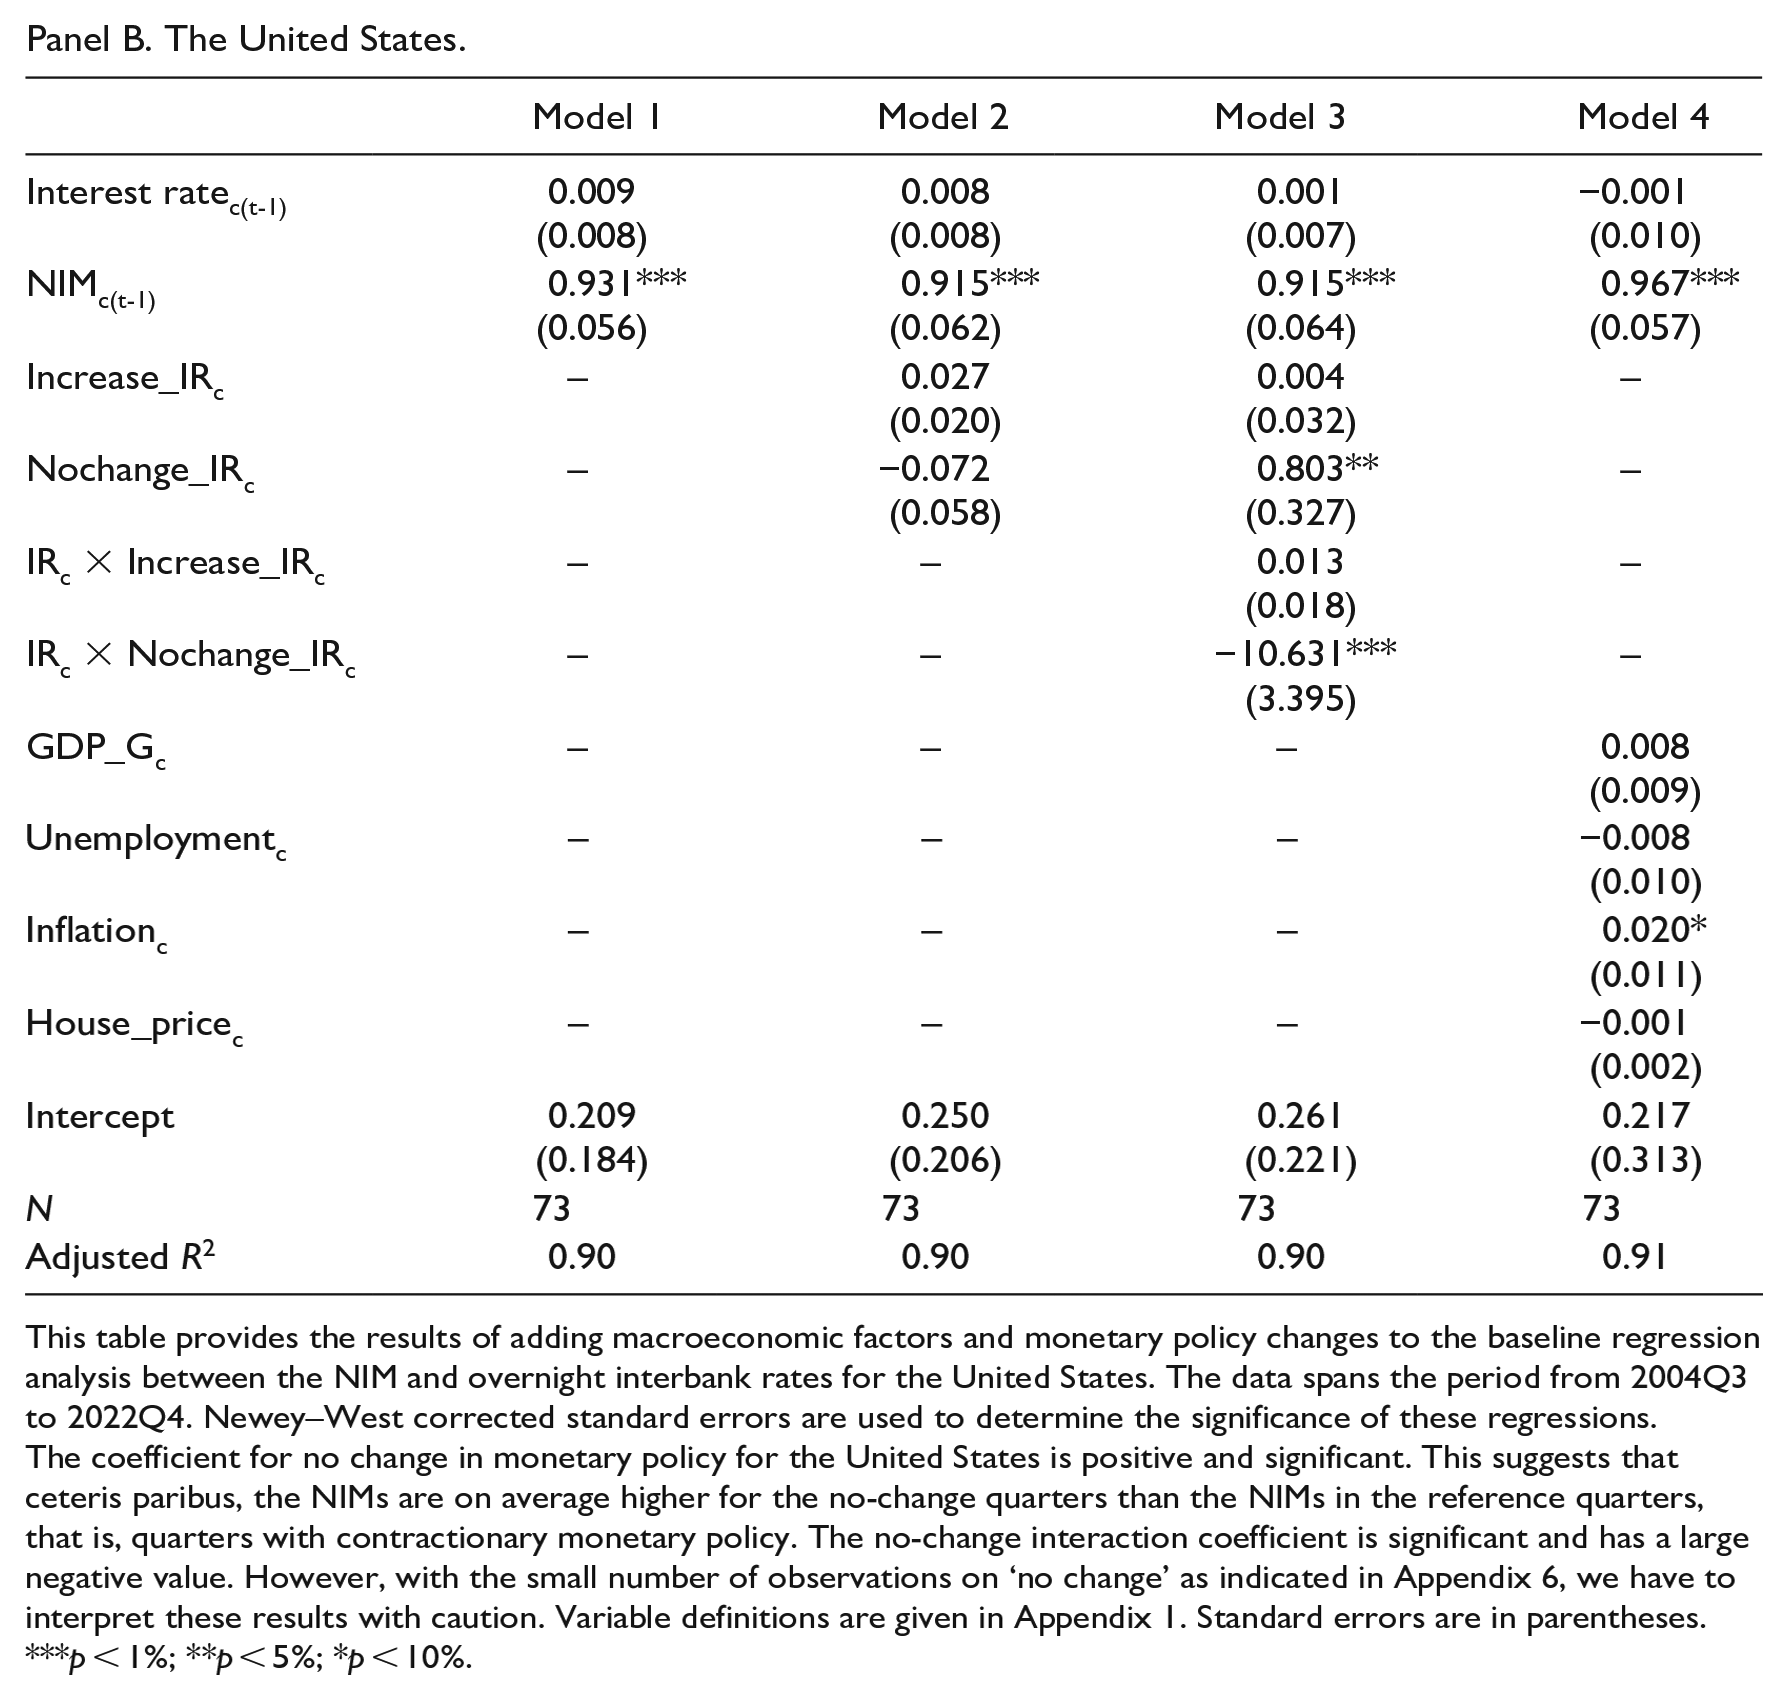
This table provides the results of adding macroeconomic factors and monetary policy changes to the baseline regression analysis between the NIM and overnight interbank rates for the United States. The data spans the period from 2004Q3 to 2022Q4. Newey–West corrected standard errors are used to determine the significance of these regressions.
The coefficient for no change in monetary policy for the United States is positive and significant. This suggests that ceteris paribus, the NIMs are on average higher for the no-change quarters than the NIMs in the reference quarters, that is, quarters with contractionary monetary policy. The no-change interaction coefficient is significant and has a large negative value. However, with the small number of observations on ‘no change’ as indicated in Appendix 6, we have to interpret these results with caution. Variable definitions are given in Appendix 1. Standard errors are in parentheses.
p < 1%; **p < 5%; *p < 10%.
5.2.3. ADI-level analysis
Table 7 shows that three ADI-specific variables, type, income diversification and size, are negatively associated with NIM. As ‘Type’ is a dummy variable for shareholder-owned ADIs, the negative coefficient indicates that the NIM is lower for shareholder-owned ADIs. This is a noteworthy finding as we expected customer-owned ADIs to exhibit lower NIMs because they are not profit-oriented.
Regression results using the ADI-level data.
Dependent variable: NIM.
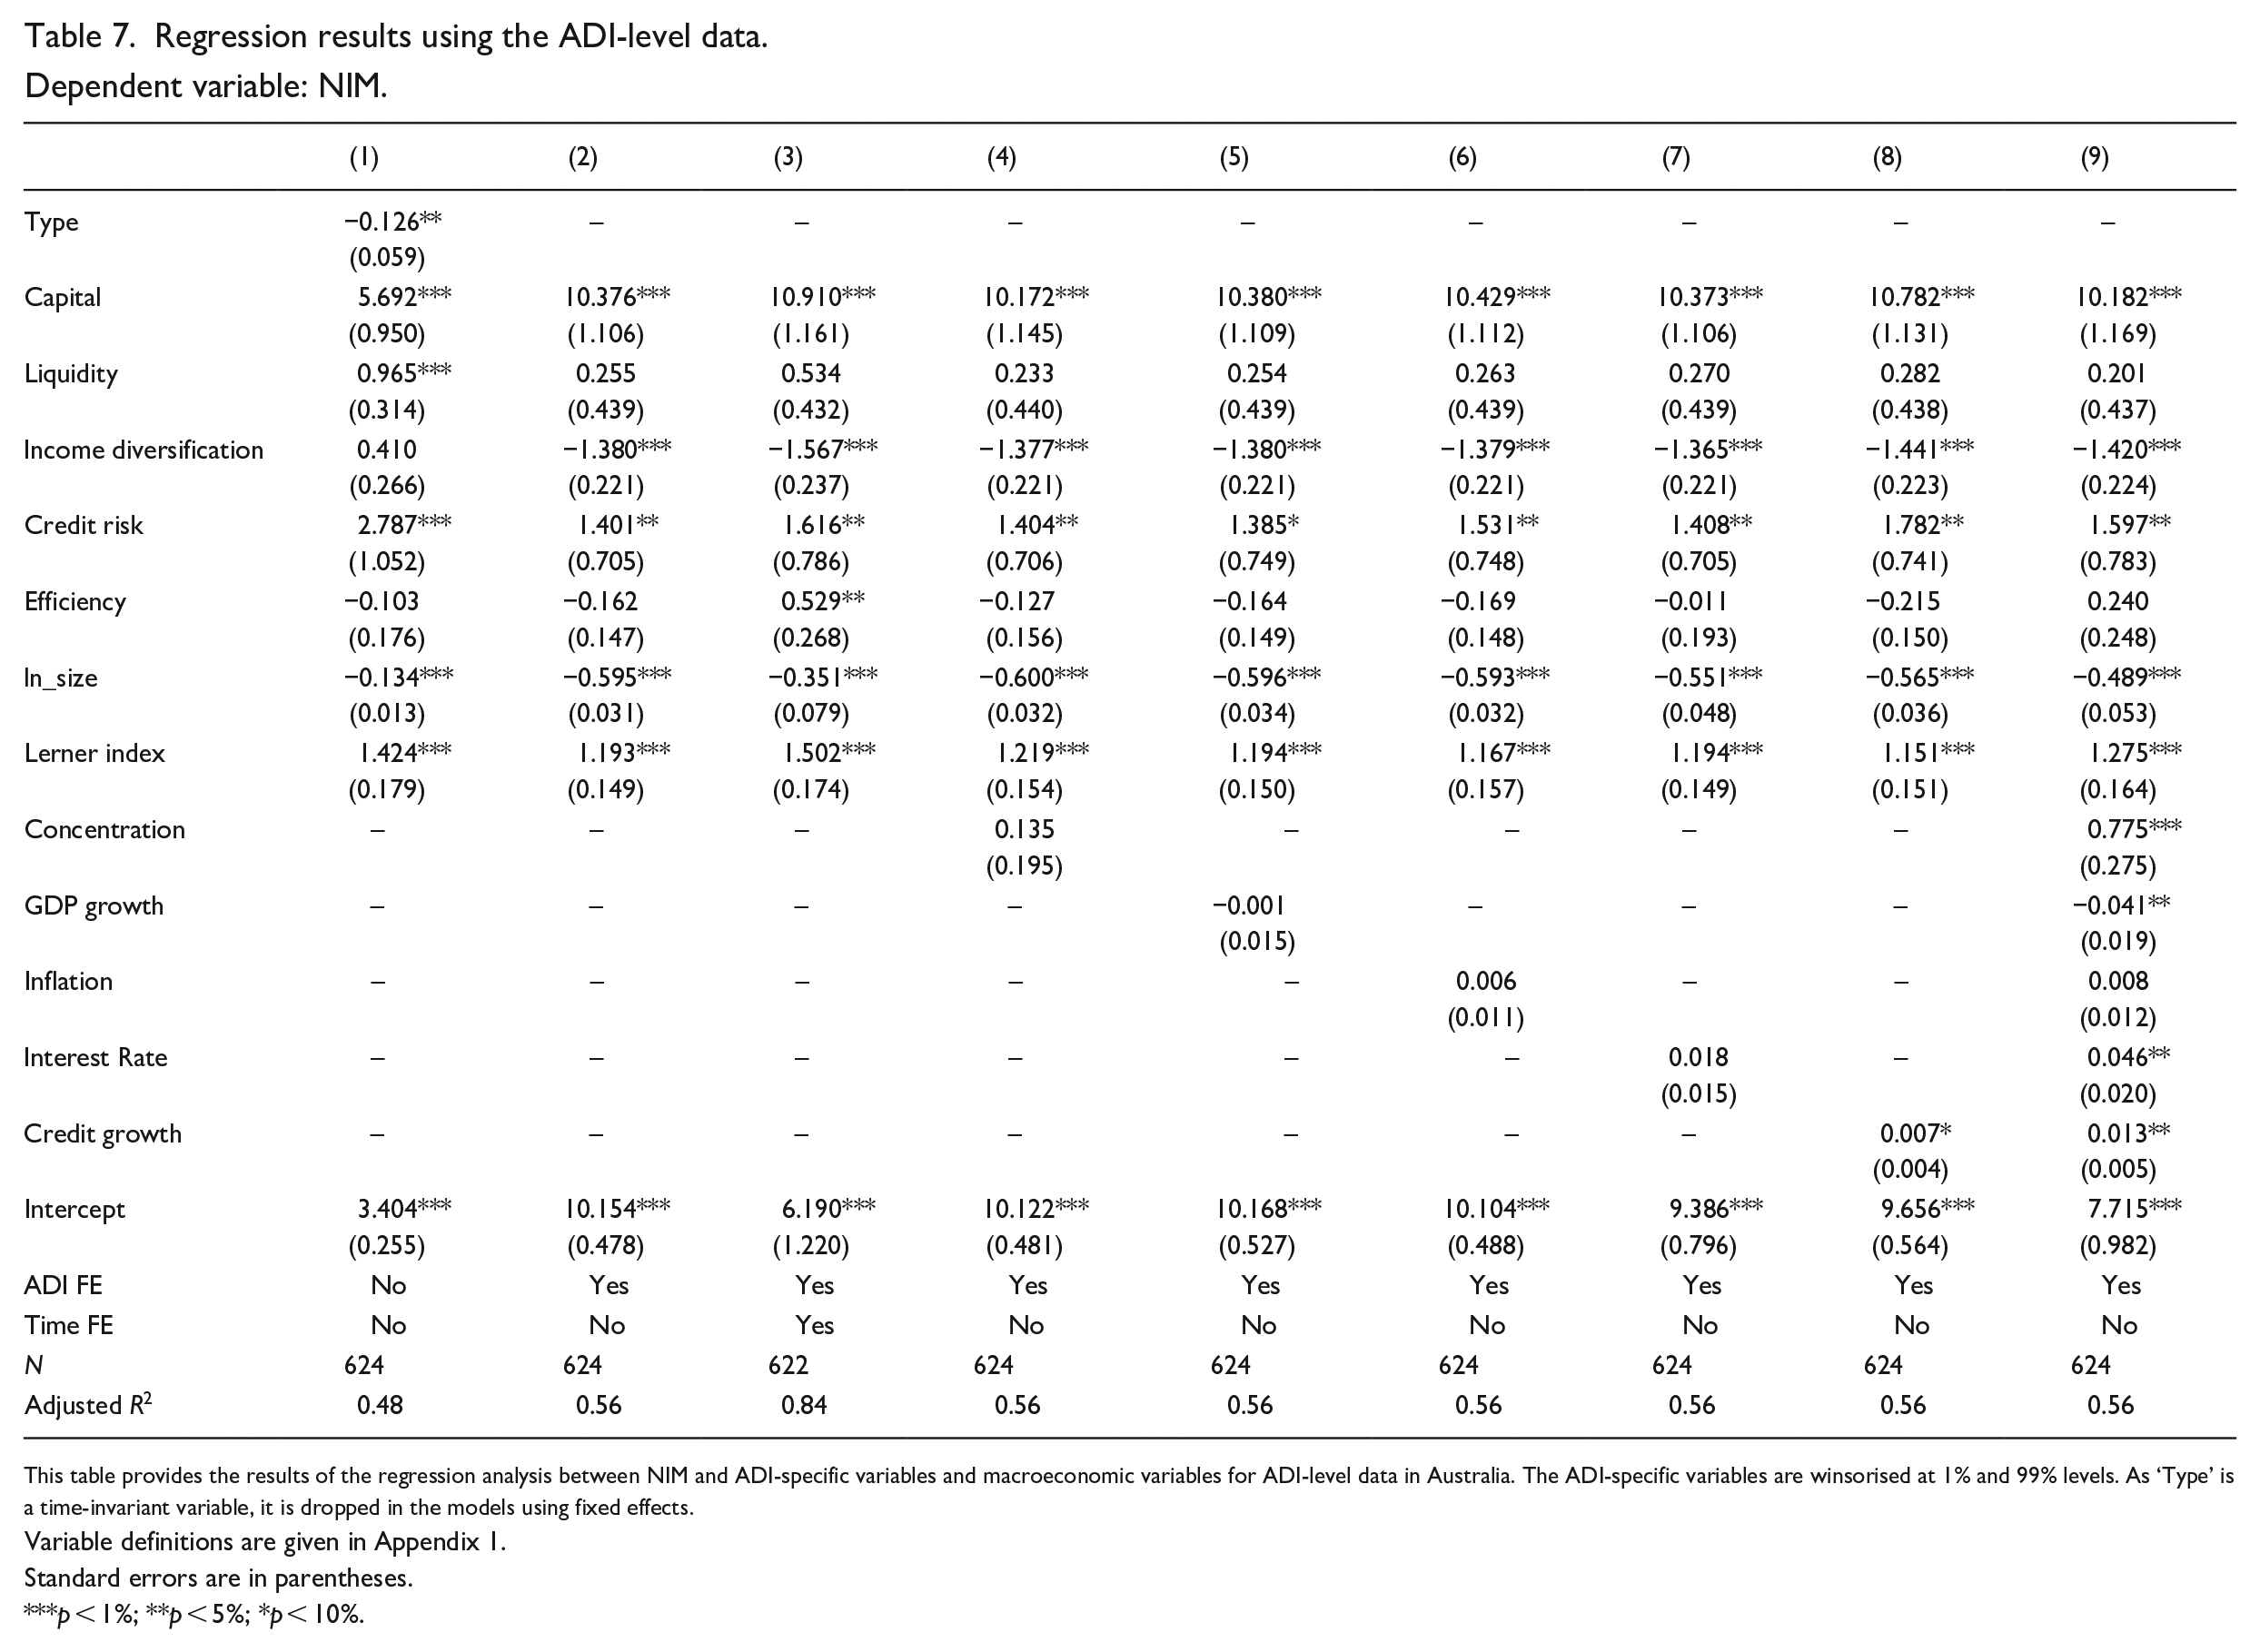
This table provides the results of the regression analysis between NIM and ADI-specific variables and macroeconomic variables for ADI-level data in Australia. The ADI-specific variables are winsorised at 1% and 99% levels. As ‘Type’ is a time-invariant variable, it is dropped in the models using fixed effects.
Variable definitions are given in Appendix 1.
Standard errors are in parentheses.
p < 1%; **p < 5%; *p < 10%.
Income diversification is negatively associated with NIM. This is because when ADIs have sources other than loans and advances to generate revenue, they need not charge high rates for loans and offer low rates for deposits to increase NIM. Calice and Zhou (2018) report similar results, whereas Iannotta et al. (2007) do not find a significant association between income diversification and profitability. Size, as measured by total assets, reflects scale advantages, enabling banks to achieve high profits without imposing high rates on customers. As expected, when size increases NIM decreases (Calice and Zhou, 2018; Carbó-Valverde et al., 2021; Kohlscheen et al., 2018; Maudos and De Guevara, 2004).
Capital ratio, credit risk and the Lerner index are positively associated with bank NIM. High capital ratios of an ADI may have vague implications for the NIM, potentially exerting either positive or negative effects. Whereas holding excess capital may limit leverage and reduce returns, thereby exerting downward pressure on NIM, our results support a positive effect. When an ADI has a higher capital ratio, 8 the cost of funds is lower as it is less dependent on borrowings, thereby increasing NIM (Calice and Zhou, 2018; Jarmuzek and Lybek, 2018; Maudos and De Guevara, 2004). Furthermore, banking regulations require ADIs to hold a certain amount of capital against their lending denoted as the minimum capital ratio. As a result, more capital increases the capacity to lend, improving the NIM, as identified by Maudos and de Guevara (2004), Calice and Zhou (2018), Jarmuzek and Lybek (2018) and Carbo-Valverde et al. (2021).
ADIs in Australia employ various strategies to shift risks to customers, such as requiring borrowers to obtain Lenders’ Mortgage Insurance for high loan-to-value ratios to mitigate credit risk and minimising interest rate risk by offering most loans under variable rates. The practice of ADIs maintaining higher capital ratios, despite passing on risks to consumers is concerning given that our findings indicate that the accumulation of higher capital levels is associated with higher NIMs. Australian Government’s Productivity Commission (2018) notes that large Australian financial institutions transfer costs and risks to their customers, thereby increasing profits. The lack of competitive pressure within the market is highlighted as the main reason.
When credit risk increases, NIM increases as loan rates are set to compensate for credit risk. Such a positive association was reported by Naceur and Omran (2011), Jarmuzek and Lybek (2018) and Carbo-Valverde et al. (2021), for different measures of credit risk. For instance, some studies used provisions over total assets, impaired loans to average loans and net loans to total assets, whereas we use impairment or provision charge in the income statement over interest income, which directly measures the impact on NIM from credit risk.
The Lerner index 9 of individual ADIs has a positive association with NIM. This implies that lower competition increases the NIM, and vice versa, consistent with Calice and Zhou (2018) and Cruz-Garcia et al. (2019). Even though competition improves efficiency and lowers the cost of financial intermediation, the competition-stability view posits that high competition leads banks to take higher risks resulting in increased fragilities and high default risk (Beck et al., 2013; Berger et al., 2009; Gan, 2004; Jiang et al., 2023; Keeley, 1990). However, high competition with effective banking regulations could enhance customer welfare without compromising the stability of the banking system.
The liquidity ratio shows a positive association with NIM when regressed separately but has no effect when considered in conjunction with other variables. We expected liquidity to have a negative association with NIM, as maintaining liquid assets restricts the earnings capacity of an ADI, thereby lowering NIM. As liquidity is regulated by the APRA, all ADIs are required to maintain a minimum level of liquid assets to match their liabilities. Thus, all ADIs may be facing a similar level of restriction on generating income caused by liquid assets requirement. Among studies on bank NIM investigating liquidity ratios, Maudos and de Guevara (2004) and Iannotta et al. (2007) report insignificant results, similar to our study. The expected negative association between liquidity and NIM is reported in the works by Kohlscheen et al. (2018), Cruz-Garcia and de Guevara (2020), and Carbo-Valverde et al. (2021).
Operational inefficiency does not yield significant results when used with other variables but is positively associated with NIM in model 3 of Table 7 when time and firm fixed effects are used. This positive association arises because NIM must compensate for the operational expenses for the ADI to be profitable. This result is consistent with other studies, including Maudos and de Guevara (2004), Naceur and Omran (2011), Calice and Zhou (2018), Jarmuzek and Lybek (2018) and Carbo-Valverde et al. (2021).
We use the concentration ratio measured by the asset share of the ‘Big 4’ banks as a sector-level competition measure. As expected, concentration is positively associated with NIM. When the market share of the ‘Big 4’ increases, competition declines, enabling them to charge higher rates and realise greater profit margins, ultimately contributing to higher costs of financial intermediation.
Among the macroeconomic variables analysed, interest rate and credit growth exhibit a positive association with NIM, and GDP growth shows a negative association, while inflation does not provide any significant results. When interest rates increase, ADIs tend to increase loan rates by more or faster than deposit rates. Furthermore, Brassil (2022) demonstrates that the inherent mismatch between loans and deposits automatically increases the interest rate margin.
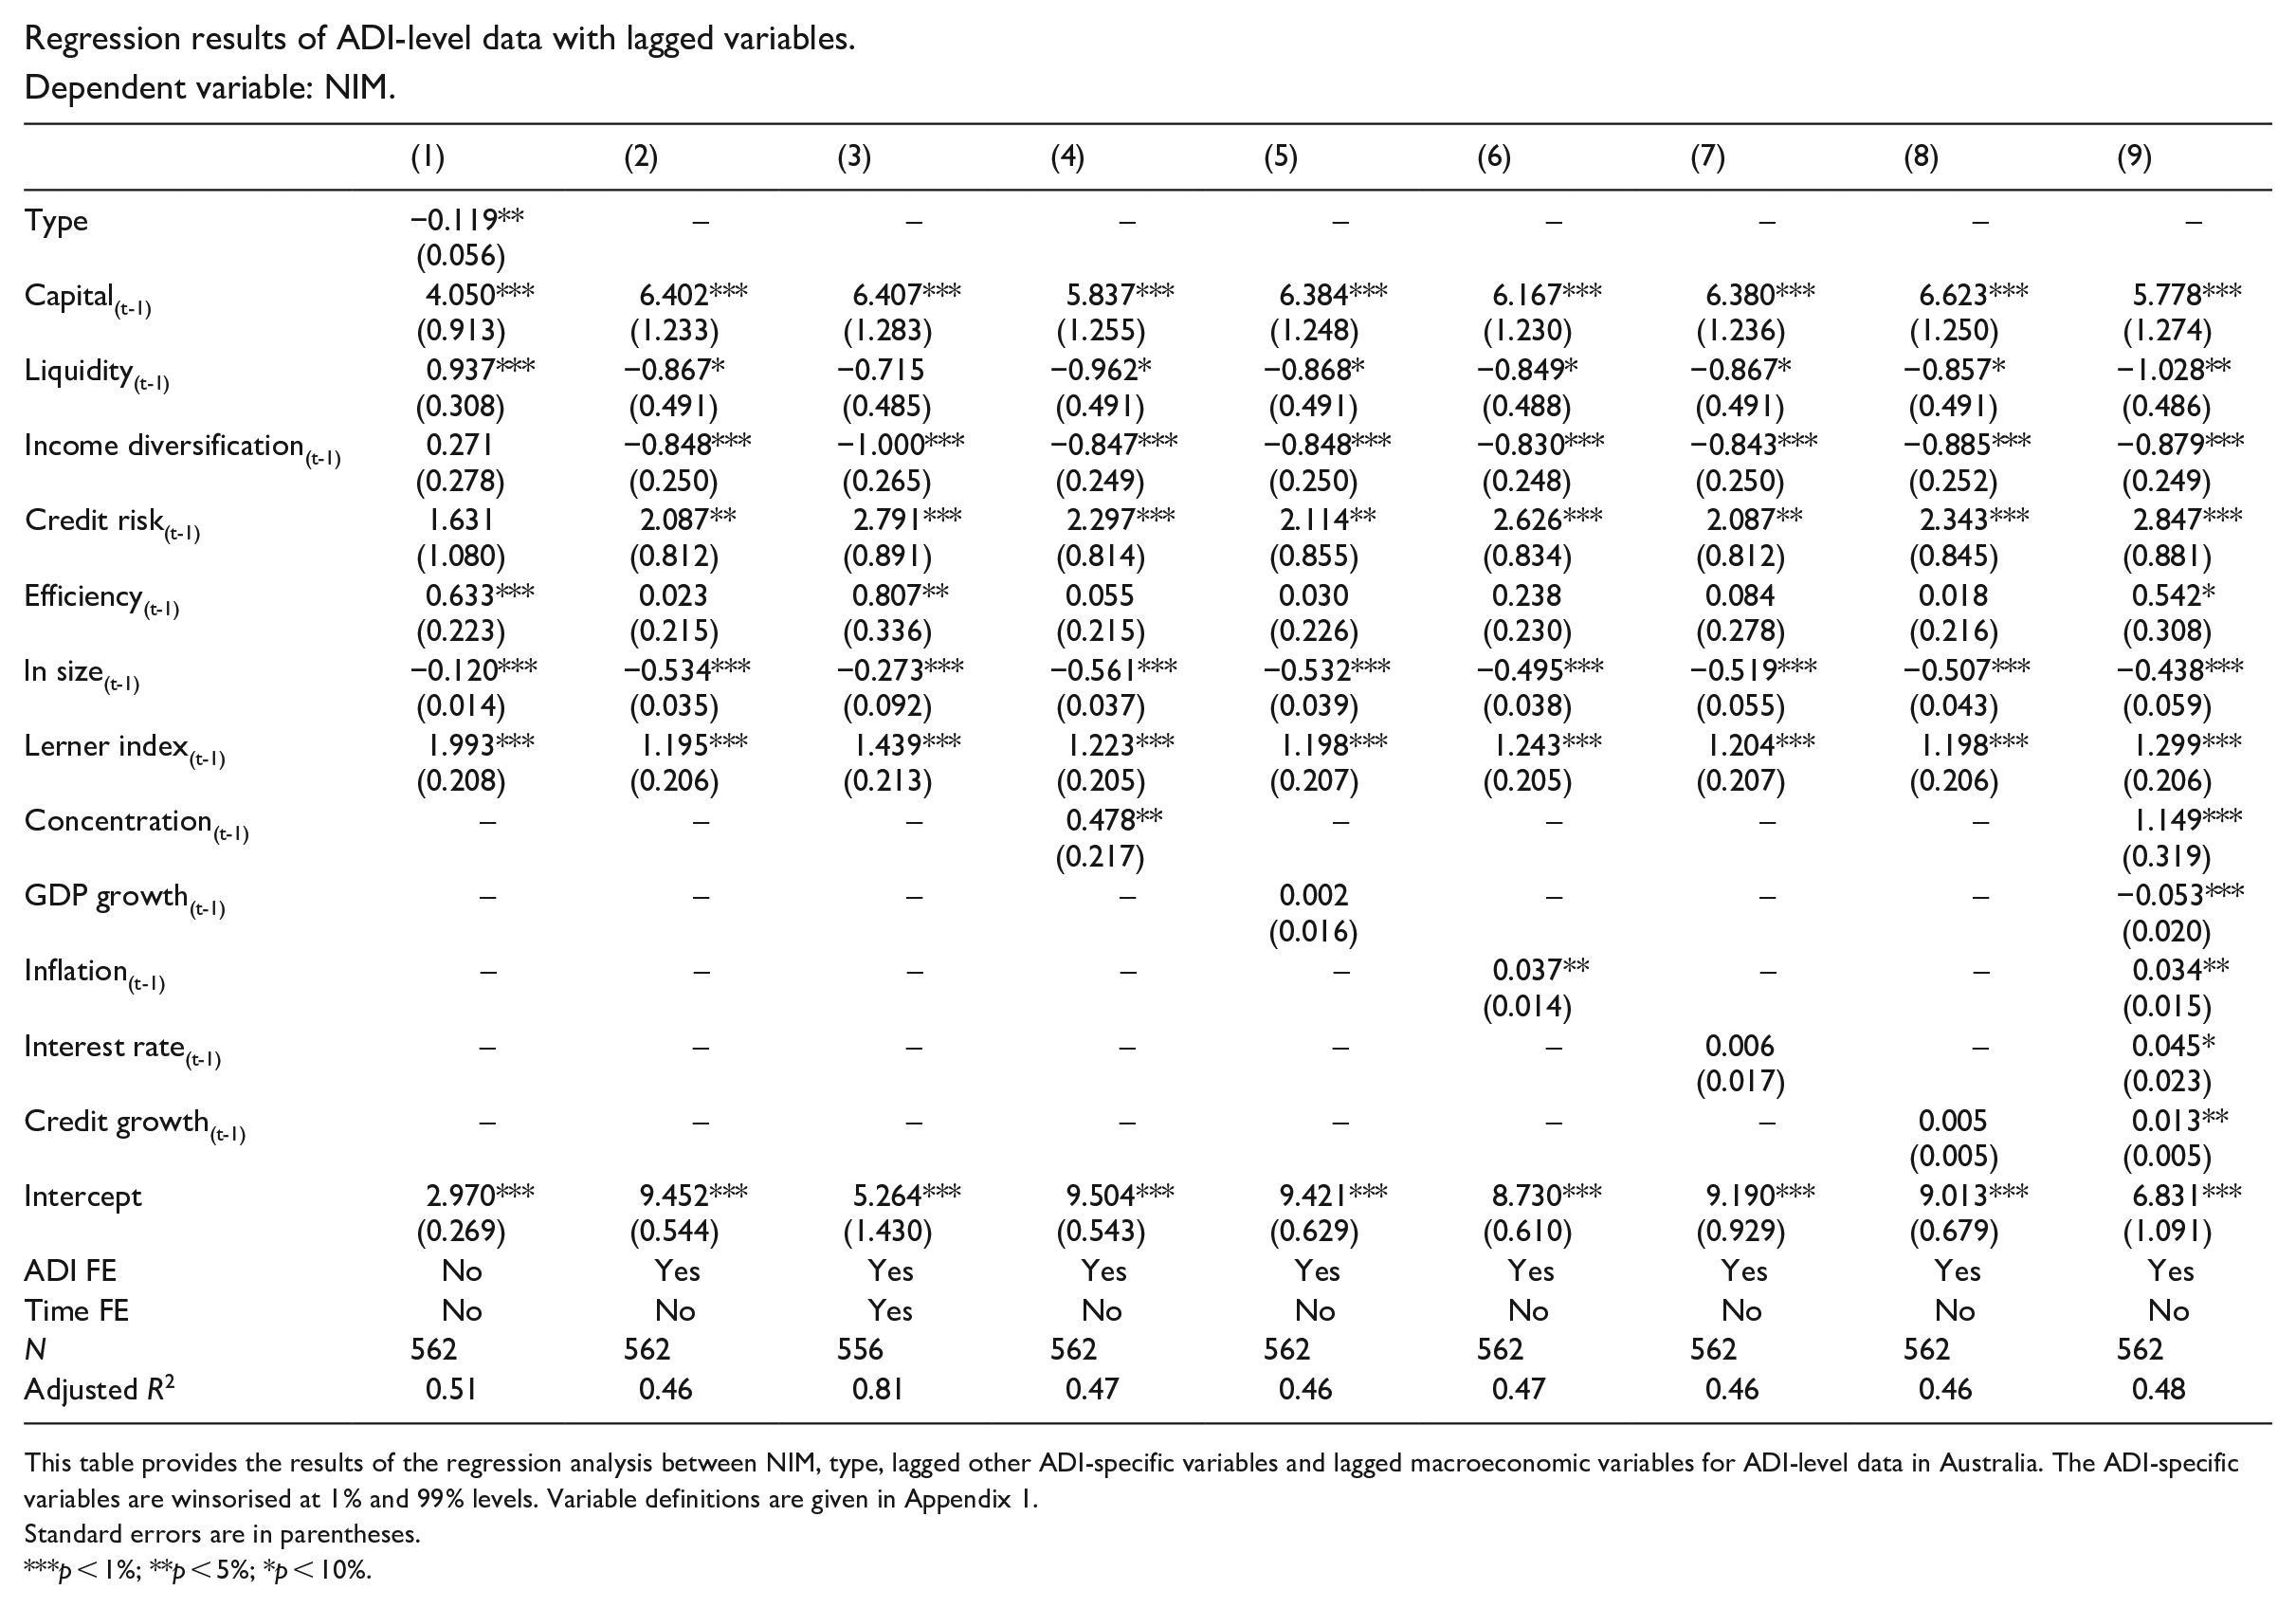
The results of an alternative regression model with lagged variables for all ADI-specific variables except for ‘Type’ are presented in Appendix 5. The R2 values of these models are slightly lower, but all variables previously associated with NIM remain significant.
5.3. Comparing financial statements of different types of financial institutions
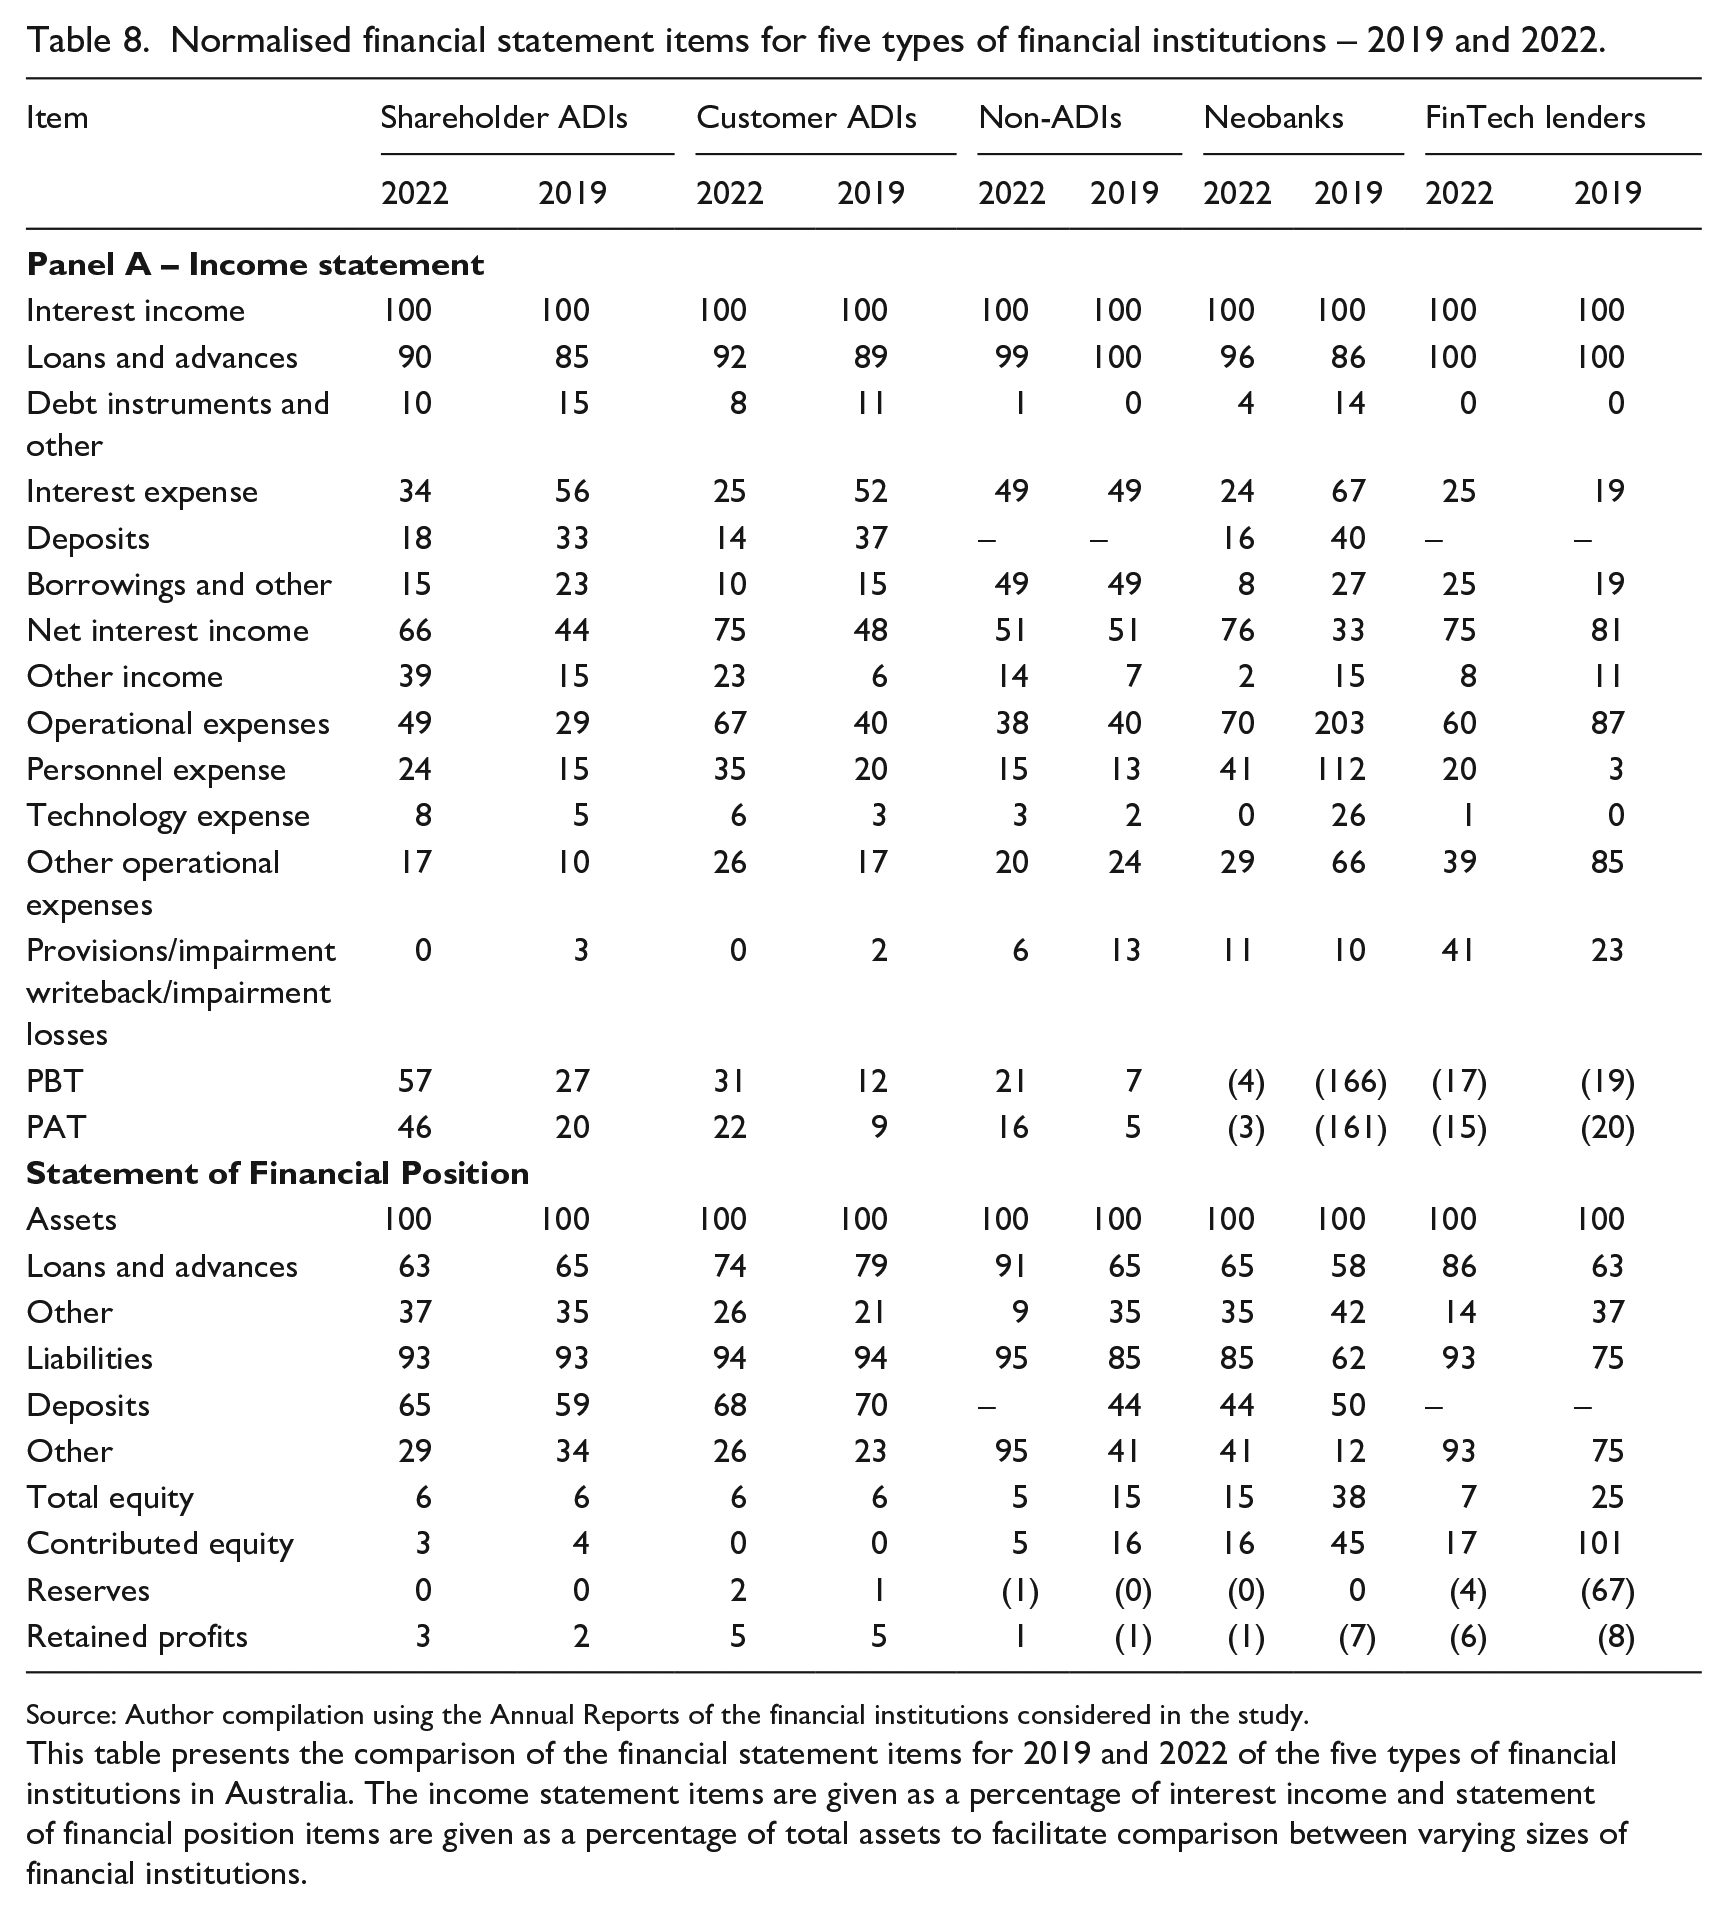
In this section, we compare the weighted average financial statements of the five types of financial institutions in Australia and identify components contributing to financial intermediation. The normalised weighted average financial statements for each of the five types of financial institutions are presented in Table 8.
a. All financial institutions were profitable except the FinTechs (neobanks and FinTech lenders). Shareholder ADIs were the most profitable, followed by the customer-owned ADIs and the non-ADIs. Figure 4 compares the financial performance across financial years 2019-2022, revealing a heterogeneous impact of the COVID-19 pandemic on financial institutions. Profit before tax of shareholder ADIs declined abruptly in 2020 and recovered to exceed the pre-pandemic level in 2021. In contrast, customer-owned ADIs did not record such a sharp contraction and continued to increase profits over time. This steady growth may reflect the positive impact of customer service quality on the financial performance of Australian financial institutions, as documented in the work by Duncan and Elliott (2004). Non-ADIs did not experience a considerable adverse impact from the pandemic on their profits. Instead, they recorded increasing profits up to 2021 and reported a slight decline in 2022. Neobanks and FinTech lenders aggravated their loss positions during the pandemic.
b. The proportion of interest expenses was highest for the non-ADIs in 2022, potentially attributable to their limited access to deposits, compared to ADIs. As non-ADIs are not authorised to obtain deposits, accessing low-cost funding presents a significant challenge.
c. Overall, neobanks reported the highest expense for deposits in 2022, which implies that they provided better rates for their depositors. Surprisingly, customer-owned ADIs incurred the lowest expense on deposits. As customer-owned ADIs are not profit-oriented, we expected that they would provide better rates for their depositors.
d. Net interest income, defined as interest income minus interest expense and representing the profit generated from the core business of financial institutions, was highest in neobanks, followed by customer-owned ADIs and FinTech lenders. Furthermore, Figure 4 illustrates that net interest income gradually increased in customer-owned ADIs and neobanks from 2019 to 2022, despite the effects of the pandemic, while it declined for the other three types. Customer-owned ADIs, which supposedly operate with a customer-centric objective, seem to report higher profits from main business operations than their profit-seeking counterparts.
e. Total operational cost is highest in neobanks followed by customer-owned ADIs even though it was expected that the FinTechs would display lower operational expenses due to technological innovations and the lack of physical presence. Surprisingly, within operational expenses, personnel expenses of neobanks are also high, suggesting that they have not reaped the benefits of automation. This finding may reflect the scale advantages of shareholder ADIs and their operational efficiency in contrast to the inefficiencies of FinTechs.
f. Impairments are highest for FinTechs, which specialise in providing instant credit by only digitally verifying creditworthiness. Griffin et al. (2023) identifies elevated rates of suspicious lending to risky borrowers and cases of misreporting by FinTech lenders. FinTechs typically maintain lower capital reserves, leaving them vulnerable to financial shocks (see Schwert, 2018). The high provision for credit risk by FinTechs shown in Table 8 reflects this vulnerability, particularly during economic downturns and periods of elevated default rates.
g. All institutions except customer-owned ADIs have equity capital. The non-ADIs and FinTech lenders do not have to fulfil any regulatory capital requirements as the APRA does not regulate them. The neobanks report the highest equity capital despite incurring losses during 2019 and 2022.
Normalised financial statement items for five types of financial institutions – 2019 and 2022.
Source: Author compilation using the Annual Reports of the financial institutions considered in the study.
This table presents the comparison of the financial statement items for 2019 and 2022 of the five types of financial institutions in Australia. The income statement items are given as a percentage of interest income and statement of financial position items are given as a percentage of total assets to facilitate comparison between varying sizes of financial institutions.
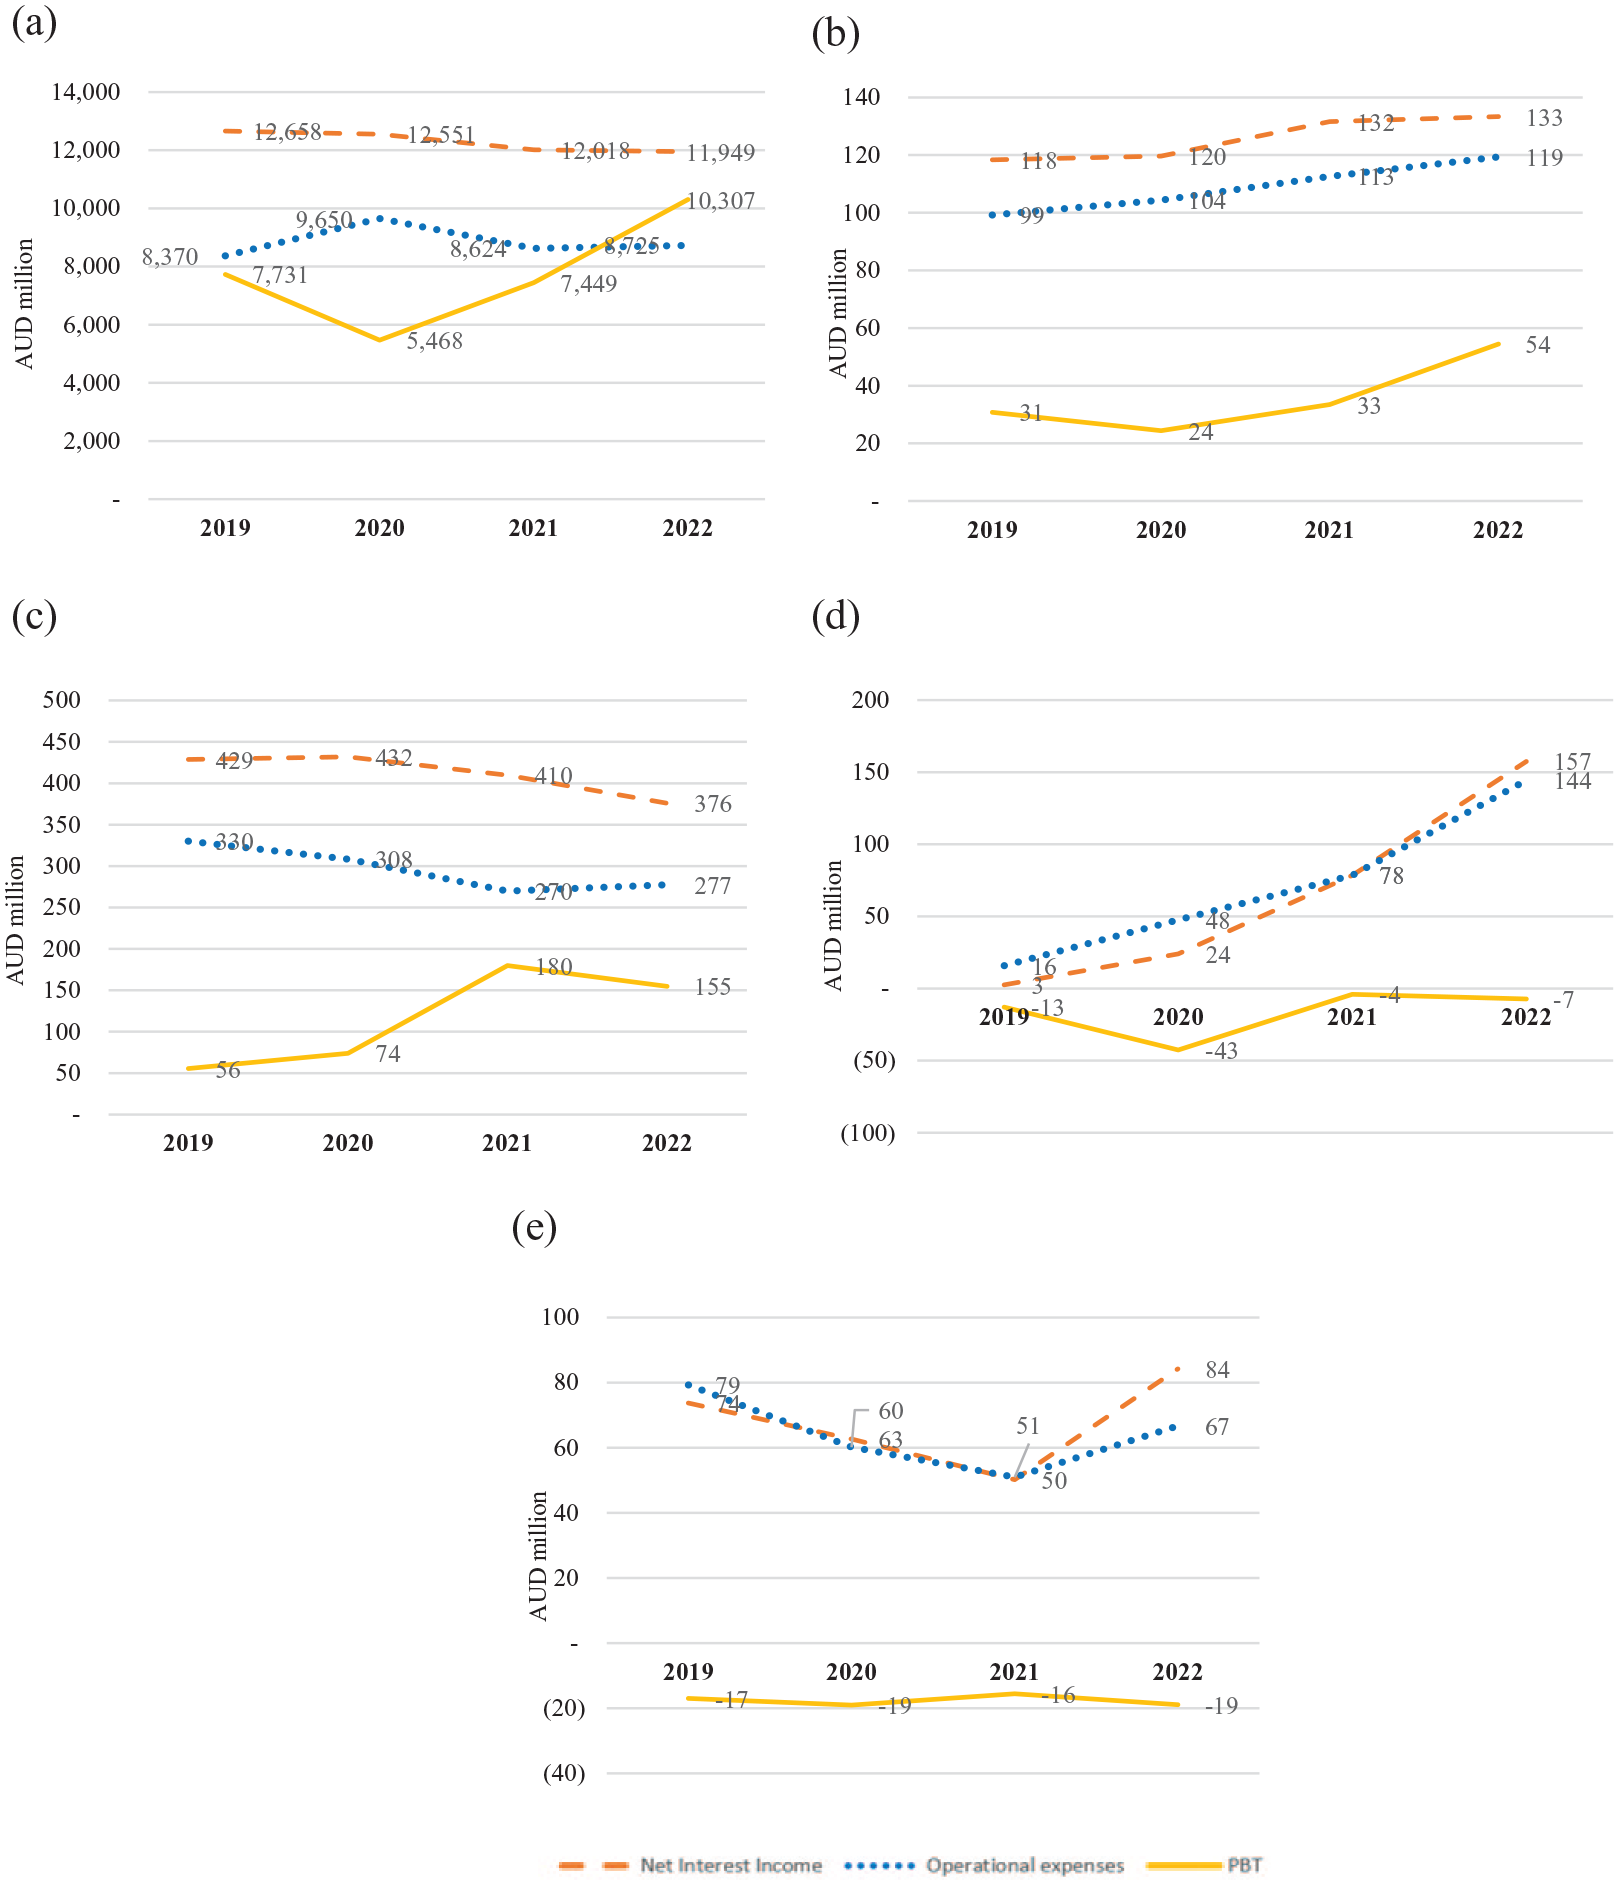
Financial position and performance of different types of financial institutions from 2019 to 2022 – Australia. (a) Shareholder ADIs. (b) Customer-owned ADIs. (c) Non-ADIs. (d) Neobanks. (e) FinTech Lenders.
Based on the analysis of weighted average financial statements, FinTechs and customer-owned ADIs have not been able to convey cost advantages to their borrowers and depositors as anticipated. High operational inefficiencies and credit risk posed significant challenges for FinTechs. As such, automation has not delivered the expected cost savings for consumers. Customer-owned ADIs only have reserves to fulfil the regulatory capital requirements as they do not have any equity capital, unlike shareholder-owned financial institutions. The reserves are built from retained profits. As the regulatory requirement on capital is the same for all ADIs, customer-owned ADIs must produce higher profits to build reserves to withstand the risks they face. With high operational costs (probably due to low economies of scale) these ADIs must report comparatively higher profits from their main business operations to comply with capital adequacy regulations. Hence, by enhancing operational efficiencies, maintaining capital at the regulatory minimum and improving credit quality, financial institutions have the potential to reduce intermediation costs and offer better rates to borrowers and depositors.
6. Concluding remarks
This study analyses the question of whether financial intermediation costs in Australia are declining over time due to technological advancements. Philippon’s (2016) study for the United States concludes that technological advancements have not benefitted consumers because financial intermediation costs for the United States have remained constant. In contrast, this study shows that the costs of financial intermediation in Australia have decreased over time. Falling interest rates explain the downward trend for Australia but not for the United States. The difference can be understood considering the high concentration of variable interest rate loans in Australia and the high concentration of fixed-interest rate loans in the United States. Furthermore, analysis of ADI-level data for Australia shows that shareholder ADIs have a lower NIM than customer-owned ADIs and interest rates are positively associated with NIM. The importance of competition in NIM reduction and the positive association of capital with NIM are several noteworthy findings revealed in the ADI-level analysis.
The second part of this article analyses the financial statements of different types of financial institutions. We find that large, publicly listed and shareholder-owned banks generate relatively high profits and payout ratios, suggesting their capacity to further decrease the costs of financial intermediation. In contrast, other types of entities are more constrained due to scale disadvantages. Since regulations are uniform across banks, customer-owned banks must also adhere to strict capital requirements, akin to their generally much larger shareholder-owned competitors. This regulatory parity places customer-owned banks at a disadvantage.
Since automation and online-only operations reduce the overheads and expenses of FinTechs compared to traditional banking institutions, lower costs of financial intermediation were anticipated for FinTechs. However, the FinTechs under investigation report losses and high operational costs compared to other institutions. They also suffer from relatively high borrower default rates aggravating the potential losses. The elevated credit risk may stem from attracting less credit-worthy customers compared to the traditional banking sector, and the use of more automated credit evaluation and risk management processes. This suggests that the disruption of the traditional banking model by FinTechs has not yet materialised.
Strong capital buffers and low-risk exposure, for example, by passing interest rate risk and credit risk to customers, made the Australian banking sector stable and resilient with some of the most profitable banks in the world. However, such stability comes at the expense of offering disadvantageous rates for borrowers and depositors. More research is needed to determine whether the dominating role of the ‘Big 4’ banks hinders competition and restricts other financial institutions from achieving economies of scale.
Key practical and research implications
This study explores the trend of the unit cost of financial intermediation and how it can be reduced to facilitate better financial consumer welfare in the Australian context. The analysis is conducted in three parts.
First, we calculate the unit cost of financial intermediation for Australia and find a declining trend, contrasting with the stable cost curve observed in the United States formulated by Philippon (2016).
Second, we perform a series of regression analyses. Our findings indicate a positive association between interest rates and financial intermediation costs for both the financial sector and the banking sector. The predominant variable-rate loan market in Australia helps explain the downward trend in unit costs as interest rates decline. At the individual bank level, shareholder-owned banks report lower intermediation costs (measured through net interest margin (NIM)) than customer-owned banks. The positive association competition and regulatory capital have with NIM provides insights for policy recommendations on lowering intermediation costs.
Third, we compare the financial statements of different types of financial institutions in Australia and find that large shareholder-owned banks generate high profits and payout ratios indicating their potential to lower intermediation costs.
This study is the first to comprehensively assess financial intermediation costs for Australia’s entire financial sector. Therefore, it encourages policy discussions to lower financial intermediation costs and improve financial consumer welfare.
Footnotes
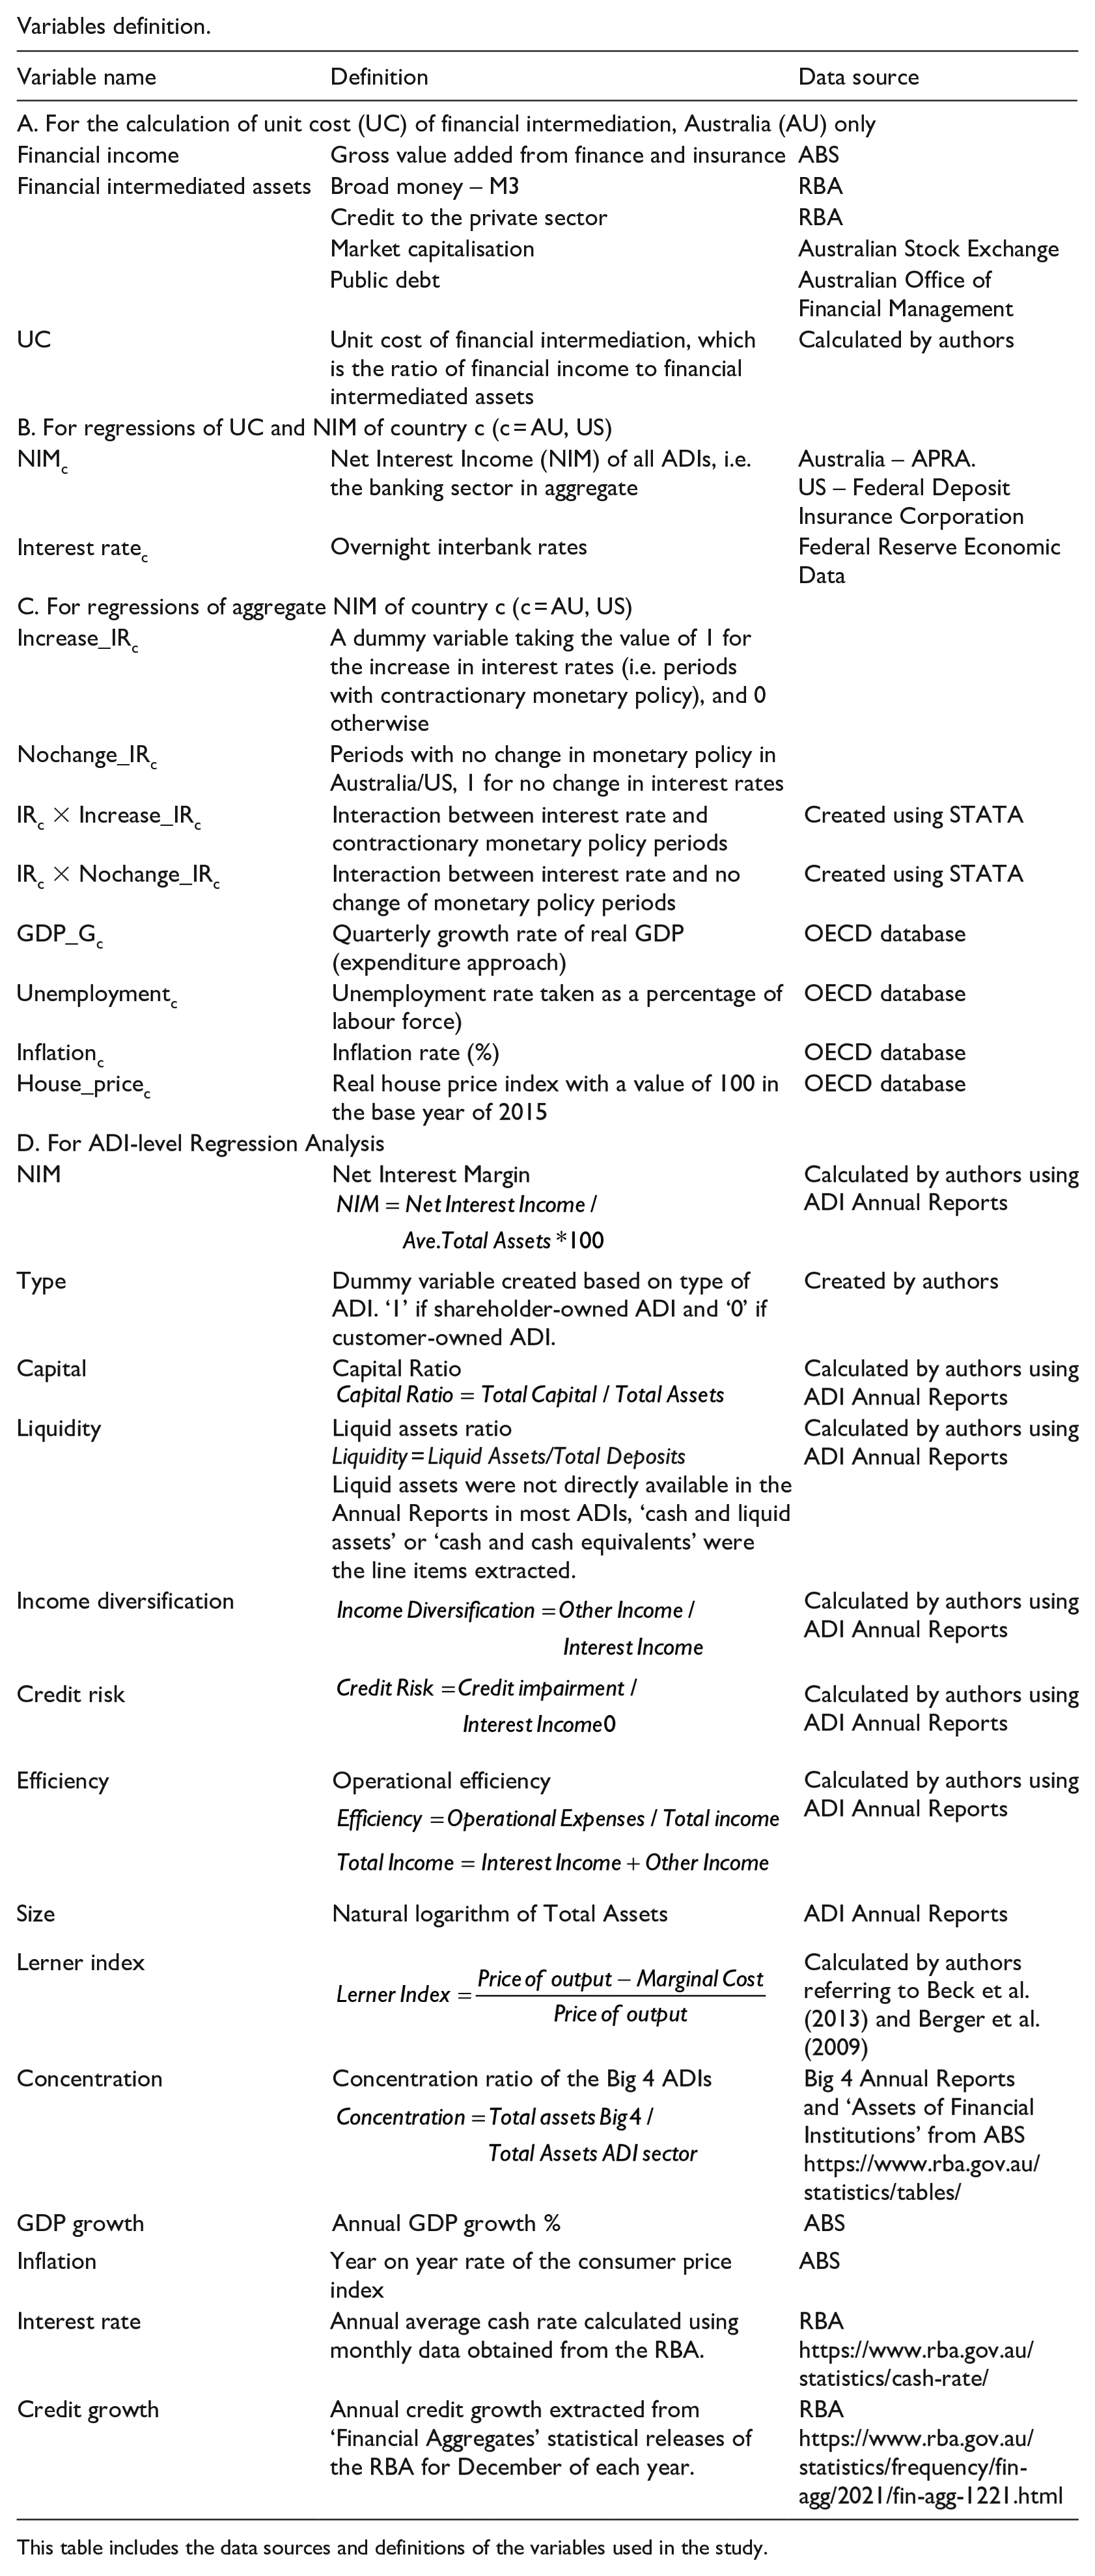
Appendix 1
Variables definition.
| Variable name | Definition | Data source |
|---|---|---|
| A. For the calculation of unit cost (UC) of financial intermediation, Australia (AU) only | ||
| Financial income | Gross value added from finance and insurance | ABS |
| Financial intermediated assets | Broad money – M3 | RBA |
| Credit to the private sector | RBA | |
| Market capitalisation | Australian Stock Exchange | |
| Public debt | Australian Office of Financial Management | |
| UC | Unit cost of financial intermediation, which is the ratio of financial income to financial intermediated assets | Calculated by authors |
| B. For regressions of UC and NIM of country c (c = AU, US) | ||
| NIMc | Net Interest Income (NIM) of all ADIs, i.e. the banking sector in aggregate | Australia – APRA. |
| Interest ratec | Overnight interbank rates | Federal Reserve Economic Data |
| C. For regressions of aggregate NIM of country c (c = AU, US) | ||
| Increase_IRc | A dummy variable taking the value of 1 for the increase in interest rates (i.e. periods with contractionary monetary policy), and 0 otherwise | |
| Nochange_IRc | Periods with no change in monetary policy in Australia/US, 1 for no change in interest rates | |
| IRc × Increase_IRc | Interaction between interest rate and contractionary monetary policy periods | Created using STATA |
| IRc × Nochange_IRc | Interaction between interest rate and no change of monetary policy periods | Created using STATA |
| GDP_Gc | Quarterly growth rate of real GDP (expenditure approach) | OECD database |
| Unemploymentc | Unemployment rate taken as a percentage of labour force) | OECD database |
| Inflationc | Inflation rate (%) | OECD database |
| House_pricec | Real house price index with a value of 100 in the base year of 2015 | OECD database |
| D. For ADI-level Regression Analysis | ||
| NIM | Net Interest Margin |
Calculated by authors using ADI Annual Reports |
| Type | Dummy variable created based on type of ADI. ‘1’ if shareholder-owned ADI and ‘0’ if customer-owned ADI. | Created by authors |
| Capital | Capital Ratio |
Calculated by authors using ADI Annual Reports |
| Liquidity | Liquid assets ratio |
Calculated by authors using ADI Annual Reports |
| Income diversification |
|
Calculated by authors using ADI Annual Reports |
| Credit risk |
|
Calculated by authors using ADI Annual Reports |
| Efficiency | Operational efficiency |
Calculated by authors using ADI Annual Reports |
| Size | Natural logarithm of Total Assets | ADI Annual Reports |
| Lerner index |
|
Calculated by authors referring to Beck et al. (2013) and Berger et al. (2009) |
| Concentration | Concentration ratio of the Big 4 ADIs |
Big 4 Annual Reports and ‘Assets of Financial Institutions’ from ABS |
| GDP growth | Annual GDP growth % | ABS |
| Inflation | Year on year rate of the consumer price index | ABS |
| Interest rate | Annual average cash rate calculated using monthly data obtained from the RBA. | RBA |
| Credit growth | Annual credit growth extracted from ‘Financial Aggregates’ statistical releases of the RBA for December of each year. | RBA |
This table includes the data sources and definitions of the variables used in the study.
Appendix 2
Appendix 3
Appendix 4
Results of the regression between NIM, interest rate and interactions – the United States and Australia.
| (1) | (2) | (3) | |
|---|---|---|---|
| US | 1.675***
(0.055) |
1.664***
(0.056) |
−0.240 (0.193) |
| Interest rate | 0.035***
(0.007) |
– | – |
| US × Interest Rate | 0.001 (0.017) |
– | – |
| Interest rate(t-1) | – | 0.034***
(0.007) |
0.010 (0.006) |
| US × Interest Rate(t-1) | – | 0.008 (0.017) |
−0.001 (0.010) |
| NIM(t-1) | – | – | 0.710***
(0.076) |
| US × NIM(t-1) | – | – | 0.222**
(0.089) |
| Intercept | 1.553***
(0.020) |
1.551***
(0.021) |
0.449***
(0.117) |
| N | 148 | 146 | 146 |
| Adjusted R2 | 0.93 | 0.93 | 0.99 |
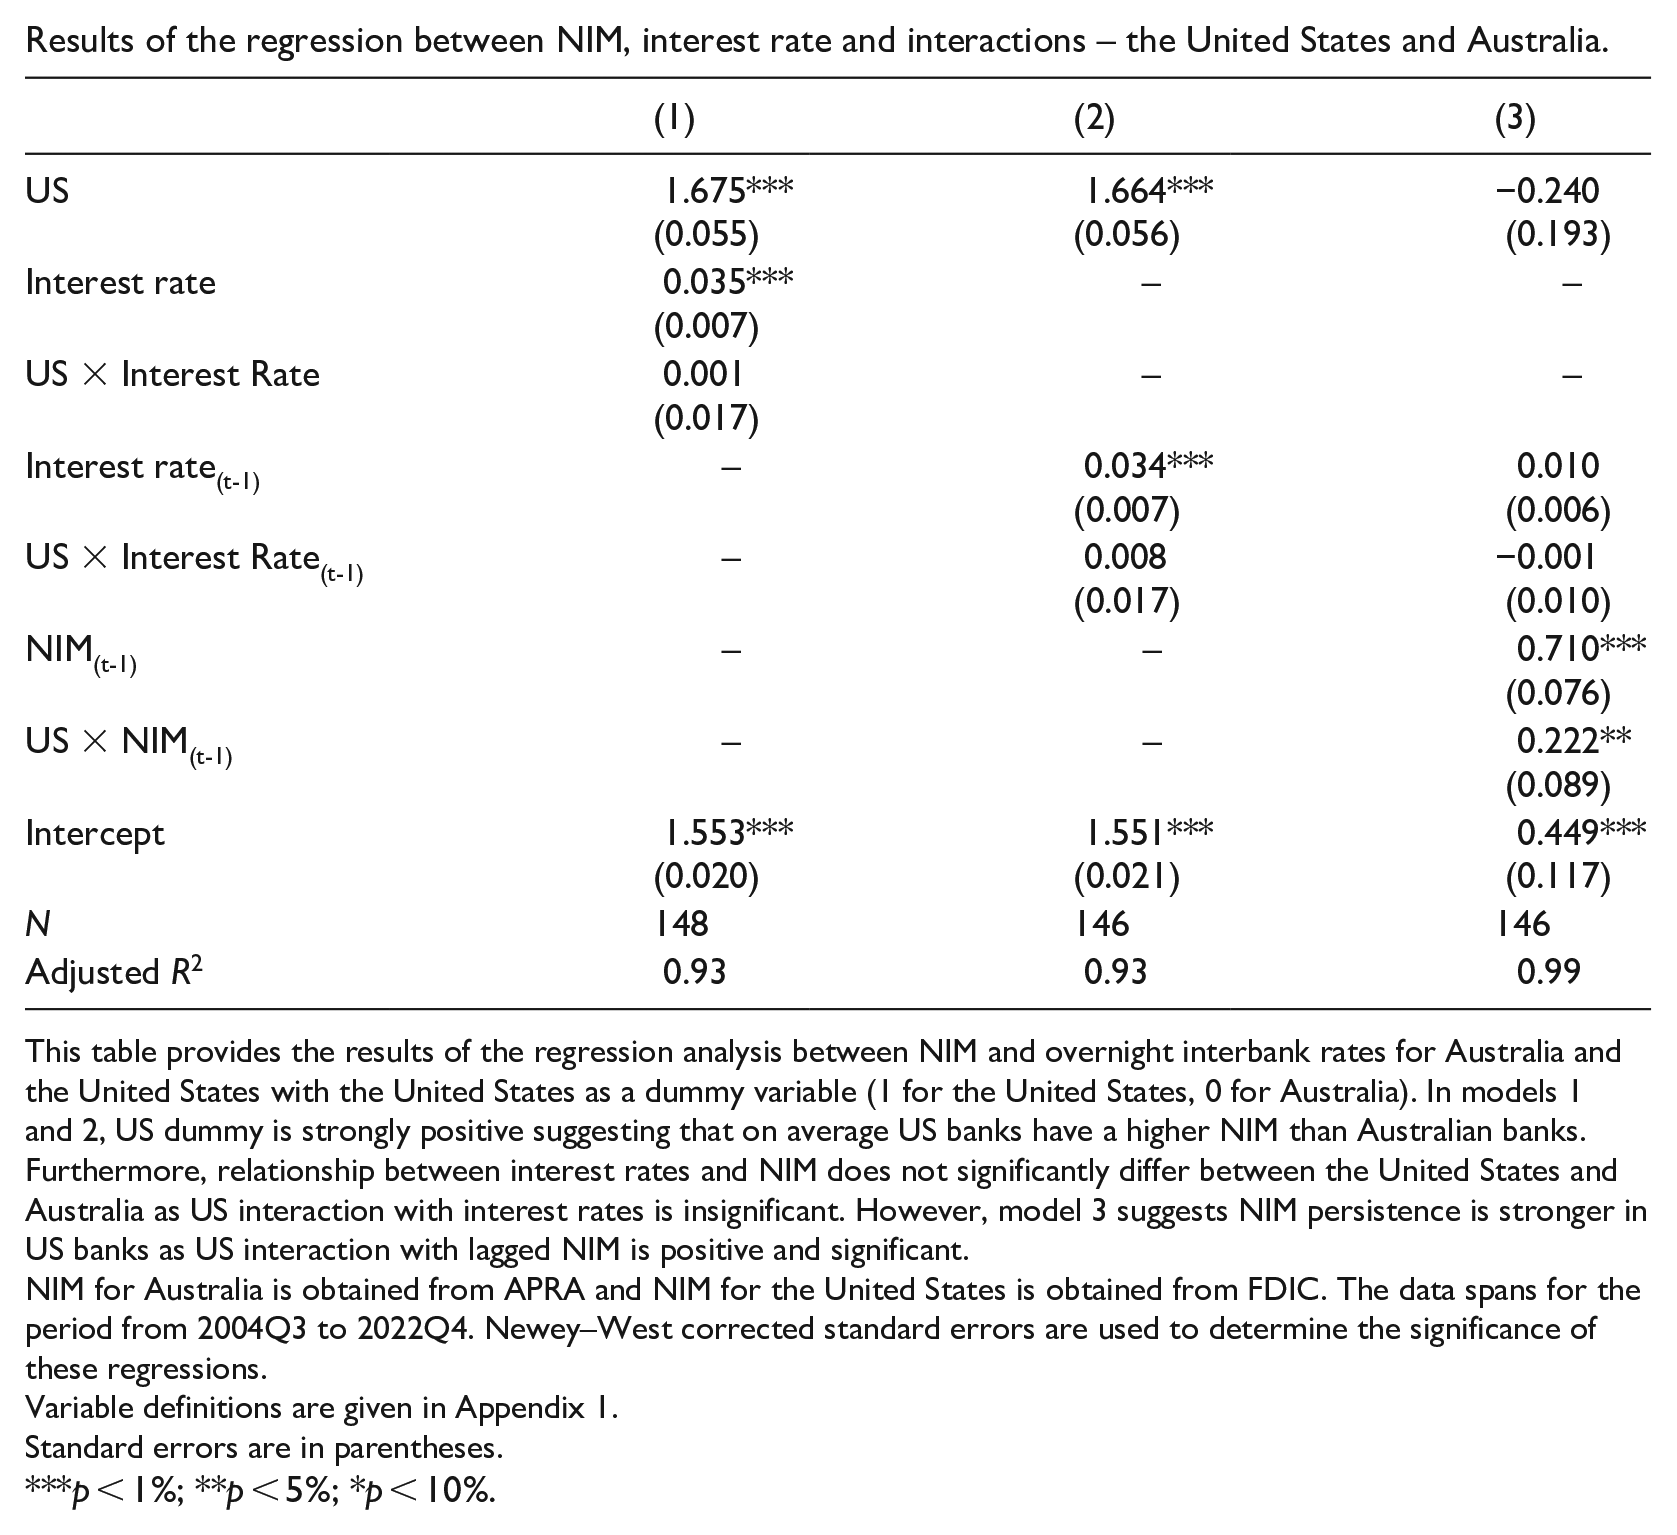
This table provides the results of the regression analysis between NIM and overnight interbank rates for Australia and the United States with the United States as a dummy variable (1 for the United States, 0 for Australia). In models 1 and 2, US dummy is strongly positive suggesting that on average US banks have a higher NIM than Australian banks. Furthermore, relationship between interest rates and NIM does not significantly differ between the United States and Australia as US interaction with interest rates is insignificant. However, model 3 suggests NIM persistence is stronger in US banks as US interaction with lagged NIM is positive and significant.
NIM for Australia is obtained from APRA and NIM for the United States is obtained from FDIC. The data spans for the period from 2004Q3 to 2022Q4. Newey–West corrected standard errors are used to determine the significance of these regressions.
Variable definitions are given in Appendix 1.
Standard errors are in parentheses.
p < 1%; **p < 5%; *p < 10%.
Appendix 5
Regression results of ADI-level data with lagged variables.
Dependent variable: NIM.
| (1) | (2) | (3) | (4) | (5) | (6) | (7) | (8) | (9) | |
|---|---|---|---|---|---|---|---|---|---|
| Type | −0.119**
(0.056) |
– | – | – | – | – | – | – | – |
| Capital(t-1) | 4.050***
(0.913) |
6.402***
(1.233) |
6.407***
(1.283) |
5.837***
(1.255) |
6.384***
(1.248) |
6.167***
(1.230) |
6.380***
(1.236) |
6.623***
(1.250) |
5.778***
(1.274) |
| Liquidity(t-1) | 0.937***
(0.308) |
−0.867*
(0.491) |
−0.715 (0.485) |
−0.962*
(0.491) |
−0.868*
(0.491) |
−0.849*
(0.488) |
−0.867*
(0.491) |
−0.857*
(0.491) |
−1.028**
(0.486) |
| Income diversification(t-1) | 0.271 (0.278) |
−0.848***
(0.250) |
−1.000***
(0.265) |
−0.847***
(0.249) |
−0.848***
(0.250) |
−0.830***
(0.248) |
−0.843***
(0.250) |
−0.885***
(0.252) |
−0.879***
(0.249) |
| Credit risk(t-1) | 1.631 (1.080) |
2.087**
(0.812) |
2.791***
(0.891) |
2.297***
(0.814) |
2.114**
(0.855) |
2.626***
(0.834) |
2.087**
(0.812) |
2.343***
(0.845) |
2.847***
(0.881) |
| Efficiency(t-1) | 0.633***
(0.223) |
0.023 (0.215) |
0.807**
(0.336) |
0.055 (0.215) |
0.030 (0.226) |
0.238 (0.230) |
0.084 (0.278) |
0.018 (0.216) |
0.542*
(0.308) |
| ln size(t-1) | −0.120***
(0.014) |
−0.534***
(0.035) |
−0.273***
(0.092) |
−0.561***
(0.037) |
−0.532***
(0.039) |
−0.495***
(0.038) |
−0.519***
(0.055) |
−0.507***
(0.043) |
−0.438***
(0.059) |
| Lerner index(t-1) | 1.993***
(0.208) |
1.195***
(0.206) |
1.439***
(0.213) |
1.223***
(0.205) |
1.198***
(0.207) |
1.243***
(0.205) |
1.204***
(0.207) |
1.198***
(0.206) |
1.299***
(0.206) |
| Concentration(t-1) | – | – | – | 0.478**
(0.217) |
– | – | – | – | 1.149***
(0.319) |
| GDP growth(t-1) | – | – | – | – | 0.002 (0.016) |
– | – | – | −0.053***
(0.020) |
| Inflation(t-1) | – | – | – | – | – | 0.037**
(0.014) |
– | – | 0.034**
(0.015) |
| Interest rate(t-1) | – | – | – | – | – | – | 0.006 (0.017) |
– | 0.045*
(0.023) |
| Credit growth(t-1) | – | – | – | – | – | – | – | 0.005 (0.005) |
0.013**
(0.005) |
| Intercept | 2.970***
(0.269) |
9.452***
(0.544) |
5.264***
(1.430) |
9.504***
(0.543) |
9.421***
(0.629) |
8.730***
(0.610) |
9.190***
(0.929) |
9.013***
(0.679) |
6.831***
(1.091) |
| ADI FE | No | Yes | Yes | Yes | Yes | Yes | Yes | Yes | Yes |
| Time FE | No | No | Yes | No | No | No | No | No | No |
| N | 562 | 562 | 556 | 562 | 562 | 562 | 562 | 562 | 562 |
| Adjusted R2 | 0.51 | 0.46 | 0.81 | 0.47 | 0.46 | 0.47 | 0.46 | 0.46 | 0.48 |
This table provides the results of the regression analysis between NIM, type, lagged other ADI-specific variables and lagged macroeconomic variables for ADI-level data in Australia. The ADI-specific variables are winsorised at 1% and 99% levels. Variable definitions are given in Appendix 1.
Standard errors are in parentheses.
p < 1%; **p < 5%; *p < 10%.
Appendix 6
Acknowledgements
We are grateful for the comments and feedback from the research community of the Accounting and Finance Department of the University of Western Australia and participants of the Sydney Banking and Financial System Stability Conference 2023 and the discussant of the paper Dennis Dreusch. We are also grateful for the assistance of Michael Frayne, Andrew Lea and Alan Zhao in the data collection process. We express our sincere gratitude to the editorial team and anonymous reviewers of the Australian Journal of Management for their constructive feedback.
Funding
The author(s) received no financial support for the research, authorship and/or publication of this article.
Ethics
Ethics approval was not required for this study.