
Abstract
This article compares the overnight price discovery of American Depository Receipts (ADRs) and common stocks traded in the US stock market. It examines how trading activities of ADRs’ underlying shares in home markets affect price discovery. We find that the efficiency of the opening price and the price discovery during the close-to-open period is significantly higher than that of US common stocks. Further analyses show that the price discovery of ADRs shifts from the trading day to the overnight, and the opening prices of ADRs are more efficient if there are more trading activities of underlying shares in home markets. The results suggest that trading similar assets in multiple markets over non-overlapping hours improves price efficiency.
Keywords
Introduction
In stock markets, the opening period of a trading day is when all information accumulated during the night is incorporated into prices. This period exhibits the highest daily trading volume and volatility (Gerety and Mulherin, 1992; Lockwood and Linn, 1990). In addition, the opening price serves many important purposes, such as the settlement of stock-index futures (Barclay and Hendershott, 2008). Given such importance, prior literature has extensively examined how prices were established and discovered during this period (Barclay and Hendershott, 2003; Biais et al., 1999; Cao et al., 2000; Davies, 2003; Ibikunle, 2015; Xiao and Yamamoto, 2020). Most focus on the impact of a stock’s pre-open order submissions or trading on its opening prices. For example, Barclay and Hendershott (2008) show that as NASDAQ pre-open trading volume increases, the opening price becomes more efficient and price discovery shifts from the opening trade to the pre-open. Our article examines an alternative mechanism of the overnight price discovery by examining whether the existence of a similar or identical asset that was traded on a different exchange prior to the US market open affects the overnight price discovery. Specifically, we assess whether American Depository Receipts (ADRs) exhibit better overnight price discovery compared to non-ADR common stocks traded on the US stock market. ADRs are negotiable securities issued by US depository banks, representing securities of foreign companies and can be traded in US markets like any other domestic shares. The issuing bank predetermined the number of ADRs representing one underlying share (i.e. the ADR ratio). Since ADRs and their underlying stocks in home countries have claims on identical cash flow streams from the same company, they are considered identical or at least very similar assets (Chan et al., 2008). 1
Due to non-overlapping trading hours, ADRs’ underlying shares are usually traded in their home markets before the US market opens. We hypothesize that the pre-open external trading in home markets of the underlying stocks facilitates the price discovery of the corresponding ADRs in the US market during the opening period. This hypothesis is built upon the findings of Barclay and Hendershott (2008), who show that pre-open trading on the Nasdaq allows market makers to establish less noisy and more efficient opening prices. Similarly, Dodd and Frijns (2018) find a significant reduction in price efficiency of home-country stock prices on days when cross-listed stocks are halted on the US market due to public holidays or natural hazards. Barclay and Hendershott (2008) examine the cross-section of stocks on the same market, and Dodd and Frijns (2018) examine cross-listed stocks traded simultaneously on multiple markets. Unlike these studies, our setting is different as we focus on non-overlapping trading hours between markets as Dimpfl and Schweikert (2023) suggest that non-overlapping periods significantly contribute to price discovery. Since the ADRs’ underlying shares traded in their home markets before the US market’s opening period, information has been incorporated into the prices in home markets, which might serve as reference prices for US investors when the market opens, which subsequently improves price efficiency. 2
The mechanism is graphically illustrated in Figure 1. The dashed line represents new value-relevant information occurring over time. When the US market closes, information is incorporated into the prices of the underlying stock through trading in the home market. When the US market opens, all information that occurs overnight is incorporated into the underlying stock price (PH), which can be immediately converted into the ADR opening price (OPADR) as they are theoretically identical. In other words, the price of the ADR is determined in the underlying market and then simply “handed off” to the US market. Meanwhile, because there is no reference price in the case of the non-ADR stock, we expect that its opening price (OPnon-ADR) is less efficient as more information needs to be processed in this very short period. 3
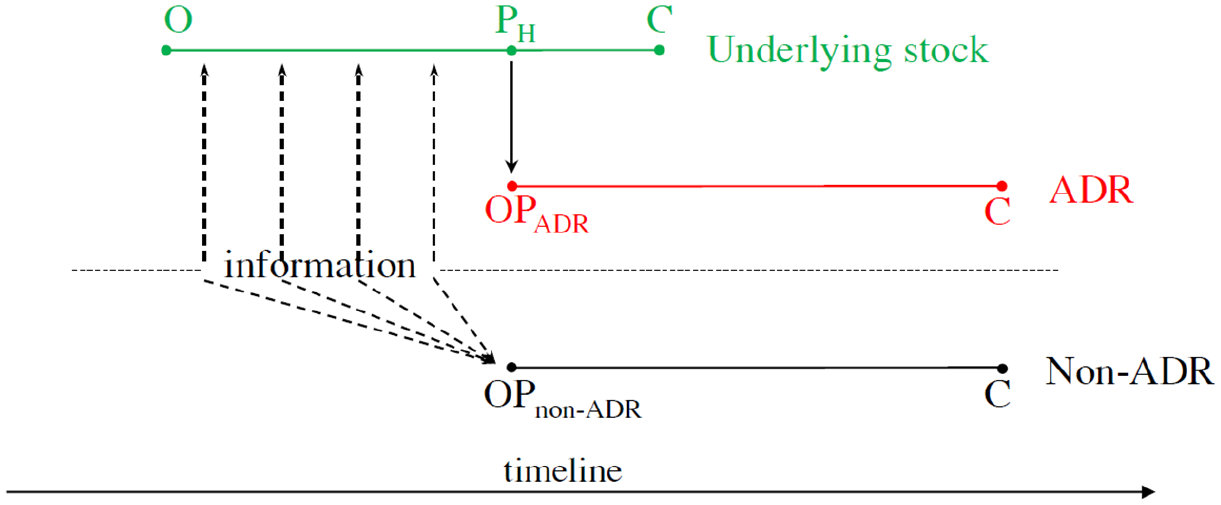
Graphical illustration of the hypothesis. This figure illustrates our main hypothesis. The dashed line represents new value-relevant information occurring over time. When the US market closes, information is incorporated into the prices of the underlying stock through trading in the home market (the green line). When the US market opens, the price determined in the underlying market (PH) is quickly “handed off” to the US market, forming the opening price of the corresponding ADR (OPADR), which is represented by the red line. Meanwhile, in the case of the non-ADR stock (the black line), all information that arises overnight needs to be processed in this very short period, leading to less efficiency in its opening price compared to the ADR.
Our empirical results confirm this hypothesis. We find that ADRs’ opening prices are more efficient than that of other non-ADR US stocks. Furthermore, price discovery during the overnight period is significantly higher for ADRs compared to non-ADRs. The results indicate that the pre-open trading in other markets has improved the price discovery and the efficiency of the opening price on the US market. The differences are robust to the entire non-ADR common stock sample and a characteristic-matched sample where industry, firm size, price, volatility, and trading volume are considered, to different subsample periods, and to different ADRs’ home country subsamples.
We further conduct two additional tests to confirm that the trading of the underlying shares in the home market is the mechanism that drives the difference as illustrated in Figure 1. First, we show that ADRs no longer exhibit superior overnight price discovery compared to non-ADRs when there is no trading activity for the underlying stocks in the home markets. Next, we relate the efficiency of the ADRs’ opening prices and the trading activities of their underlying stocks in the home markets and find a significantly positive relationship. The results are supported using different measures of trading activities, including the turnover ratio, Amihud’s (2002) illiquidity measure, and trading infrequency. The effects persist after we control for trading activities of ADRs in the US market.
This study contributes to the literature on how ADRs and cross-listed stocks relate to their underlying stocks in the home markets. Prior studies mostly focus on identifying whether and in what circumstances the home market or the US stock market contributes more to the price discovery of ADRs or cross-listed stocks (Eun and Sabherwal, 2003; Fernandes and Scherrer, 2018; Ghadhab and Hellara, 2016; He and Yang, 2012; Lockwood et al., 2018; Otsubo, 2014). For example, Su and Chong (2007) show that the Stock Exchange of Hong Kong makes more contribution to the price-discovery process of Chinese cross-listed stocks than does the New York Stock Exchange (NYSE). Eun and Sabherwal (2003) study the US-listed Canadian stocks and show that while the home market (i.e. the Toronto Stock Exchange (TSE)) contribute more to the price discovery, the contribution of the US exchange significantly increases with the US share of total trading in a stock and to the ratio of proportions of informative trades on the US exchange to the TSE and is inversely related to the ratio of bid-ask spreads on the US exchange and the TSE. A study by Wu et al. (2021) in the same country-based setting suggests that the Canadian stock market exhibits greater price discovery efficiency for Canadian stocks cross-listed in the US stock market. This result is contributed by a higher trading volume in the home market. The authors also find that, on the one hand, although the Canadian stock market is more efficient in the price discovery of the basic materials sector, such cases are not applied in the technological and financial ones. On the other hand, NYSE Alternext and NASDAQ are more efficient for junior and technology stocks, respectively. Otsubo (2014) develops a structural approach that relaxes the overlapping trading hour requirement to study Japanese ADRs and shows that the speed of incorporating information into prices is faster in New York than in Tokyo. Fan et al. (2023) consider the role of social media in the relationship between the trading last periods in the US markets and the first periods in the UK market (which is the home market in this study) and find that the volume, sentiment, and agreement of social media messages contribute to price discovery by impacting the returns and volatility of cross-listed stocks. Specifically, the interactions between lagged US stock characteristics and overnight tweets significantly influence the returns and volatility of cross-listed stocks when the UK market opens. In addition, by comparing price efficiency between the ADRs of foreign firms and the shares listed in their home markets and based on multifractal detrended fluctuation analysis (MF-DFA) of the daily price of the ADRs, Diniz-Maganini et al. (2023) show that ADRs generally have higher price efficiency compared to their home market counterparts. Our approach is different as we particularly focus on the opening price and attempt to answer a different question, that is, whether the opening price of ADRs is more efficient than that of non-ADRs traded on the US stock market.
Our study also contributes to the literature on how stocks established their opening prices. Instead of focusing on domestic market activities such as pre-open dealers’ quotes (Bhurjee and Ramanna, 2024; Cao et al., 2000), auctions (Bhurjee and Ramanna, 2024; Madhavan and Panchapagesan, 2000), trading volume (Barclay and Hendershott, 2008; Bogousslavsky and Muravyev, 2023), or overnight earnings announcements (Liu et al., 2023; Moshirian et al., 2012), we demonstrate that trading activities in foreign markets also play an important role in establishing domestic stock prices. To this extent, our study is related to Howe and Ragan (2002), who show that the opening volatility of ADRs is lower when trading of the underlying asset overlaps trading of the ADRs on the NYSE. We differ by focusing on the efficiency of the opening price and by comparing ADRs with non-ADRs instead of comparing across ADRs as in Howe and Ragan (2002).
Due to different time zones, financial markets exhibit significant heterogeneity in trading hours. Stock markets, in general, are only open during the daytime. Foreign exchanges allow around-the-clock trading except on weekends, while cryptocurrencies can be traded 24/7 on almost all exchanges. Given that ADRs and underlying shares are theoretically identical assets, our results imply that extended trading hours or continuous trading might improve price efficiency and price discovery as information would be incorporated into price more smoothly. To that extent, our article echoes the findings of a relatively constant trading pattern throughout the day on the 24/7 cryptocurrency market (Baur et al., 2019) and a U-shaped trading pattern on the daytime-trading stock market (Lockwood and Linn, 1990).
Following this introduction, the remainder of the article is structured as follows. Section 2 describes the sample and the construction of variables used to measure the overnight price discovery. Section 3 presents and discusses the empirical results, followed by conclusions in Section 4.
2. Data and variable construction
2.1. Data
We construct a sample of ADRs and their corresponding underlying stocks as follows. We first download the raw dataset from Citi Bank’s Global Depository Receipt (DR) Directory. 4 The directory contains identities of all global DRs and their underlying stocks in the home markets. As we focus on the US market (i.e. ADRs), we only keep DRs listed on NYSE and NASDAQ. Our analyses include both active and inactive ADRs to avoid possible survivor bias. We retrieve daily prices and fundamentals of ADRs and all other US stocks from the Center for Research in Security Prices (CRSP) database. In addition, daily prices and fundamentals of ADRs’ underlying stocks in their home countries are collected from LSEG Datastream. Merging all these data sets leaves 374 ADRs originating from 37 countries—all of them have some non-overlapping trading hours with the US stock market. The sample period spans 33 years, from 1991 to 2023. Table 1 presents the number of ADRs by country, along with their market capitalization in the US market (in a million US dollars) and their underlying stocks’ market capitalization in home countries (converted to million US dollars using Datastream’s exchange rates). The largest number of ADRs originate from UK firms (82), followed by Australia (25) and Israel (22). In addition, the market capitalization of ADRs in the US market is much smaller than the values of their underlying shares in home markets.
Number of ADRs by countries.

This table displays the number of ADRs by their respective home countries. Mkt. Cap (US) Mkt. Cap (home) are, respectively, the average market capitalization (in million US dollars) of the ADRs in the US stock market and of their underlying stocks in the home markets.
2.2. Overnight price discovery measures
To examine the effects of underlying shares’ trading on the overnight price discovery of ADRs, we first construct the measure of the efficiency of the opening price using the unbiasedness regression introduced by Biais et al. (1999) widely used in subsequent studies (Barclay and Hendershott, 2008; Ibikunle, 2015; Xiao and Yamamoto, 2020). Specifically, for each stock-month, we run the following regression

where
We also employ a second measure of price discovery called the weighted price contribution (WPC) proposed by Barclay and Warner (1993). WPC for a specific period measures the fraction of the close-to-close return that is contributed by returns during that period. For each stock-month, we define the weighted price contribution of the close-to-open period (
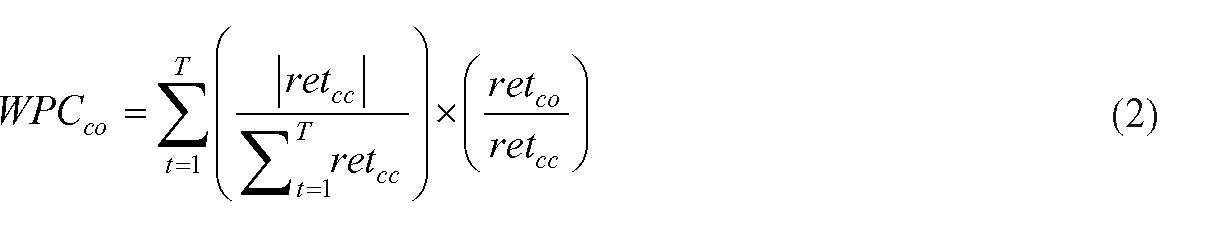
where
2.3. Matched sample construction
The difference in price discovery among stocks can be driven by characteristics that are unrelated to cross-listing, such as size, liquidity, or volatility (Frijns et al., 2015; Gavious and Kedar-Levy, 2013). To alleviate the concern regarding these confounding effects, we follow prior studies (e.g. Ahn et al., 1998; Huang et al., 2016; Huang and Stoll, 1996) to construct a matched sample of US domestic stocks for the ADR sample. The matching criteria include industry, price, trading volume, volatility, and market capitalization. The construction of the matched sample is as follows. First, from all stocks available in the CRSP database, we only keep common equity US-based stocks (share codes of 10 or 11) that are traded on NYSE, AMEX, or NASDAQ (exchange codes of 1, 2, or 3). Next, for each ADR, we keep stocks in the same industry (2-digit SIC code) as the matching candidates. Then for each year, we calculate the matching score of each ADR with each US stock in the candidate pool using the following equation

where X denotes one of four matching characteristics, including the average daily price, market capitalization, trading volume, or the standard deviation of daily returns during the year. We combine the number of shares outstanding and prices on Datastream and CRSP to calculate the market capitalization for ADRs as CRSP only shows the number of ADRs’ shares listed on the US market, thus does not correctly reflect the size of the company (Chan et al., 2008). Following Huang and Stoll (1996), we exclude pairs with an absolute price ratio exceeding one to avoid the extreme difference between ADRs and US common stocks. Finally, for each ADR, the US stock with the lowest matching score is considered a match.
3. Empirical results
3.1. The baseline comparison between ADRs and non-ADRs
3.1.1. Univariate analysis
We start our analysis by comparing the efficiency of opening prices (βco) and the weighted price contribution of overnight returns (WPCco) between ADRs and matched US common stocks in a univariate setting. We estimate βco and WPCco for each stock-month. Table 2 reports their monthly averages, which are calculated by first averaging across stocks within a month and the averaging across months within the examined period. The results in Panel A show that the overall average of βco for ADRs is 0.96, with slight variations over different subsample periods. Meanwhile, the average βco for matched non-ADR stocks is 0.89, which is significantly smaller than that of ADRs (diff = 0.07, t-stats = 10.43). Consistent results are found when we split the sample into different 5-year subsamples. Similarly, Panel B shows significantly higher WPCco for ADRs compared to the matched stocks. Specifically, ADRs’ overnight returns contribute to about 50% of the total returns, while the number is only 21% for non-ADR stocks. Combined with the significant differences in all 5-year subsamples, the results consistently indicate that ADRs exhibit stronger overnight price discovery than non-ADRs.
Univariate analysis.

This table presents the differences between ADRs and matched US common stocks in their opening price efficiency (βco) in Panel A and weighted price contribution of overnight returns to total daily returns (WPCco) in Panel B. The matched sample is identified based on industry, price, market capitalization, trading volume, and volatility. βco and WPCco are estimated for each stock-month. The monthly averages are calculated by first averaging these estimates across stocks within a month and then averaging across months within the period. t-statistics are based on the time-series of monthly averages.
3.1.2. Regression analysis
We next examine the differences in overnight price discovery of ADRs and non-ADRs in a regression setting in which various firm characteristics are controlled for. The model specification is as below

where
Regression results presented in Table 3 show that coefficients of
Regression analysis.

This table reports the regression results of Model (3) for a matched sample of US common stocks. The matched sample is identified based on industry, price, market capitalization, trading volume and volatility. βco is the opening price efficiency, and WPCco is the weighted price contribution of overnight returns to the total daily returns. βco and WPCco are estimated for each stock-month. ADR_D is a dummy variable that equals one for ADRs and zero for matched US common stocks. logMktCap, logPrice, and logVolume are, respectively, calculated as the natural logs of the averages of daily market capitalization, close prices, and trading volume over the month. Volatility is the standard deviation of stock daily return during the month. We run a cross-sectional regression for each month and calculate the averages of monthly estimated coefficients following Fama and MacBeth (1973). Newey and West (1987) adjusted t-statistics are reported in parentheses. *, **, and *** denote significance levels of 10%, 5%, and 1%, respectively.
3.2. Robustness tests
3.2.1. Country subsamples
We next examine whether the baseline results vary with different home countries by rerunning model (3) using ADRs from each home country in our sample. To avoid potential biases caused by a small number of observations in the Fama-MacBeth’s cross-sectional regression, we only consider countries with more than 10 ADRs. They include Argentina, Australia, Brazil, Chile, France, India, Israel, Japan, Mexico, South Africa, and the United Kingdom. The regression results with the opening price efficiency and the weighted price contribution of overnight returns are, respectively, presented in Panels A and B of Table 4. Consistent with the full sample, the coefficients of ADR_D in both Panels are generally positive and statistically significant for all countries except Argentina. We attribute this difference to the fact that Argentina has very limited non-overlapping trading hours with the United States. Specifically, as shown in Figure 2 which presents the trading hours of the US stock market and ADRs’ home markets, the Argentine stock market trades before the US stock market only 30 minutes each day for half of a year. Arguably, only limited information is incorporated into prices during this short trading period, weakening the efficiency of Argentine ADRs’ opening prices compared to other countries which have more non-overlapping trading hours with the United States.
Country subsamples.

This table presents empirical results for selected countries in the research sample.
*, **, and *** denote significance levels of 10%, 5%, and 1%, respectively.
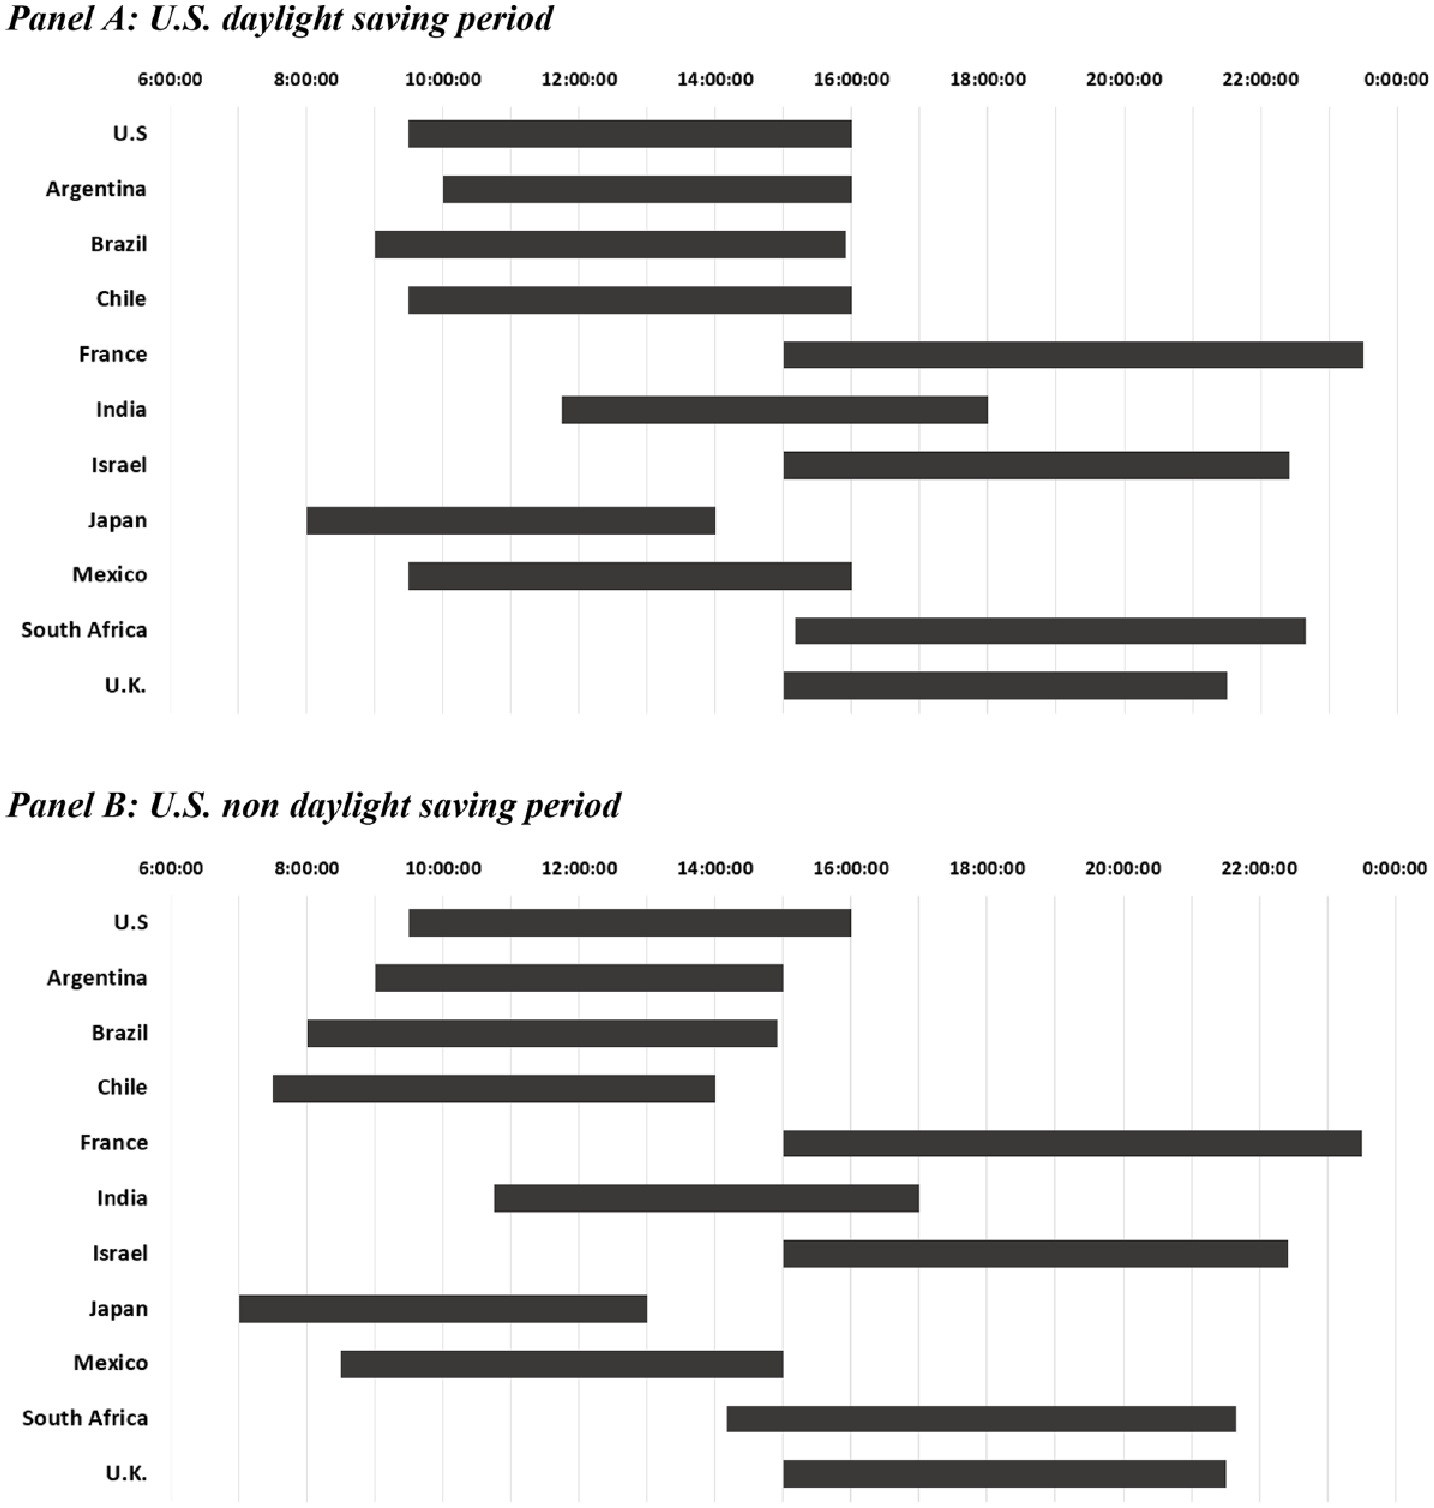
Trading hours of ADRs’ home markets. This figure presents the trading hours of the United States and ADRs’ home markets during the US daylight saving period (Panel A) and non daylight saving period (Panel B).
3.2.2. Alternative control samples
While we follow the standard literature to construct the matched sample in the baseline analysis, the observed differences could be driven by unobserved/omitted factors that are unrelated to the cross-listing natures of ADRs. To alleviate this concern, we first repeat our baseline analyses using all US common stocks in the CRSP database in place of the matched sample. The pairwise univariate comparisons in Table 5 and the Fama-MacBeth regression results in Table 6 generally resemble those presented in Tables 2 and 3, indicating a significantly higher efficiency of opening price and higher contribution of overnight returns of ADRs compared to non-ADR US stocks.
Univariate analysis – ADRs versus all US common stocks.

This table presents the differences between ADRs and non-ADR US common stocks in their opening price efficiency (βco) in Panel A and weighted price contribution of overnight returns to total daily returns (WPCco) in Panel B. βco and WPCco are estimated for each stock-month. The monthly averages are calculated by first averaging these estimates across stocks within a month and then averaging across months within the period. t-statistics are based on the time-series of monthly averages.
Regression analysis – ADRs versus all US common stocks.

This table reports the regression results of Model (3) where βco is the opening price efficiency, and WPCco is the weighted price contribution of overnight returns to the total daily returns. βco and WPCco are estimated for each stock-month. ADR_D is a dummy variable that equals one for ADRs and zero for common US stocks. logMktCap, logPrice, and logVolume are, respectively, calculated as the natural logs of the averages of daily market capitalization, close prices, and trading volume over the month. Volatility is the standard deviation of stock daily return during the month. We run a cross-sectional regression for each month and calculate the averages of monthly estimated coefficients following Fama and MacBeth (1973). Newey and West (1987) adjusted t-statistics are reported in parentheses. *, **, and *** denote significance levels of 10%, 5%, and 1%, respectively.
Next, we conduct a placebo test by randomly assigning each ADR a “pseudo” matched common US stock. Then, we run the regression in equation (4) to obtain the “pseudo” coefficient and t-statistic of the independent variable ADR_D. We repeat the process 10,000 times. The rationale behind this test is that if the difference of overnight price discovery between ADRs and non-ADRs is driven by a factor, we are unable to control for in our matched sample, a randomly selected “pseudo” matched sample may detect it if we repeat the process many times. Figure 3 displays the empirical distribution of the obtained 10,000 pseudo coefficients and t-statistics. The coefficients of ADR_D in the regression with βco as the dependent variable (Panel A) and with WPCco as the dependent variable (Panel B) are positive and statistically significant for all 10,000 pseudo matched samples. Thus, the results rule out the possibility that the difference in overnight price discovery between ADRs and non-ADRs is driven by factors other than the cross-listing nature of ADRs.
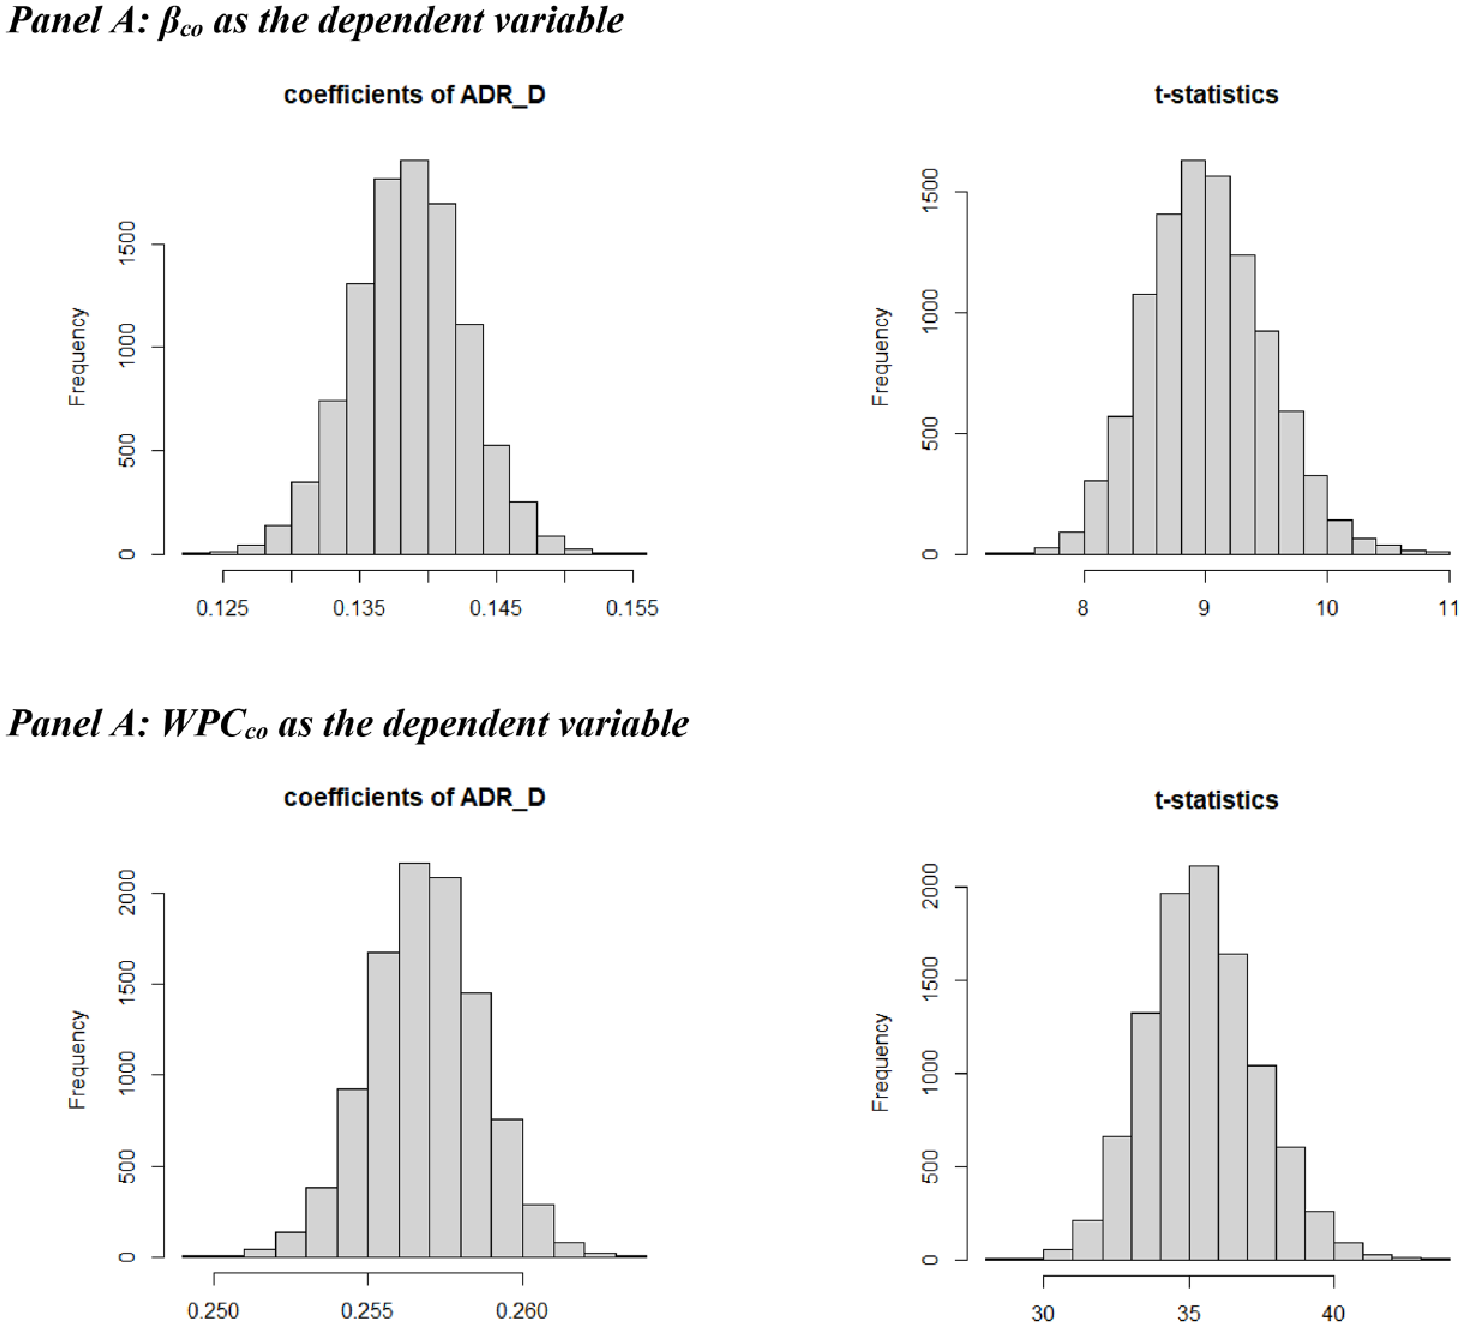
Placebo test. For each ADR, we randomly assign a US common stock as the pseudo matched stock and run the regression model (3) to obtain the estimated coefficient and t-statistics of ADR_D. We repeat the process 10,000 times and display the distribution of the obtained coefficients and t-statistics for βco in Panel A and for WPCco in Panel B.
3.3. The mechanism: trading activities in the home markets
This section examines the source of the superior ADRs’ overnight price discovery in the US market by linking it with trading activities on underlying shares in the home market. Prior studies show that trading provides a mechanism through which information is more efficiently incorporated into prices compared to non-trading (Barclay et al., 1990; Barclay and Hendershott, 2008). Howe and Ragan (2002) find that ADRs that have the underlying asset traded in the home market when the ADRs open trading on the NYSE exhibit significantly lower level of return volatility than ADRs whose underlying shares are not traded at that time. Dodd and Frijns (2018) find a significant reduction in price efficiency of home-country stock prices on days when cross-listed stocks are halted on the US market due to public holidays or natural hazards. Built on these findings, we posit that trading activities in the home markets is the mechanism that drives the better overnight price discovery of ADRs.
We formally test this conjecture using two sets of analyses. First, we examine the ADRs’ overnight price discovery during periods when there is no trading activity for the underlying stocks in the home markets. These non-trading periods are identified as days when the trading volume of the underlying stocks in the home markets (sourced from LSEG Datastream) is either unavailable or zero. If our conjecture is correct, ADRs will no longer exhibit superior overnight price discovery compared to non-ADRs during these periods. To test this, we separately estimate βco in model (2) and WPCco in model (3) for trading-day and non-trading-day subsamples, for ADRs and for matched US common stocks identified in Section 2.3. Since the number of non-trading days in the home markets each month is very small for many underlying stocks, we estimate the overnight price discovery measures for each ADR and its matched common stock using the all non-trading and trading days during the sample period instead of each month as in the main analysis. Then, we run the following regression model

where
The regression results of Model (5) are presented in Table 7. Consistent with our baseline results, column (1) shows that the estimated coefficient of ADR_D is 0.131 (t-stats = 6.563), indicating that the opening price efficiency of ADRs is higher than that of matched U.S. common stocks on days when ADRs’ underlying stocks are traded in the home markets. However, on days when there is no trading activity for underlying stocks, the difference is significantly weakened, which is evidenced by the negative and statistically significant coefficient of the interaction term ADR_D×NO_TRADING_D (coefficient = −0.133, t-stats = −4.581). In terms of economic significance, the opening price efficiencies of ADRs and matched non-ADRs on these days show minimal difference, with the sum of three coefficients totaling only −0.005 (i.e. 0.131 – 0.003 – 0.033). 5 Similar results are obtained in column (2) when we control for firm characteristics, and in columns (3) and (4) when we use the weighted price contribution as the alternative measure of overnight price discovery.
Trading versus non-trading activities in the home market.

This table presents the regression results of model (5). βco and WPCco are estimated separately for trading-day and non-trading-day subsamples. ADR_D is a dummy variable that equals one for ADRs and zero for matched common US stocks. NO_TRADING_D is a dummy variable that equals one if βco and WPCco are estimated using the non-trading-day sample and zero for trading-day sample. logMktCap, logPrice, and logVolume are, respectively, calculated as the natural logs of the averages of daily market capitalization, close prices, and trading volume over the month. Volatility is the standard deviation of stock daily return during the month. t-statistics are reported in parentheses. *, **, and *** denote significance levels of 10%, 5%, and 1%, respectively.
Second, we relate the monthly estimates of ADRs’ overnight price discovery to the trading activities of the underlying stocks in the home markets during the month. We expect that the overnight price discovery of ADRs is improved when there are more trading activities on their underlying assets in the home countries. To evaluate this, we estimate the following regression

where HomeTradingi,j,t denotes a matrix of trading activity measures of underlying stocks in home markets, including turnover (
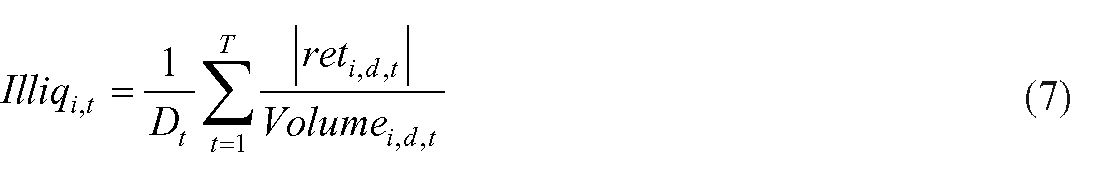
where reti,d,t and
Regression results are presented in Table 8. Columns (1)–(4) show that the efficiency of ADRs’ opening prices is negatively related to the illiquidity and trading infrequency of their underlying shares in home markets. Meanwhile, it has a significantly positive relationship with the turnover ratio. The results indicate that ADRs’ opening prices in the US market are more efficient when their underlying shares in home countries are frequently traded. Similar results are observed in columns (5)–(8) where WPCco is the dependent variable. Hence, the trading mechanism hypothesis is strongly supported.
Underlying stocks’ trading activities and ADRs’ overnight price discovery.

This table presents the regression results of model (6). βco and WPCco are estimated for each ADR-month. Turnoverhome is the average daily turnover of the underlying stock in the home country during the month, in which daily turnover is the ratio of trading volume (in US dollars) to the total number of shares outstanding. Infreqhome is the number of days during the month the underlying stock has zero trading volume, scaled by the total number of days in the month. Illiqhome is calculated as Amihud (2002) illiquidity using daily returns and trading volume of the underlying stock during the month. IlliqUS, InfreqUS, and TurnoverUS are calculated in similar ways using daily data of ADRs. logMktCapUS, logPriceUS, and logVolumeUS are, respectively, calculated as the natural logs of the averages of daily market capitalization, close prices, and trading volume of ADRs over the month. Volatility is the standard deviation of ADR daily return during the month. t-statistics are reported in parentheses. *, **, and *** denote significance levels of 10%, 5%, and 1%, respectively.
4. Conclusion
This article attempts to explain how trading similar assets in multiple markets in different time zones affects price discovery. Employing the unique setting of ADRs in which their identical underlying assets are traded in home markets before the US market opens, we show that the efficiency of opening prices and the contribution of overnight returns to total daily returns of ADRs are significantly higher than that of US non-ADR common stocks. Consistent with the trading mechanism of price discovery (Barclay and Hendershott, 2008), we further find that (1) ADRs no longer exhibit better overnight price discovery compared to non-ADRs when there is no trading activity for the underlying stocks in the home markets and (2) trading activities and liquidity of underlying shares in home markets improve the overnight price discovery of ADRs in the US market. The results are robust to individual ADRs’ home countries and to the matched sample in which other stock characteristics are controlled for. As ADRs and their underlying shares are theoretically identical, our results suggest that extended or continuous trading might improve price efficiency and discovery as information would be incorporated into price more smoothly.