
Abstract
We examine the impact of voluntary carbon assurance on a firm’s cost of equity capital (COE). Based on 6500 firm-year observations across 44 countries covering a period of 8 years (2010–2017), we find that the adoption of carbon assurance is negatively associated with the COE. Cross-sectional analyses show that the negative relationship is stronger for firms with poor emissions reduction performance and for firms that do not participate in an emissions trading scheme. We also find that a country’s legal institutions and economic development have significant moderating effects on this relationship. Furthermore, the scope and the percentage of carbon emissions assured, the level of carbon assurance, and the auditing standards adopted have varied effects on the COE. These findings should be useful to regulators, managers, and investors looking to improve the credibility of voluntarily reported information.
Keywords
1. Introduction
Climate change has become an increasingly alarming issue and has attracted worldwide public concern and media attention. Stakeholders are demanding that firms disclose relevant and reliable carbon information for their decision-making. Most studies in the literature on carbon disclosure explore determinants of the adoption of voluntary carbon disclosure and corporate incentives to adopt such assurance (for a comprehensive literature review, see He et al., 2022a). However, research on the capital market effects of voluntary climate change disclosure is still scant. Some studies highlight that carbon disclosure (e.g. emissions, carbon abatement initiatives, risks and opportunities) provides incremental relevant information for investors (Chapple et al., 2013; Choi and Luo, 2021; Clarkson et al., 2015; Elijido-Ten and Clarkson, 2019; Griffin et al., 2017; He et al., 2022b; Jiang et al., 2021; Jiang and Luo, 2024; Jung et al., 2018; Li et al., 2024; Matsumura et al., 2014; Schiemann and Sakhel, 2019). However, for a company to reap these economic benefits of carbon disclosure (e.g. a higher firm valuation, lower information asymmetry, lower financing costs), it must demonstrate that the information it reports is credible. Only then will investors consider it when valuing the company.
To improve the relevance and reliability of carbon information, there has been growing reliance on the independent assurance of carbon reports. The International Framework (International Auditing Assurance Standards Board, 2013) notes that the objective of an assurance engagement is to improve the quality and credibility of the information set for decision-making by report users. Hiring an external assurer to audit and verify carbon information is a common way of increasing the perceived credibility of the information. The need for credible carbon reporting has generated strong demand for a new and specific type of assurance engagement: the assurance of greenhouse gas (GHG) emissions information. The International Auditing and Assurance Standards Board (IAASB) recognizes that the assurance of GHG information is by nature different from the assurance of sustainability information (Zhou et al., 2016). 1 This is evidenced by the separate standard International Standard on Assurance Engagements (ISAE) 3410 (IAASB, 2012) issued to provide comprehensive guidance on GHG assurance engagements, which parallels the broader subject of assurance of sustainability reporting.
In response to the growing demand for the new assurance market and the voluntary nature of this assurance engagement, studies examine factors that affect companies’ incentive to voluntarily adopt external carbon assurance (Datt et al., 2018, 2019, 2020; Green and Zhou, 2013b; Michelon et al., 2019; Zhou et al., 2016). However, limited research examines the capital market consequences of voluntary carbon assurance. Our study fills this gap by systematically investigating the association between carbon assurance and the cost of equity capital (COE) and whether this association differs with characteristics of companies and their institutional environment. This research question is important because we can gain insight into the financial implications of adopting credibility-enhancing mechanisms associated with GHG-related reporting. This in turn can facilitate decision-making for both companies and investors, leading to more sustainable business practices and potentially more profitable investment strategies.
We hypothesize that carbon assurance can affect the perceived credibility of carbon reports and therefore influence firms’ COE. This is achieved through third-party validation assuring investors of the accuracy and reliability of reported GHG emissions and other carbon-related information. If investors are convinced that carbon assurance bolsters the credibility of such information, they are likely to require a lower COE from companies that obtain external assurance, compensating for the reduced risk associated with carbon information.
To test this hypothesis, we examine the relation between the adoption of carbon assurance and the COE in a sample of 6500 firm-year observations from firms from 44 countries that participated in the CDP (previously known as the Carbon Disclosure Project) from 2010 to 2017. Following the prior research, we measure the COE by averaging the estimates derived from four distinct ex ante COE measures, each generated through a different residual income model (Hail and Leuz, 2006). The evidence suggests that external carbon assurance is negatively associated with the COE, which is consistent with our hypothesis.
Furthermore, we perform a range of cross-sectional tests to investigate whether this relationship varies across firms and countries. Our findings indicate a more pronounced relationship between external carbon assurance and reduced COE in firms that exhibit poor emissions reduction performance and those that do not participate in an emission trading scheme (ETS). In addition, we find that the negative association between external carbon assurance and the COE is contingent on a country’s legal institutions and economic development. Finally, we note that various characteristics of carbon assurance, such as the proportion of carbon emissions covered, the level of assurance provided, the selection of the assurance provider, and the adopted assurance standards, each uniquely influences COE.
Our study contributes to the literature in three ways. First, it contributes to the specific line of literature on carbon assurance. A growing number of studies have identified key potential determinants of the adoption of carbon assurance and the choice of assurance provider (Datt et al., 2018, 2019, 2020; Fan et al., 2021; Green and Zhou, 2013; Luo et al., 2023; Michelon et al., 2019; Simic et al., 2024). However, despite calls for external carbon assurance in the United States and abroad (Casey and Grenier, 2015; Fuhrmann et al., 2017; García-Sánchez et al., 2019), theoretically and empirically, it is unclear whether the requirement for external assurance improves the information environment. Our empirical results contribute to the scant literature by showing that firms with voluntary adoption of carbon assurance tend to have a lower cost of equity. By highlighting the economic benefit of external carbon assurance, our findings are relevant to practitioners and security regulators who are interested in exploring the consequences of external carbon assurance in the capital market.
Second, we contribute to the broader literature on sustainability assurance by adding evidence to the debate over whether the adoption of sustainability assurance affects investors’ perceptions of credibility as proxied by the COE. Some studies argue that sustainability assurance reduces the cost of equity by mitigating information asymmetry (e.g. Casey and Grenier, 2015; Dhaliwal et al., 2011; Fuhrmann et al., 2017; Kolk and Perego, 2010; Martínez-Ferrero and García-Sánchez, 2017b; Peters and Romi, 2015), whereas other studies argue that sustainability assurance may increase information asymmetry and the cost of equity through managers’ opportunistic incentives (Gray, 2010; Hopwood, 2009; Lyon and Maxwell, 2011). Consistent with these mixed theoretical arguments, empirical studies find that the relation between sustainability assurance and the cost of equity varies by type of firm, type of disclosure, and measure of information asymmetry used (Fuhrmann et al., 2017). Zhou et al. (2016) emphasize the unique features of the GHG assurance market that distinguish it from the broader sustainability assurance market, because GHG assurance now has its own standard. We thus extend the literature by providing empirical evidence of market response to this important GHG assurance practice.
Third, our findings contribute to international research by providing important insights into how country-level institutions interact with carbon assurance to affect firms’ COE. We find that the relationship between carbon assurance and COE is conditional on a range of firm- and country-level moderators, which has important insights for global collective action to reduce carbon emissions. Understanding the effects of different countries’ institutional environments on COE is essential when standard setters and policymakers are considering whether and how to apply mandates around climate-related reporting or auditing standards for the preparation of carbon reports.
The rest of this article is organized as follows. Section 2 discusses the difference between sustainability assurance and carbon assurance and reviews the relevant assurance literature. Section 3 discusses hypothesis development. Section 4 covers the sample selection and explains our research design. Section 5 discusses the baseline empirical results. Section 6 reports the results of the cross-sectional analysis and section 7 reports on further analysis on characteristics of carbon assurance. Section 8 concludes the paper.
2. Literature review
2.1. Sustainability disclosure, assurance, and the cost of capital
Prior research on sustainability disclosure and its impact on equity capital costs shows mixed results. Some studies suggest it lowers equity costs (Dhaliwal et al., 2011, 2014; El Ghoul et al., 2011; Plumlee et al., 2015), while others, such as Richardson and Welker (2001), document a positive association between social disclosures and the COE. Clarkson et al. (2013) and Barth et al. (2017), however, find no significant relation. The literature on sustainability disclosure has extended to include studies on sustainability assurance, examining third-party assurance of sustainability reports. These studies are categorized into motivations for and consequences of such assurance.
The first stream of studies examines firms’ motivations to engage in sustainability assurance and the determinants of this assurance. Research by Simnett et al. (2009) and Hoang and Trotman (2021) supports assurance for enhancing credibility of a firm’s sustainability disclosures. However, skepticism exists regarding the role of sustainability assurance in legitimizing or greenwashing (Gray, 2010; Hopwood, 2009; Lyon and Maxwell, 2011). They question the effectiveness of such assurance and raise the concern that sustainability assurance may be overly influenced by management and not address the relevance or completeness of sustainability reporting (e.g. Ball et al., 2000; Casey and Grenier, 2015; Owen et al., 2000; Smith et al., 2011).
The second stream of literature considers the consequences of sustainability assurance. The US studies like Coram et al. (2009), Reimsbach et al. (2018), and Brown-Liburd and Zamora (2015) examine sustainability assurance and firm value. Casey and Grenier (2015) find that on average firms that voluntarily disclose corporate social responsibility (CSR) information and obtain external assurance have a lower COE, lower forecast errors, and lower dispersion than firms that do not. Fuhrmann et al. (2017) document that high-quality sustainability assurance reduces information asymmetry in a sample of European companies. However, studies like Caglio et al. (2020) and Garzón-Jiménez and Zorio-Grima (2021) provide different insights for developing countries, suggesting varied impacts of assurance. Cuadrado-Ballesteros et al. (2017) and Clarkson et al. (2019) find that capital market participants value the provision of a CSR report only when it is assured by a Big 4 accounting firm.
However, few studies give international evidence on the economic benefits of sustainability assurance (Cuadrado-Ballesteros et al., 2017), especially on carbon assurance’s impact on equity costs. As sustainability is multidimensional, the current research in sustainability assurance might not be fully applicable to specific carbon assurance. Therefore, this study narrows its focus to climate change and GHG emissions and contributes to global research in this area.
2.2. Carbon assurance
Despite the growing prominence of carbon assurance, there has been limited empirical research on the topic, and thus our study contributes to the emerging literature on carbon assurance. Many empirical studies in this literature have focused on the determinants of the choice of external carbon assurance adoption (Datt et al., 2018, 2019; Fan et al., 2021; Green and Taylor, 2013; Green and Zhou, 2013; Simic et al., 2024; Zhou et al., 2016). Some studies focus on the differences between accounting firms and consulting firms as carbon assurance providers (Datt et al., 2020; Green et al., 2017; Green and Taylor, 2013; Green and Zhou, 2013; Huggins et al., 2011). Other studies explore whether internal auditors have an impact on GHG/energy reporting (Trotman and Trotman, 2015), an expectation gap and specific expertise for GHG emissions assurance (Green and Li, 2012; Kim et al., 2016), and the development of an international standard for GHG assurance (Cohen and Simnett, 2014; Simnett et al., 2009, 2010). Furthermore, Bui et al. (2021) and Luo et al. (2023) examine the impact of voluntary carbon assurance on financial reporting integrity and carbon disclosure quality, respectively. Although we expect that carbon assurance impacts investors’ perceptions regarding the reliability of carbon disclosure, there are limited empirical studies on the capital market effects of carbon assurance.
3. Hypothesis development
Voluntary carbon disclosure provides new value-relevant information beyond that conveyed by firms’ financial and CSR disclosures (e.g. Choi et al., 2021; Choi and Luo, 2021; Clarkson et al., 2015; Griffin et al., 2017). Managers possess superior information regarding a company’s climate risk and opportunity profile and carbon performance. Although such information may be useful for valuing the company, its disclosure is not mandatory, and globally recognized accounting standards are lacking (e.g. Luo et al., 2012). Managers are given substantial discretion over whether to voluntarily report on carbon issues, the format and content of the report, where to report, and so on. Self-serving managers have strong incentives to voluntarily provide positive, biased, or misleading carbon disclosures to obtain personal benefits (Abu Bakar and Ameer, 2011; Alrazi et al., 2016; Ferguson et al., 2016; Hrasky, 2012; Luo, 2019). This makes voluntary carbon disclosures only partially informative or even uninformative, which leads to serious concern about the credibility of carbon disclosure.
External carbon assurance plays an important role in enhancing the credibility of carbon disclosures, because external assurers are technically and ethically competent in their role and are often independent from the preparer of the information (International Auditing Assurance Standards Board, 2013). Carbon assurance is particularly important for positive narrative information, the predominant type of carbon information reported, as reports of negative information are viewed as credible even when they lack assurance (Casey and Grenier, 2015). We posit that the bolstered credibility resulting from external assurance amplifies investors’ confidence and trust in the carbon policies, risks, opportunities, and overall performance of firms. As a result, it reduces the information asymmetry between a company and its investors, improves the firm’s reputation, and thus makes it easier for the firm to acquire resources (O’Dwyer et al., 2011). Many empirical studies provide strong evidence that third-party CSR assurance is positively valued by equity market participants (e.g. Brown-Liburd and Zamora, 2015; Casey and Grenier, 2015; Pflugrath et al., 2011). In line with this view, we expect investors to seek a lower risk premium and thus a lower COE for firms with external assurance compared to those without. We put forth the first hypothesis as follows:
Next, we consider whether corporate emissions reduction performance and participation in an ETS have conditioning effects on the relationship between carbon assurance and COE. Firms with superior emissions reduction performance may have established better environmental risk management and tend to disclose high-quality carbon information (Clarkson et al., 2008; Luo and Tang, 2014; Qian and Schaltegger, 2017). These firms may have developed good relationships and mutual trust with a range of stakeholders. Thus, it is not necessary for them to purchase costly external carbon assurance to ensure the reliability of their carbon information. In contrast, companies with poor emissions reduction performance are usually considered by stakeholders to be less ethical or to lack an awareness of carbon risks (Clarkson et al., 2008). They have a greater incentive to disclose positive information to disguise their poor performance (Depoers et al., 2016; Hrasky, 2012; Unerman, 2008). Therefore, the voluntary purchase of costly carbon assurance adds significant value to investors’ assessments of the potential of these opportunistic firms. Therefore, we expect the negative relationship between carbon assurance and the cost of equity to be stronger for firms with poor environmental performance. We thus establish the second hypotheses as follows:
As noted by previous studies, firms engaging in ETS face increased scrutiny from stakeholders (e.g., Huang et al., 2024). The implementation of climate-related policies, such as ETSs, has led companies in these schemes to improve transparency and enhance carbon disclosure quality (e.g. Luo, 2019; Luo et al., 2012; Tang and Luo, 2016). However, for participants within ETS countries, adopting voluntary carbon assurance might not offer significant economic benefits to investors, as this practice is common and lacks distinctiveness. However, external carbon assurance is particularly valuable for firms outside of ETS as the differentiator. It assures investors of the accuracy of reported emissions and regulatory compliance. Given the growing investor focus on climate risks and opportunities (Choi and Luo, 2021; Griffin et al., 2017; Jiang and Luo, 2018; Li et al., 2024; Matsumura et al., 2014), carbon assurance becomes a strong signal of a firm’s commitment to carbon neutrality, particularly for non-ETS participants. It aids investors in identifying responsible carbon management practices (Luo et al., 2023; Marco and Lorenzo, 2016). Therefore, the need for carbon assurance is arguably greater among investors in non-ETS firms and thus the economic advantages of seeking additional carbon assurance to verify the credibility of voluntary carbon disclosures are more pronounced. This leads to our third hypothesis:
Furthermore, the effects of carbon assurance on the COE are also dependent on firms’ national institutions. We first consider a country’s legal institutions (e.g. in common law countries, effective regulatory governance). In the financial audit literature, Francis et al. (2003) find that higher quality auditing is more likely to exist in countries with stronger legal institutions for investor protection. Hope et al. (2009) provide evidence that the positive association between excess auditor remuneration and the implied required rate of return exists only in countries with stronger legal institutions. The results suggest that when those country-level institutions are stronger, investors tend to rely more on a financial audit to assess the quality of financial statement information. In countries with weaker investor protection, investors are less likely to rely on audited financial statements but rather to rely on alternative sources, meaning that the variation in the quality of the audit is less relevant to investors’ decisions. Applying similar arguments to our context, we argue that investors in countries with stronger legal institutions have more demand for credible carbon information and are more willing to use the assured information because they are confident that their interests will be well protected. As a result, the economic benefits of obtaining independent carbon assurance are greater. In addition, carbon assurance can sometimes be used for ex post monitoring and governance. As a governance mechanism, carbon assurance requires supporting country-level institutions (Francis et al., 2011). Doidge et al. (2007) document that the net payoffs of strong governance are higher in countries with strong legal institutions. Therefore, we expect the negative association between carbon assurance and the cost of equity to be stronger in countries with stronger legal institutions. The fourth hypothesis is established as follows:
Next, prior research shows that countries with higher economic development are more likely to have strong institutions that protect investors and have more resources to cater to stakeholder interests. In developing countries, capital markets are less developed and prospects for external financing are limited. Carbon reporting and assurance are also less prevalent in such countries (Luo et al., 2013). If carbon information does not play a primary role in investors’ decisions (i.e. in developing countries), voluntary carbon assurance will have a less significant impact on the cost of equity (Clarkson et al., 2019). Firms may not trust carbon information even if it is externally verified because of inherent weaknesses in the country’s institutions. These limit firms’ incentives to use voluntary carbon assurance to obtain capital market benefits. In contrast, developed countries have strong institutions and mature capital markets. It is common practice in these countries to report carbon information and adopt carbon assurance. The adoption of carbon assurance signals a genuine commitment to carbon neutrality, so firms that voluntarily adopt carbon assurance are likely to be rewarded with cheap access to external equity financing. According to this view, the economic benefits of voluntary carbon assurance (i.e. a lower COE) are more likely in developed countries where carbon disclosure is high, carbon policies are more stringent, and investors are more aware of climate risks. We thus expect the negative association between carbon assurance and COE to be stronger for firms in developed countries. We establish the fifth hypothesis as follows:
4. Research design
4.1. Empirical model
We examine the relation between carbon assurance and the COE using Equation (1)
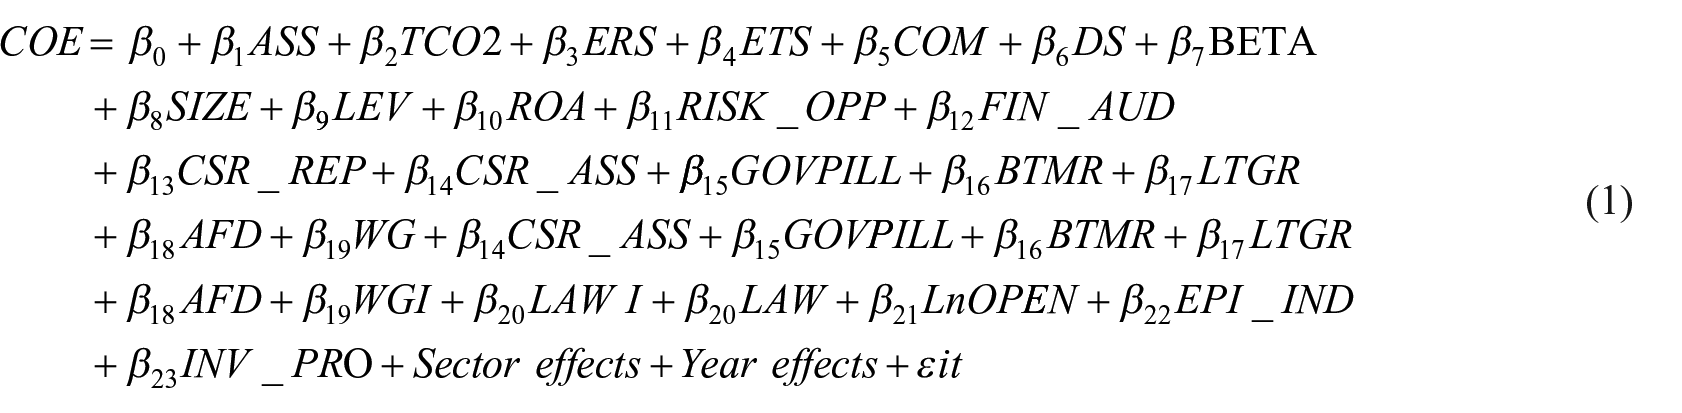
Our dependent variable, COE, represents the COE. Several studies use one or more implied cost of equity measures to examine various questions in environmental and carbon accounting (Bui et al., 2020; Kim et al., 2015; Li et al., 2019; Renato and Ana, 2021). According to Hmaittane et al. (2019), there is no consensus on the best model(s), so different authors use different models. Dhaliwal et al. (2006) posit that limiting a model to the use of one proxy to measure the cost of equity may produce spurious results if particular attributes of the model are correlated with variables of interest. Therefore, following Hail and Leuz (2009), we estimate COE for our sample firms using the average of COEs calculated based on methodologies described in Easton (2004), Claus and Thomas (2001), Gebhardt et al. (2001), and Ohlson and Juettner-Nauroth (2005). This method of measurement can potentially reduce noise in individual measures (Larcker and Rusticus, 2010). Appendix 1 provides details on the measurement of the cost of equity for each model. Our independent variable of interest, ASS, is a dummy variable that takes a value of 1 if the firm assured both Scope 1 and 2 emissions externally assured and 0 otherwise (Luo et al., 2023). 2
We control for a number of firm-level and country-level variables that may influence COE (Dhaliwal et al., 2011; Hail and Leuz, 2006, 2009). We calculate GHG emissions (TCO2) as the natural logarithm of total Scope 1 and Scope 2 GHG emissions (in tons). Higher emissions are expected to increase COE due to greater climate risks (Bolton and Kacperczyk, 2021; Bui et al., 2020). The emissions reduction score (ERS) is also included, indicating a company’s commitment to reducing environmental emissions, with a range from 0 to 100. We anticipate a negative relationship between COE and ERS, suggesting firms actively reducing emissions face lower climate risks and thus a lower COE. We also consider the participation in an ETS, using a dummy variable (1 for participants, 0 for non-participants). 3 Non-compliance with ETS regulations can increase financial risk (Choi and Luo, 2021). In addition, we account for the presence of a CSR sustainability committee (COM), scored as 1 if existing and 0 otherwise, and the carbon disclosure score (DS) (Cotter and Najah, 2012; Luo, 2019; Luo and Wu, 2019). 4
Following previous studies (Bui et al., 2020; Dhaliwal et al., 2011), we include the annual market beta (BETA) to account for systematic risk, and firm size (SIZE), measured as the log of market capitalization. Firm leverage (LEV) is the ratio of total liabilities to total assets and return on assets (ROA) is calculated from net income before extraordinary items and preferred dividends divided by total assets. We also consider risks and opportunities related to climate change (RISK_OPP), a dummy variable indicating awareness of climate-related commercial risks and opportunities. In addition, we control for the Big 4 financial auditor’s presence (FIN_AUD), a dummy variable indicating whether the auditor is a Big 4 firm; CSR reporting (CSR_REP), indicating whether the firm publishes CSR-related reports (Luo and Wu, 2019); and CSR assurance (CSR_ASS), reflecting whether the CSR report is externally assured. Corporate governance (GOV_PILL) is included due to its significant association with sustainability assurance and COE (Chen et al., 2009; Pae and Choi, 2011; Peters and Romi, 2015; Tran, 2014; Zhou et al., 2016). Furthermore, we consider the book-to-market ratio (BTMR) and long-term growth rate (LTGR) as proxies for a firm’s growth prospects, and analyst forecast dispersion (AFD) as a measure of information risk (Casey and Grenier, 2015; Dhaliwal et al., 2011; Hail and Leuz, 2006).
For country-level variables, we include world governance indicators (WGI) to account for differences in regulatory governance, 5 and LAW, a dummy variable representing the country’s legal system (Jackson and Deeg, 2008; La Porta et al., 1998). We also consider the natural logarithm of the openness score (LnOPEN), environmental performance index (EPI_IND), and the strength of investor protection (INV_PRO). Year and sector fixed effects are included to control for year and sector variations. All variable definitions are detailed in Appendix 2.
4.2. Sample selection
To examine voluntary assurance and GHG emissions information, we use data obtained from the CDP from 2010 to 2017. 6 This sample period is chosen because before 2010, the CDP used inconsistent methodologies (Andrew and Cortese, 2012; Kolk et al., 2008), and it has become more comprehensive and comparable in recent years. The initial sample consists of 45,535 firm-year observations targeted by the CDP for climate change information. We delete 4124 firm-year observations that decline to participate, 307 observations that do not answer all the questions, 19,652 observations that do not respond, 1595 observations whose response is covered by another company, 479 observations considering a response, 290 observations with a “questionnaire forthcoming” response, and 12,588 observations with missing data. Our final sample, therefore, comprises 6500 firm-year observations from 44 countries. 7 Other firm-level data are obtained from the Eikon database, and country-level data are obtained from the World Bank database. Table 1 presents the sample selection process.
Sample selection.
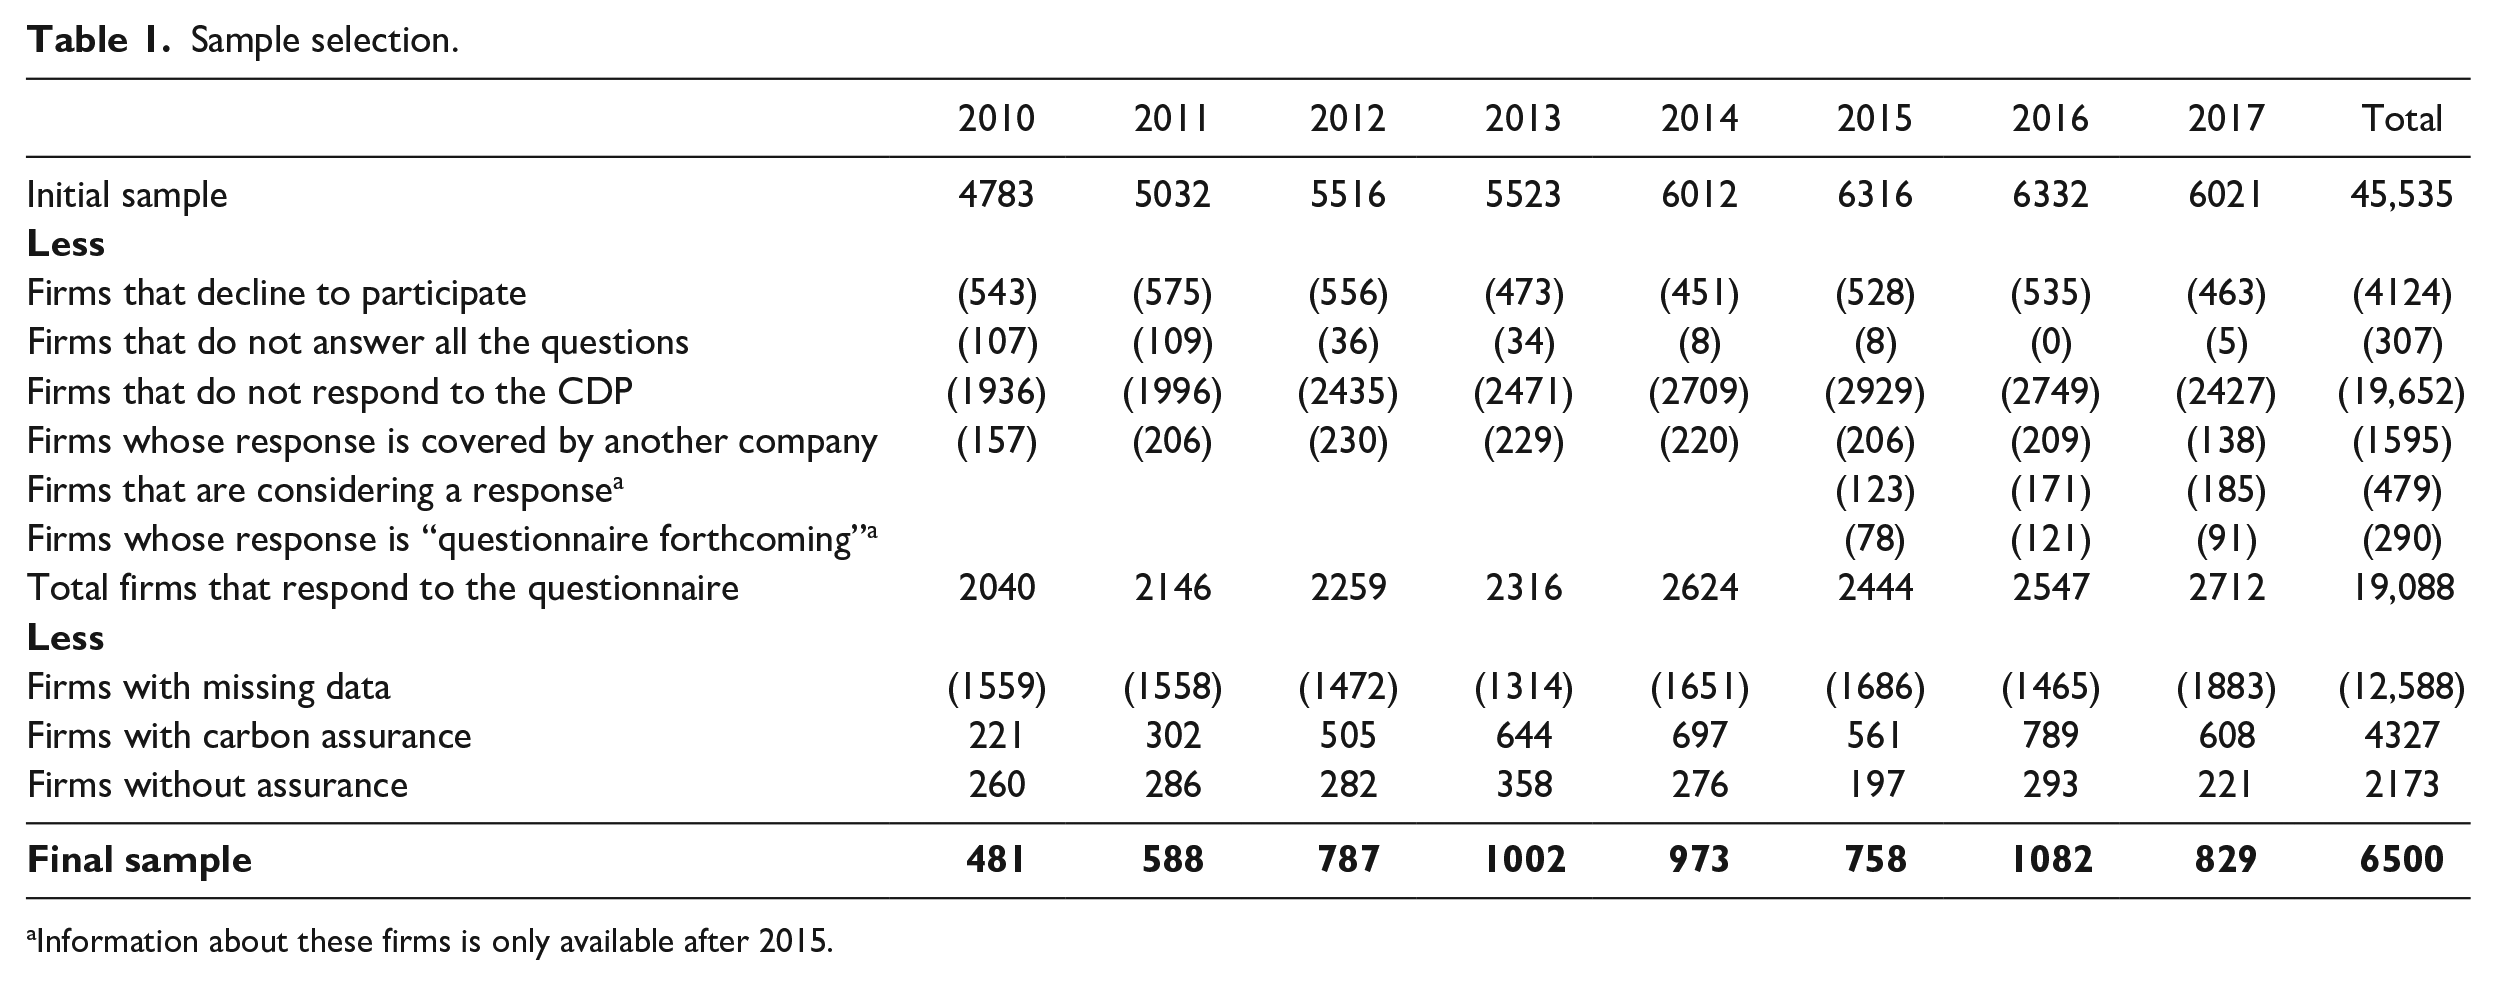
Information about these firms is only available after 2015.
5. Empirical results
5.1. Descriptive analysis
Table 2, Panel A, presents the distribution of observations by country for all firms that report their assurance status, for firms that have their carbon emissions assured, and for firms that do not have their carbon emissions assured. The top five countries with firms that have their carbon emissions assured are the United States, the United Kingdom, Japan, France, and South Africa, with 846 (55.73%), 682 (66.53%), 395 (60.41%), 319 (88.36%), and 206 (76.57%) observations, respectively. Similar results are reported by other international studies that examine carbon assurance (Datt et al., 2020, 2021).
Sample distribution.
Panel A: Sample distribution by country (N = 6500).
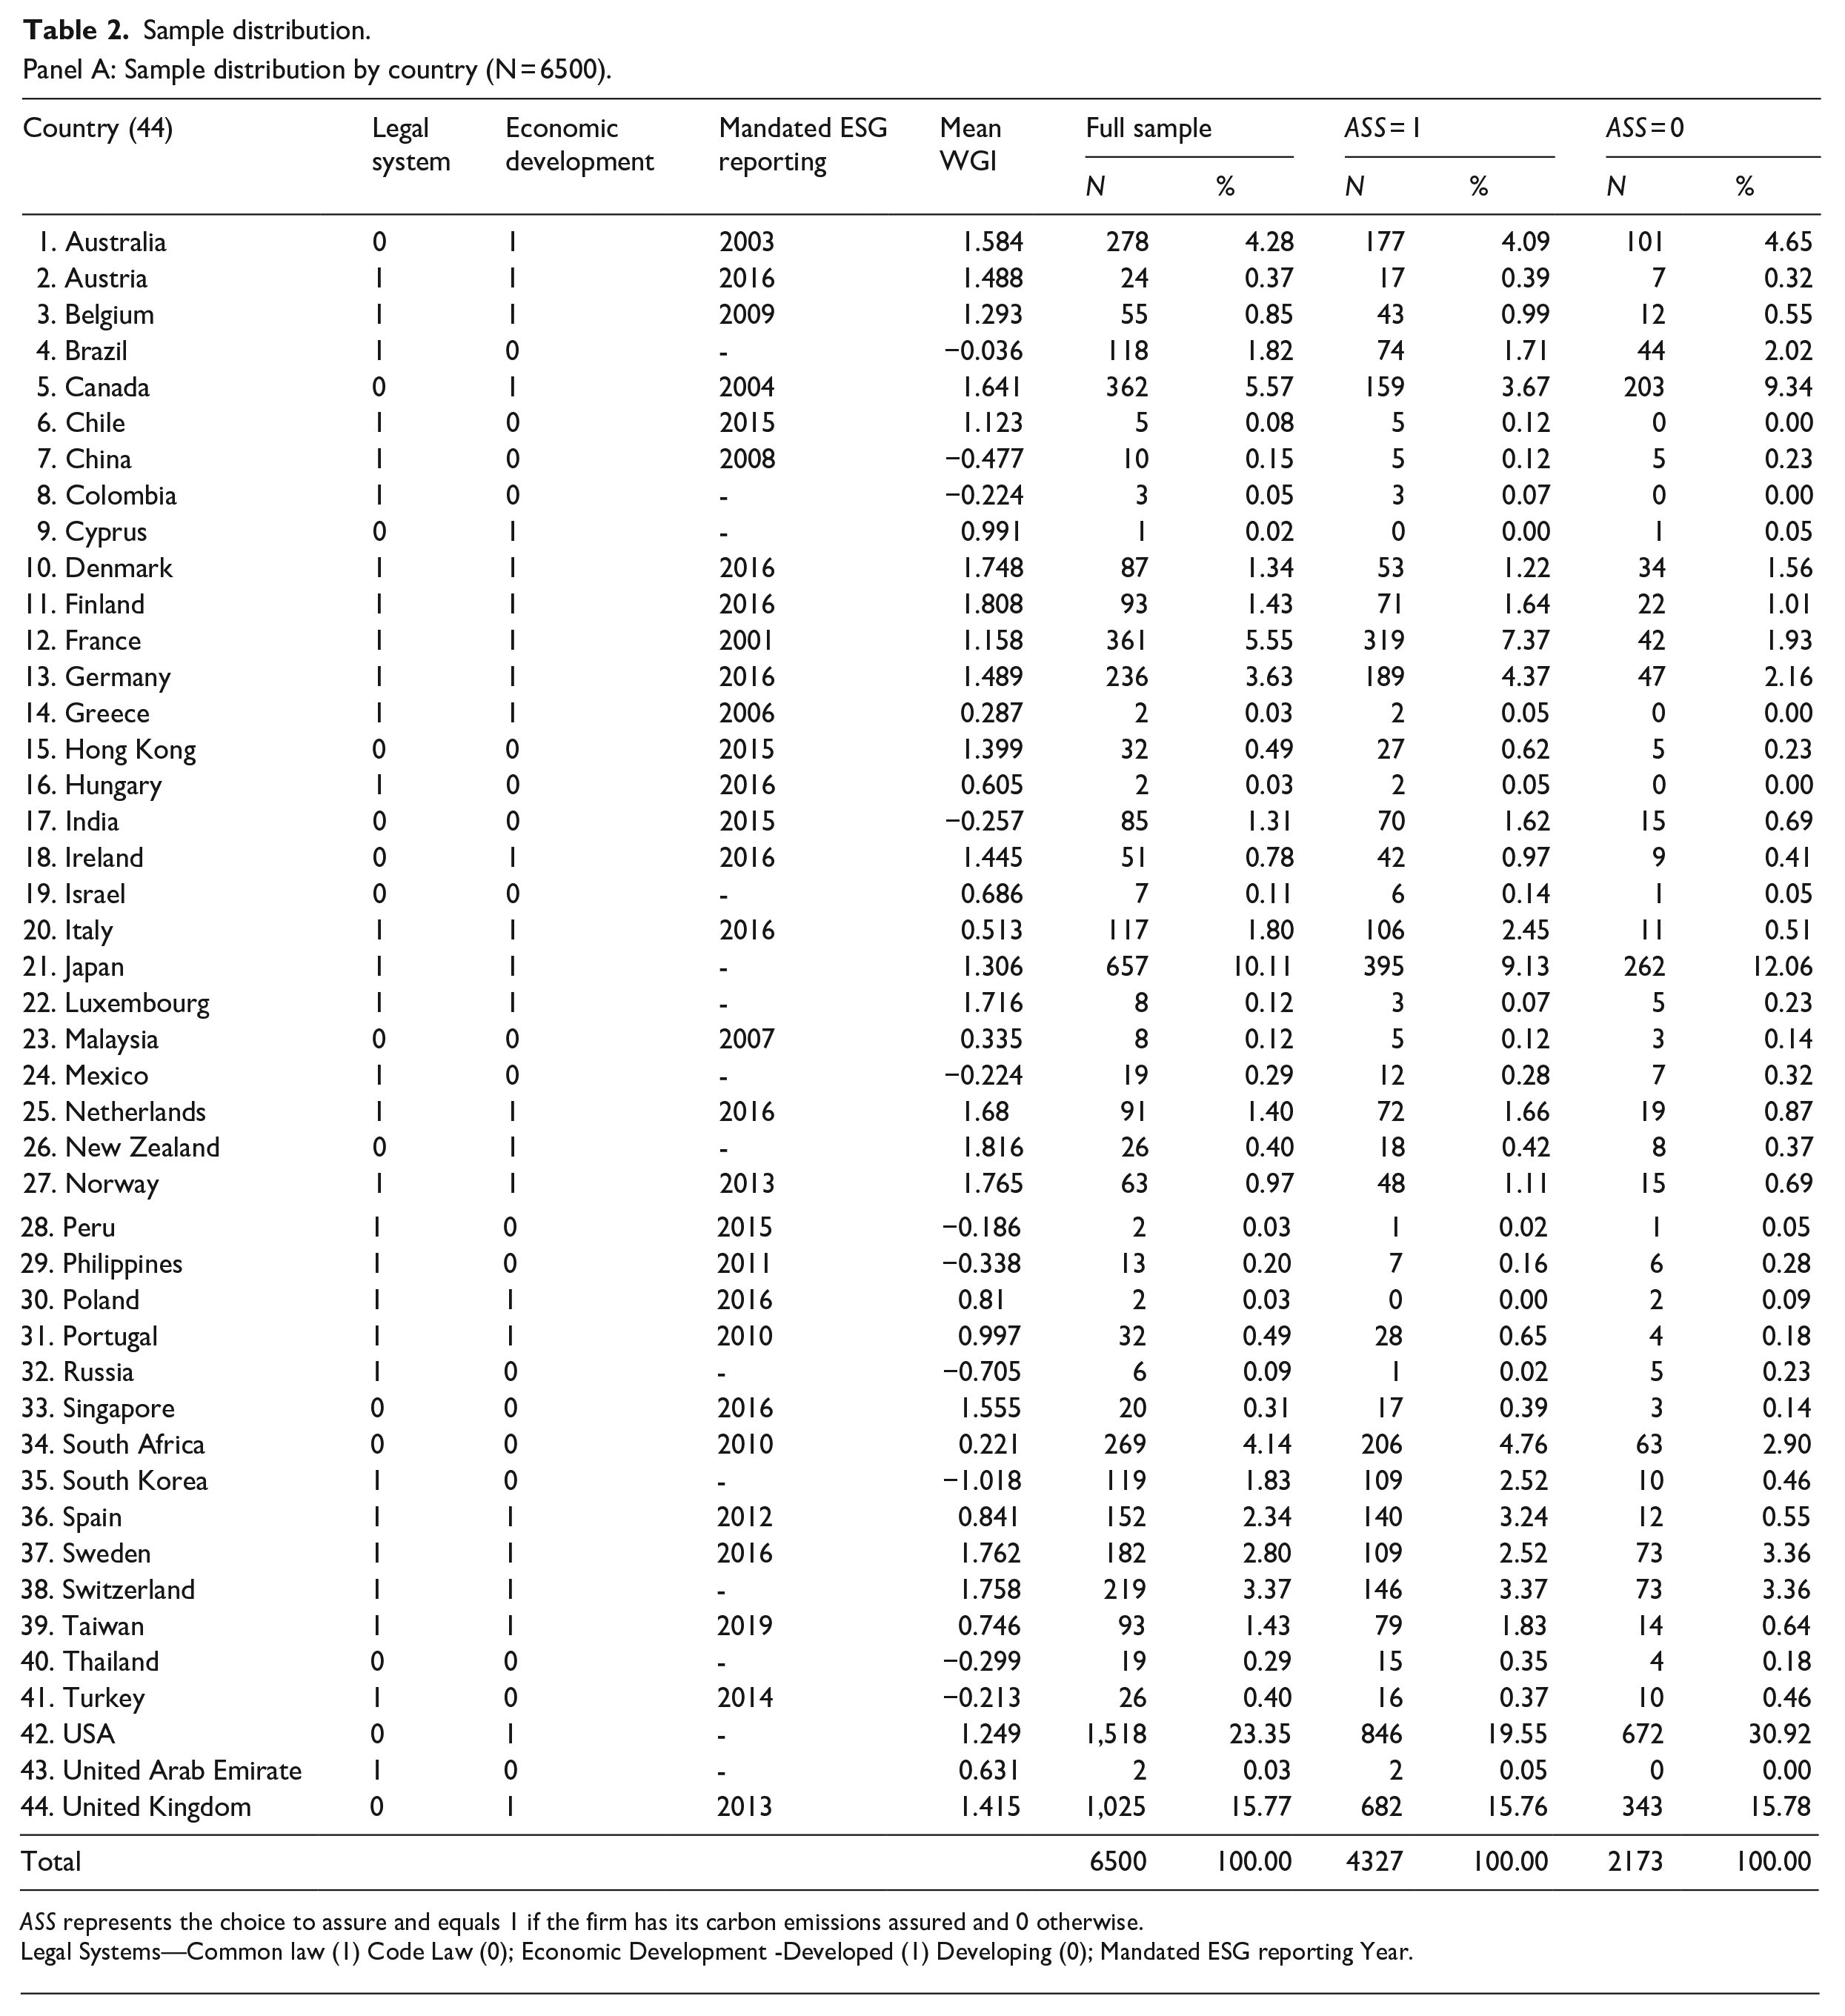
ASS represents the choice to assure and equals 1 if the firm has its carbon emissions assured and 0 otherwise.
Legal Systems—Common law (1) Code Law (0); Economic Development -Developed (1) Developing (0); Mandated ESG reporting Year.
Panel B. Sample distribution by GICS Sector (N = 6500).
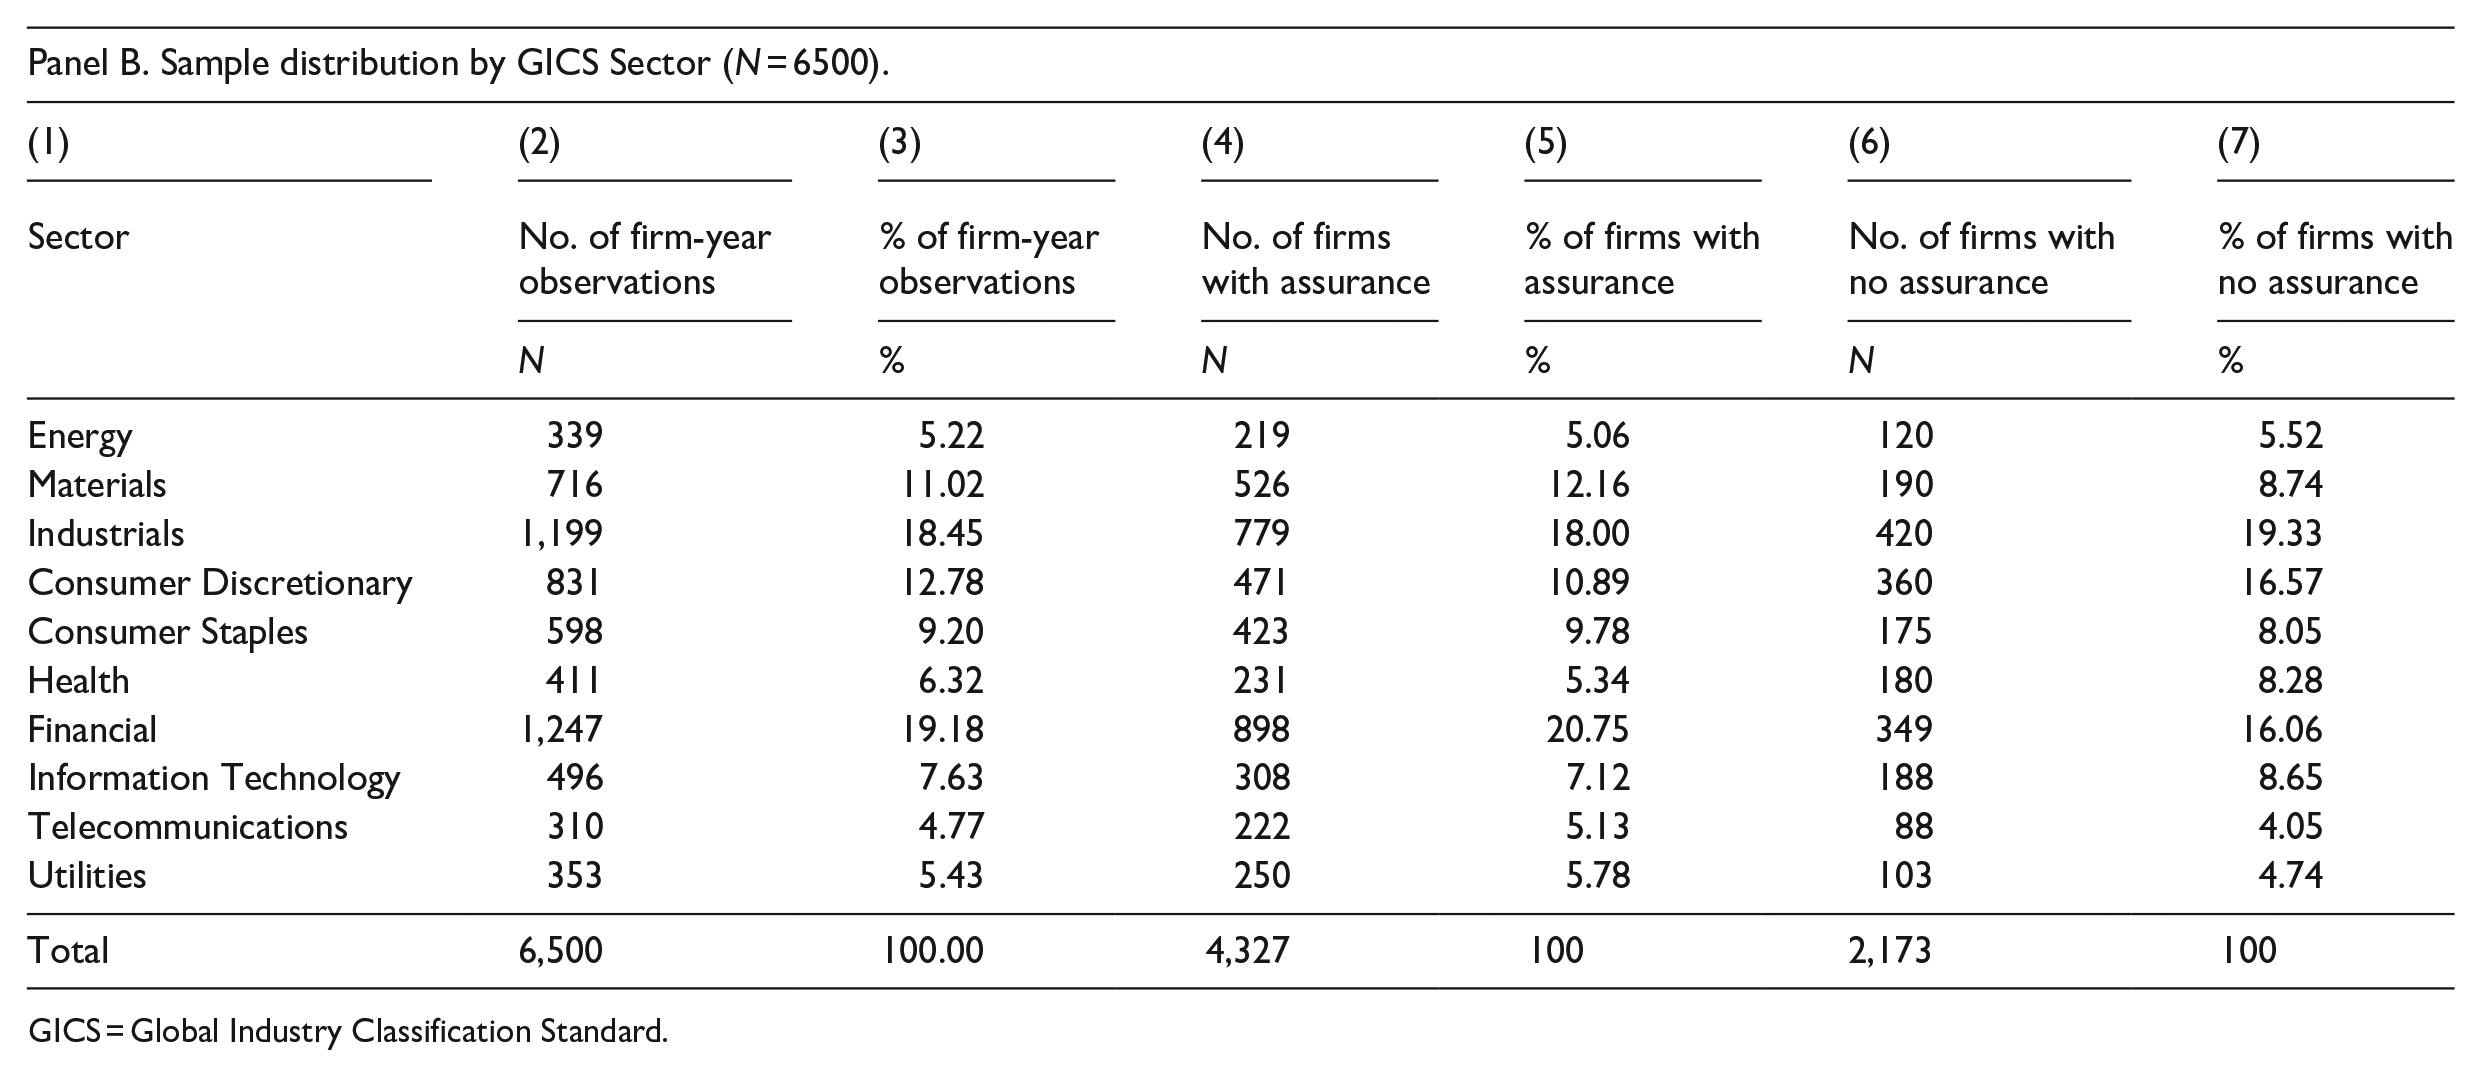
GICS = Global Industry Classification Standard.
Table 2, Panel B, reports the distribution of sample firms by the Global Industry Classification Standard sectors. In column (2), the top five sectors with firms that report their carbon emissions are financial (19.18%), industrials (18.45%), consumer discretionary (12.78%), materials (11.02%), and consumer staples (9.20%). In column (4), the top five sectors with firms that have their carbon emissions assured are financial (20.75%), followed by industrials (18.00%), materials (12.16%), consumer discretionary (10.89%), and consumer staples (9.78%). This is comparable to results reported by Datt et al. (2018).
Table 3 presents descriptive statistics for the dependent and independent variables. We find that the mean COE is 10.04, which implies that the cost of equity of our sample firms averaged at about 10%. The mean ASS is 0.67, which indicates that approximately 67% of the sample firms obtain external carbon assurance. The mean of total scope 1 and scope 2 emissions (TCO2) is 12.62, which suggests that on average our sample firms emit 103,777 tons of scope 1 and scope 2 GHG emissions. The mean ERS is 68.64. Overall, our descriptive statistics are generally consistent with the literature (Bui et al., 2020; Datt et al., 2018, 2020; Gupta, 2018; Weber, 2018).
Descriptive statistics (N = 6500).
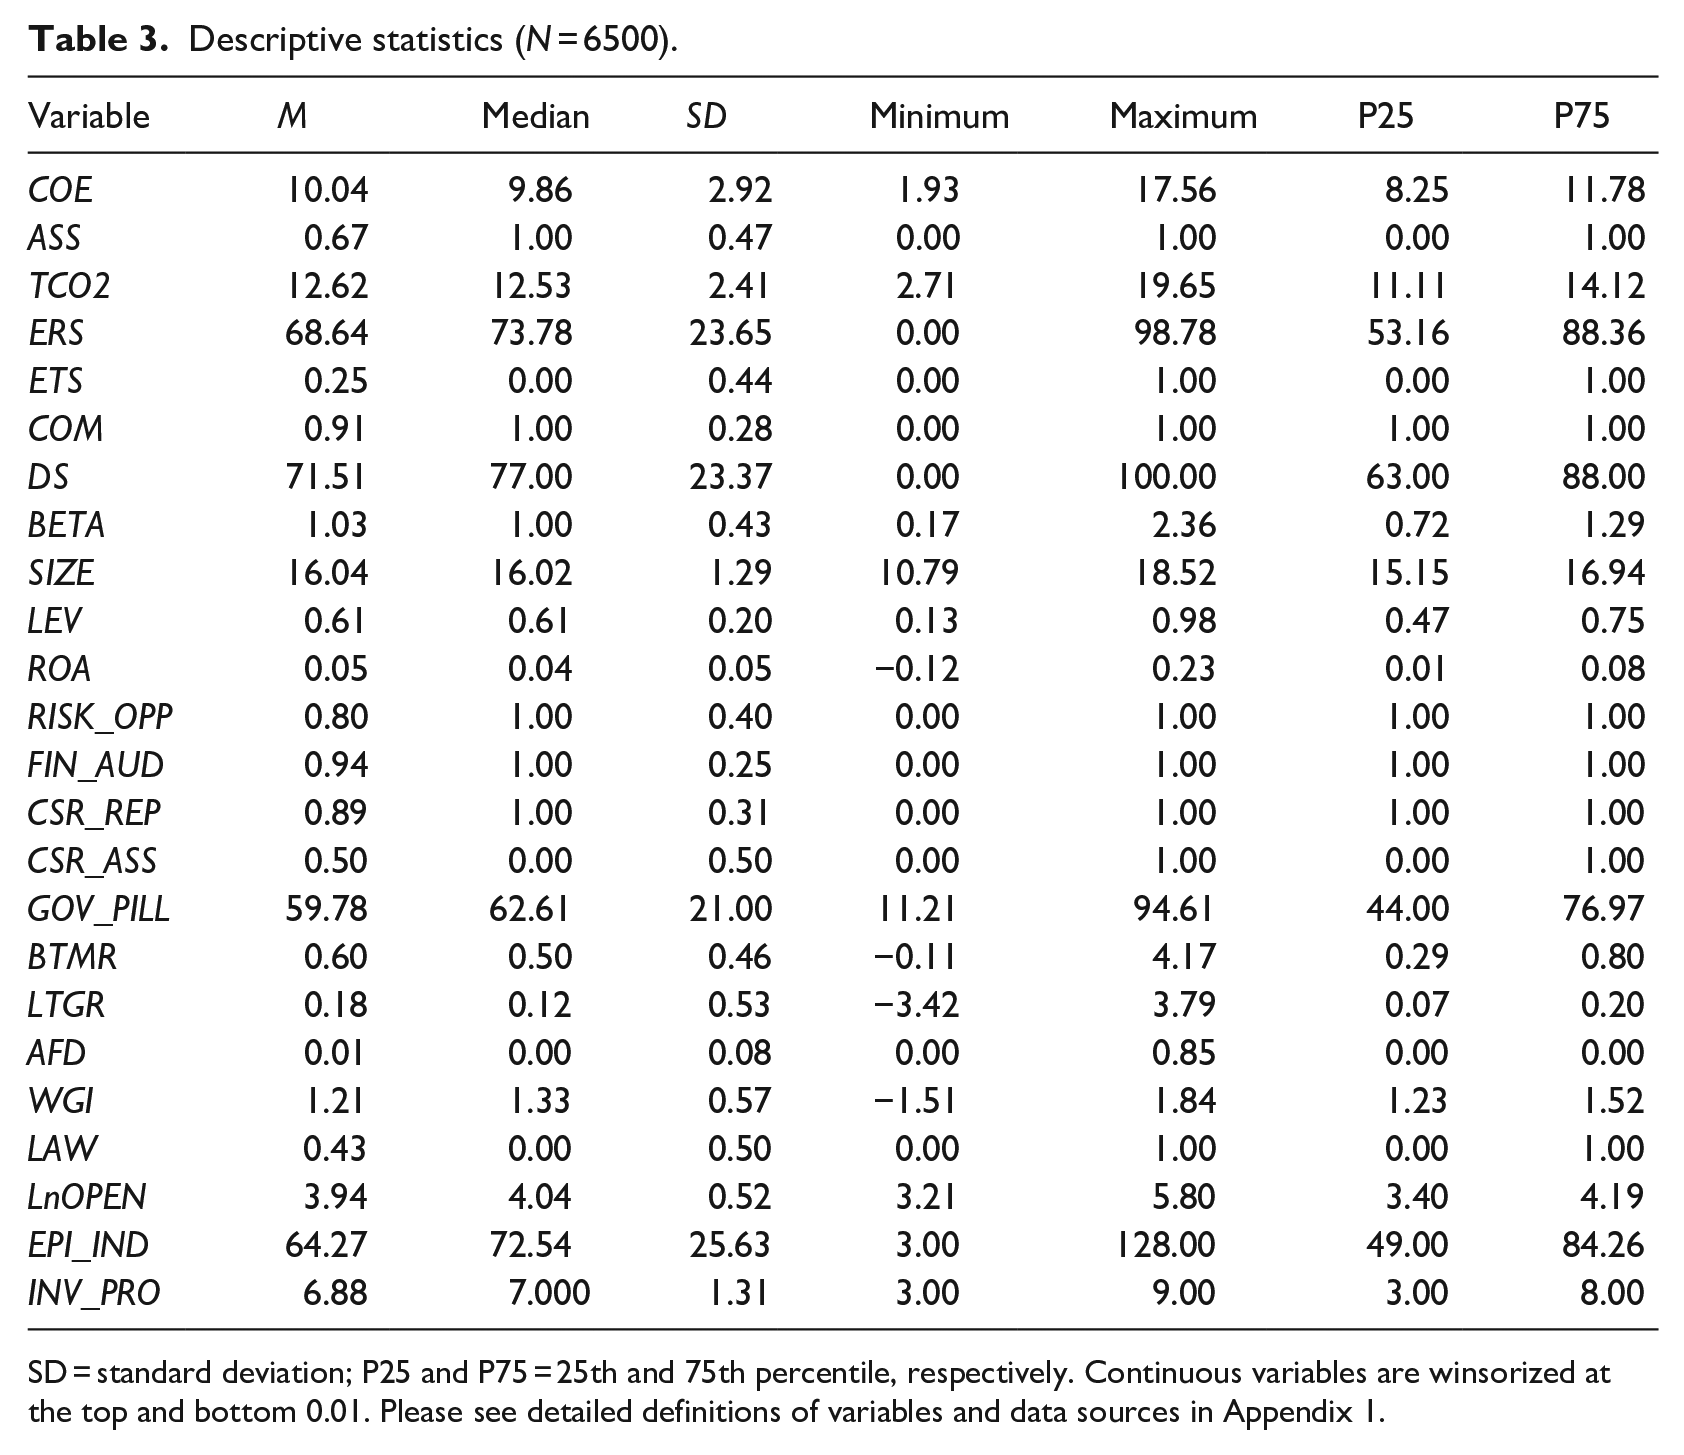
SD = standard deviation; P25 and P75 = 25th and 75th percentile, respectively. Continuous variables are winsorized at the top and bottom 0.01. Please see detailed definitions of variables and data sources in Appendix 1.
5.2. Multivariate analysis—the impact of carbon assurance on the cost of equity (H1)
Table 4 reports our baseline regression results for the relationship between COE and ASS. We find that the coefficient of ASS is negative and significant (β1 = –0.223, p < 0.05), which suggests that external carbon assurance enhances the credibility of information, and thus investors demand a lower return (Dhaliwal et al., 2011; Simnett et al., 2009). The estimated coefficient of TCO2 is positive and significant at the 1% level (β2 = 0.118, p < 0.01), which indicates that the greater the exposure to carbon risks, the more legitimacy and stakeholder pressure firms face. This result is consistent with the literature (Bui et al., 2020; Kim et al., 2015; Renato and Ana, 2021). In addition, we find a significant negative coefficient of ERS (–0.005, p < 0.05), which suggests that COE is lower when the emissions reduction score is higher.
The relationship between carbon assurance and the cost of equity.
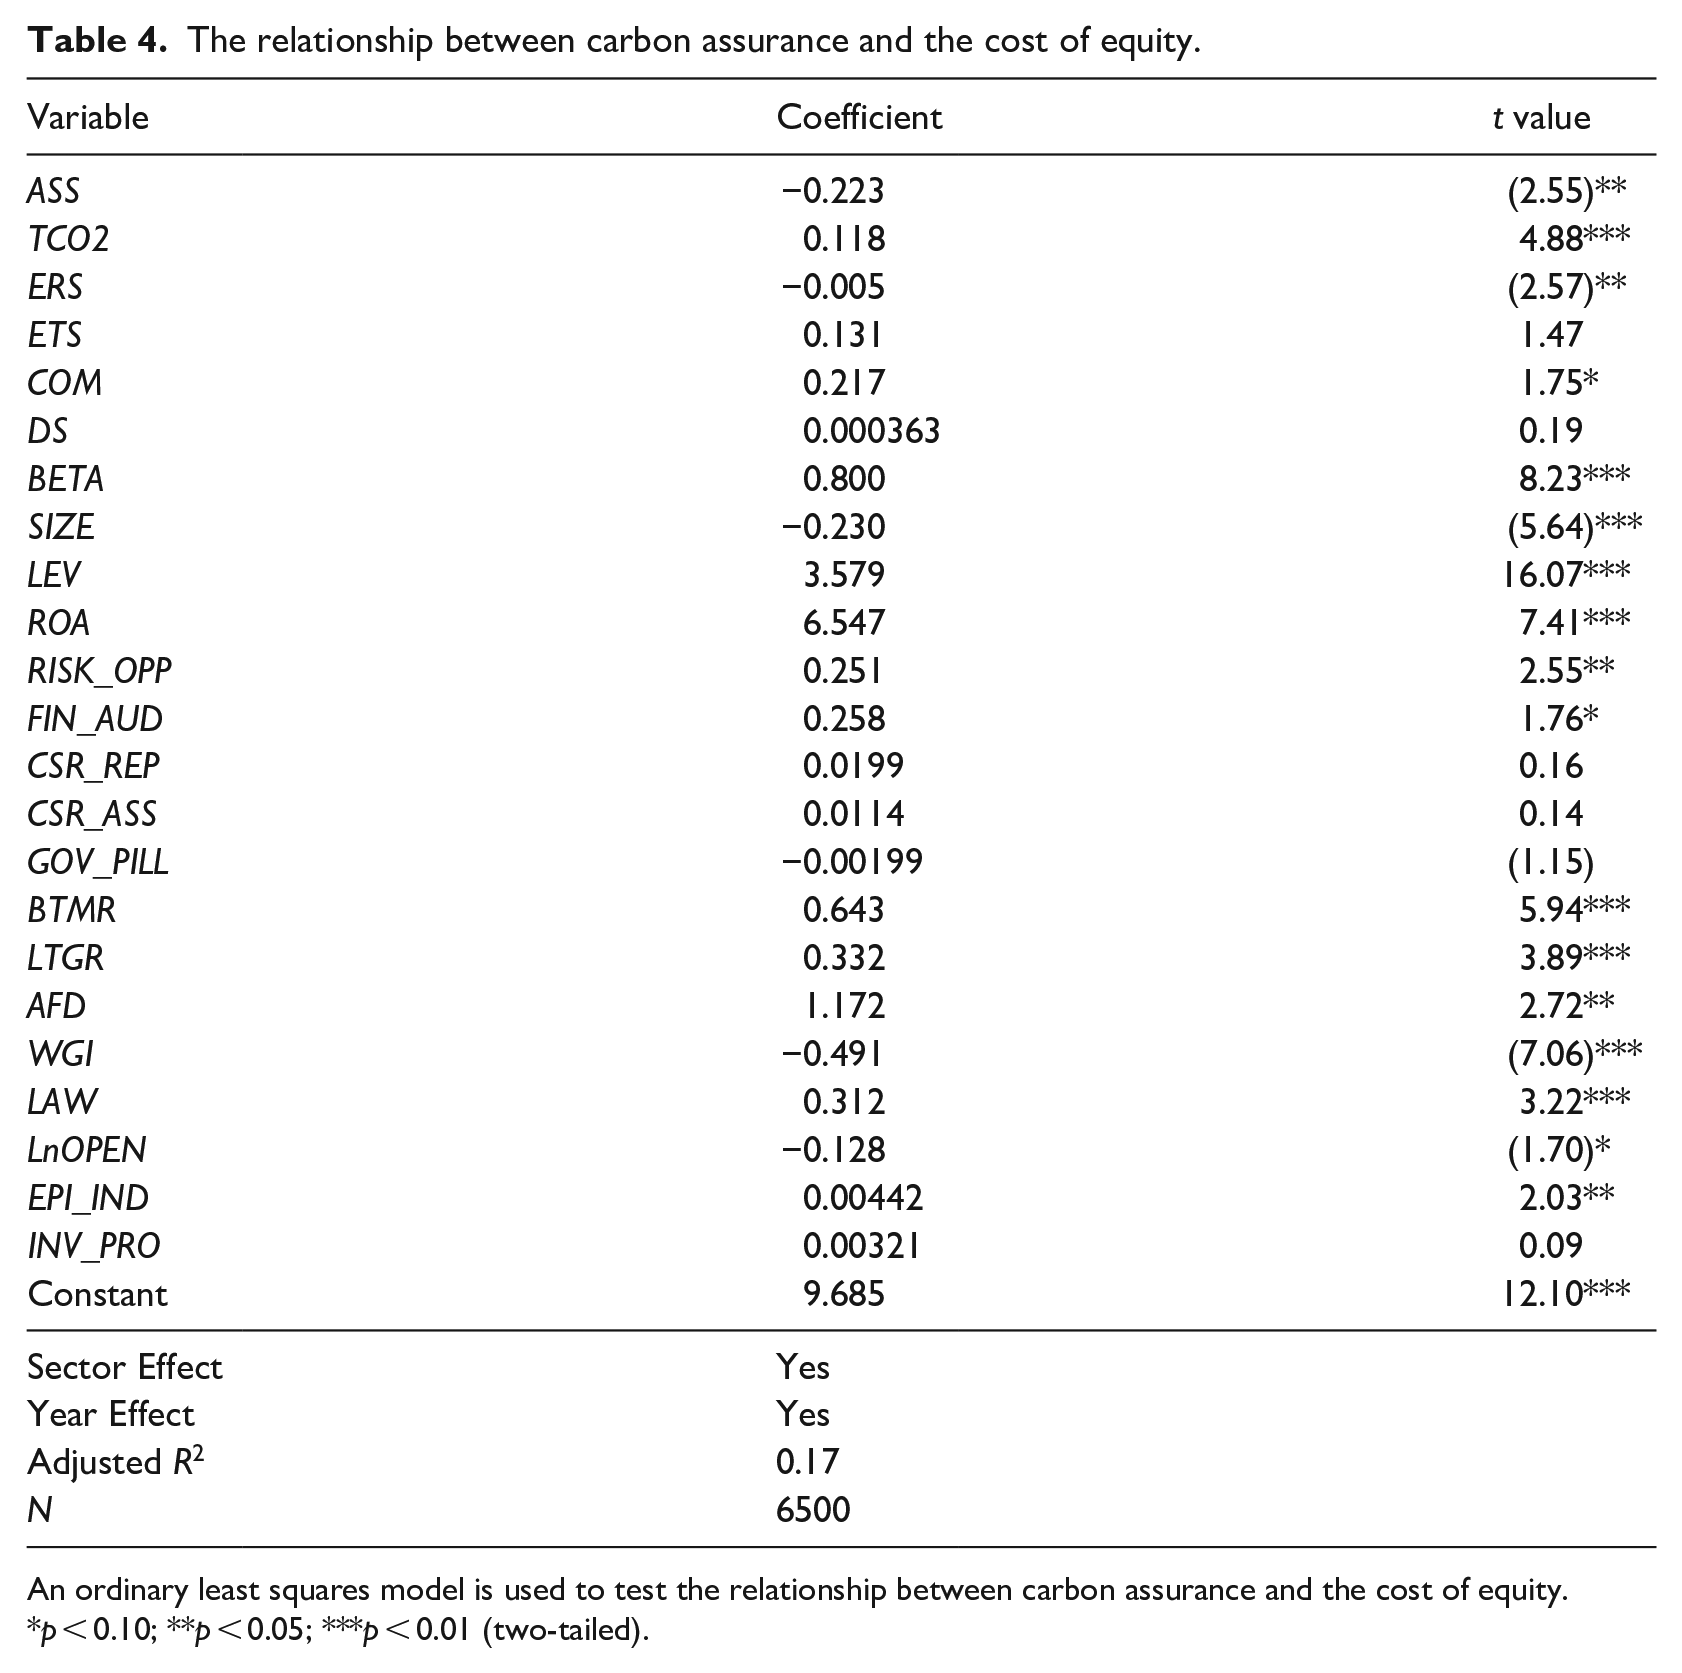
An ordinary least squares model is used to test the relationship between carbon assurance and the cost of equity.
p < 0.10; **p < 0.05; ***p < 0.01 (two-tailed).
Regarding the control variables, we find a negative relationship between SIZE and COE, which suggests that investors in larger firms enjoy a lower COE and may have less risky investments (Clarkson et al., 2008; Martínez-Ferrero and García-Sánchez, 2017a; Renato and Ana, 2021). In addition, BETA is significantly positively associated with COE, which indicates that a firm’s cost of equity increases with the systematic risk (Bui et al., 2020; Kuo et al., 2021; Renato and Ana, 2021). Also, consistent with the literature, the relationship between COE and LEV is positive, which shows that highly leveraged firms tend to have a higher COE (Kim et al., 2015; Martínez-Ferrero and García-Sánchez, 2017a). We find a positive coefficient for RISK_OPP that is significant at p < 0.05, which suggests that firms reporting awareness of climate change as posing a commercial risk and opportunity are perceived by investors as having increased climate risks, potentially leading to a higher COE. Notably, when sustainability assurance (CSR_ASS) is included in the model along with carbon assurance, it becomes insignificant (p > 0.10, t = 0.14). The non-significance of sustainability assurance may indicate that investors are placing more weight on carbon-related information rather than a broader spectrum of sustainability issues when assessing the COE. In other words, the observed relationship is primarily driven by the investors’ focus on the climate change dimension rather than broader or other dimensions of sustainability issues. The significance of the climate change dimension may stem from the growing recognition of the financial implications of climate change and the progressively more stringent regulatory and policy environment.
5.3. Robustness tests
5.3.1. Heckman’s two-stage analysis
Our study is subject to selection bias due to the self-reporting of carbon assurance information in the CDP questionnaire. To mitigate concerns over self-selection bias, we follow previous studies (Bui et al., 2020; Datt et al., 2020; Li, 2010) and perform Heckman’s two-stage test. This allows us to interpret the effect of the choice to assure and the cost of equity with all firms in the sample, not just the firms that have their carbon emissions assured. In the first stage, we analyze the decision to disclose carbon information to the CDP using Equation (2). We then test COE with the choice to assure in the second stage by correcting the selection bias. We expand the sample to include all firms sent the CDP annual questionnaire within our sample period. A total of 5196 firm-year observations for nonresponding firms are added to the original sample of 6500 firms in Stage 1 8

The dependent variable, DIS, is a binary variable that is coded 1 if the firm responds to the CDP questionnaire and 0 otherwise following prior studies on the decision to disclose additional information. Following the literature (Datt et al., 2020; Matsumura et al., 2014; Zhou et al., 2016), we introduce the industry mean DIS (INDMEAN) as the main instrumental variable because this variable is closely related to a firm’s propensity to disclose carbon information but is not necessarily related to its COE. Corporate governance factors such as gender diversity on the board (GEN) and independent board members (IBM) play an important role in decisions around climate change disclosure (Liao et al., 2015). LnRGDPPC is calculated as the natural logarithm of the per capita real gross domestic product, sourced from the World Bank. Corporate financial characteristics such as Tobin’s Q (TOBINQ) are widely considered influential factors that may affect firms’ choice to disclose carbon information voluntarily. Luo et al. (2013) document that firms in developed countries are more likely to voluntarily disclose carbon information. DEV_COU is an indicator variable that equals 1 if the country has been classified as a high-income economy and 0 otherwise. The data reported in Table 5 show that our main results still hold. The findings suggest that our results are robust to the use of Heckman’s two-stage model to control for sample selection bias.
Heckman’s two-stage model.
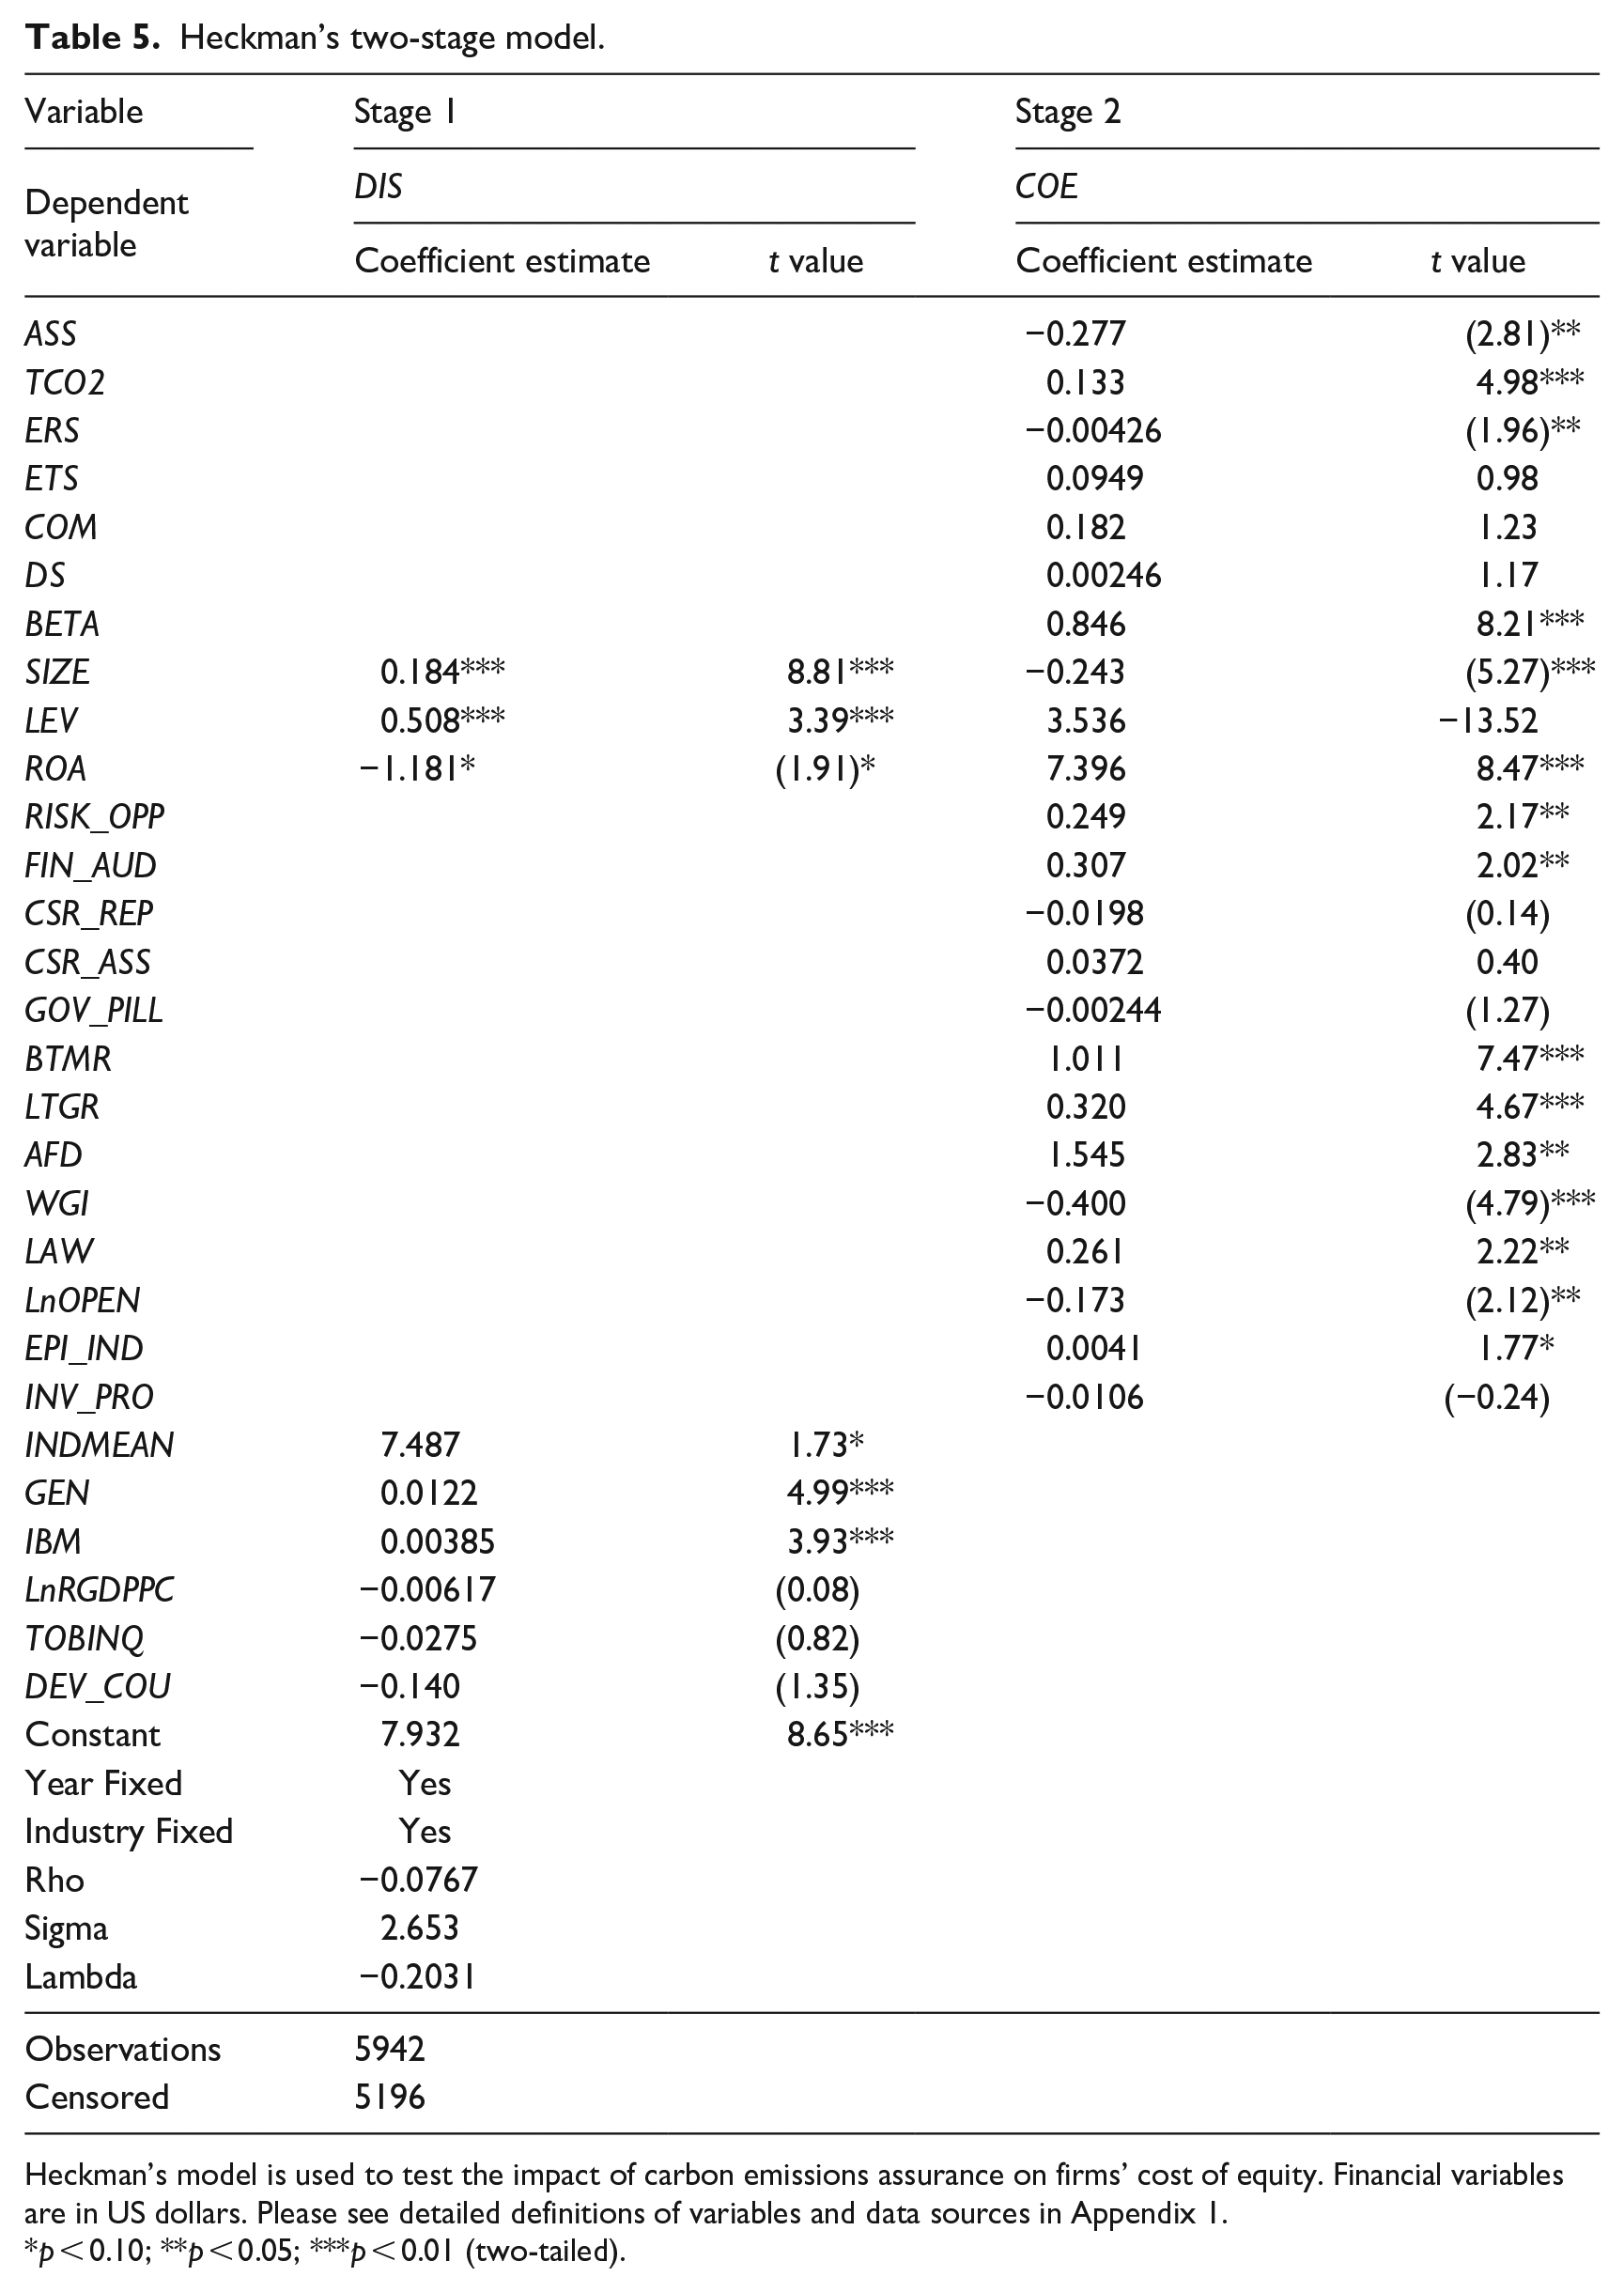
Heckman’s model is used to test the impact of carbon emissions assurance on firms’ cost of equity. Financial variables are in US dollars. Please see detailed definitions of variables and data sources in Appendix 1.
p < 0.10; **p < 0.05; ***p < 0.01 (two-tailed).
5.3.2. Other robustness tests
We conduct a range of other robustness tests to further check the sensitivity of our baseline results, including tests with an alternative measure of cost of equity, a lead–lag analysis, tests addressing the uneven sample distribution, and an alternative model specification.
First, we follow Dhaliwal et al. (2011) and use the average of the three COE measures—those proposed by Easton (2004), Gebhardt et al. (2001), and Claus and Thomas (2001). The results (unshown) remain similar. Larcker and Rusticus (2010) suggest that averaging across the three estimates potentially reduces noise compared to using the individual methods.
Second, to alleviate potential endogeneity arising from reverse causality, we use a lead–lag model, in which we measure our independent variables at year t but measure the dependent variable COE at year t +1. The untabulated results suggest that our inferences are qualitatively unchanged. In addition, we conduct an analysis based on a propensity score–matched sample. The results (not reported) show that the coefficient of ASS is negative and significant, which indicates that our results are robust to the use of a propensity score–matched sample.
Third, as shown in Table 2, Panel A, the United States is home to the largest number of firms in our sample. Therefore, we exclude all US firms to prevent this uneven distribution of sample firms from biasing our results. In addition, we eliminate firms with fewer than 5 or 10 observations (Datt et al., 2020). Similarly, we exclude firms in the financial sector, which dominates our sample and has distinct regulatory environments (Datt et al., 2018). The results (unreported) remain qualitatively similar.
Fourth, we include country-fixed effects in our model, in conjunction with the existing control variables, and alongside fixed effects for year and industry. The results, while maintaining the significance of the ASS coefficient, reveal a diminished magnitude. Nonetheless, the direction of the effect (negative) aligns consistently with our baseline regression findings, thereby reinforcing the robustness of our results.
Fifth, we conducted a robustness test that is centered around the introduction of first-time carbon assurance as an alternative measure, drawing inspiration from the approach used by Casey and Grenier (2015). In this analysis, a dummy variable, ASS_FIR, is created, assigned a value of 1 for firm-year observations where a company initiates carbon assurance for the first time, and 0 otherwise. The results (untabulated) reveal a negative and significant coefficient for ASS_FIR, suggesting that firms engaging in carbon assurance for the first time tend to experience a reduction in their COE. This finding not only supports our primary analysis but also adds an additional layer of validation to our main inference.
Finally, we adopt a Gaussian mixture model as an alternative model specification. We continue to document the negative impact of carbon assurance on the cost of equity (results not shown), which shows that our results are robust to the use of an alternative model specification.
6. Cross-sectional analyses—testing H2–H5
In this section, we report the results of a range of cross-sectional tests examining whether corporate emissions reduction performance, participation in an ETS, and a country’s legal institutions and economic development have moderating effects on the relationship between voluntary carbon assurance and COE.
Columns (1) and (2) of Table 6, Panel A, present results for subsamples of firms with superior emissions reduction performance and firms with poor emissions reduction performance. We repeat our baseline model for these subsamples. We find that the coefficient of ASS is negative and significant in column (2), which suggests a negative association between carbon assurance and COE is only present in firms with poor emissions reduction performance. Firms with poor emissions reduction performance are in more urgent need of external carbon assurance to substantiate their carbon activities and performance. These companies can achieve a greater reduction in their COE if they voluntarily purchase costly carbon assurance. In contrast, firms with superior performance may already enjoy greater trust from investors, resulting in nonsignificant COE improvement for these companies, as shown in column (1).
Moderating effects.
Panel A: Firm-level moderators (testing H2 and H3).
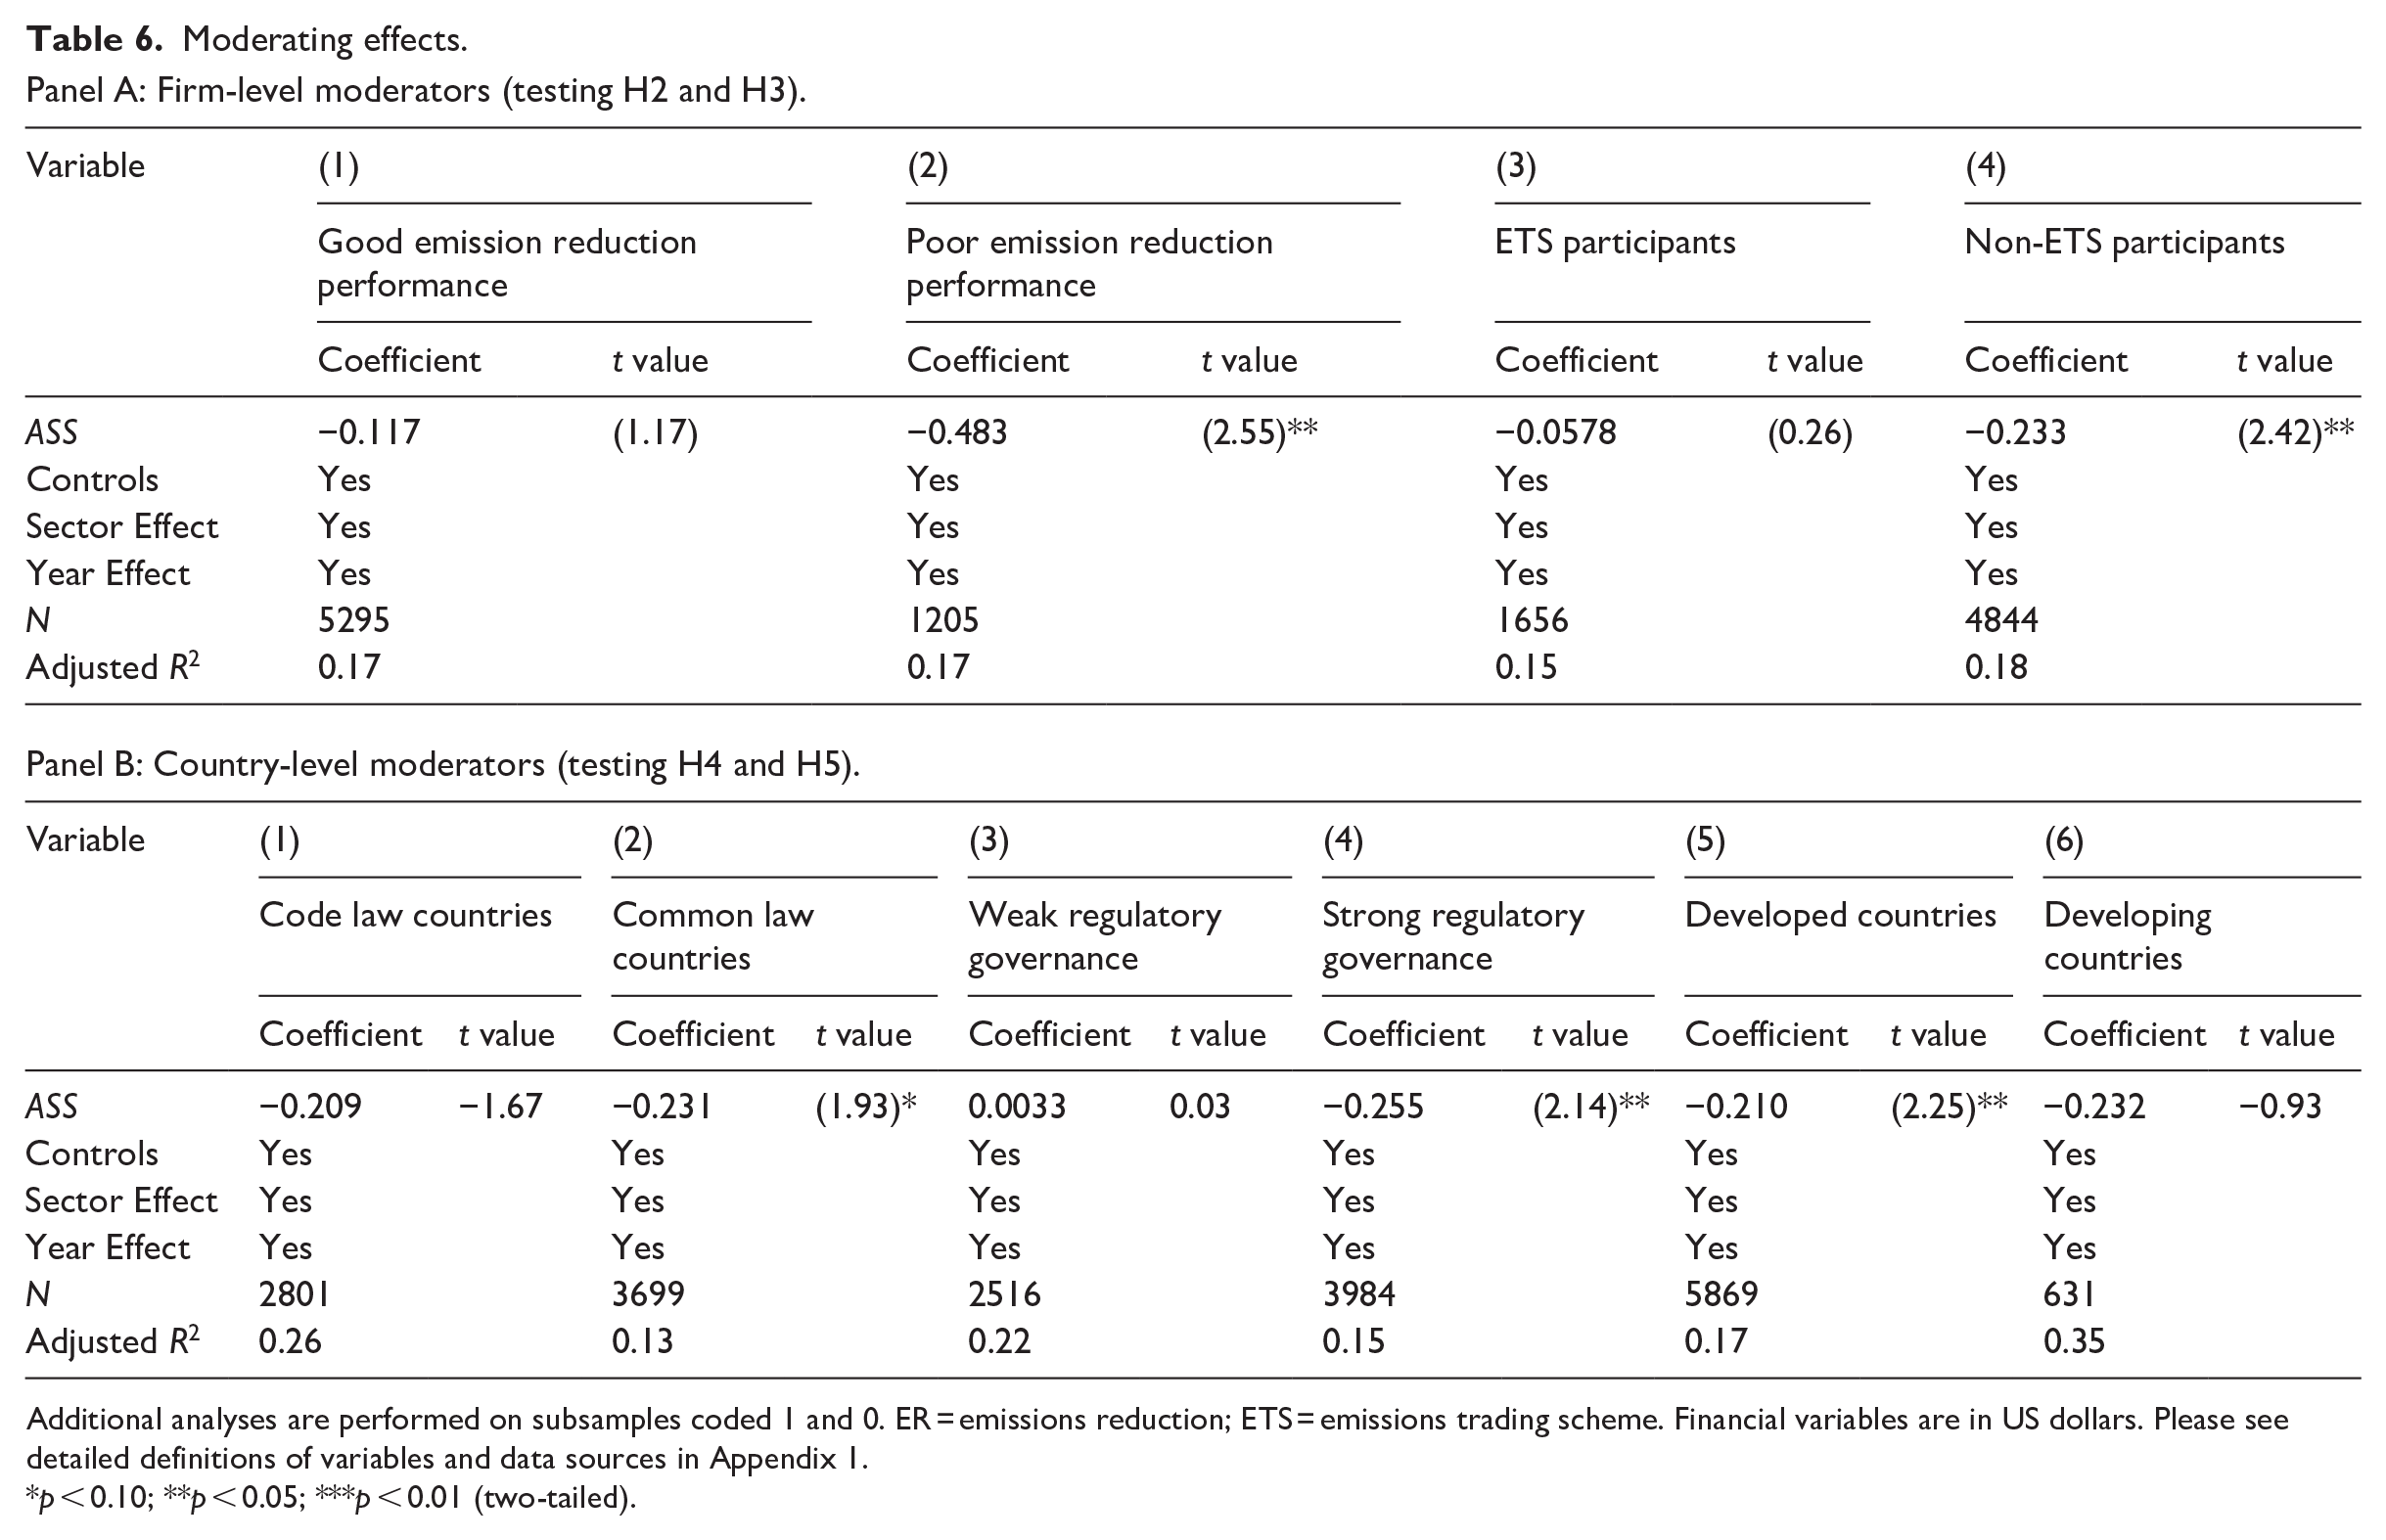
Additional analyses are performed on subsamples coded 1 and 0. ER = emissions reduction; ETS = emissions trading scheme. Financial variables are in US dollars. Please see detailed definitions of variables and data sources in Appendix 1.
p < 0.10; **p < 0.05; ***p < 0.01 (two-tailed).
To test Hypothesis 3, we partition the sample into firms that participate in an ETS and those that do not. Data on firms’ participation in an ETS are obtained from the Refinitiv ESG database. Then, we estimate regressions separately for the two subsamples. The results are presented in columns (3) and (4) of Table 6, Panel A. The coefficient of ASS is negative and significant only in the subgroup of non-ETS participants (coefficient = –0.0578 in column (3) p > 0.1; coefficient = –0.233, in column (4) p < 0.05), which is consistent with Hypothesis 3.
To test Hypothesis 4, we use two proxies for a country’s legal institutions: the legal system and legal enforcement. We partition the sample into firms from countries with strong legal institutions (common law countries, countries with strong regulatory governance) and those from countries with weak legal institutions (civil law countries, countries with weak regulatory governance). The worldwide governance index (WGI), which represents the strength of a country’s regulatory governance, is the average value of six indicators: voice and accountability, political stability and absence of violence, government effectiveness, regulatory quality, rule of law, and control of corruption (Kaufmann et al., 2010). The data are sourced from the World Bank. Then, we estimate regressions separately for the two subsamples. The results are presented in columns (1)–(4) of Table 6, Panel B. In columns (2) and (4), the coefficient of ASS is negative and significant (coefficient = –0.231 in column (2) p < 0.10; coefficient = –0.255 in column (4) p < 0.05), which suggests a negative relationship between carbon assurance and COE in common law countries and in countries with strong law enforcement, which is consistent with Hypothesis 4.
To test Hypothesis 5, we divide the sample into firms from developed countries and those from developing countries. In our study, developed countries are those identified as high-income economies by the World Bank, characterized by a substantially higher gross national income (GNI) per capita. This higher income level typically corresponds to more advanced economic status, including higher standards of living, better infrastructure, and greater industrialization. Conversely, developing countries are classified as middle- or low-income economies. These countries, with their relatively lower GNI per capita, are at various stages of economic development and often face distinct social, industrial, and infrastructural challenges. We then estimate regressions separately for the two subsamples based on Equation (1). Columns (5) and (6) of Table 6, Panel B, present results for the moderating impact of economic development on the relationship between carbon assurance and COE. Consistent with Hypothesis 6, the coefficient of ASS is negative and significant only in column (5), which suggests that assured firms in developed countries see a significantly greater reduction in their COE, while those in developing countries do not.
7. Further analyses
7.1. Characteristics of carbon assurance
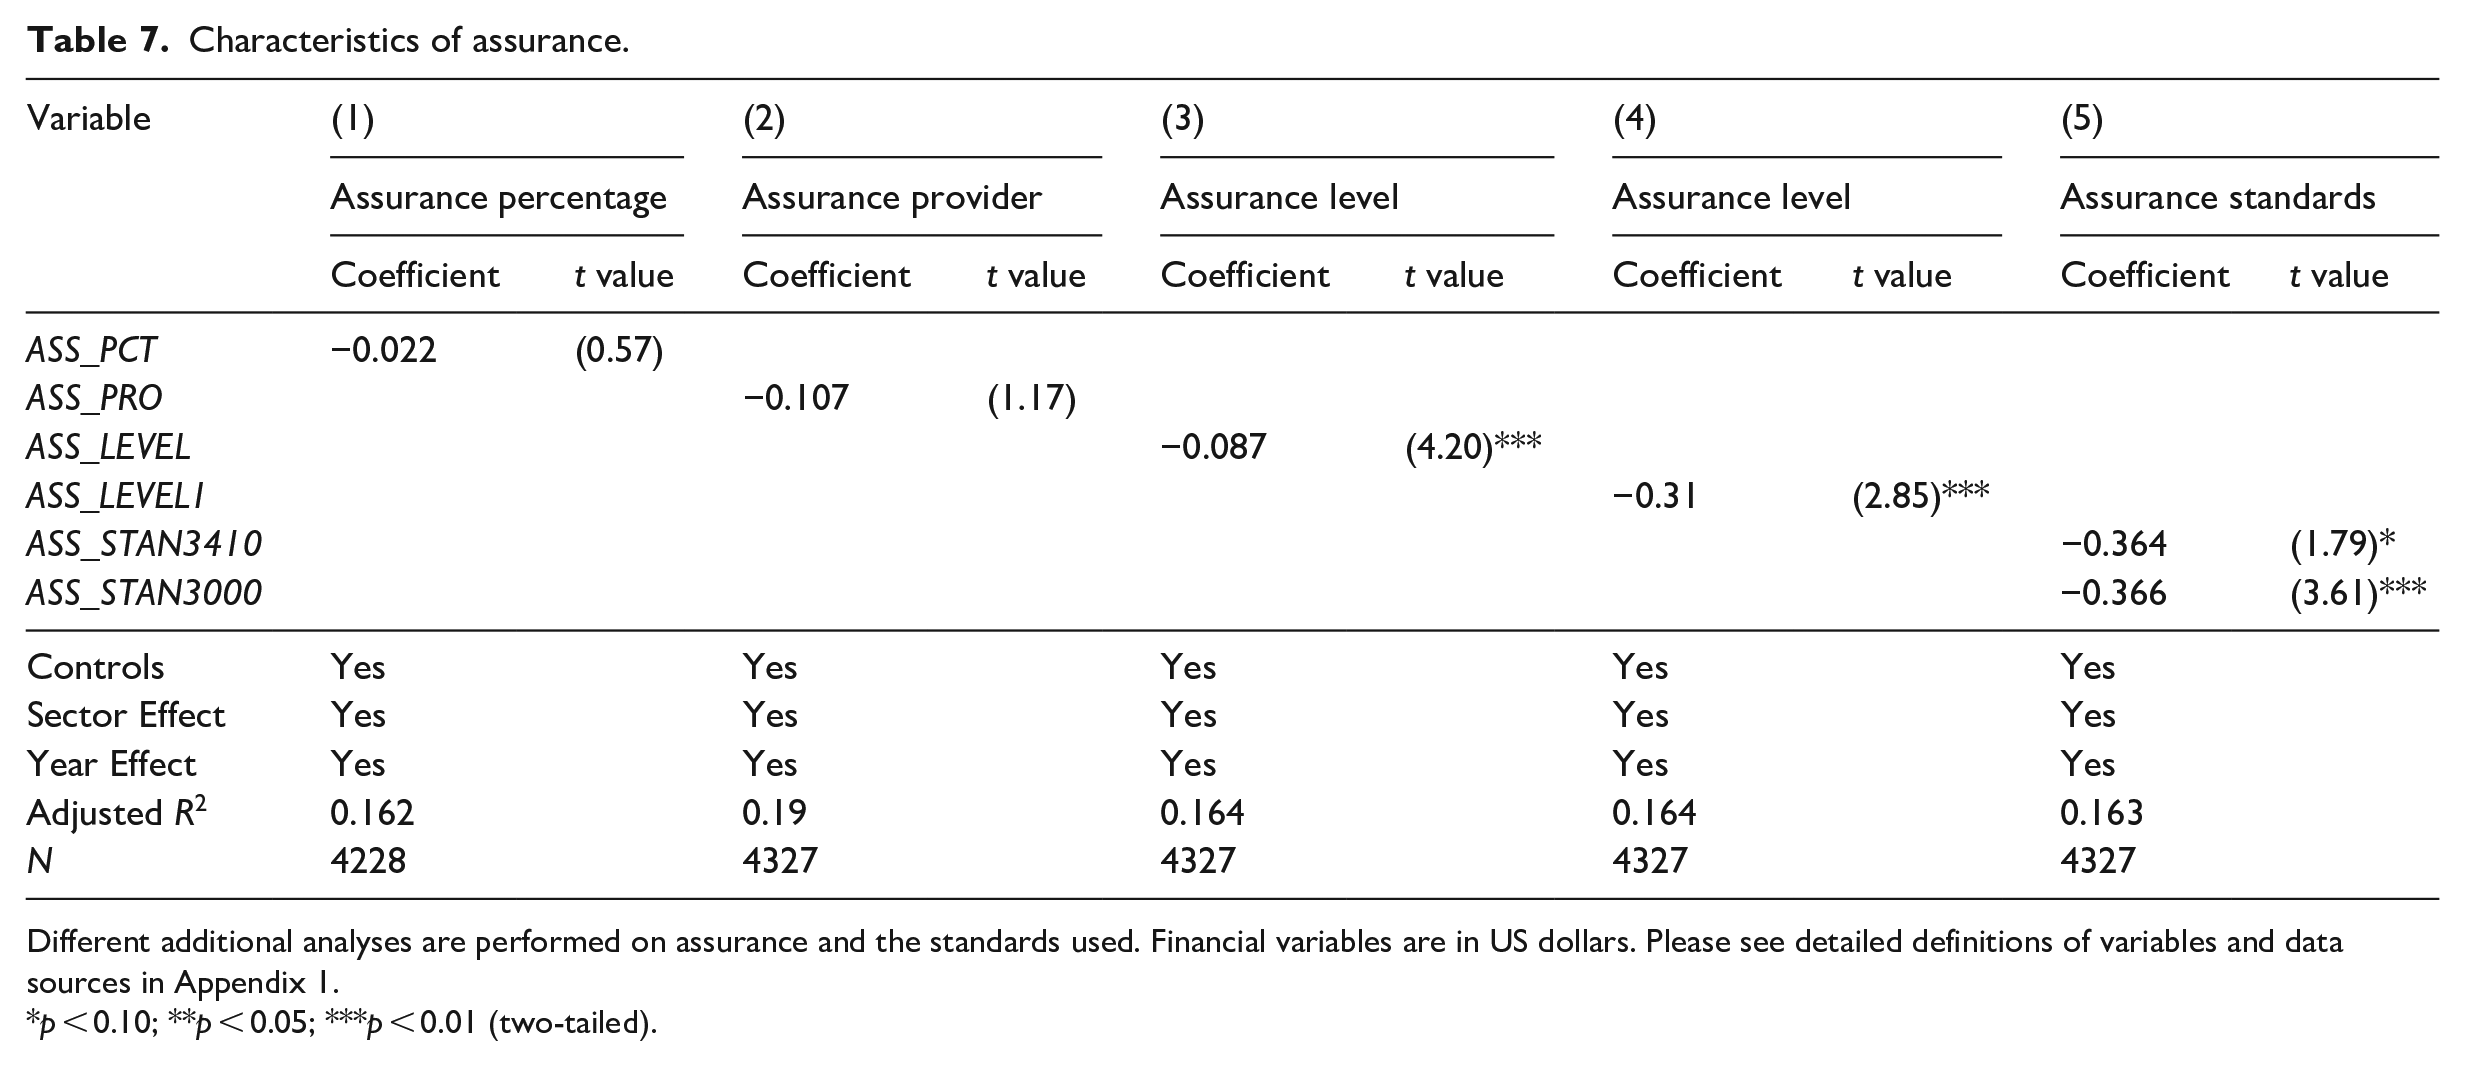
In this section, we consider how different characteristics of assurance—the percentage of reported emissions assured, the type of assurance provider, the level of assurance, and the assurance standards adopted—affect COE.
7.1.1. Percentage of emissions covered by the external assurance
First, the coverage of emissions by external assurance can significantly influence investors’ confidence in a company’s carbon disclosures. Higher coverage percentages can signal to investors that a company is thorough and transparent about its climate change impact. This transparency can reduce the perceived climate risk, potentially leading to a lower COE. To test this proposition, we follow Bui et al. (2021) and utilize an index-based measure to quantify the percentage of reported emissions that are assured. This index is calculated separately for Scope 1 and Scope 2 emissions assurance, and the averages are then computed, resulting in an overall percentage (ASS_PCT). 9 We anticipate that a higher percentage of reported emissions being assured will correlate with a lower COE.
We replace the variable ASS as specified in Equation (1) with ASS_PCT and rerun our analysis based on a subsample of assured firms. The results reported in column (1) of Table 7 show that the coefficient of ASS_PCT is negative and nonsignificant. For stakeholders, particularly investors and policymakers, this result could indicate that, as of the data period analyzed, the capital market does not significantly reward firms for assuring a larger proportion of their emissions. This might reflect a current lack of awareness or valuation of this aspect of practices in the carbon assurance statements.
Characteristics of assurance.
Different additional analyses are performed on assurance and the standards used. Financial variables are in US dollars. Please see detailed definitions of variables and data sources in Appendix 1.
p < 0.10; **p < 0.05; ***p < 0.01 (two-tailed).
7.1.2. The choice of assurance provider
Second, we aim to shed light on whether and how the choice of assurance provider influences stakeholders’ perceptions and the company’s COE. To explore this, we introduce a new variable, ASS_PRO, a binary measure indicating the type of carbon assurance provider. ASS_PRO is set to 1 when a company engages an accounting firm for its carbon assurance needs, and 0 otherwise (Datt et al., 2020). 10
We replace the variable ASS as specified in Equation (1) with the assurance provider variable (ASS_PRO) and rerun our analysis based on a subsample of assured firms. The results, reported in column (2) of Table 7, show that the coefficient of ASS_PRO is not significant, which suggests that COE does not differ significantly between firms that use an accounting firm and firms that use a consulting firm as their assurance provider. It might be that both accounting and consulting firms provide similarly effective assurance services in the eyes of investors and creditors during our sample period, thus not affecting the firms’ perceived risk and consequently their COE.
7.1.3. The level of assurance
Third, we explore whether the level of assurance provided on a company’s carbon disclosures can significantly influence investor confidence and perceptions of risk. Reasonable assurance, being a higher level of scrutiny, might signal to investors and creditors that the company’s reported information is more reliable. This can reduce perceived risks associated with the company, potentially leading to a lower COE. To measure the level of assurance (ASS_LEVEL), we use a numerical coding system based on the CDP framework’s categories for assurance levels of reported scope 1 and scope 2 emissions: high, reasonable, moderate, and limited assurance. Each level is assigned a value: 4 for high, 3 for reasonable, 2 for moderate, 1 for limited, and 0 when assurance is not provided or applicable. The index is calculated separately for scope 1 and scope 2 emissions and then combined, giving an overall ASS_LEVEL for each company ranging from 0 to 8, integrating the various assurance levels into a single score (Bui et al., 2021; Luo et al., 2023). Alternatively, we classify carbon assurance into two broad categories: higher assurance (reasonable and high) and lower assurance (moderate and limited). For this, ASS_LEVEL1 is a binary variable, set to 1 for companies achieving either reasonable or high assurance for both emission scopes, and 0 otherwise. This distinction helps identify companies meeting a higher standard of assurance in their carbon reporting.
We replace the variable ASS as specified in Equation (1) with the assurance-level variables (ASS_LEVEL and ASS_LEVEL1) and rerun our analysis based on a subsample of assured firms. The results are shown in columns (3) and (4) of Table 7. The coefficients of ASS_LEVEL and ASS_LEVEL1 are significant, which suggests that the level of assurance a firm obtains on its emissions reporting can be an important factor influencing its financial costs. This might reflect the market’s perception of risk, credibility, and sustainability commitment associated with higher levels of assurance.
7.1.4. The adoption of specific assurance standards
Fourth, given the rising significance of standardized assurance practices in CSR and carbon reporting, we focus on ISAE 3000 and ISAE 3410. These standards are globally recognized for assuring non-financial and environmental information. ISAE 3000 is for assurance engagements beyond historical financial audits or reviews, while ISAE 3410 is specific to GHG statements. Adhering to these standards marks high-quality, credible carbon reporting. We assess companies’ compliance with these standards through two dummy variables: ASS_STAN3410 (1 if a company’s carbon assurance complies with ISAE 3410, 0 otherwise) and ASS_STAN3000 (1 if compliance is with ISAE 3000, 0 otherwise), with data sourced from the CDP database. The variable definitions for the assurance characteristics are summarized in Appendix 2.
Replacing the ASS variable in Equation (1) with ASS_STAN3410 and ASS_STAN3000, we reanalyze a subsample of assured firms, adding each variable separately in the analysis (shown in Table 7, column (5)). Both variables are significant, indicating the importance of these assurance standards in influencing market perceptions of a firm’s carbon reporting credibility and thoroughness. This suggests that adherence to high-quality standards not only enhances transparency and trustworthiness but may also impact investors’ confidence and firm valuation.
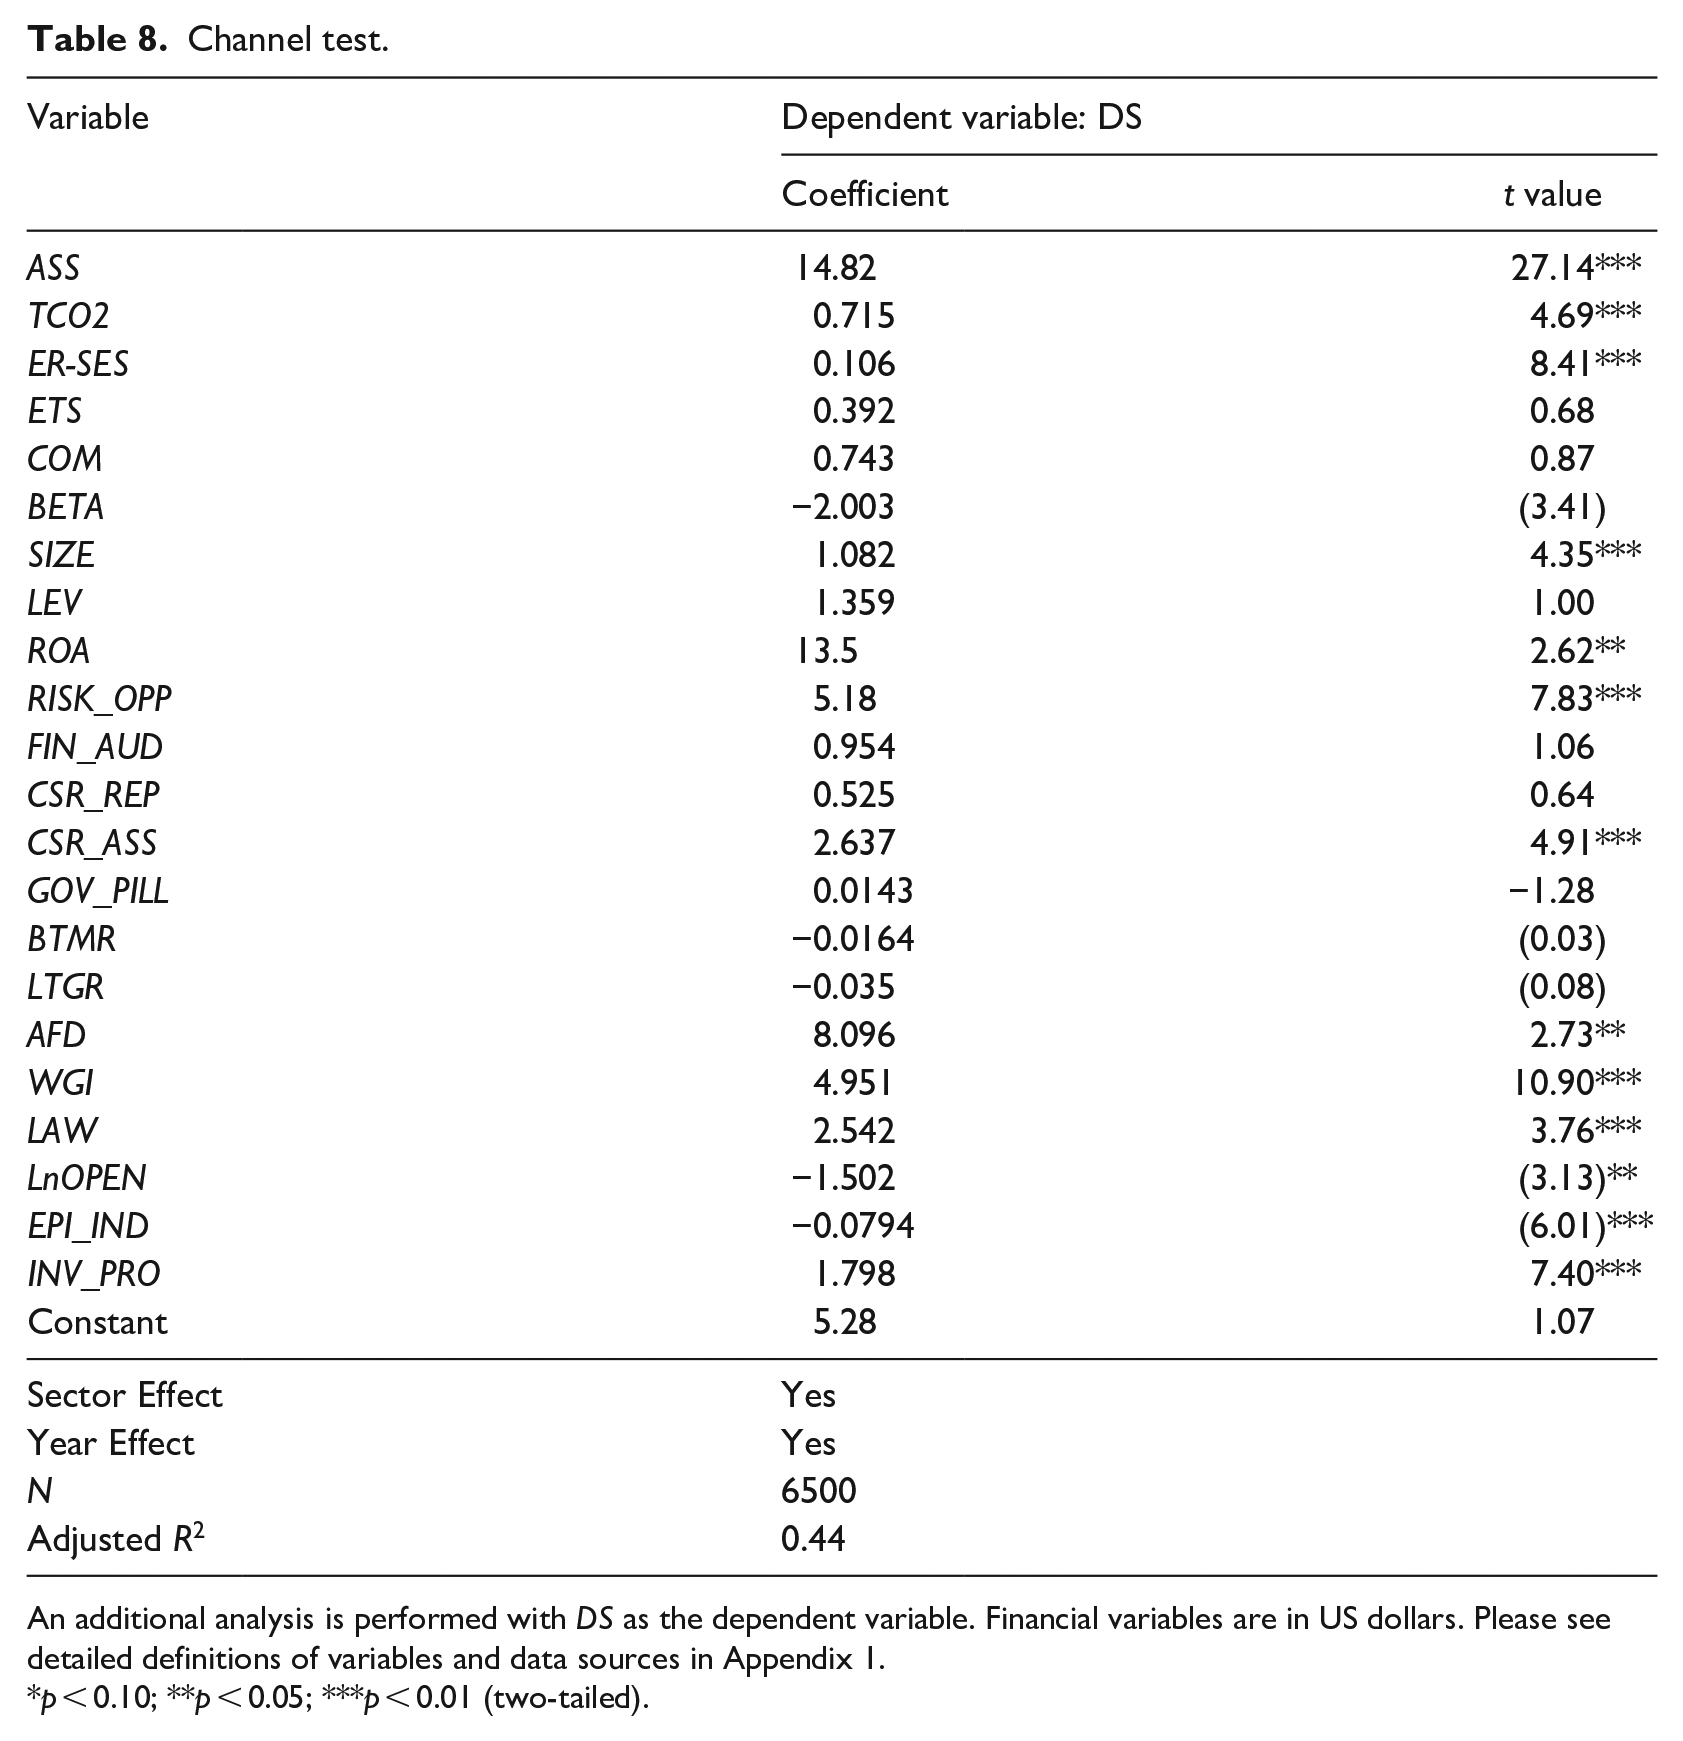
7.2. Channel test
We next explore a potential channel through which firms’ carbon assurance can affect the COE: improvements in carbon disclosure. To validate this channel, we test whether firms with carbon assurance tend to have greater carbon disclosure.
Table 8 presents the regression results where the dependent variable is carbon disclosure (DS). Note that the variable DS is initially defined as a control variable in our baseline regression model, but in this analysis, it assumes the role of the dependent variable. Consequently, we regress DS against the independent variable ASS, employing the same set of control variables used in Equation (1), with the exception of DS itself. This adjustment ensures that DS is now the primary focus of the analysis, allowing us to investigate its relationship with ASS while controlling for other factors. The coefficient of ASS is positive and significant at the conventional level, which suggests that assured firms tend to have more carbon disclosure (Luo et al., 2023). These results indicate that firms with carbon assurance exhibit a capacity for improved carbon transparency, which lowers information asymmetry and the COE (Bui et al., 2020; Jiang et al., 2021; Schiemann and Sakhel, 2019).
Channel test.
An additional analysis is performed with DS as the dependent variable. Financial variables are in US dollars. Please see detailed definitions of variables and data sources in Appendix 1.
p < 0.10; **p < 0.05; ***p < 0.01 (two-tailed).
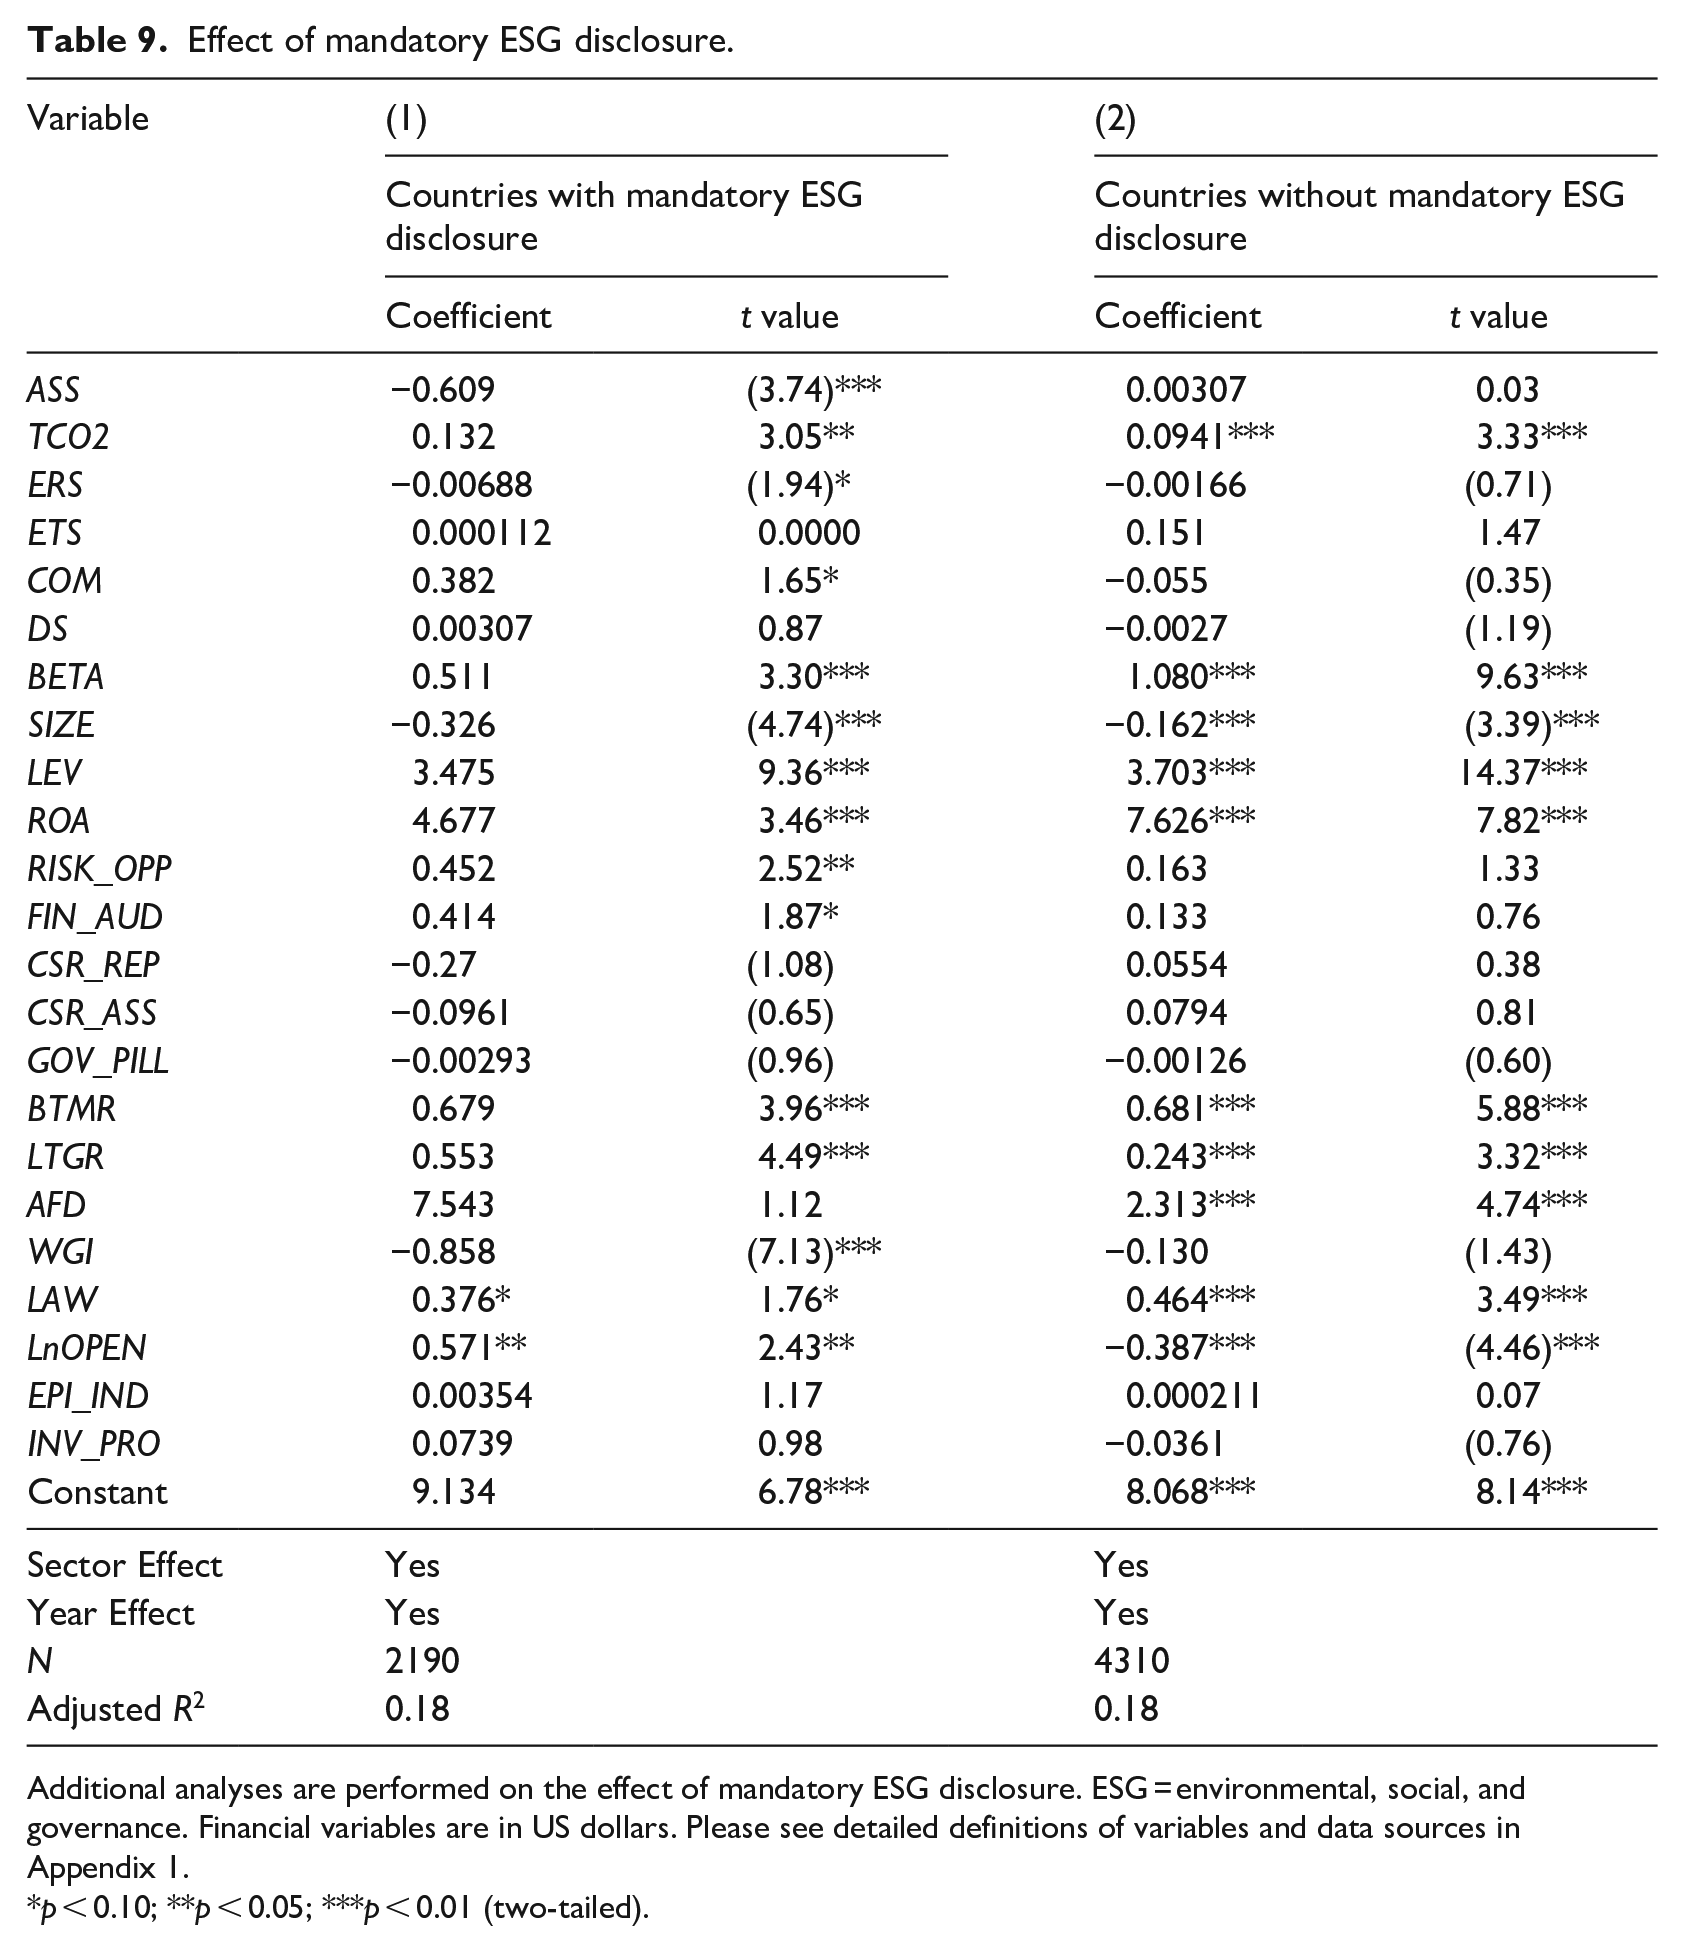
7.3. Moderating effects of mandatory ESG reporting
Finally, we examine whether the impact of carbon assurance on COE varies between voluntary and mandatory ESG reporting regimes. Research shows that mandatory ESG disclosure leads to reduced carbon emissions, and improved environmental reporting and investor-driven changes (Christensen et al., 2021; Downar et al., 2021; Ioannou and Serafeim, 2017; Yang et al., 2021). Carbon assurance is expected to lend more credibility to firms’ carbon performance, potentially lowering their COE.
Our sample is split into countries with and without mandatory ESG disclosure, defined as mandate and non-mandate countries respectively (Krueger et al., 2023). We then separately estimate Equation (1) for each group. The regression results in Table 9 reveal a negative and significant association between carbon assurance and COE only in mandated countries (coefficient = –0.609, p < 0.01). In non-mandate countries, this association is not significant (coefficient = 0.003, p > 0.1). Voluntary carbon assurance in mandated countries often involves higher quality disclosures, providing investors with more reliable and detailed information regarding a firm’s carbon footprint and mitigation efforts. Better information reduces uncertainty, which is a critical factor in determining COE.
Effect of mandatory ESG disclosure.
Additional analyses are performed on the effect of mandatory ESG disclosure. ESG = environmental, social, and governance. Financial variables are in US dollars. Please see detailed definitions of variables and data sources in Appendix 1.
p < 0.10; **p < 0.05; ***p < 0.01 (two-tailed).
8. Conclusions
Using a global sample, we examine the impact of voluntary carbon assurance on a firm’s COE. After accounting for various potential confounding variables, we find that the adoption of voluntary carbon assurance is significantly negatively associated with the cost of equity. Further tests reveal that firms with poor emissions reduction records and those not participating in ETS tend to experience a more substantial decrease in COE. Moreover, we find that a country’s legal institutions and level of economic development significantly influence how investors perceive the effectiveness of carbon assurance.
These findings have various implications for policymakers, managers, board directors, and practitioners. Our findings show that carbon assurance practices impact the information environment, which implies that uniform GHG assurance standards as well as the integration of financial reporting and carbon reporting are beneficial to investors. Our research findings thus are of interest to regulators in countries that are considering mandating GHG assurance. However, we also find that these economic benefits are not homogeneous. Firms that have poor carbon emissions reduction performance and those non-ETS participants tend to reap more benefits. Managers of such companies are thus encouraged to provide more credible signals to capital market participants that they have proactively reduced carbon emissions by purchasing carbon assurance.
Although our research examining the relationship between carbon assurance and the COE provides valuable insights into the potential impact of carbon assurance on COE, there are several limitations to acknowledge. First, while our research unveils significant associations between variables, it is essential to exercise caution when drawing causal inferences due to the observational nature of our study design. This limitation underscores the need for further research, including experimental or longitudinal studies, to provide more robust evidence and explore causal mechanisms. Second, the study focuses on the largest public firms from each country in our sample, so caution should be exercised when generalizing our findings to small firms or to privately held firms. Third, the assurance adoption variable used in our analysis relies on self-reported data from the CDP database. As prior research suggests, there may be inconsistencies or nontrivial errors in this variable due to the inconsistent criteria used in responding to this question. Although we acknowledge this limitation, we believe that our findings provide valuable insights into the relationship between carbon assurance and COE. Nevertheless, future research could use alternative methods to validate the assurance adoption variable or utilize other sources of data to further investigate this relationship. Finally, the study only examines the association between carbon assurance and the COE, which focuses on the economic benefits of carbon assurance from shareholders’ perspective. Future research can consider economic consequences from the perspectives of other capital market participants, such as analysts and debtholders. These limitations should be considered when interpreting the findings of the study and when considering the broader implications of carbon assurance for firms’ financial decision-making.
Footnotes
Appendix 1
Appendix 2
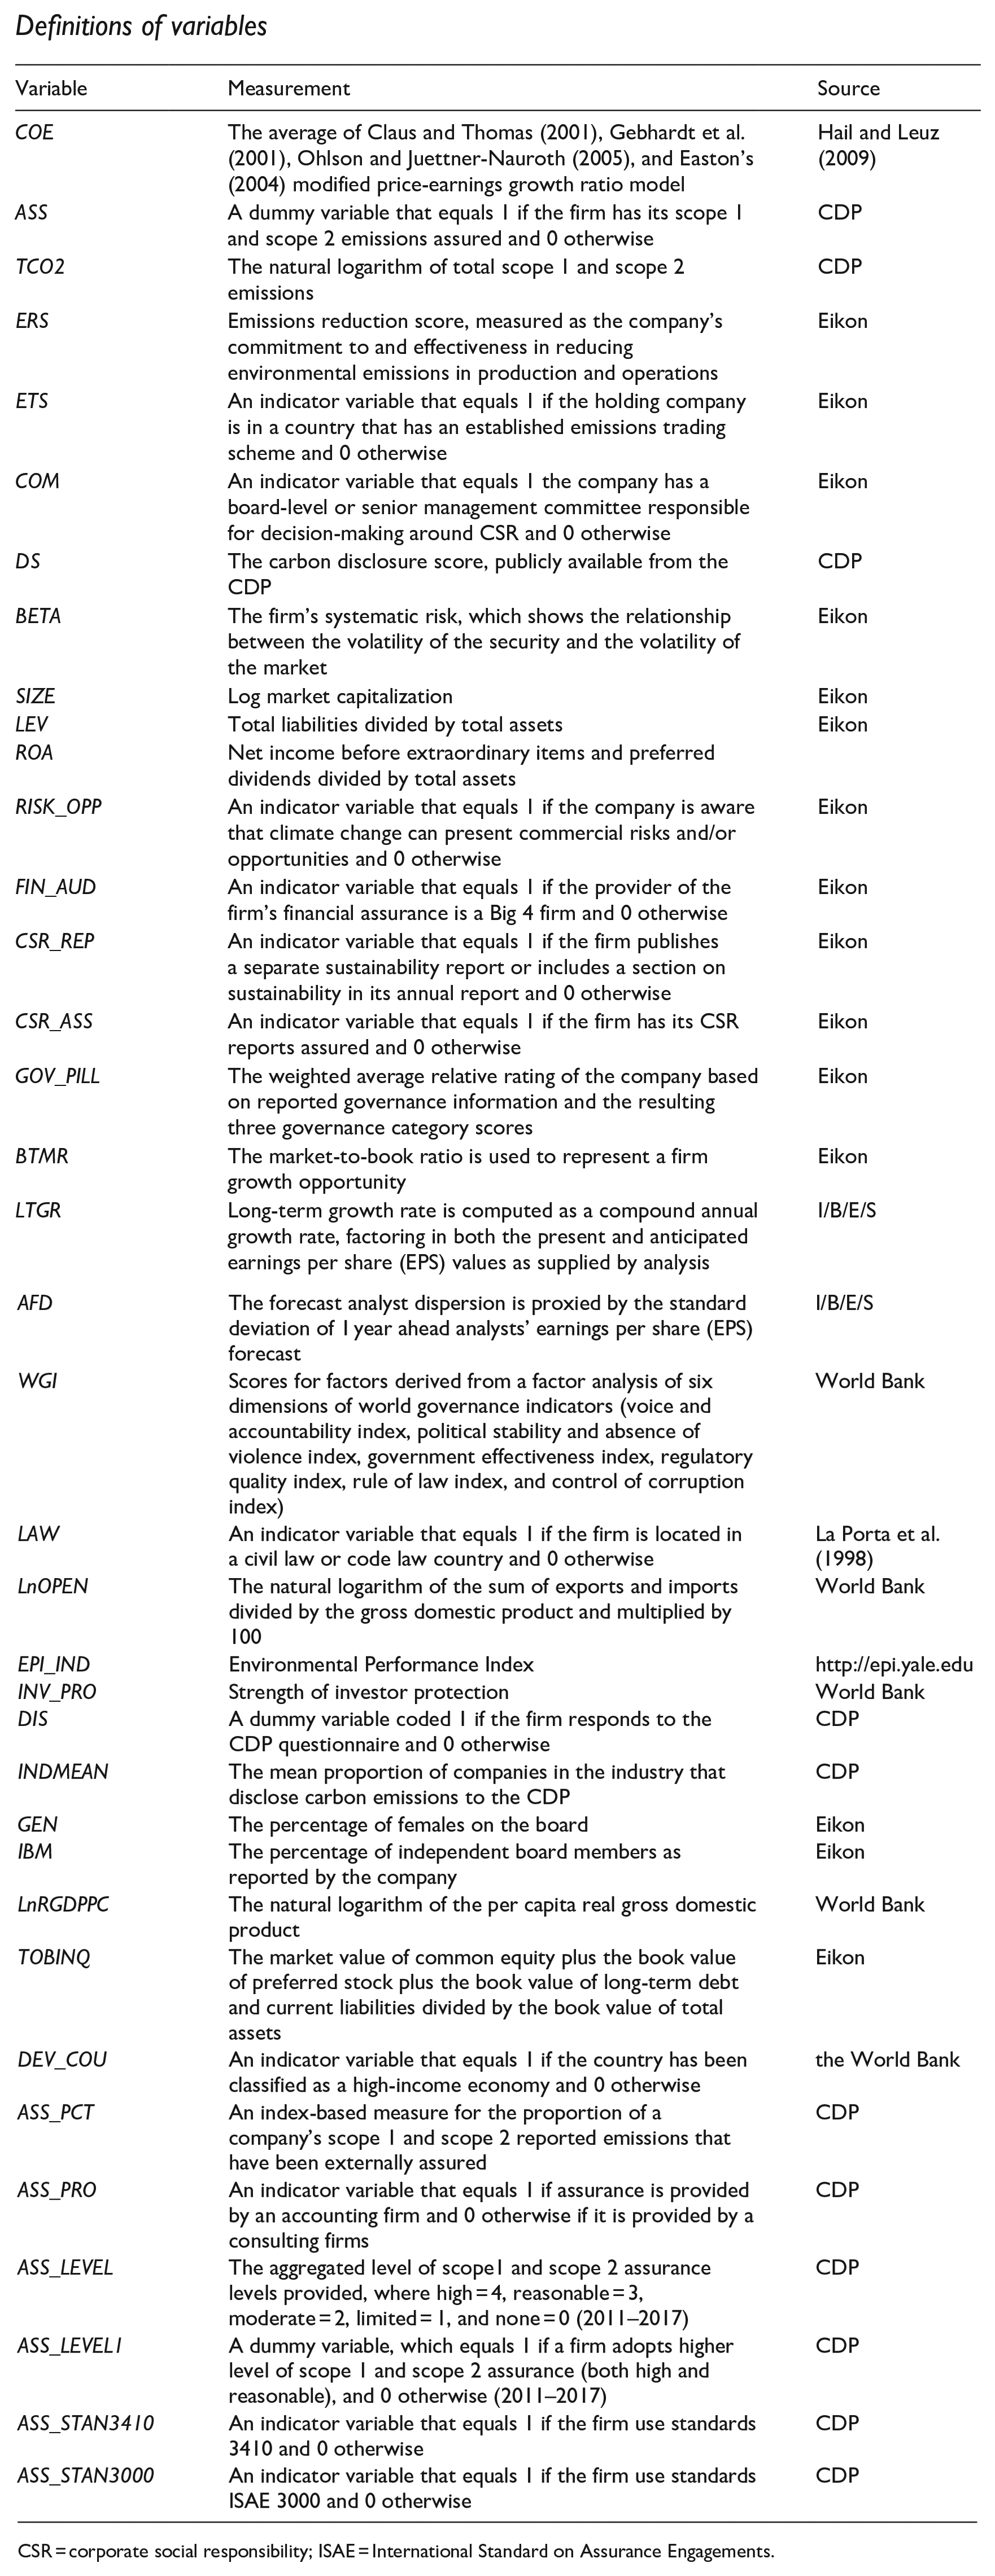
Definitions of variables
| Variable | Measurement | Source |
|---|---|---|
| COE | The average of Claus and Thomas (2001), Gebhardt et al. (2001), Ohlson and Juettner-Nauroth (2005), and Easton’s (2004) modified price-earnings growth ratio model | Hail and Leuz (2009) |
| ASS | A dummy variable that equals 1 if the firm has its scope 1 and scope 2 emissions assured and 0 otherwise | CDP |
| TCO2 | The natural logarithm of total scope 1 and scope 2 emissions | CDP |
| ERS | Emissions reduction score, measured as the company’s commitment to and effectiveness in reducing environmental emissions in production and operations | Eikon |
| ETS | An indicator variable that equals 1 if the holding company is in a country that has an established emissions trading scheme and 0 otherwise | Eikon |
| COM | An indicator variable that equals 1 the company has a board-level or senior management committee responsible for decision-making around CSR and 0 otherwise | Eikon |
| DS | The carbon disclosure score, publicly available from the CDP | CDP |
| BETA | The firm’s systematic risk, which shows the relationship between the volatility of the security and the volatility of the market | Eikon |
| SIZE | Log market capitalization | Eikon |
| LEV | Total liabilities divided by total assets | Eikon |
| ROA | Net income before extraordinary items and preferred dividends divided by total assets | |
| RISK_OPP | An indicator variable that equals 1 if the company is aware that climate change can present commercial risks and/or opportunities and 0 otherwise | Eikon |
| FIN_AUD | An indicator variable that equals 1 if the provider of the firm’s financial assurance is a Big 4 firm and 0 otherwise | Eikon |
| CSR_REP | An indicator variable that equals 1 if the firm publishes a separate sustainability report or includes a section on sustainability in its annual report and 0 otherwise | Eikon |
| CSR_ASS | An indicator variable that equals 1 if the firm has its CSR reports assured and 0 otherwise | Eikon |
| GOV_PILL | The weighted average relative rating of the company based on reported governance information and the resulting three governance category scores | Eikon |
| BTMR | The market-to-book ratio is used to represent a firm growth opportunity | Eikon |
| LTGR | Long-term growth rate is computed as a compound annual growth rate, factoring in both the present and anticipated earnings per share (EPS) values as supplied by analysis | I/B/E/S |
| AFD | The forecast analyst dispersion is proxied by the standard deviation of 1 year ahead analysts’ earnings per share (EPS) forecast | I/B/E/S |
| WGI | Scores for factors derived from a factor analysis of six dimensions of world governance indicators (voice and accountability index, political stability and absence of violence index, government effectiveness index, regulatory quality index, rule of law index, and control of corruption index) | World Bank |
| LAW | An indicator variable that equals 1 if the firm is located in a civil law or code law country and 0 otherwise | La Porta et al. (1998) |
| LnOPEN | The natural logarithm of the sum of exports and imports divided by the gross domestic product and multiplied by 100 | World Bank |
| EPI_IND | Environmental Performance Index | http://epi.yale.edu |
| INV_PRO | Strength of investor protection | World Bank |
| DIS | A dummy variable coded 1 if the firm responds to the CDP questionnaire and 0 otherwise | CDP |
| INDMEAN | The mean proportion of companies in the industry that disclose carbon emissions to the CDP | CDP |
| GEN | The percentage of females on the board | Eikon |
| IBM | The percentage of independent board members as reported by the company | Eikon |
| LnRGDPPC | The natural logarithm of the per capita real gross domestic product | World Bank |
| TOBINQ | The market value of common equity plus the book value of preferred stock plus the book value of long-term debt and current liabilities divided by the book value of total assets | Eikon |
| DEV_COU | An indicator variable that equals 1 if the country has been classified as a high-income economy and 0 otherwise | the World Bank |
| ASS_PCT | An index-based measure for the proportion of a company’s scope 1 and scope 2 reported emissions that have been externally assured | CDP |
| ASS_PRO | An indicator variable that equals 1 if assurance is provided by an accounting firm and 0 otherwise if it is provided by a consulting firms | CDP |
| ASS_LEVEL | The aggregated level of scope1 and scope 2 assurance levels provided, where high = 4, reasonable = 3, moderate = 2, limited = 1, and none = 0 (2011–2017) | CDP |
| ASS_LEVEL1 | A dummy variable, which equals 1 if a firm adopts higher level of scope 1 and scope 2 assurance (both high and reasonable), and 0 otherwise (2011–2017) | CDP |
| ASS_STAN3410 | An indicator variable that equals 1 if the firm use standards 3410 and 0 otherwise | CDP |
| ASS_STAN3000 | An indicator variable that equals 1 if the firm use standards ISAE 3000 and 0 otherwise | CDP |
CSR = corporate social responsibility; ISAE = International Standard on Assurance Engagements.
Appendix 3
Measurement of assurance characteristics
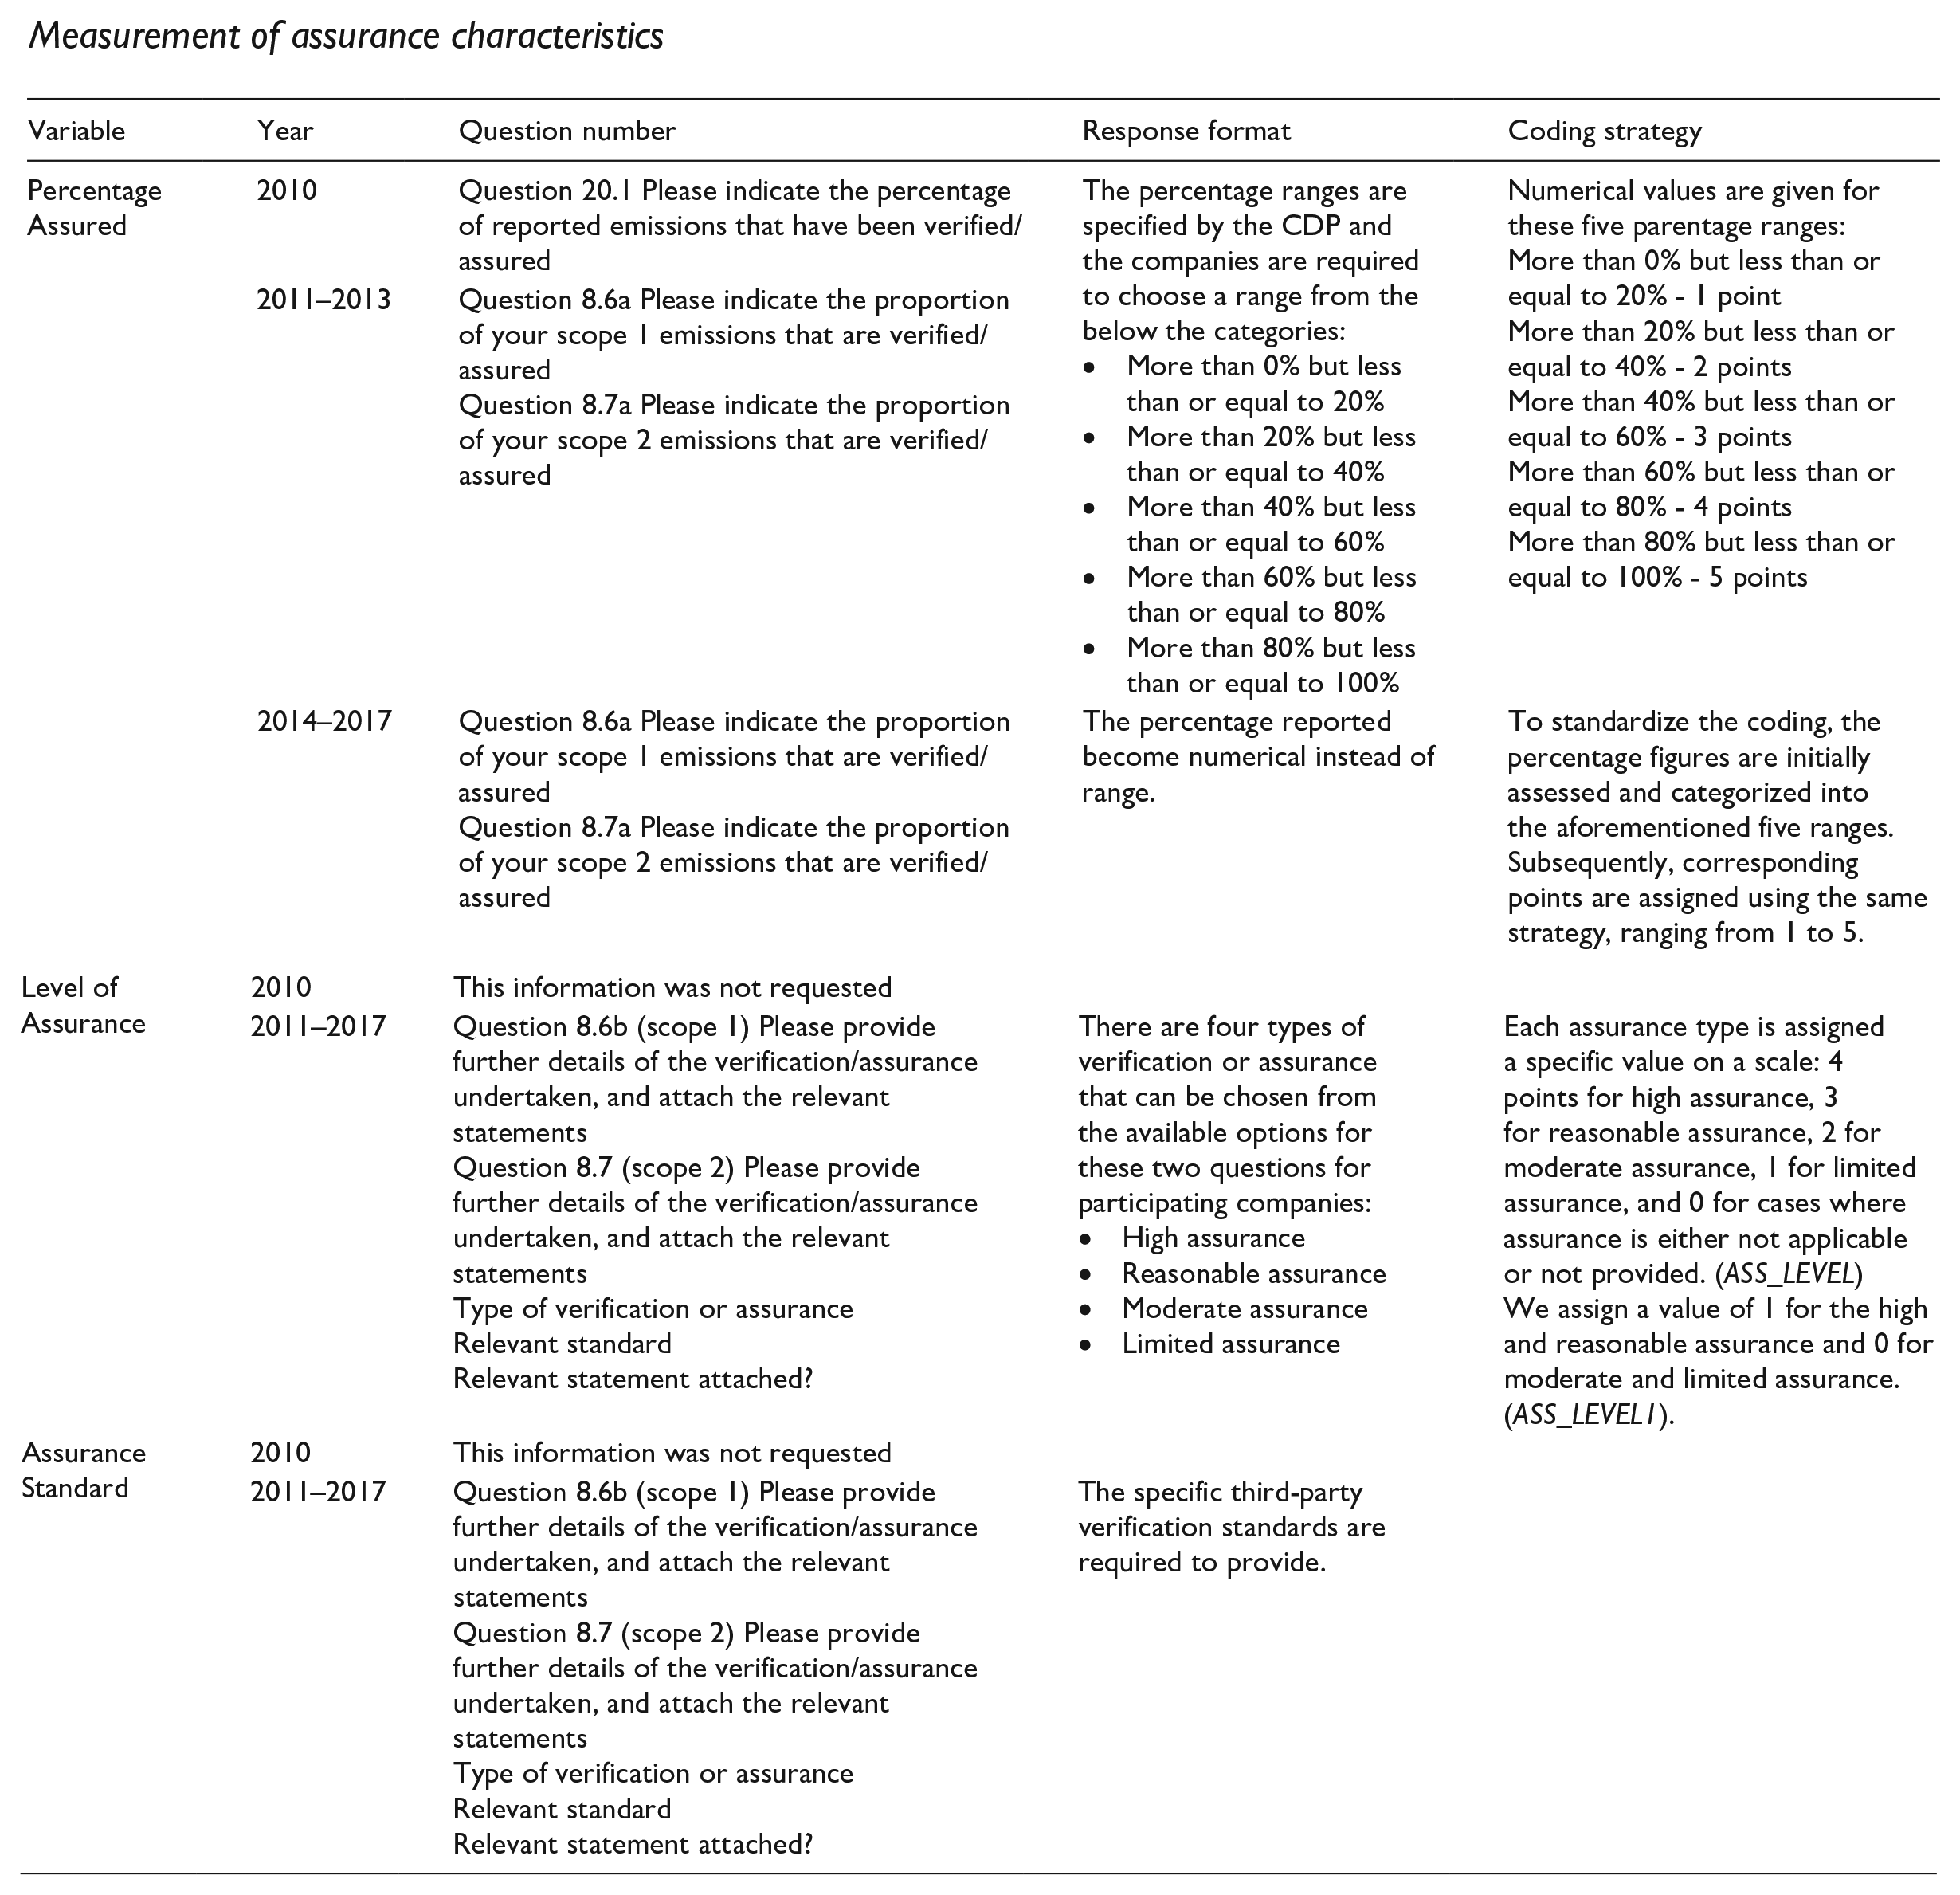
| Variable | Year | Question number | Response format | Coding strategy |
|---|---|---|---|---|
| Percentage Assured | 2010 | Question 20.1 Please indicate the percentage of reported emissions that have been verified/assured | The percentage ranges are specified by the CDP and the companies are required to choose a range from the below the categories: • More than 0% but less than or equal to 20% • More than 20% but less than or equal to 40% • More than 40% but less than or equal to 60% • More than 60% but less than or equal to 80% • More than 80% but less than or equal to 100% |
Numerical values are given for these five parentage ranges: More than 0% but less than or equal to 20% - 1 point More than 20% but less than or equal to 40% - 2 points More than 40% but less than or equal to 60% - 3 points More than 60% but less than or equal to 80% - 4 points More than 80% but less than or equal to 100% - 5 points |
| 2011–2013 | Question 8.6a Please indicate the proportion of your scope 1 emissions that are verified/assured Question 8.7a Please indicate the proportion of your scope 2 emissions that are verified/assured |
|||
| 2014–2017 | Question 8.6a Please indicate the proportion of your scope 1 emissions that are verified/assured Question 8.7a Please indicate the proportion of your scope 2 emissions that are verified/assured |
The percentage reported become numerical instead of range. | To standardize the coding, the percentage figures are initially assessed and categorized into the aforementioned five ranges. Subsequently, corresponding points are assigned using the same strategy, ranging from 1 to 5. | |
| Level of Assurance | 2010 | This information was not requested | ||
| 2011–2017 | Question 8.6b (scope 1) Please provide further details of the verification/assurance undertaken, and attach the relevant statements |
There are four types of verification or assurance that can be chosen from the available options for these two questions for participating companies: |
Each assurance type is assigned a specific value on a scale: 4 points for high assurance, 3 for reasonable assurance, 2 for moderate assurance, 1 for limited assurance, and 0 for cases where assurance is either not applicable or not provided. (ASS_LEVEL) |
|
| Assurance Standard | 2010 | This information was not requested | ||
| 2011–2017 | Question 8.6b (scope 1) Please provide further details of the verification/assurance undertaken, and attach the relevant statements |
The specific third-party verification standards are required to provide. |
Final transcript accepted 8 April 2024 by Mark Wilson (AE Accounting and Auditing).
Funding
The author(s) received no financial support for the research, authorship, and/or publication of this article.