
Abstract
Frailty assessment in patients admitted to intensive care is often limited using traditional clinical frailty assessment tools. Opportunistic use of contemporary computed tomography (CT) can provide an objective estimate of low skeletal muscle mass (sarcopenia) as a proxy for frailty. The aim of this study was to establish the prevalence of sarcopenia in an Australian intensive care unit (ICU) population and to examine the relationship between sarcopenia and clinical outcomes. We undertook a single centre retrospective study of 1085 adult patients admitted to a single ICU over 12 months. Patients with a contemporary CT scan including the L3 vertebral body were included. Patients were categorised as sarcopenic or non-sarcopenic using previously published data. A total of 279 patients with a mean age of 67 years had an eligible CT scan; 163 (58%) were male. Higher 30-day mortality was associated with the use of CRRT (continuous renal replacement therapy) during the ICU admission (OR 6.84, P < 0.001) and also associated with lower cross-sectional muscle area (odds ratio (OR) 0.98, P = 0.004). Sarcopenia was found to be highly prevalent in this particular Australian ICU population (68%) and associated with older age (68 versus 55 years, P < 0.001), lower body mass index (27 versus 32 kg m−2, P < 0.001), more comorbidities (3 versus 2, P = 0.009), and longer stays in hospital (279 versus 223 h, P = 0.043). As a continuous predictor, lumbar muscle mass was associated with 30-day mortality with and without adjusting for other covariates.
Keywords
Introduction
Patients admitted to the intensive care unit (ICU) with reduced physiologic reserve due to advanced age, reduced muscle mass, weakness and poor nutritional status are at increased risk for poor outcomes. 1 These factors contribute to frailty, a clinical syndrome defined as an age-related decline in physical, physiologic and cognitive function, increasing susceptibility to extrinsic stressors.1,2 Frailty is prevalent and associated with poor outcomes in medical and surgical patient populations.3–5
Frailty assessment tools are useful in predicting outcomes in hospitalised patients but are often limited in the clinical setting. This is particularly relevant to the ICU population, where severe illness often precludes functional assessment and necessitates reliance on family or other surrogates to complete the frailty assessment instrument. 6
Incorporating an objective surrogate marker, such as sarcopenia, into these frailty assessment tools could allow improved prognostication. Sarcopenia is a progressive general loss of muscle mass and impaired muscle function. 7 Previous studies have used diagnostic computed tomography (CT) of the abdomen to measure skeletal muscle cross sectional area and provide a CT-derived assessment of sarcopenia. This can be normalised for height to provide a skeletal muscle index (SMI) that is associated with in-hospital mortality, out-of-hospital mortality, ventilator-free days, ICU-free days and complications.8–14
Several studies have shown a close association between subjective frailty scoring systems (such as the Frailty Index) and CT-derived assessment of sarcopenia, supporting the use of existing CT data as part of a prognostic package for ICU admission.6,7,14,15 This could be of particular utility in the previously discussed circumstances where an accurate subjective score is not possible.
At present, there is no study examining the association between sarcopenia and outcomes in the Australian ICU population, and limited evidence from international centres. There have been conflicting results in the literature, which comes mostly from the European and American ICU population, with some studies showing a relationship between sarcopenia and poor outcomes and others failing to demonstrate any relationship.9–12,14,16–19 The majority of studies have targeted a specific patient group, such as the elderly, oncology, trauma or surgical patients.9–12,14,16–19
Our aim in this study was to establish the prevalence of sarcopenia in an Australian ICU setting and to examine the relationship between sarcopenia, mortality and morbidity in this population. We hypothesised that sarcopenia would be highly prevalent and associated with poor clinical outcomes.
Methods
Study design
We conducted a single-centre retrospective cohort study at a regional ICU that admits over 1000 patients a year. This project was undertaken following the Strengthening the Reporting of Observational studies in Epidemiology (STROBE) guidelines for observational studies. Ethics was approved as a low, negligible risk project with the Metro North Human Research Ethics Committee (HREA53797).
Study population
All participants over the age of 18 years admitted to the ICU over the 12-month period between 3 February 2018 and 3 February 2019 were analysed for the presence of an eligible CT scan including the L3 vertebral level. The local picture archiving and communication system (PACS) was examined for the presence of a CT scan including the L3 level performed between seven days prior to and one day after ICU admission. Participants were excluded if they had a medical condition significantly limiting mobility (such as a spinal cord injury), were less than 18 years of age or if the CT was non-diagnostic. CT scans in eligible patients were reviewed for adequacy. Non-diagnostic scans (due to significant movement artefact, incomplete field of view or beam hardening artefact from metallic hardware) were excluded, as were patients with retroperitoneal or abdominal wall haemorrhage. The primary outcome of interest was 30-day mortality, with the other endpoints defined as secondary outcomes. Power calculation for the study was based on an estimated 30-day mortality of 10%, with an estimated 15% 30-day mortality in the sarcopenic group. 12 For 80% power in a single proportion, one-sided study with alpha = 0.05, around 250 cases were required. The study screening, inclusion and exclusion flow chart is presented in Figure 1.
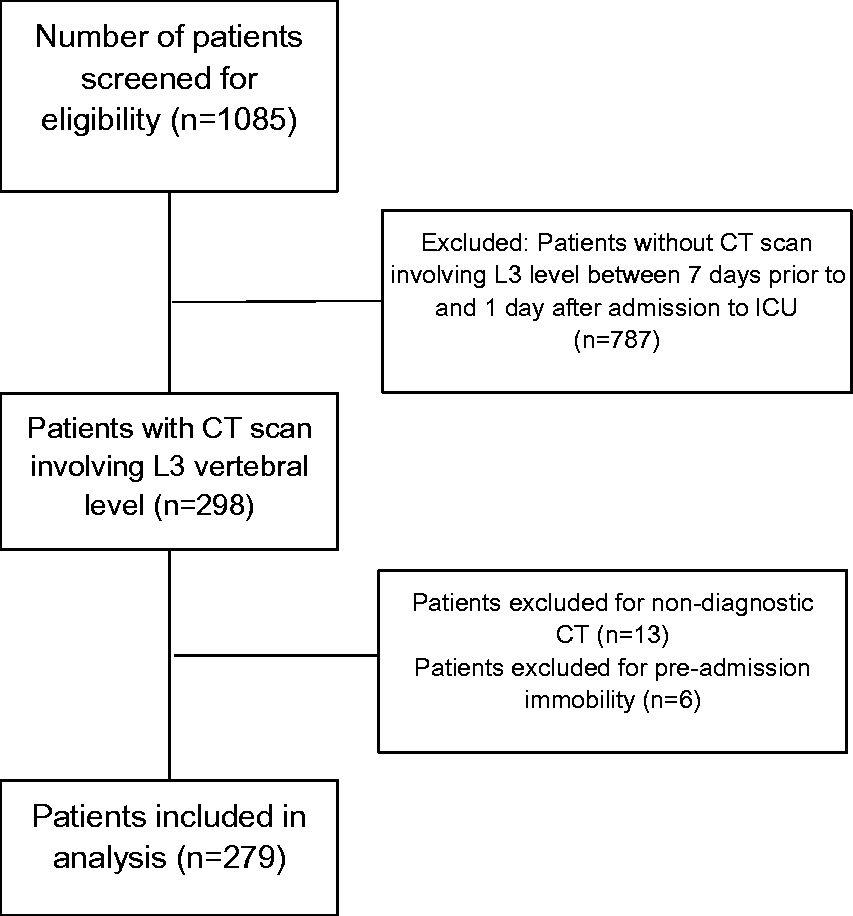
Study flow chart.
Data collection
Three sources of data were interrogated: MetaVision computer information system (CIS), The Viewer electronic record and the local PACS. Data retrieved for each patient included: age, sex, height, weight, ICU admission diagnosis (sepsis, respiratory failure, cardiovascular failure, neurological, metabolic, trauma, surgical, procedural, renal), ICU mortality, 30-day mortality, ICU length-of-stay (LOS), hospital LOS, ventilation status (ventilated with invasive positive pressure ventilation (IPPV), non-invasive ventilation (NIV) and not ventilated), continuous renal replacement therapy (CRRT) and discharge destination. Body mass index (BMI) was derived from the retrieved height and weight data (BMI = weight (kg)/height 2 (m2)). Discharge destination to assisted living was defined as being to a residential aged care facility (RACF) where the patient had been living at a domestic dwelling prior to admission.
Sarcopenia data
CT-derived assessment of skeletal muscle was performed at the level of the L3 vertebra. This level has been used widely in the literature due to its close association with whole body muscle mass.20–22 Cross sectional area of skeletal muscle at this level includes the erector spinae, quadratus lumborum, psoas, transversus abdominis, internal oblique, external oblique and rectus abdominis muscles.
A single axial slice of the L3 vertebral body, demonstrating trabecular bone and including the most superior aspect of the transverse processes, was selected and exported. Image analysis was performed using Osirix open-source medical imaging software (v6.0.2 32-bit version) with manual tracing of skeletal muscle in a semi-automated fashion by a final year radiology Fellow who was blinded to patient outcomes. Hounsfield Unit thresholds of –29 to +150 were applied to selectively identify skeletal muscle and exclude fatty infiltration. The software calculates skeletal muscle cross sectional area (cm2) by multiplying pixel area by the number of pixels identified as skeletal muscle. Sarcopenia was defined as skeletal muscle area (SMA) cut-off values of <110 cm2 for females and <170 cm2 for males based on a recent study of a heterogeneous population of critically ill adults as determined by receiver operating characteristic curve analysis. 12 Most of the literature examining sarcopenia in critically ill patients use the SMI, which is SMA normalised to height (cm2/m2) using cut-offs from an index paper examining sarcopenia in a population of non–critically ill oncology patients.9–11,19 Normalisation in this way is not applicable to the general critically ill population in intensive care largely because of the frequent inaccurate estimation of height recorded in the medical records.
Statistical analysis
Normality was checked using the Shapiro–Wilk test. Where data were continuous and normally distributed they are summarised using mean (standard deviation (SD)) and analysed using a standard two-tailed t test. Non-normal data were summarised as median (interquartile range (IQR)) and analysed using a Wilcoxon rank-sum test. Simple proportional data were summarised as number (%) and analysed using a χ2 contingency table. Categorical data were similarly summarised as number (%) and analysed using analysis of variance (ANOVA). Where appropriate, logistic regression was performed using 30-day mortality as the outcome variable. Collinearity was tested using a standard Pearson correlation test (R). Variables with a high R value (greater than ± 0.80) were considered collinear. Sarcopenia was tested as both a binary and continuous variable in separate models. Regression techniques were employed using an initially fully saturated model with subsequent stepwise deletion of non-significant predictors until the final iteration was reached. Sequential models were tested for difference from the saturated model using a likelihood ratio test. Predictor variables were age, sex, weight, muscle area (as a continuous variable) or presence of sarcopenia (as a binary variable), diagnostic category, number of comorbidities, type of ventilation, and use of CRRT. Variables with multiple categories (e.g., diagnosis and ventilation type) were analysed using indicator (dummy) variables. Where individual elements of the categorical variable were significant, they were reported, otherwise the level of significance is reported for the entire variable. Logistic regression diagnostics included computation of the area under the receiver operating characteristic curve and estimates of the goodness-of-fit of the model using both the Hosmer–Lemeshow test and the reported pseudo-R2. This data was tested for sensitivity/specificity optimisation for gender cut-off numbers using the values: SMI <110 cm2 for females and <170 cm2 for males. The cut-off numbers used worked appropriately for the data. We fitted constrained (restricted) cubic splines separately to the male/female data and then to the set as a whole. There was an increase in mortality around 100–120 cm2 for both males and females, though not statistically significant. No differences were significant for the group as a whole. Analysis was performed using Stata Statistical Software: Release 16 (College Station, TX, USA). The level of significance was set at P < 0.05.
Results
In total, 298 CT abdomen scans were available for analysis, of which 19 were excluded due to non-diagnostic quality or participant pre-admission immobility, leaving a sample size of 279. The study population represents 25.7% of the 1085 total admissions to the ICU over the study period. The mean time to CT scan was –1.3 days (SD = 0.8) where a negative number represents time preceding admission to ICU. Total ICU mortality rate for the cohort was 6.5%. Baseline characteristics and outcome data are presented in Table 1. Of the 279 patients analysed, 189 (68%) were sarcopenic and 90 (32%) were non-sarcopenic. The non-sarcopenic population were significantly younger with a higher BMI. There was an increase in hospital LOS associated with sarcopenia.
Patient characteristics and outcome for sarcopenic and non-sarcopenic patient groups.
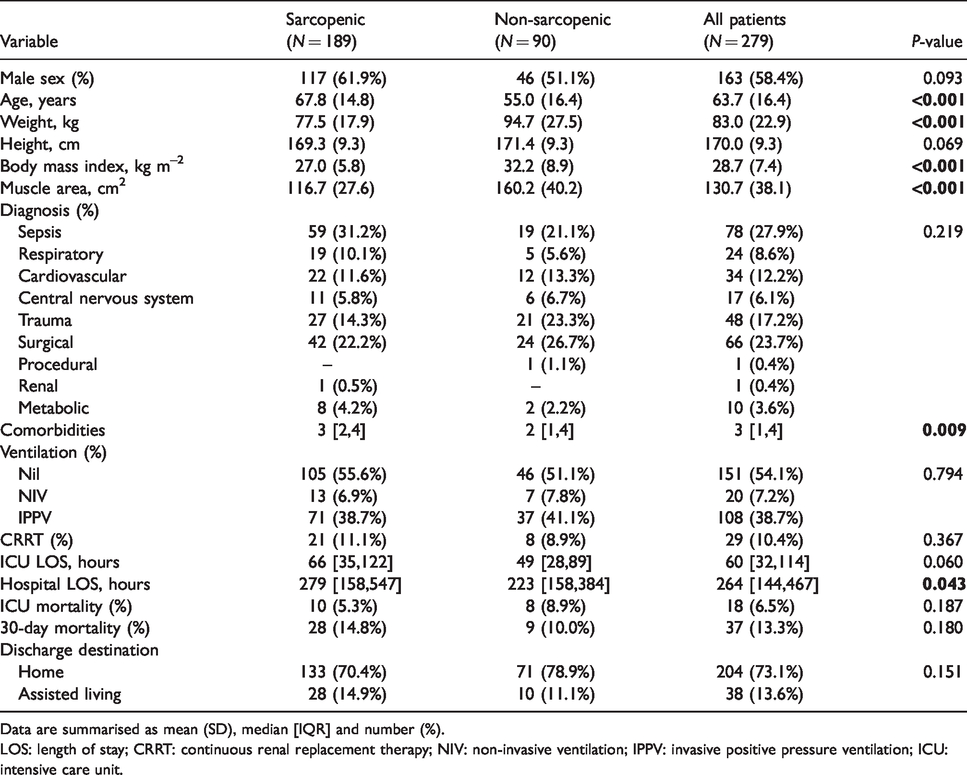
Data are summarised as mean (SD), median [IQR] and number (%).LOS: length of stay; CRRT: continuous renal replacement therapy; NIV: non-invasive ventilation; IPPV: invasive positive pressure ventilation; ICU: intensive care unit.
Sepsis (28%), surgical (24%) and trauma (17%) made up the majority of admissions. No significant differences were seen between sarcopenic and non-sarcopenic groups by admission diagnosis. The number of comorbidities ranged from 0 to 7: 0 = 27 (9.7%), 1 = 52 (18.6%), 2 = 53 (19%), 3 = 54 (19.4%), 4 = 40 (14.3%), 5 = 39 (14%), 6 = 13 (4.7%), 7 = 1 (0.4%). There were significantly more comorbidities seen in the sarcopenic group.
On logistic regression, 30-day (post discharge from hospital) mortality of patients admitted to ICU was significantly associated with the following predictors: treatment with CRRT during the ICU admission and CT-derived muscle area at the level of L3 (Table 2). Weight and BMI were highly correlated (R = +0.91) and, due to uncertainty around the estimation of height, weight was selected as the predictor variable. In general, higher 30-day mortality was associated with the use of CRRT during the ICU admission (OR 6.88, P < 0.001) and associated with lower cross sectional muscle area (OR 0.98, P = 0.004). Area under the receiver operating characteristic curve = 0.69 (95% confidence interval (CI): 0.59 to 0.78) and applies to muscle mass as a univariate predictor.
Logistic regression using muscle mass as a continuous variable.
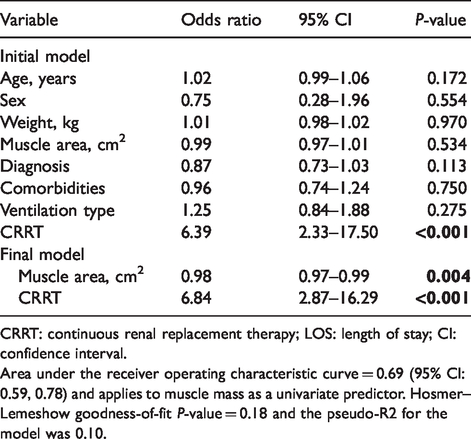
CRRT: continuous renal replacement therapy; LOS: length of stay; CI: confidence interval.
Area under the receiver operating characteristic curve = 0.69 (95% CI: 0.59, 0.78) and applies to muscle mass as a univariate predictor. Hosmer–Lemeshow goodness-of-fit P-value = 0.18 and the pseudo-R2 for the model was 0.10.
Discussion
Traditional frailty assessment tools are limited in the critically unwell ICU population due to difficulties in functional assessment and a reliance on family members or other surrogates. The inclusion of an objective measure, such as CT-derived assessment of sarcopenia, could increase the accuracy of these frailty assessment instruments and allow improved prognostication. Sarcopenia is currently evaluated indirectly, through shared characteristics such as weakness, weight loss and falls. 23 Recent evidence indicates the inclusion of CT-derived sarcopenia into frailty assessment improves prognostic accuracy. 24
Within this ICU population, a high prevalence of sarcopenia was observed, with 68% of patients categorised as sarcopenic. This is similar to results seen in a study conducted in the Netherlands. In the latter study, and using the muscle area cut-off areas used in this study, 63% of patients were classified as having low muscle area. 12 As predicted, we found an association between ageing and sarcopenia. There was also an increased hospital LOS, number of comorbidities and lower BMI seen in the sarcopenic group. Obesity, while associated with a number of comorbidities, has been reported as a potential protective factor for ICU mortality, the so-called obesity paradox.28–32 This has been hypothesised to be the result of a number of protective factors related to obesity. These include the immunological effects of obesity under the stress of critical illness related to higher levels of anti-inflammatory cytokines, higher levels of cholesterol and lipids, which can bind endotoxin and also provide precursors to steroid synthesis and neutrophil dysfunction. 32 Furthermore, there is greater nutritional reserve seen in obesity along with remodelling of the diaphragm related to the increased abdominal weight. 32 It is therefore interesting to note that the sarcopenic group had a mean BMI in the overweight category (BMI 25–30). The non-sarcopenic group was shown to have a higher BMI still; however, the protective effect of obesity is not necessarily linear and so the possibility remains that being overweight was acting as a confounder in our study, interfering with any sarcopenic-related mortality signal. 32 We also considered possible reasons for the sarcopenic population demonstrating an unexpectedly elevated BMI. It might be that the body fat and muscle distribution of this cohort may be such that their elevated BMI is associated with a degree of muscle wasting due to a more sedentary lifestyle. Alternatively, the often inaccurate estimates of height may be confounding the BMI result, given there was no separation between the groups in terms of height.
Contrary to our hypothesis, and in disagreement with many prior studies, we found no statistical difference in ICU and 30-day mortality between the sarcopenic and non-sarcopenic groups in univariate analysis. Previous studies have shown an association between CT-derived sarcopenia utilising SMA at the L3 level and poor clinical outcomes, including higher in-hospital mortality, higher out-of-hospital mortality, decreased ventilator-free days, decreased ICU-free days and increased rate of postoperative complications.6,11–13,19 Similarly, several studies have examined the association between CT-derived psoas area as a surrogate marker for sarcopenia and clinical outcomes with comparable results.17,18,25–27 In contradiction to the majority of the literature, and similar to our results, a study by de Hoogt et al. demonstrated no statistically significant association between CT-derived sarcopenia and mortality in ICU patients on multivariate analysis. 15 Furthermore, McCusker et al. assessed the relationship between frailty, CT-derived psoas area and outcomes in older trauma patients, showing no statistically significant relationship between this method of sarcopenic assessment and in-hospital complications or mortality. 16 Using multivariable logistic regression, this current study identified a link between decreased muscle area and 30-day mortality.
The majority of the studies that have shown an association between CT-derived sarcopenia and poor clinical outcomes have targeted an older population (>65 years), examined a specific subgroup such as trauma and surgery patients, or a combination of both.6,11,18,19,25–27 The heterogeneity of our study population with respect to age and admission diagnosis, in addition to the overall low mortality rate, may contribute to the lack of significance. Another potential explanation is the reasonably stringent pre-admission screening for admission to ICU in Australia. There is an emerging emphasis on advance care planning in the community and emergency department settings, which is potentially limiting the numbers of frail patients admitted to the ICU. 33 A pragmatic approach between clinicians, patients and family members in assessing the likelihood of a meaningful outcome from invasive treatment may account for the exclusion of very frail patients from the cohort examined in this study.
Strengths of this study include the relatively large cohort of patients included for analysis, and the wide variety of admission diagnoses on admission to ICU. Furthermore, stringent temporal inclusion criteria limited the confounding effects of CT scans performed too late (more than 24 h after ICU admission) or too early (more than seven days prior to admission). Many previous studies were not as strict and thus risked introducing significant potential bias related to the effect of ICU and hospital-related muscle wasting.12,15,19
Limitations of this study include the single-centre and retrospective design. The study group represented 25.7% of the total ICU population for the period of review, and had a relatively low mortality of 6.5%. This may represent a selection bias in that patients undergoing a CT scan for diagnostic purposes represent a cohort likely to have a more favourable outcome. Residual confounding remains probable given the severity of acute illness scores, such as the Australian and New Zealand Risk of Death (ANZROD) or Acute Physiology And Chronic Health Evaluation (APACHE) scores, was not available, and hence not adjusted for in the multivariable analysis. Furthermore, assessing the relationship between CT-derived skeletal muscle area and CT-derived psoas area would be useful as psoas area measurement is much less time consuming and could be performed on most PACS rather than third party software.
In conclusion, sarcopenia is highly prevalent in this particular Australian ICU population and is associated with older age, lower BMI, more comorbidities, and longer stays in hospital. In this study on univariate analysis there were no statistically significant differences seen in ICU mortality, 30-day mortality, ICU LOS and major complications between sarcopenic and non-sarcopenic groups. Logistic regression revealed an association between 30-day mortality and the use of CRRT and lower muscle area. Larger studies on ICU populations are required to establish if CT-derived assessment of sarcopenia could provide an objective measurement to combine with subjective frailty scoring systems in prognostication alongside the diagnostic utility of CT scans.
Footnotes
Declaration of conflicting interests
The author(s) declared no potential conflicts of interest with respect to the research, authorship, and/or publication of this article.
Funding
The author(s) received no financial support for the research, authorship, and/or publication of this article.