
Abstract
Intravenous fluids are commonly administered for patients having colonoscopy despite relatively little data to support this practice. It is unclear what, if any, effect crystalloid administration has on stroke volume and cardiac output in patients who are fasting and have had bowel preparation agents. We aimed to assess the physiological effect of 10 ml/kg of crystalloid administration in colonoscopy patients on haemodynamic parameters including stroke volume, stroke volume variation and cardiac output, as measured with transthoracic echocardiography. Our secondary aims were to determine whether stroke volume variation predicted fluid responsiveness in gastrointestinal endoscopy patients and whether these haemodynamic measures are different in fasting patients with bowel preparation (colonoscopy patients) compared to fasting patients alone (gastroscopy patients). We recruited 54 patients having elective gastrointestinal endoscopy (25 colonoscopy, 29 gastroscopy). All patients had stroke volume, cardiac output and stroke volume variation measured with transthoracic echocardiography at baseline. In colonoscopy patients, stroke volume, cardiac output and stroke volume variation were remeasured after 10 ml/kg of intravenous crystalloid. Administration of 10 ml/kg of crystalloid increases stroke volume by 19.6 ml (p < 0.00005) and cardiac output by 0.81 l/min (p < 0.001). Stroke volume variation reduced from 23% to 14% after fluid administration (p < 0.0011). The optimum threshold of stroke volume variation to predict fluid responsiveness was 21% with a sensitivity of 77.8% and specificity of 62.5%. Administration of 10 ml/kg of crystalloid increases stroke volume and cardiac output, and reduces stroke volume variation in fasting elective colonoscopy patients.
Introduction
Gastrointestinal endoscopy is a commonly performed procedure with over a million cases performed annually in Australia. 1 The combined effect of fasting and bowel preparation has the potential to contribute to patients being intravascularly volume depleted, with weight loss, postural hypotension and elevations in serum creatinine. 2 Anaesthesiologists administer fluid in 64% of these cases with large variability in the volume given, despite there being no high quality data to support or refute this practice.3,4 Neither high (20 ml/kg) nor low (2 ml/kg) volume crystalloid infusion reliably reduced the incidence of hypotension, which occurred in almost 60% of patients. 1 Similarly, high or low volume crystalloid administration does not clearly reduce more subjective symptoms such as nausea, vomiting, headache and light-headedness. 5 However, fasting alone does not clearly reduce echocardiographic measures of haemodynamic state. 6 Despite the perception of gastrointestinal endoscopy having a low risk profile, recent data suggests that this is not the case in the hospital setting, with a 23% incidence of adverse events and a 30-day mortality of 1.2%. 7
On a more basic physiological level, it is unclear what, if any, effect routine crystalloid administration has on stroke volume and cardiac output in these patients. This is surprising given the therapeutic goal of intravenous (IV) fluids in anaesthesia and critical care is often explained as aiming to increase preload and stroke volume (SV).
Fluid administration is not necessarily a benign intervention, with weight gain, pulmonary dysfunction and alterations in serum biochemistry being well described.8,9 In addition, there is a not an insignificant financial cost with each litre of fluid (including IV administration equipment) costing roughly AUS$10. 1 In Australia, this would add over 10 million dollars annually to healthcare costs.
Traditional haemodynamic observations such as heart rate, blood pressure and urine output do not reliably detect hypovolaemia. 10 To minimise the potential risk of harm, the concept of fluid responsiveness has evolved. Fluid responsiveness can be defined as an increase in stroke volume or cardiac output (CO) of >10 –15% in response to IV fluid administration.11,12 Many different predictors of fluid responsiveness have been described, including measures related to heart-lung interactions and changes in intrathoracic pressure with respiration, leading to SV variation and pulse pressure variation. 11 SV variation can be measured noninvasively with transthoracic echocardiography (TTE) using Doppler in the left ventricular outflow tract (LVOT).13,14 Alternatively, variations in caval diameter with echocardiography predict fluid responsiveness.11,15 Passive leg raising has also been described, where blood is mobilised from the legs and abdomen into the thorax increasing SV.11,16,17 Passive leg raising is a simple, reliable, reversible and noninvasive method of predicting fluid responsiveness with sensitivity and specificity of 85% and 90%, respectively, when using CO or flow-related variables, but performs less well when using arterial pulse pressure variation. 17
All of these techniques have significant limitations and none can confidently predict fluid responsiveness across a variety of commonly encountered clinical scenarios, including spontaneous and low tidal volume ventilation, arrhythmia/ectopic beats, raised intra-abdominal pressure and varying shock states.10–12,18 Recent Intensive Care Unit data suggests that up to 40% of patients have clinical conditions making no currently utilised fluid responsiveness measures useful. 19
Some preliminary data does suggest that SV variation may have some utility in spontaneously ventilating patients.20,21 In the practice of our institution, most patients having colonoscopy routinely receive 10 ml/kg of crystalloid up to 1000 ml. Gastroscopy patients do not routinely receive fluids.
At present, there is a paucity of data in this area for the non critically-ill day-case surgical population. The aim of our study was to assess the effect on SV and CO of 10 ml/kg of crystalloid in colonoscopy patients, as measured with TTE. Our secondary aims were to assess whether SV variation differed between colonoscopy and gastroscopy patients on admission and to evaluate whether SV variation predicted fluid responsiveness.
Methods
Approval for this single centre prospective observational study was obtained from the Human Research and Ethics Committee, St Vincent’s Hospital, Melbourne (HREC LRR 044/17). Written informed participant consent was obtained. Patients were included if they were undergoing elective day case endoscopy. Exclusion criteria were patients undergoing emergency endoscopy procedures, cardiac arrhythmia (because of SV variation), and prior IV fluid therapy. Participants undergoing colonoscopy received usual institutional pre-endoscopy protocol instructions of bowel preparation (Picoprep and Glycoprep-C). All participants were instructed to drink water as required up until two hours before the procedure. On the patient’s arrival to the endoscopy suite participants were positioned supine. Demographic data and time since last fluid intake was recorded. Heart rate (HR) and non-invasive blood pressure measurements were taken. All focused TTE studies were performed by experienced cardiac anaesthetists with expertise in perioperative echocardiograpy using a 5–1 MHz transducer (Philips Sparq, Philips Healthcare, North Ryde, NSW).
The sequence of echocardiographic image acquisition was to measure the LVOT diameter from the parasternal long axis view according to American Society of Echocardiography guidelines,
22
with LVOT cross sectional area (CSA) calculated using the area of a circle formula (Figure 1):

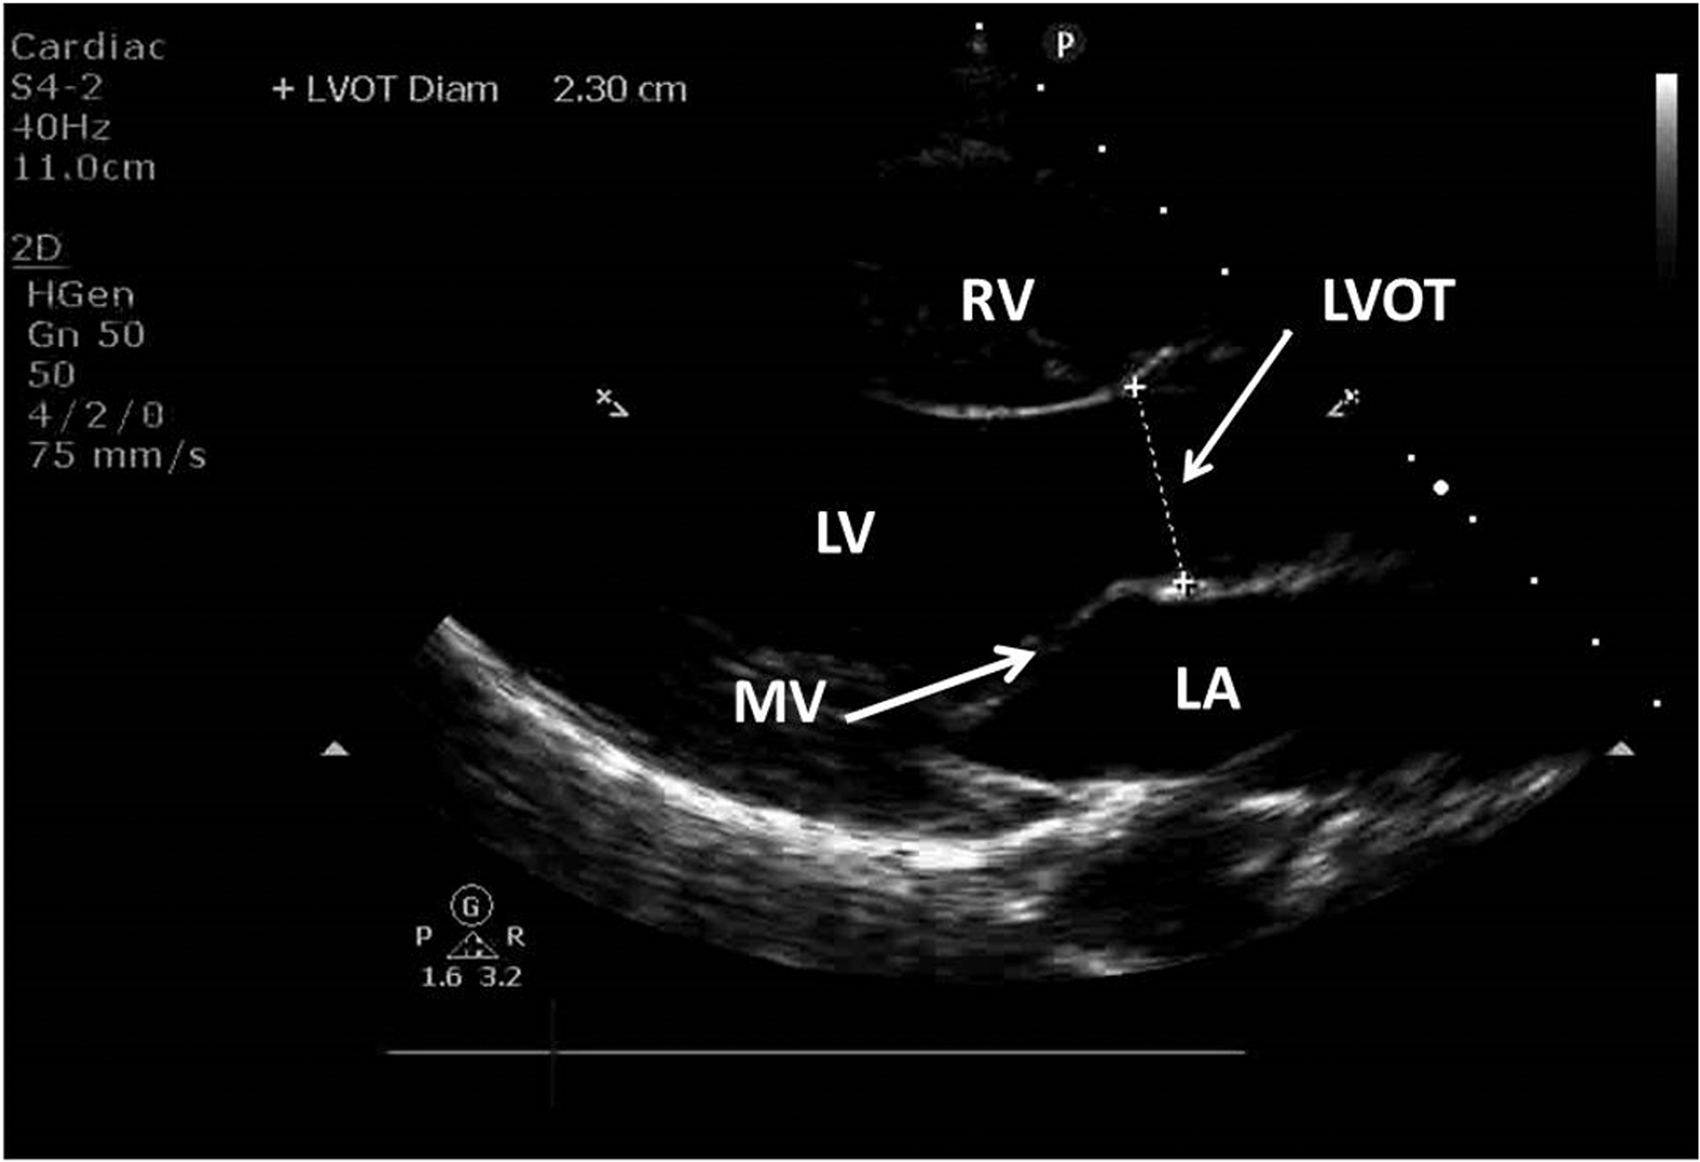
Parasternal long axis view showing the left ventricle (LV), left atrium (LA), right ventricle (RV) and mitral valve (MV).
An optimal five-chamber apical view was obtained followed by acquisition of pulsed wave Doppler of the LVOT over two respiratory cycles. The velocity–time integral (VTI) was derived from the pulsed wave Doppler waveform to calculate SV and SV variation according to international guidelines 13 (Figures 2 and 3).
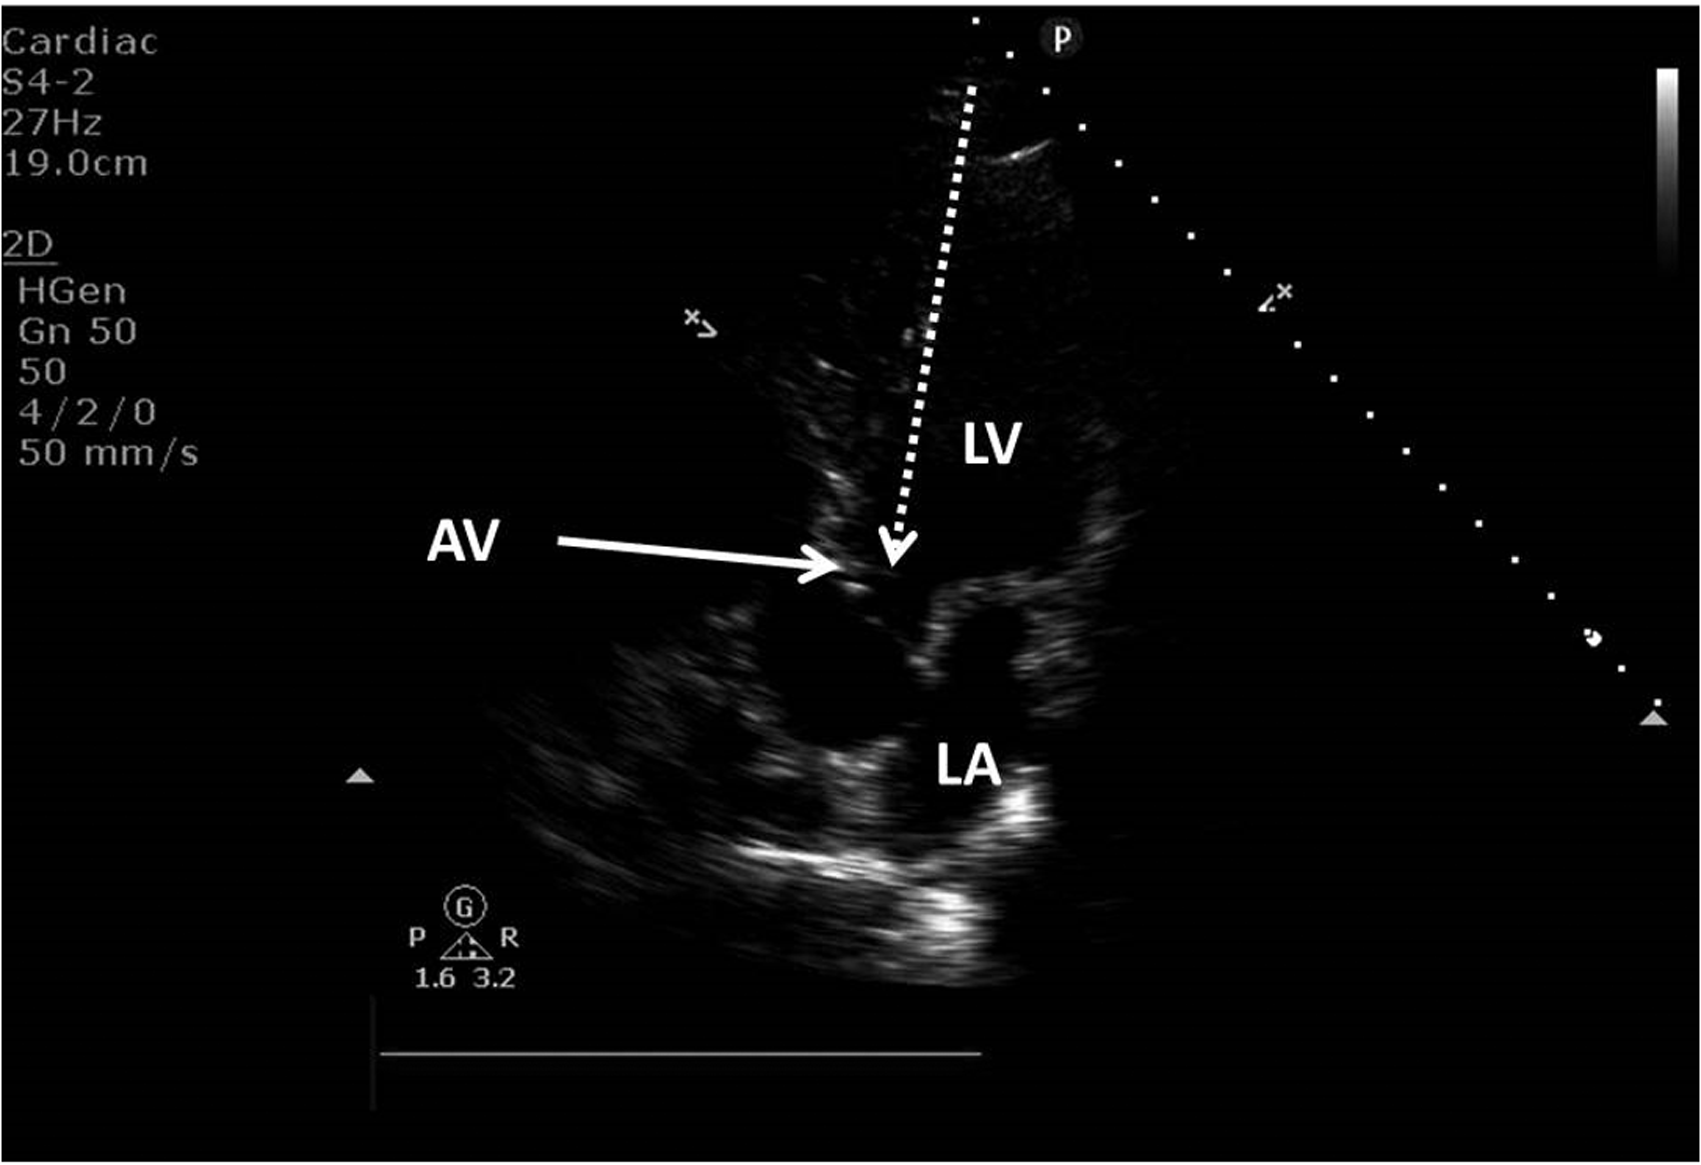
Apical five-chamber view showing the left ventricle (LV), the left atrium (LA) and the aortic valve (AV).
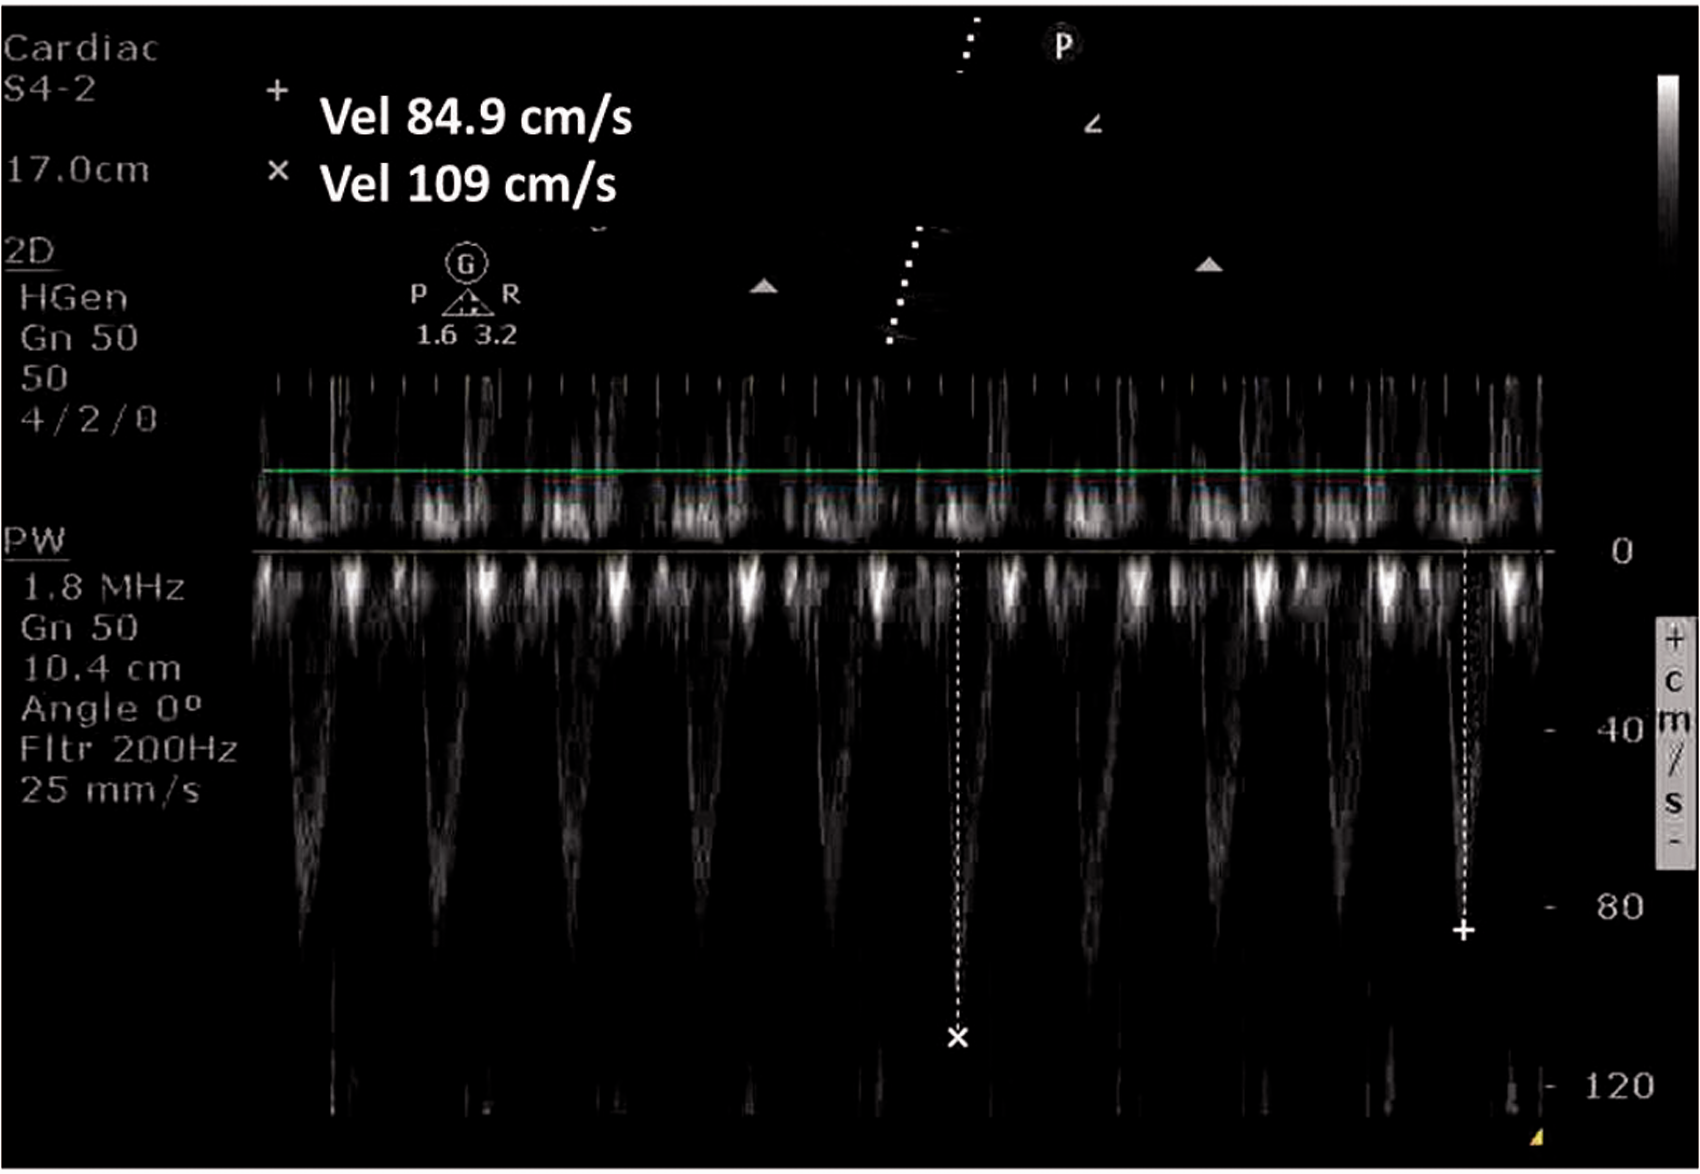
Pulsed wave Doppler signal from the apical five-chamber view showing respiratory variation of peak velocity and velocity – time integrals.
SV is calculated as:

CO is calculated as:

SV variation is calculated as (SV max–SV min)/SV mean.
Endoscopy patients who had received bowel preparation then received 10 ml/kg of 0.9% normal saline, which flowed freely in a non-pressurised bag through a 20-gauge IV cannula over 15–30 min, depending on the actual volume infused. Repeat SV, CO and SV variation were then assessed with TTE as before. Measurements were taken prior to administration of sedation to reduce confounding effects of IV hypnotic agents on haemodynamics and cardiac function. Patients were deemed to be fluid-responsive if their CO increased by 15%.
To our knowledge, there have been no previous studies in the literature assessing SV and CO in endoscopy patients, however, data from a previous study which assessed SV in patients fasting for elective abdominal surgery determined the mean (standard deviation (SD)) of LVOT VTI to be 17.6 cm (2.6). 8 Assuming similar variability, 17 participants would be required in each group to achieve 80% power to detect a 15% difference in SV between gastroscopy and colonoscopy patients. We planned to study at least 25 patients in each group to take into account that our data may have greater variability than the described study and missing data due to inability to obtain adequate TTE views in some patients.
Student’s paired t-test was used to compare colonoscopy patients post–bowel preparation pre- and post-fluid bolus. Student’s two sample t-test with unequal variance was used to compare colonoscopy patients’ to gastroscopy patient’s (no bowel preparation) measurements of SV, SV variation and CO.
Receiver-operating characteristic (ROC) curve analysis was used to determine the sensitivity and specificity of using different cut-off values of respiratory variation in SV to predict fluid responsiveness, which was defined as a 15% or greater increase in CO. The optimum threshold value was chosen as that which gave the maximum value for the sum of the sensitivity and specificity (Youden index), i.e. the point on the ROC furthest from the line of equality (y = x). All analyses were performed using Stata 14 (StataCorp LP, College Station, Texas, USA).
Results
Fifty-four participants undergoing endoscopy completed the study (25 bowel preparation, 29 no bowel preparation) with similar demographics between groups (Table 1).
Patient demographics.
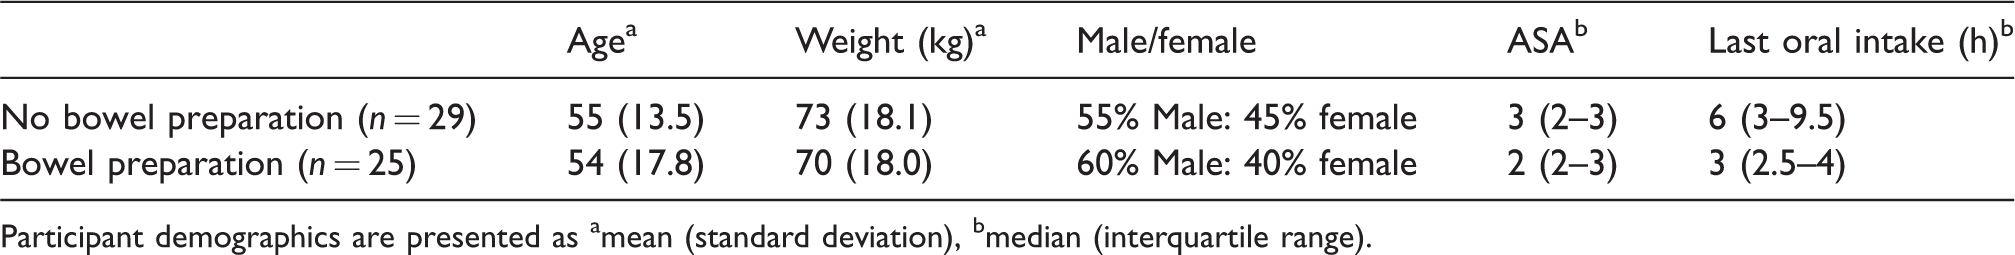
Participant demographics are presented as amean (standard deviation), bmedian (interquartile range).
At baseline, there was no significant difference in heart rate, blood pressure, SV, SV variation, or CO between colonoscopy (fasting and bowel preparation) and gastroscopy (fasting alone) patients (see Table 2).
Baseline haemodynamics.
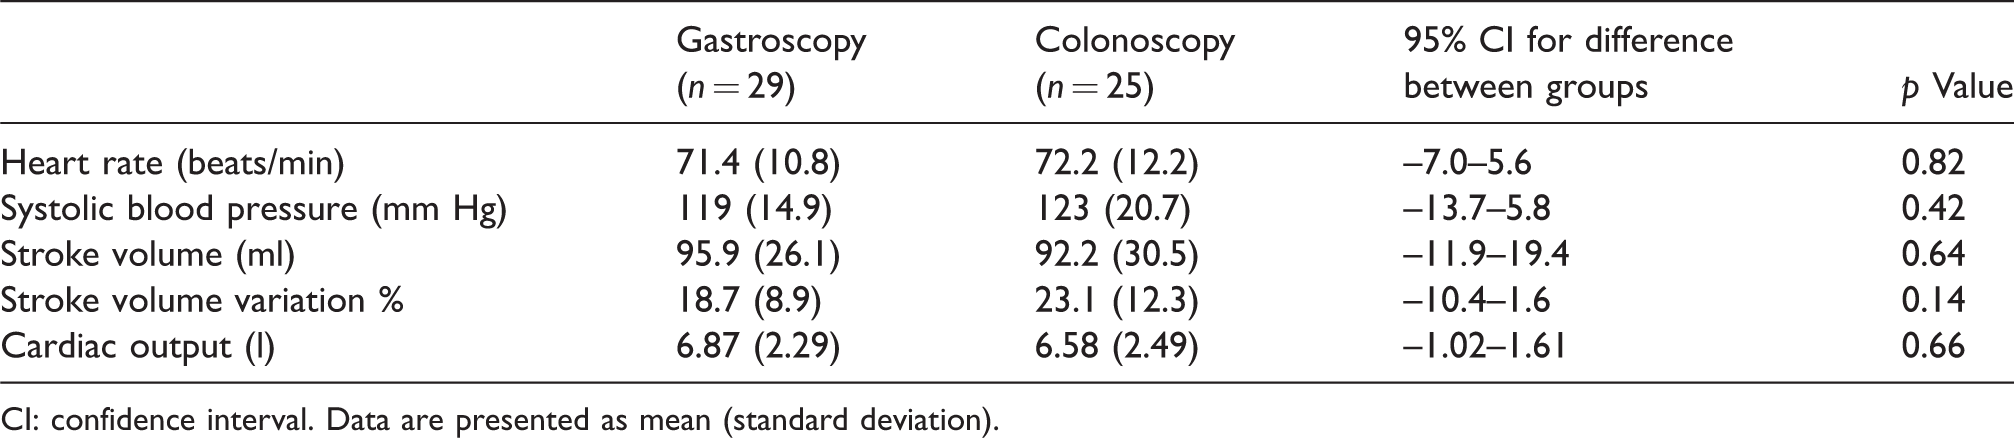
CI: confidence interval. Data are presented as mean (standard deviation).
Colonoscopy patients had a significant increase in SV and CO and a reduction in SV variation following administration of 10 ml/kg crystalloid (Figure 4).
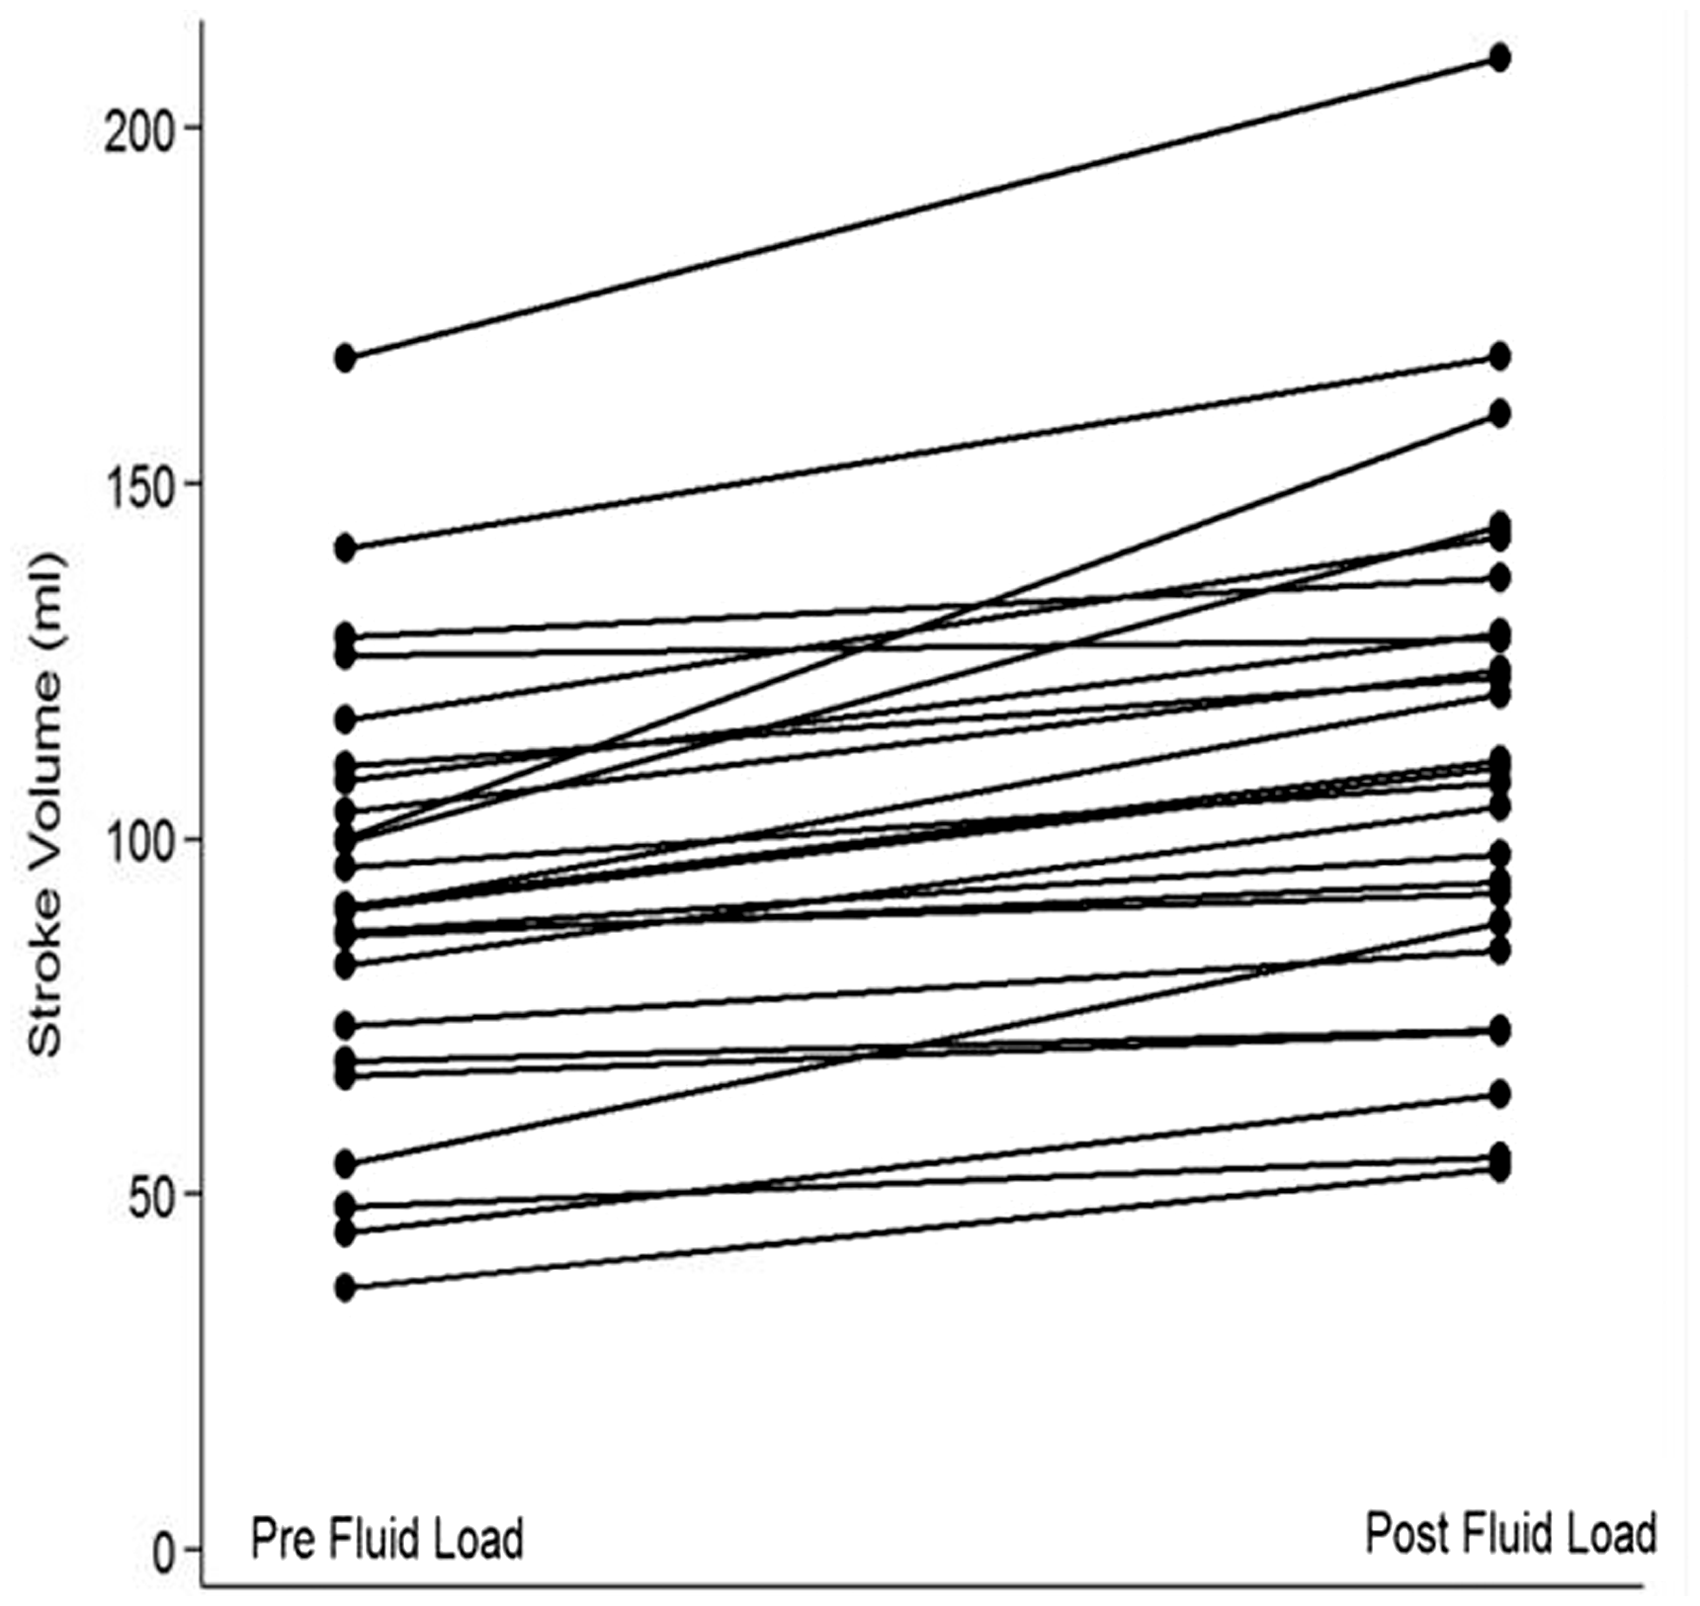
Change in stroke volume in individual subjects pre and post fluid bolus, with 100% of patients increasing their stroke volume in response to crystalloid administration.
SV increased in 100% of patients with a mean increase of 19.6 ml.
Mean increase in CO was 0.81 l/min and CO increased in 21 of 25 patients. In the four patients in whom CO did not increase, all patients had increases in their SV but decreases in their heart rate, thus reducing overall CO. They also had slightly lower SV variation but this was not statistically significant (p = 0.7) (Table 3).
Effect of 10 ml/kg fluid upon haemodynamic measures.
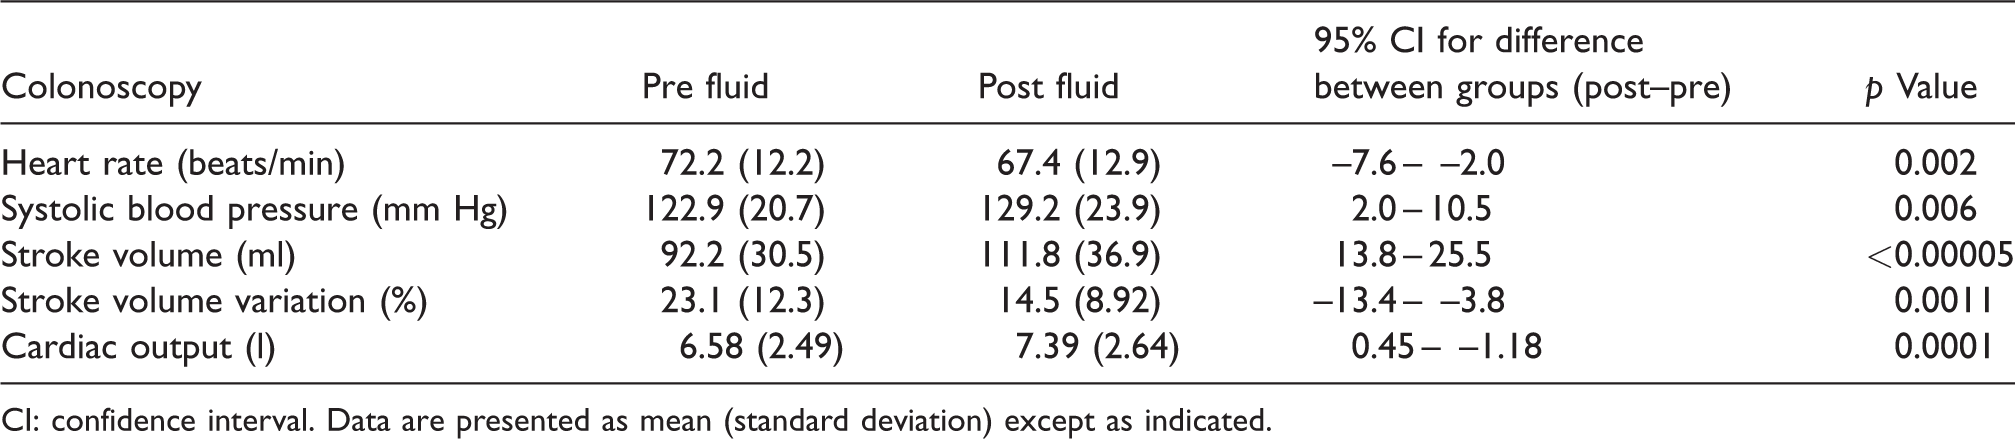
CI: confidence interval. Data are presented as mean (standard deviation) except as indicated.
Ability of SV variation to predict fluid responsiveness (defined as ≥15% increase in CO) is shown in Figure 5. The area under the ROC curve was 0.72 (95% confidence intervals (CI) 0.48–0.95). The optimum threshold of SV variation to predict fluid responsiveness was 21% with a sensitivity of 77.8% and specificity of 62.5%.
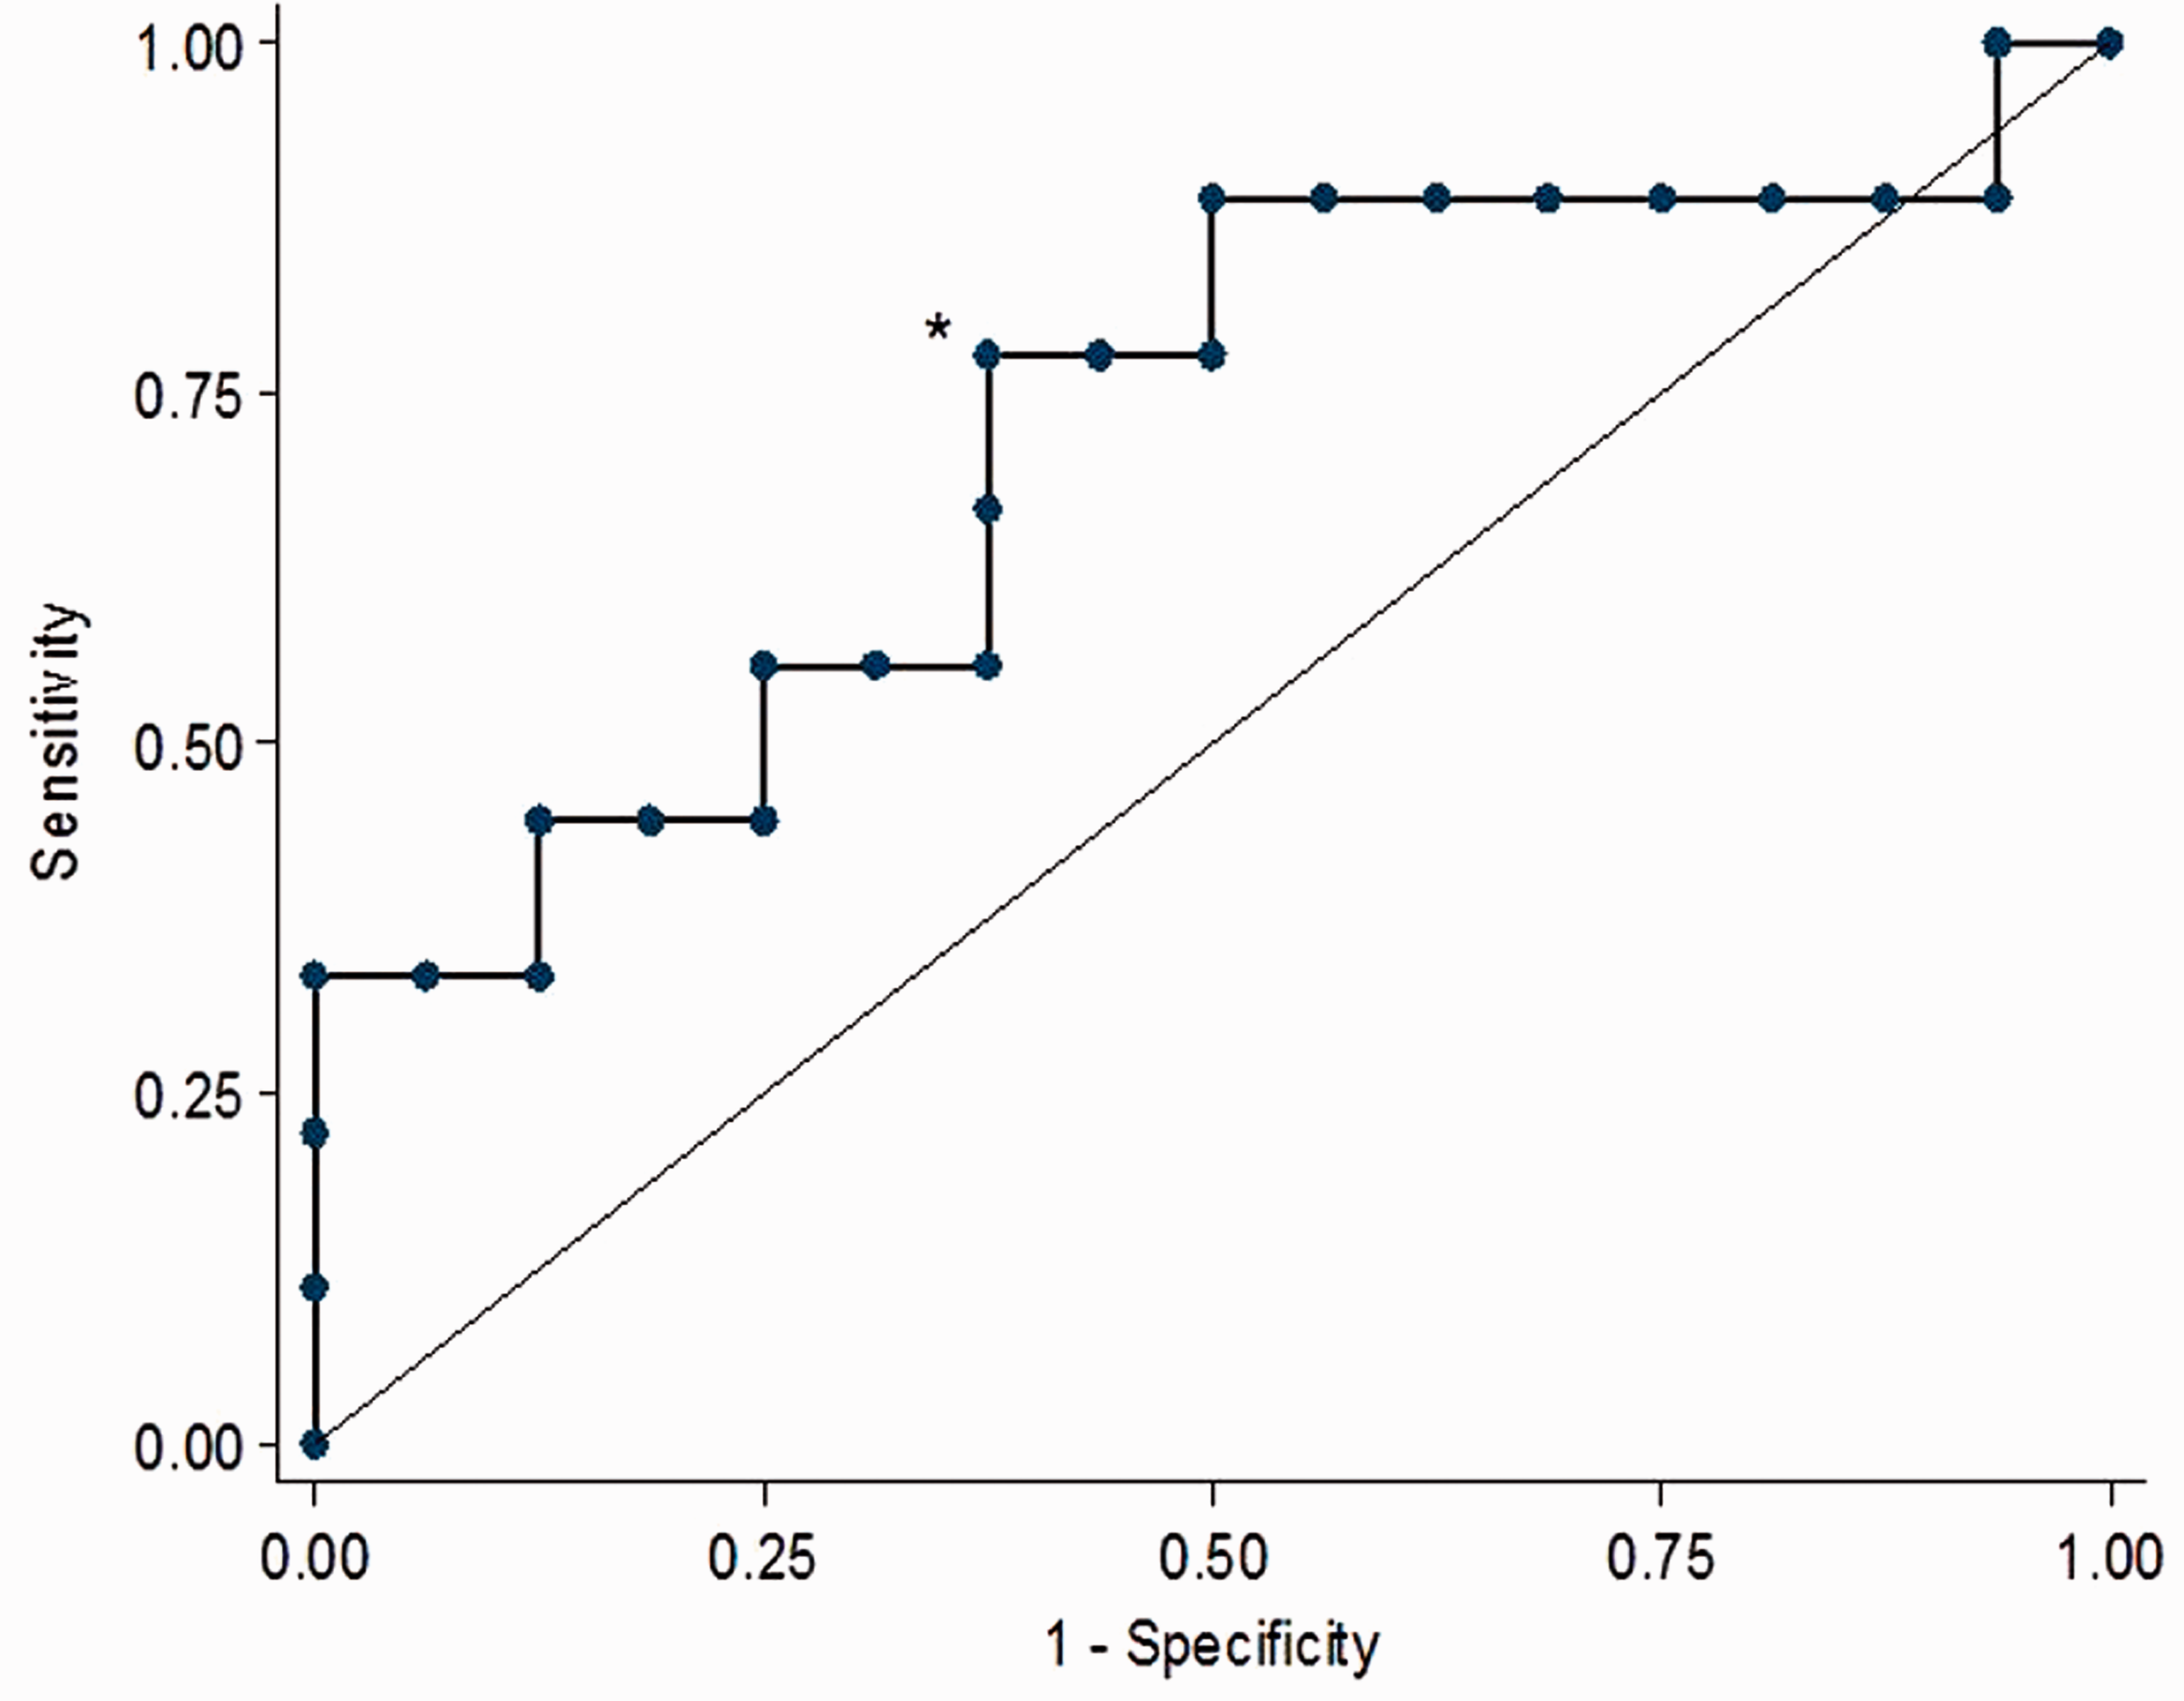
Receiver operating characteristic (ROC) curve of stroke volume variation to predict fluid responsiveness.
Time since last oral fluid intake had no correlation to observed results.
Discussion
This study has quantified the effects on SV and CO of a commonly administered bolus of crystalloid fluid in elective colonoscopy patients. Administration of 10 ml/kg of crystalloid increases SV by 19.6 ml and CO by 0.81 l/min.
The validity of SV variation techniques in estimating fluid responsiveness has been questioned in spontaneously ventilating patients and even in mechanically ventilated patients using usual tidal volumes of < 8 ml/kg. 10 This is thought be related to relatively smaller and non-uniform fluctuations in intrathoracic pressure. However, there is data to suggest that SV variation may have some utility in spontaneously ventilating patients, with a SV variation of greater than or equal to 17% predicting fluid responsiveness in 100% of septic patients, suggesting that the thresholds need to be altered in spontaneously ventilating patients. 20 A small study in volunteers also suggested that a 17% variation in aortic blood flow VTI (analogous to SV) predicted fluid responsiveness in spontaneously ventilating patients. 21 In patients undergoing major abdominal surgery as part of the OPTIMISE trial, SV variation and pulse pressure variation was measured in 100 patients using the LIDCO rapid monitor, and showed similar levels of accuracy during ventilation, area under ROC 0.68 and 0.63, respectively, and in spontaneously breathing patients, 0.68 and 0.69, respectively, with a positive predictive value of 73%. 23
Our data suggests that colonoscopy patients present with a SV variation of 23% and that after a 10 ml/kg fluid bolus, SV variation decreases to 14%. However, the area under the ROC of 0.71 suggests that the ability of SV variation to predict fluid responsiveness as defined by a 15% increase in CO is only fair. Our derived optimum threshold of SV variation was 21% which had a sensitivity of 77.8% and specificity of 62.5%. Our data indicate that a threshold of 10% would be required to achieve 90% sensitivity and a threshold of 34% would be required to achieve 90% specificity. Utilisation of SV variation as a fluid-responsive parameter should incorporate an understanding of a very wide ‘grey zone’ for clinically acceptable levels of accuracy. 24 This study yields a diagnostic predictability similar to that in patients who are positive pressure ventilated, and suggests spontaneously breathing patients can still be assessed for fluid responsiveness. 23
In 25% of patients undergoing general anaesthesia, dynamic measures of fluid responsiveness do not reliably predict the likelihood of SV increasing in response to a fluid bolus with many patients in the ‘grey zone’, where measures of pulse pressure and SV variation are in the range of 10 –15%.10,12 Added to this uncertainty, 50% of critically ill patients do not respond to a fluid bolus. 25 Or alternatively, 50% of a fluid boluses in this population are unnecessary and potentially harmful. 26 The common bedside approach of a fluid challenge of 250–500 ml and assessing clinical response is increasingly being challenged with so called ‘mini boluses’ of fluid of as little as 50–100 ml reliably increasing SV as measured with echocardiography.27,28 This has the potential to at least reduce the dose of an unnecessary fluid challenge.
SV variation was similar in gastroscopy patients who have been fasting but have not had bowel preparation. This would suggest that the combination of fasting and bowel preparation has minimal additional effects on intravascular volume compared to those from fasting alone. This may be related to more liberal fasting guidelines and the improved side-effect profile of modern bowel preparation agents. Despite the common perception amongst clinicians who the combination of fasting patients and bowel preparation leaves patients dehydrated or hypovolaemic, it may be that neither elective colonoscopy nor gastroscopy patients need intravenous fluid replacement. This gives some support to clinicians who do not routinely administer intravenous fluids during these procedures.
SV variation has been measured with several techniques, including arterial pulse contour, plethysmography, oesophageal Doppler and echocardiography.10,12,29,30 We utilized SV variation as measured by echocardiography with the advantage that it is completely noninvasive, with no known procedural risks or harm and provides additional information on cardiac structure and function. The endoscopy patient cohort and observational nature of the study would have precluded the use of commonly available minimally invasive CO devices including arterial pressure–derived devices that require an arterial line or oesophageal probe with the oesophageal Doppler monitor.
Whilst we have demonstrated and quantified the effect of a fluid bolus in fasting endoscopy in increasing SV, whether this is useful and actually improves outcomes in these patients requires a much larger study that looks at a patient-centred outcome incorporating morbidity or mortality. Nevertheless, clinicians looking after these patients can be confident that a crystalloid fluid bolus significantly increases the SV in all patients.
Our study focused on elective endoscopy patients and the cardiovascular changes to fluid administration and fluid responsiveness parameters may be different in emergency endoscopy, patients undergoing major surgery and those with critical illness.
Administration of 10 ml/kg of crystalloid increased SV, CO and decreased SV variation in fasting elective colonoscopy patients. SV variation only demonstrated fair ability to predict fluid responsiveness in this patient population. We could not demonstrate any effect of modern bowel preparation on SV, CO or SV variation.
Footnotes
Acknowledgements
The authors would like to thank the Day Procedure Unit nurses and the Department of Gastroenterology for their assistance with this study.
Declaration of conflicting interests
The author(s) declared no potential conflicts of interest with respect to the research, authorship, and/or publication of this article.
Funding
The author(s) received no financial support for the research, authorship, and/or publication of this article.