
Abstract
This article aims to examine the dynamics of the Chilean economy as a consequence of actions taken by companies whose aim is to make profits. As such, the economic analysis used is Marxist and makes use of those classical indicators described in Capital (Rate of Surplus-Value, Organic Composition of Capital and Rate of Profit). It is maintained that with the Marxist method, we can discover that behind the accumulation of incomes lies the fact that out of each 8 hours worked, only 3 finance wages and 5 benefit the owners of capital. That fraction of the unpaid labour received by capital but invested back as new capital, plus that ‘excess’ surplus value that is consequence of high copper prices, raises the physical, but not necessarily the value, capital-per-worker ratio. As a consequence, that relation of exploitation to capital accumulation, which Marx called the Rate of Profit, is found to fall, rise and then fall again. We understand that various approaches have been made to calculate the classical indicators and include some of them as alternative methods in our results.
Introduction
This article aims to examine the dynamics of the Chilean economy as a consequence of actions taken by profit-driven companies. These companies seek to boost their profits through investments geared to produce goods and services at prices they can sell on the marketplace, to cover the cost of – and to accumulate further – investments, to finance the wages they pay and the profits that are the basis of the good life of the country’s rich.
We will see if the companies have managed to generate the profits they need to continue generating more profits and further investments. And as a consequence, if the economy has grown, who has benefitted from this growth and how we can deal with the present and future recessions. In a little more detail, we will see how much companies and their owners have invested, how much they earn and how much they pay in remuneration. Moreover, we will see how many workers put these investments in motion, how much capital each worker moves and how much profit they generate.
To address these issues, this article is based on a Marxist analysis of the economy. Particularly, it draws on three core Marxist concepts: The Rate of Surplus-Value (ROSV), the Organic Composition of Capital and the Rate of Profit (ROP). Our empirical strategy is based on translating the theoretical formulations of Karl Marx’s Capital into operational categories in the context of the Chilean public statistics. Data come mainly from three sources: Central Bank’s National Accounts, National Employment Survey and the Employment and Unemployment Surveys for Greater Santiago. The analysed period ranges from 1985 to 2018.
This article is organized as follows: in the ‘Discussion’ section, we will briefly look at the state of the art. Then, the ‘Theory’ section addresses the theoretical framework, which is the basis for further estimations and analysis. The section ‘Ways of measuring the central Marxist concepts’ presents the methodology and the sources and the ‘Results’ section, our original estimates and the analysis. Conclusions form part of the final section.
Discussion
In Chile, the analysis of profit dynamics has usually been addressed by using financial categories drawn directly from the profitability reports of Chilean firms. It is normal that financial newspapers (e.g. Diario Financiero and Estrategia) from time to time publish a statistical synopsis concerning the profitability of the main corporate holdings. Their aim is not to boost the debate about the level of profits but to provide financial information to help the decision-making of shareholders and stockbrokers. The disclosure of this financial information is provided in jargon and takes into consideration the same financial metrics discussed normally by the board of directors in profit-driven companies. On this basis, some authors have made contributions to the analysis of profit dynamics in Chile in a critical sense (Claude 2006; Dahse 1979; Fazio 1997).
Also, within this financial approach, but from the macroeconomic – rather than microeconomic – point of view, another line of investigation looks at profit dynamics in Chile by using the country-level Return on Equity (ROE). Examples are the various reports of the Central Bank of Chile, for instance, the Financial Stability Reports. The work of Titelman (2018) also lies within this tradition.
In turn, the analysis of the profit dynamics using Marxist categories is more scarce but nonetheless not entirely new. The works that follow this perspective have been designed mainly to shed light on some specific issues within the Marxist tradition. As such, the study of the ROP has attracted the most attention. Two contributions can be mentioned: Maito (2012) and Polanco (2019).
In Maito (2012), the author calculated the Chilean ROP between 1986 and 2009. Another recent research work is Polanco (2019), which also studies the ROP but views the whole period of 1900–2010. In each article, a specific empirical strategy for calculation has been formulated.
In Polanco (2019), since the data spread covers a long period, some variables are proxies of the best scenario case; this is the situation with the Net Capital Stock which includes the housing component.
The usual Marxist method is to exclude the housing component (e.g. Roberts 2011) because it does not constitute productive capital and as such does not form part of the process of capital accumulation. Polanco defines the ROP as the S/C ratio where S is the surplus value and C is the fixed capital stock. This formulation is shared by other authors (e.g. Duménil and Levy (2002); Weisskopf (1979) among others), but does not take into account that hybrid formulation between surplus and the wage bill proposed by Marx in his theory of value. The ROP calculated by Polanco is based on the capital share published by Díaz Lüders and Wagner (2016), which includes taxes and consumption of fixed capital. Such a method overestimates the mass of profits, and the decision to make use of the stock of fixed capital including the housing component overestimates fixed capital. Finally, Polanco’s method does not subtract mixed income from the ROP. However, we recognize that there are many and various ways to approach the measurement of the ROP.
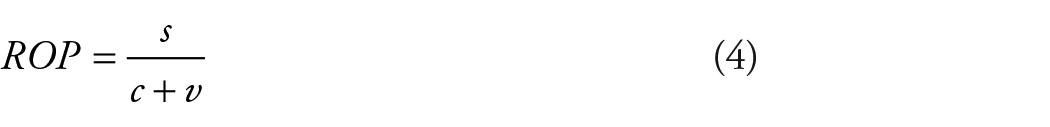
In addition, Maito (2012) calculates the ROP using net fixed capital stock without the housing component, 1 the mass of profit is adjusted for taxes and mixed income and the wage bill is included in the denominator of the equation ROP = (S / (C + V)). To face the problem of inconsistence in the denominator where stock and flow are combined (see presentation, e.g. in Jones (2014)), the author adjusts for capital turnover. On this basis, a ‘Marxist ROP’ (e.g. Maito 2018), which makes use of the wage bill, is calculated, but which by mathematical definition would be less than the ROP defined by Polanco, although the consequent tendency displays similar characteristics.
The adjustment for capital turnover is applied by some authors, but not by others. The argument is that profits generated in one production cycle could be used to pay wages in the next, and as such diminish the new resources that the capitalist needs to invest during a series of cycles. We show results that both apply and don’t apply the turnover adjustment.
Although Maito (2012) and Polanco (2019) are valuable contributions, the current state of analysis, not only on the ROP but also on the Organic Composition of Capital and on the ROSV, and taking into account the period 1985–2018, remains relatively diffuse. In the following, we aim to offer an empirical insight, which though general, can help to understand the capitalist mode of production in contemporary Chile.
From a conceptual point of view, and more than 150 years after Karl Marx’s Capital, the debate on Marxist categories is still open. In conjunction with the exploitation visible in the production process, some analysts find value which is born from the externalization of human capacity to create and produce, but which is not measurable in the same sense as in the production process. As such they see sources of value outside the production process itself. Generally speaking, these analyses argue that social reproduction of labour power contributes greatly to the total production of value today. However, they hold that territories and their creation are a central variable and the natural energy of nature is an integral part of the general productive network (Harvey 2014). Examples are feminist economics, ecosocialist and financialization approaches.
Feminist economics has given birth to the idea that it is the social reproduction of labour which accelerates the generation of surplus value at this point in capitalism’s development (see, for example, the wide-ranging discussion in Bhattacharya 2017). In this sense, the amount of human labour used in the reproduction of human labour power inside the family could (theoretically) be measured. 2 The energy of nature could also be seen as a source of value (Foster 2020; Foster & Burkett 2018), but is always made available by the intervention of alienated human labour in capitalism. To harness nature’s vital force in the sun, the wind, tidal force, in riches like copper, lithium or fish in the seas, capitalism has no alternative to make use of human labour power.
Reasons for the increasing importance of the financial sector include the need for credit expansion to sustain growth in the context of a decline of profitability; the increasing importance of global financial flows in fuelling cross-border investment, some of it speculative, some of it productive; the increasing fluidity of relations between fiat currencies creating opportunities for speculative activities and so on (Roberts 2016). 3
To sum up the discussion on value and human alienation, the production of human labour power, the transformation of the use value of nature itself into commodities and the financialization of production, is – to some extent – part of the analysis and discussion of the amount of – paid- socially necessary labour time needed to create labour power. The definition of that ‘socially necessary’ amount of labour time incorporated in a commodity is a central field of battle and as such ethnic, gender and class conflicts are part of the permanent recalculation of that definition.
The same logic can be applied to labour time that is socially necessary to transform the light from the sun we see and the heat or the wind we feel into commodities, or to protect the environment and prevent the global environmental crisis.
Human labour, as being both abstract and concrete, creates use values and value under capitalism and as such is both the central creative force of human society today and the driving force of capitalism and its crises. 4
Our approach in this work is that all value in a capitalist system springs from the human capacity to create and produce, and human activity is the only element capable of putting an end to the global crises we face.
Theory
In Karl Marx’s Capital, a theoretical framework to understand the capitalist mode of production is presented. In this short discussion we will focus on three classical concepts, which are key to such an understanding: the ROSV, the Organic Composition of Capital and the ROP.
In the Capitalist Mode of Production, Marx sees three social classes: capitalists, landowners and workers. The capitalists are the owners of the means of production and are those who buy labour-power. The landowners are those who own land and the working class who own only their capacity to work and must sell it in the commodity-market to continue living. By selling their labour-power, workers enter into the capitalist mode of production and create different commodities. But as Marx pointed out, The value contained in a commodity is equal to the labour-time expended in its production, and the sum of this labour consists of paid and unpaid portions. But for the capitalist the costs of the commodity consist only of that portion of the labour materialised in it for which he has paid. The surplus-labour contained in the commodity costs the capitalist nothing, although, like the paid portion, it costs the labourer his labour, and although it creates value and enters into the commodity as a value-creating element quite like paid labour. The capitalist’s profit is derived from the fact that he has something to sell for which he has paid nothing. (Marx 1959: 42)
In the production process, capitalists need to invest in both variable (that is, labour) and constant capital; however, it is ‘only the variable portion of capital which creates surplus- value’ (Marx 1959: 42). Constant capital is ‘the total capital minus the variable capital, that is, the constant capital, consists of the material requisites – the means of labour and materials of labour – needed to materialise labour’ (Marx 1959: 45). In other words, constant capital is needed to set the conditions to ‘exploit labour’ because wages have already been accounted for and unpaid labour is made use of.
Rate of Surplus-Value
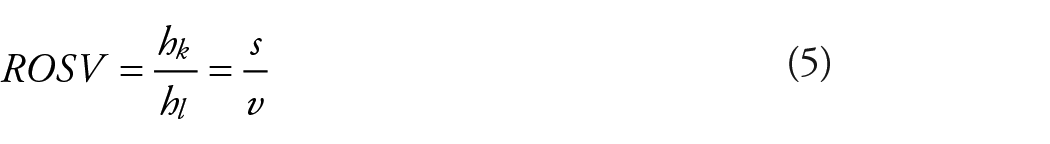
If s is the extent of the surplus or the unpaid part of the working day and v the value of labour-power or the portion of the working day which is paid, the ratio between s and v is the Rate of Surplus-Value (ROSV).

Organic Composition of Capital
The second related-concept is the relation between constant and variable capital, which is called the ‘Organic Composition of Capital’. There are two meanings to such a composition.
The first is called ‘Technical Composition of Capital’ and is mathematically defined as the ratio between constant capital and the number of workers. As Marx pointed out, this composition ‘corresponds to a definite quantity of means of production, and hence a definite quantity of living labour to a definite quantity of labour materialized in means of production’ (Marx 1959: 145).

The second meaning is the Organic Composition itself, that is, the ratio between the constant capital and the variable capital.

Rate of Profit
The third related-concept is the ROP or the ratio between the surplus value and the total amount of capital (variable and constant), which is advanced by capitalist. It represents the profitability of the invested capital.
The ROP is the ultimate barometer of businesses and is normally considered by capitalists (as a rate of return on capital) to measure the profitability of the economy and in the decision-making process.
A note on the use of ‘productivity’
Traditionally, the concept of (labour) productivity is conceived as a measure of the value or quantity of goods produced in a working period. As such, higher productivity means that the economy is working more efficiently and the capacities of workforce have been well used.
A Marxist analysis focuses on the fact that labour puts more capital in motion, and not that labour produces more goods.
As Karl Marx said, But whether condition or consequence, the growing extent of the means of production, as compared with the labour power incorporated with them, is an expression of the growing productiveness of labour. The increase of the latter appears, therefore, in the diminution of the mass of labour in proportion to the mass of means of production moved by it, or in the diminution of the subjective factor of the labour process as compared with the objective factor. (Marx 1887: 438)
A rise in productivity allows an individual capital to appropriate extra profit because his or her costs per product are relatively lower than the average, but market competition will enforce the drive to increase that rate of exploitation as part of future productivity improvements. For behind the concept of ‘production of goods’ is the creation of surplus value.
In the remaining part of the article, and on the above conceptual basis, we will see the empirical approach which implements such concepts in Chilean statistics.
A note on the ‘source of value is human labour’
The fundamental premise of Marxist analysis is the understanding that the source of value is human labour incorporated in a commodity, and more precisely, the value of a commodity is determined by the amount (time) of socially necessary work used in its production and appearance in the market (Choonara 2018). This premise is strongly denied by mainstream economics. For example, the marginal productivity theory (one of the most influential schools in this spectrum), sustains that all factors contribute to value creation and receive their just returns. As such, workers receive their wages and capital receives its profit. This is what Milton Friedman refers to when he argued that ‘each man gets what he produces’ (Friedman 1976: 198). It is obviously true that in a capitalist economy, without capital, just as without workers, there is no production. But whereas waged work pays its upkeep and also generates additional – within capitalism and after passing through some adaptation, unpaid – value, capital simply transfers value incorporated in its machinery, factories, supermarkets, offices and mines, to the products it is used to create.
In some situations, it seems that capital is the driving force to growth and profits, for example, in the microelectronics or software/Internet boom. Those capitals which use new capital to create products which incorporate less paid work than their competitors, nevertheless sell their products at prices higher than their incorporated value, but lower than the normal market price. As such, they make higher profits until their competitors follow their lead, also invest in new capital, and new and lower market prices are reached. This process of redistribution of value added creates the false impression that it is capital which creates new profits, whereas under the surface of the process, a Marxist analysis shows that the market merely shifts the value created from unpaid labour, among the capitals which exploit that human labour.
Ways of measuring the central Marxist concepts
Some remarks on the ROP
To calculate the ROP empirically, we consider that those capitalists who own land, for example, the cellulose, mining, power or agro-industrial/fruit conglomerates, are part of the industrial capitalist class. Profits which derive from ‘extraordinary’ prices of exports are taken to be a normal part of profits in National Accounts, without taking the source of those prices and profits into consideration. Those consequent periodic rises or falls in the profit/wages ratio are considered to be changes in the rate of exploitation, as understood in the phrase ‘they’ve got more than us out of the deal’.
Derivation of the ROSV in hours of work
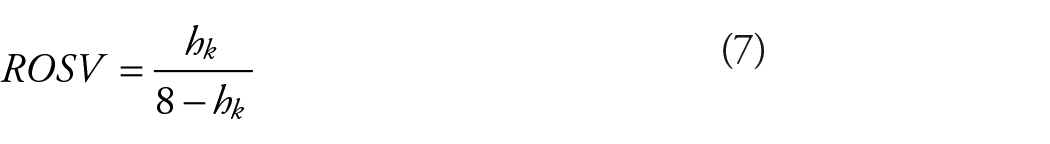
The ROSV can be expressed as the ratio between the unpaid labour versus paid labour. In other words, as the ratio between the unpaid hours worked for the worker for the capitalist (hk) versus paid hours worked (hl). 5 As such, if the working day is 8 hours, then:

Then by replacing in equation (5),
After some basic algebraic operations, hk is defined as follows:
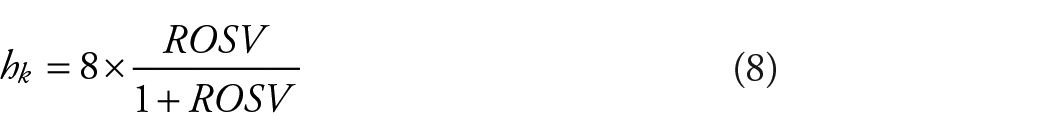
By computing ROSV, it is possible to derive the rate of exploitation expressed in working hours as a measure of the degree of exploitation. 6
The preceding equations assume that value can be expressed in both hours of labour and monetary terms. In other words, that there exists an equivalence between hours of work and the monetary expression of value. This is somewhat controversial among present day Marxists (see the synthesis in Kim (2010)), and as such, we have decided to follow the traditional Marxist path which sustains that value is created by labour power and not by money (Carchedi 2009). The use of Monetary Expression of Labour Time (MELT, see Moseley (2015)) is relevant in providing a connection between value in terms of labour time and in money terms. 7
Some implicit formulas related to the main equations
We will solve equations (1), (2), (3) and (4) by using public information. The following system of new equations aims to uncover the path to the available data.
If y is value added, w the payment for labour, r the payment to the capital, k the consumption of fixed capital and t the indirect taxes, then the classic equation to the value added is as follows

The labour share (LS) is defined here as the share of the payment for labour over the value-added, 8 that is to say
Similarly, the capital share (KS) is defined as the share of the payment to the capital (k) over the value-added.
Since the factor of labour encompasses all categories of employees, including management functions, we propose a correction process. To separate the workers as such from the management categories, an adjustment factor β is calculated:
The correction factor is defined as the ratio between the non-management wages (w') over the total wages (w) and is taken yearly from the microdata of the Employment and Unemployment Survey (EOD). 9 It should be noted that equation (10) relates directly to the National Accounts System. In contrast, in equation (11), w derives from the above-mentioned surveys. The β factor in the equation is a positive real number, being less than 1, which impinges on both the labour and capital share. As such, that which reduces the labour share is equal to that which increases the capital share and reflects the migration of managerial functions from payment to workers, to payment to capital. The decision to apply this methodology was taken from the understanding that there is a group, defined by their position as managerial and decision-making posts within the system of capitalist production, that within the Marxist understanding of social classes does not fit into the proletariat but which, on the contrary, is integrated into the exploiting classes (see, for example, Wright (1997)). Considering them as part of the wage bill which defines – in part – the ROSV, contaminates the calculations because the labour force is overestimated. As we appreciate that this methodology – which introduces a β factor- could be argued against, we present a simulation of its impact on the results of the analysis.
Once the correction factor is calculated, the adjusted labour share is

The equation (12) is then used to compute the monetary value of v, which is defined as follows

In equation (13), the NIP is the Net Internal Product expressed at current prices – following Shaikh (2016) – therefore v and s are expressed also at current prices. 10 The monetary expression for s is derived as the supplement of v, that is to say
where MI represents the self-employed workers’ income (following the methodology in Maito (2012)).
It should be noted that NIP is preferred over the gross domestic product (GDP) because it allows the isolation of the impact of depreciation (DK) and therefore of the remaining product after depreciation (to some extent, the ‘real’ product)

The GDP series come from the World Economic Outlook database, although the original source is the Central Bank of Chile. 11 In addition, based on the Ffrench-Davis and Vivanco (2016) document and its annexed tables, a transformation factor (TF) between GDP and NIP has been computed as the ratio between NIP and GDP. The series of Ffrench-Davis and Vivanco (2016) covers the period from 1960 to 2015. For the 2016–2018 data, an average of the transformation factors for the past 7 years was used. Then NIP has thus been calculated as follows:

The selected base year for constant prices is 2013, therefore, as Ffrench-Davis and Vivanco (2016) use 2008 as their base year, their figures were converted to 2013 as the new base year. 12 The transformation ratio is computed after this adjustment has been applied.
To distinguish advanced variable capital from consumed variable capital, we follow the methodology of Maito (2012) and apply capital turnover (‘n’), which is calculated as the ratio between total costs (TC = wage bill + intermediate consumption + consumption of fixed capital) and inventory of stock in the economy (I). That is to say

Between the years of 1986 and 2009, both TC and ‘n’ are found in Maito (2012). The series is extended for the following years. Once capital turnover (‘n’) has been calculated, it is possible to calculate the wage bill by taking into account the number of turnovers annually (ROSV adjusted by capital turnover, also called Annual ROSV). In this ROSV, ‘v’ is the advanced variable capital. In the case where turnover is not taken into consideration, ‘v’ is the consumed variable capital. We handle both concepts.
The Net Capital Stock as a proxy for ‘c’
For the Net Capital Stock, the series published by Henríquez (2008) were used, in particular that which excludes the housing component. This series corresponds to fixed constant capital. Data up to 2019 expressed in Chilean pesos of 2013 are available from the Central Bank of Chile. The Net Capital Stock uses reposition prices which we recognize as having limitations in that, as explained by Andrew Kliman, valuation at historic prices is more precise in Marxist terms 13 (Kliman 2009).
Other sources
Intermediate consumption (i.c) is obtained from National Accounts, from the various yearbooks available. 14 Figures were collected at current prices.
Capital depreciation is drawn from Ffrench-Davis and Vivanco (2016) and from the Central Bank (updated series).
The total number of employees (L) is defined as follows:

where O is the total number of people in employment and δ a factor for the share of employees over total employment population. L is drawn from Díaz Lüders and Wagner (2016) and updated with the microdata of the National Employment Survey. The factor δ is drawn from the EOD.
Since our data does not differentiate between the public and private sectors, we include capital and wages from both the private sector (productive and financial) and public sectors in our calculations.
Results
Up to now, we have discussed previous research, theoretical sources and the implementation methodology to carry out a Marxist economic analysis. Below are the results of the empirical exercise. Following the traditions applied to this type of estimations (Maito 2012; Roberts 2016), we work with aggregate figures; a more detailed approximation (which could be applied to examine the economy at sector level) is beyond the scope of this research.
Overall outlook
There is no doubt that the country’s economy has grown substantially in the last few decades. The economy has grown because there are more means of production (capital), which are used to create and distribute the goods which are consumed and exported (Figure 1).
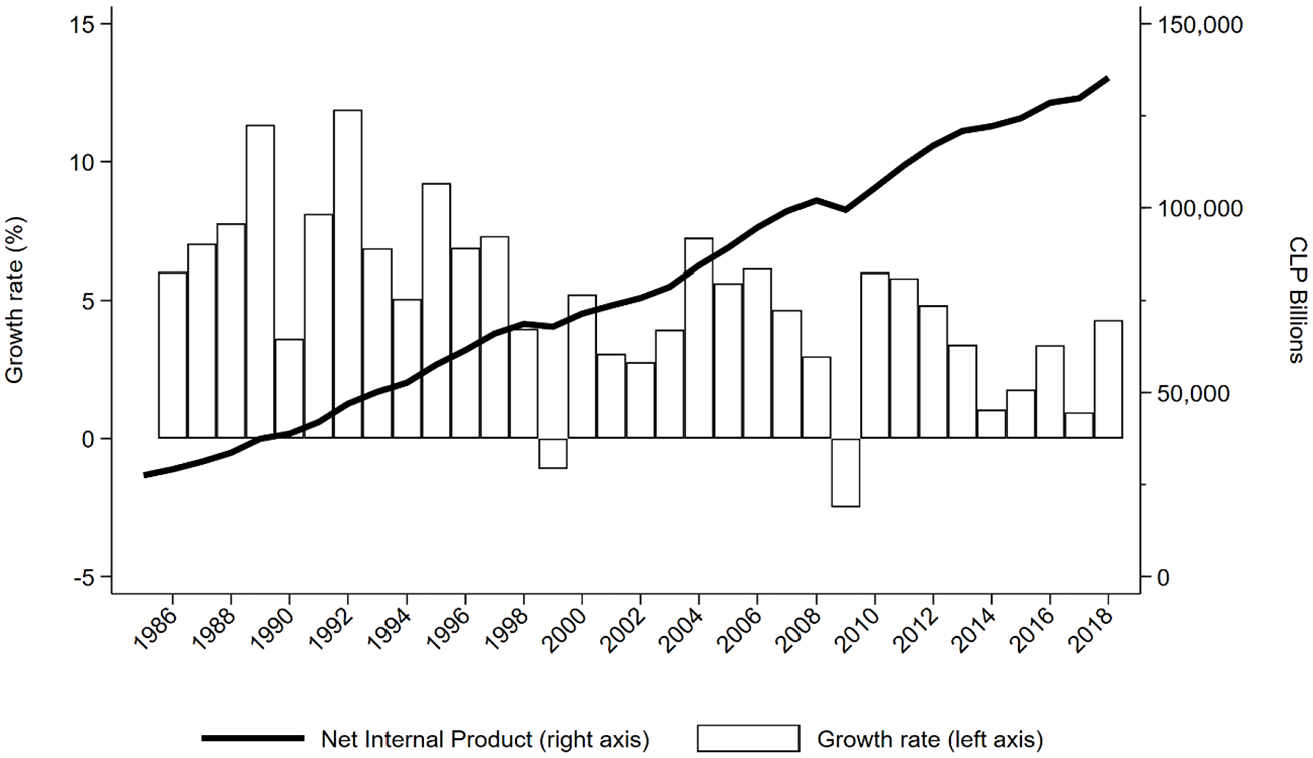
Net Internal Product (NIP) at constant prices of 2013.
We can see that the NIP (i.e. GDP with capital depreciation subtracted) has increased in general terms, 15 but the pace of growth has fluctuated dramatically (Figure 2). That is, from the time of the Aylwin government until 1998 (when the Asian crisis began), the rate of growth dropped from an average of 7% to negative figures in 1999. Then it rose to 4% during the copper boom, to rise again slightly from 2013 to 2018.
Investment
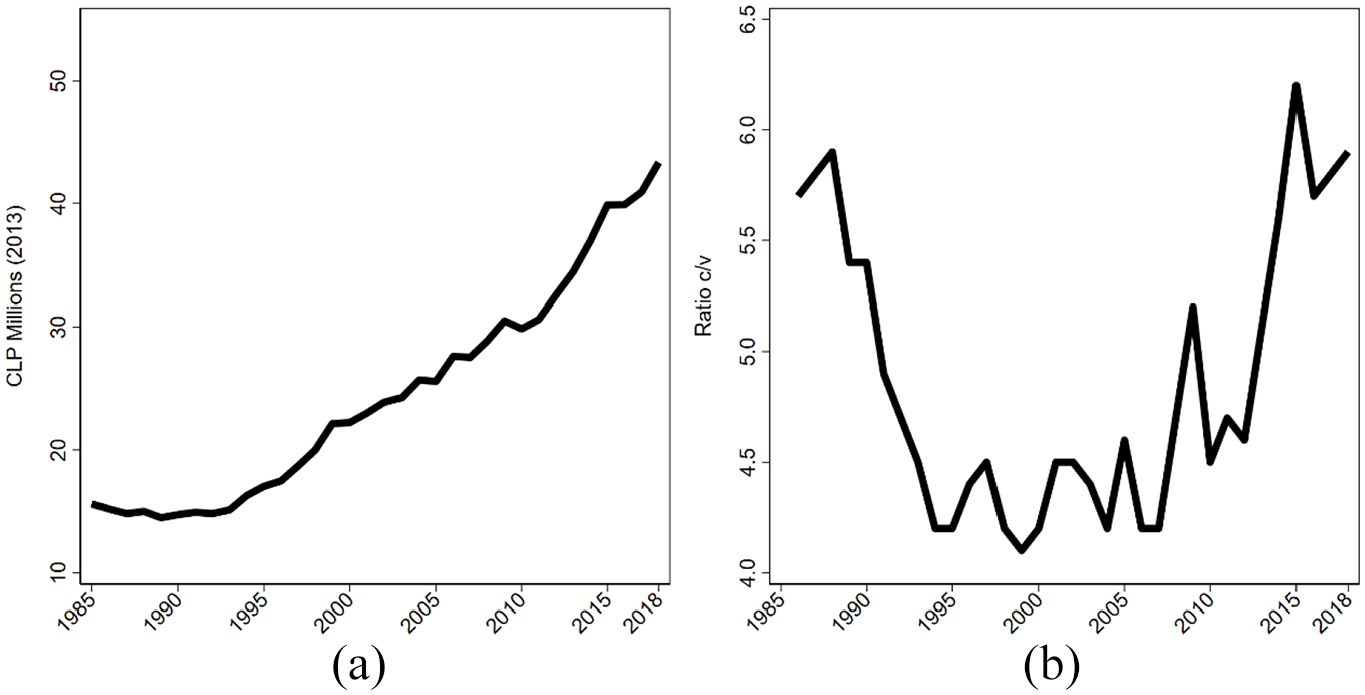
Capitalists make use of their investments and, consequently, have to renew them because investments in competitive conditions serve to make good business (Figures 2 and 3).
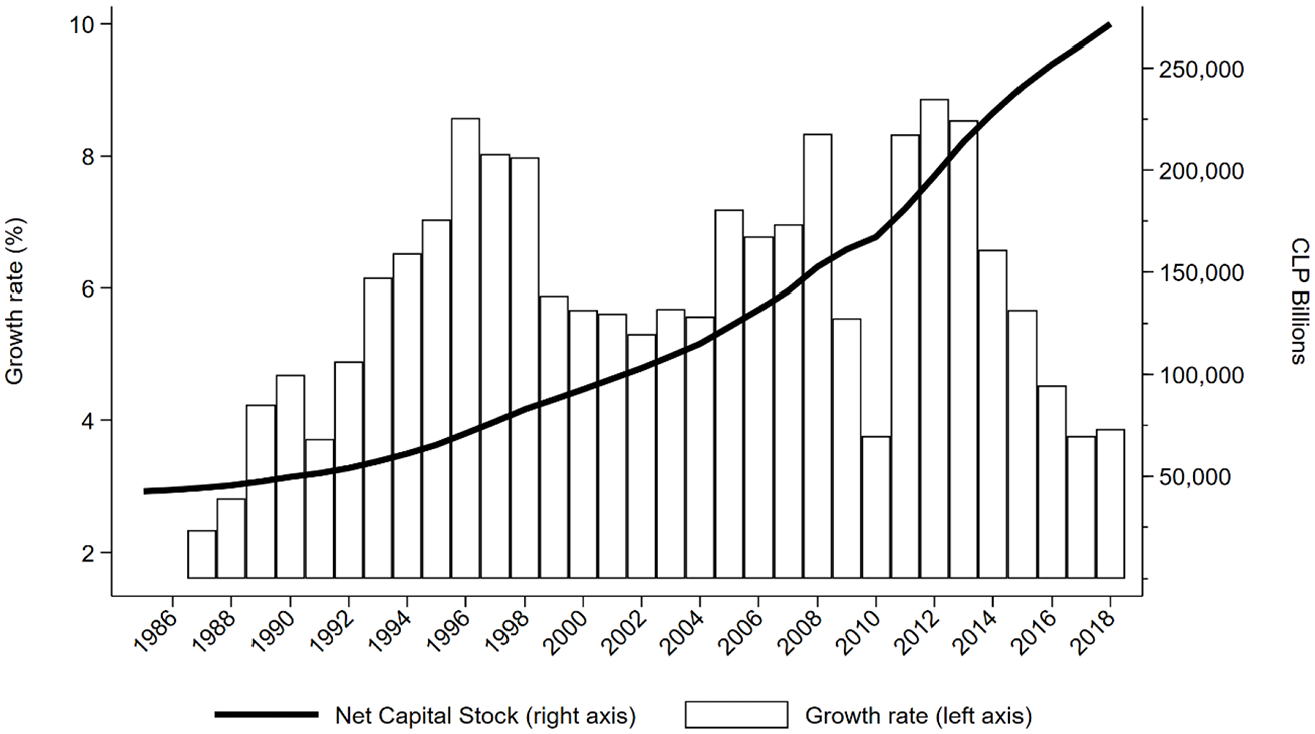
Net Capital Stock at constant prices of 2013.
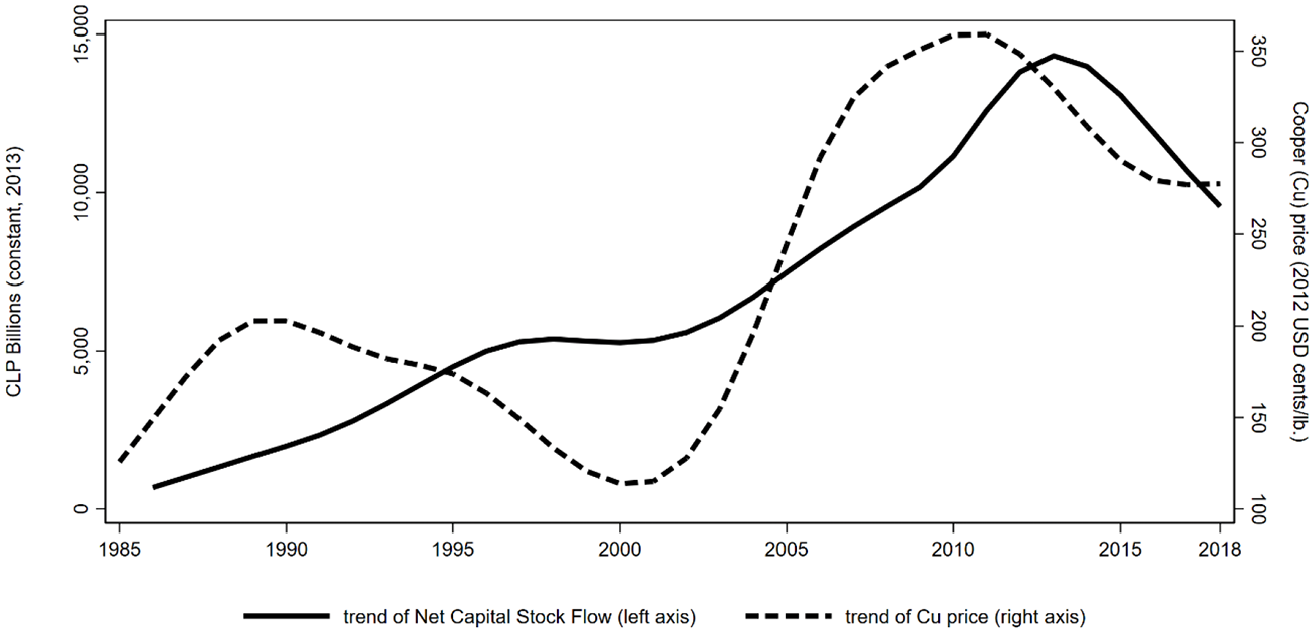
Net Capital Stock flow and cooper price.
Net annual capital investment grew at a phenomenal rate during the copper ‘super cycle’ (circa 2004–2014), but soon dropped off. The Chinese economy had taken off and its national and multinational electrical and electronic goods factories needed more and more copper. As a consequence, the international copper price rose quickly as did Chile’s copper export volume (Figure 3).
Moreover, data reveal that employers reinvest some – a small fraction – of their profits. They take the rest (around 80%) home or pay out their shareholders (Figure 4). Of course, the employers are also shareholders.
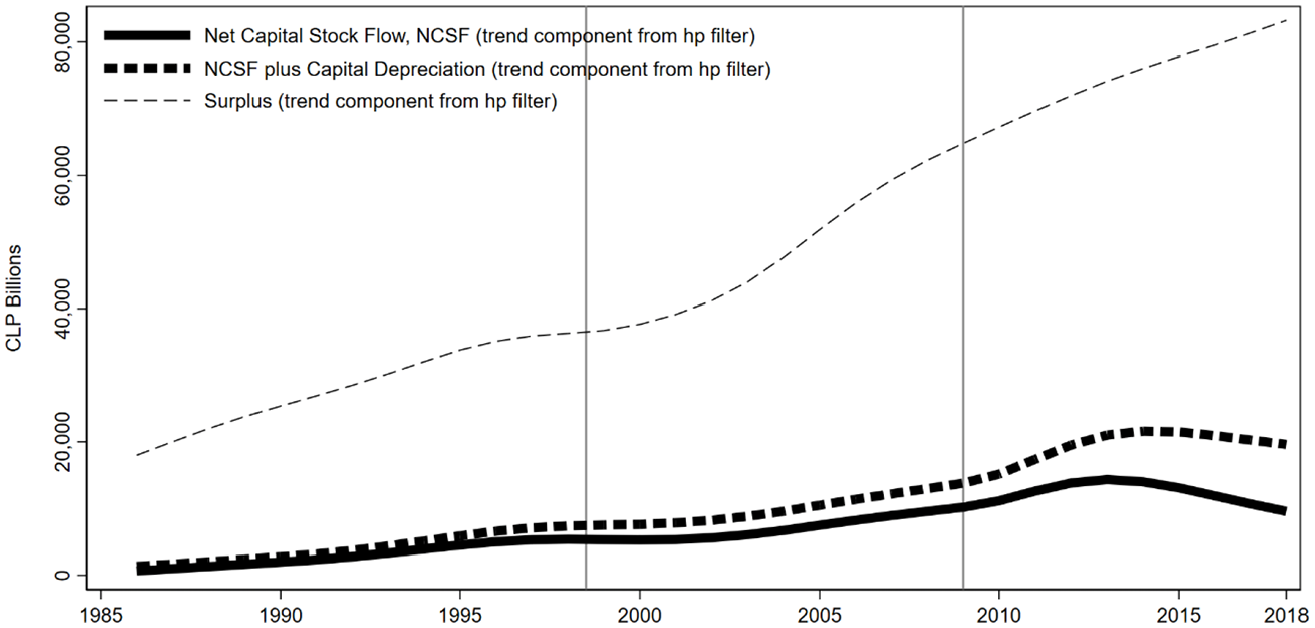
Net Capital Stock flow, capital depreciation and surplus.
As such, it seems that the Chilean profit-making mechanism generates golden eggs. Recent research revealed that the wealthy (2% of the population) in Chile are as rich as rich Germans (also 2% of the population), but the poor are as poor as those in Mongolia (Milanovic 2019).
ROSV in working hours
Workers that make this investment ‘work’, receive a wage but also generate the profits. It is the worker that finances his or her own wage, but also the profits, with his or her labour.
We can see clearly, that the worker labours 3 hours for his wage, but 5 for the employer’s profits (in a working day of 8 hours). If capital turnover is taken into account, the figures are 7 hours for the employer and only one for the worker (see Figure 5(a)). The worker can labour without a boss, but the boss cannot make profits without the worker.
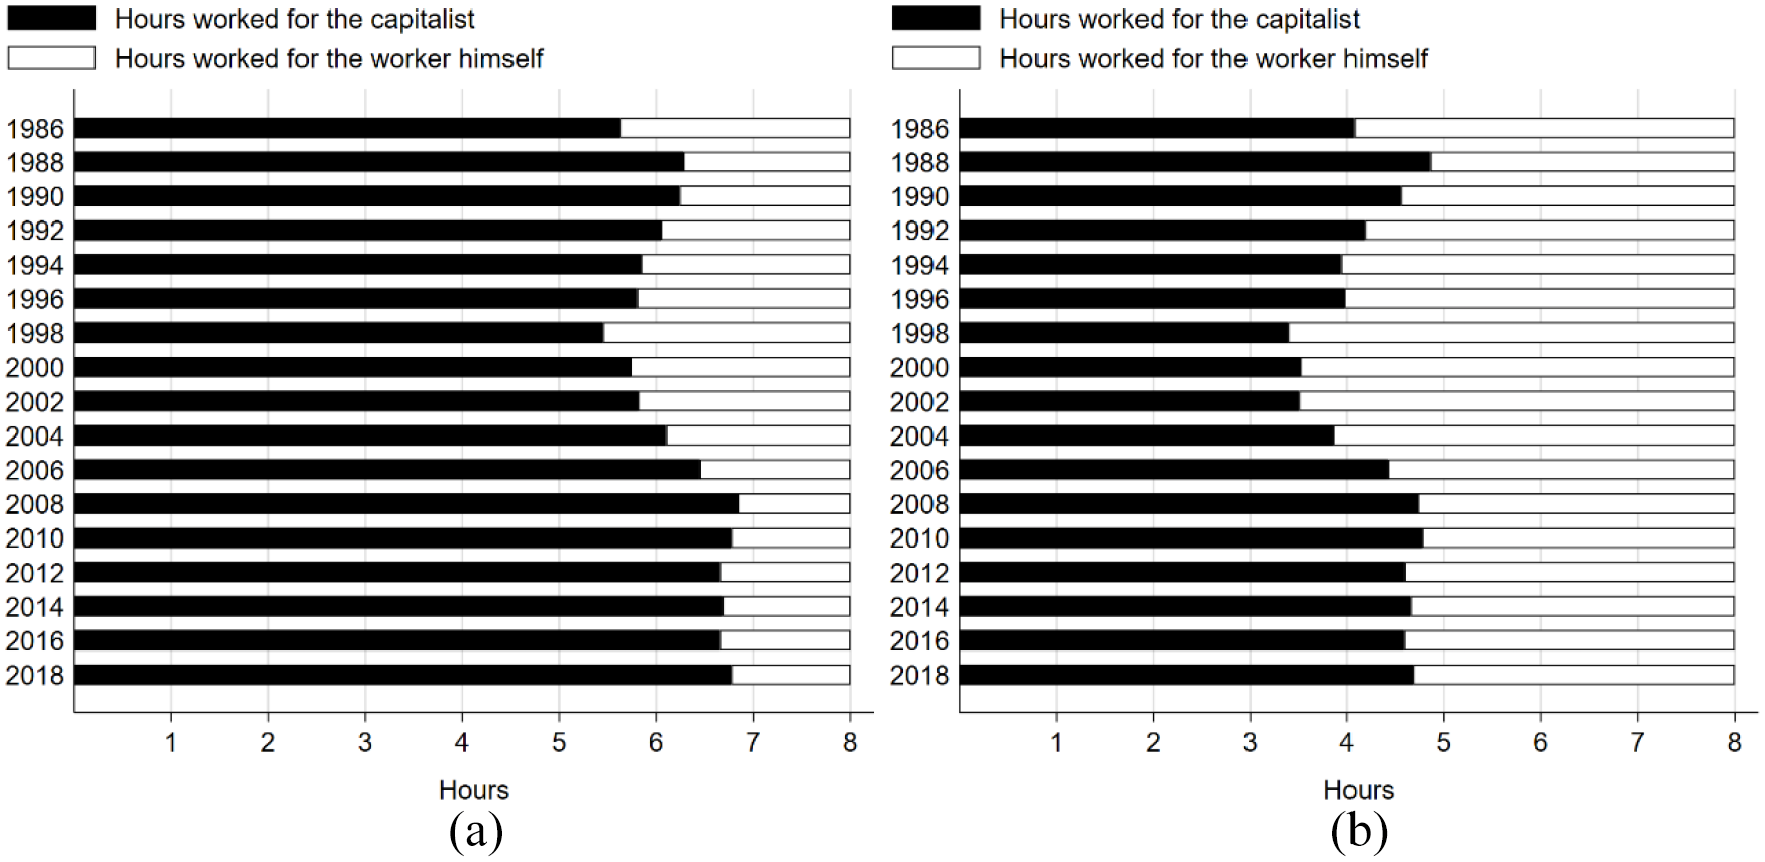
ROSV expressed in working hours and based on an 8-hour workday: (a) ROSV adjusted by capital turnover (b) ROSV unadjusted by capital turnover.
Organic Composition of Capital, ROP and ROSV
This investigation has noted that capital grows with new investment, and it is also true that each worker activates progressively more means of production. The extent of the capital that each worker puts into motion can be measured in two ways. First, by measuring the amount of capital that each worker uses (Figure 6(a)). Or second, by measuring the value of that capital compared with the wages (Figure 6(b)). In either case, we measure the relation between ‘accumulated dead human labour’ and ‘living human labour’.
(a) Approximation to Technical Composition and (b) Organic Composition.
We recognize that the Technical Composition of Capital is the relation of the mass of capital per worker, and that it is impossible to quantify this ‘mass’. We therefor use a proxy, which is the value of capital per worker. It is clear that this value is not the same as the mass, because it does not take into account if the value of each unit of capital has fallen or risen (see discussion in Fine and Harris (1979).
In the case of the Organic Composition, ‘dead’ human labour accumulated in machinery and so on, first falls in relation to the value of living human labour measured as wages. That is to say, accumulated labour rises less than living labour expended by the use of labour power. Why is this? Because efficient capital from other countries, for example, from China, was imported at relatively very low cost. And also, because wages rose during the 1990–2000 period. That is to say, relatively little was spent on ‘dead labour’ in relation to ‘living labour’ during that period.
We understand that it is ‘living’ labour itself that generates profits and not accumulated ‘dead’ labour as machines and buildings, if wages rise relatively to profits then the is less exploitation. If profits rise relatively to wages then there is more. We have seen that during the 1990–2000 period, workers activated more capital, but the cost of that capital was relatively low. In other words, capital in motion increased but at a low cost, and exploitation dropped because wages rose in relation to profits. As a consequence, the fraction of profits to capital and wages dropped and the ROP fell (Figures 7 and 8).
Rate of Profit (%) adjusted by capital turnover. Thick lines represent trends, thin lines the observed values.
Rate of Surplus-Value (%) adjusted by capital turnover. Thick lines represent trends, thin lines the observed values.
In contrast, during the copper super-cycle period of 2004–2009, profits related to wages went up enormously due to the rise in copper prices, but new capital was still imported at low cost and wages were relatively constant. In other words, profits went up relatively to capital and wages and the ROP rose as a consequence.
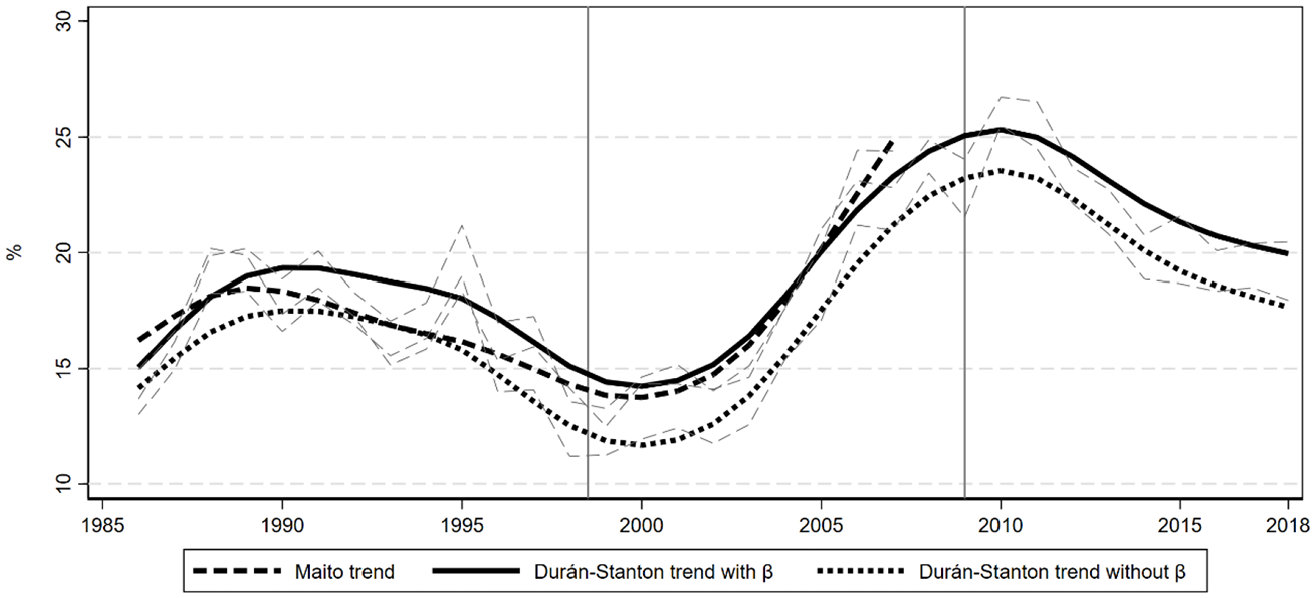
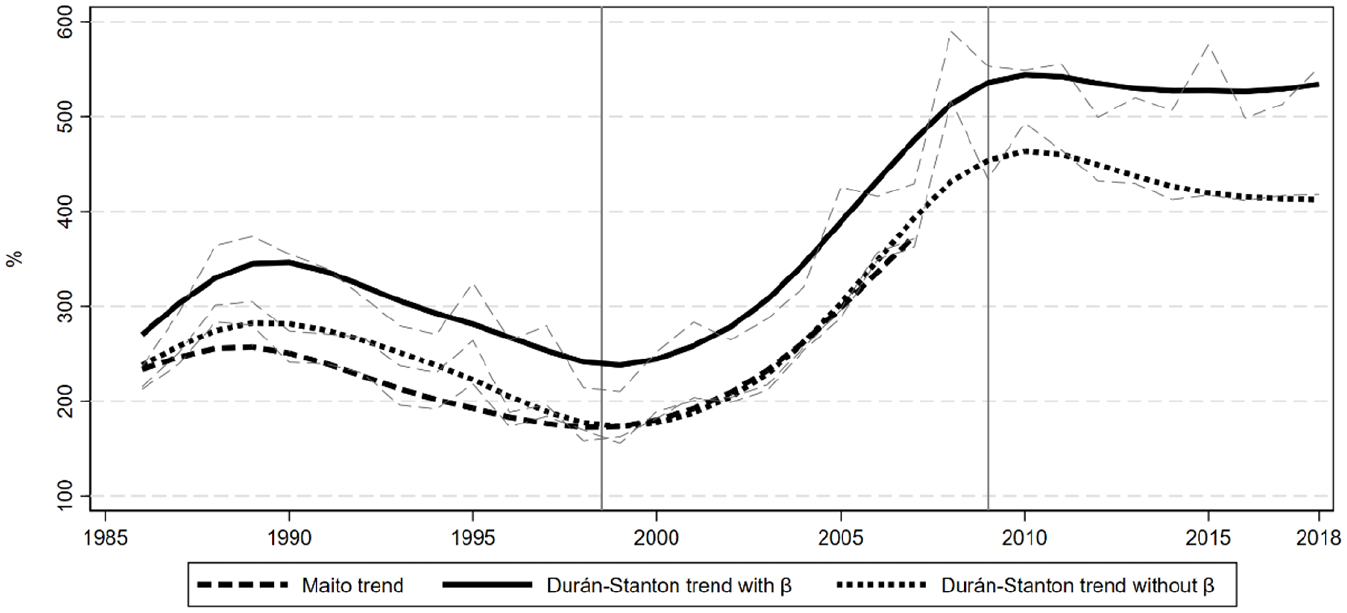
We have seen, in these two periods, a fall and then a rise in the ROP, and a fall and then a rise in the Rate of Exploitation (Figures 9 and 10).
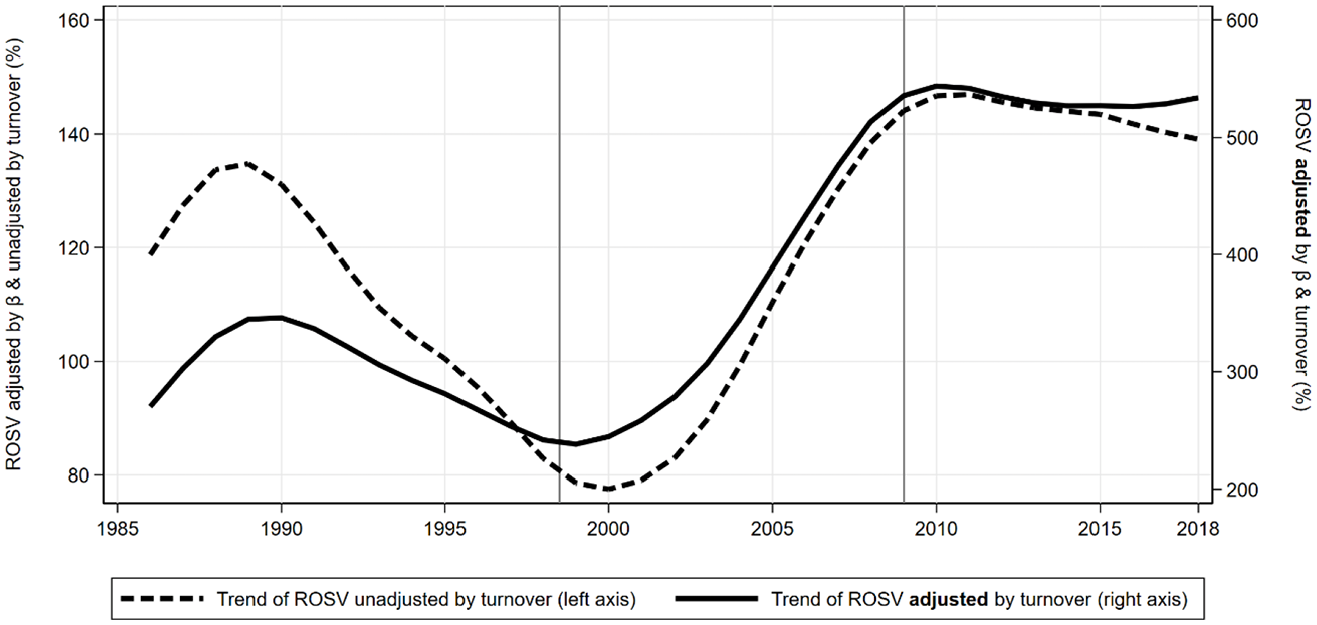
Trends of Rate of Surplus-Value (%) adjusted and unadjusted by capital turnover and β.
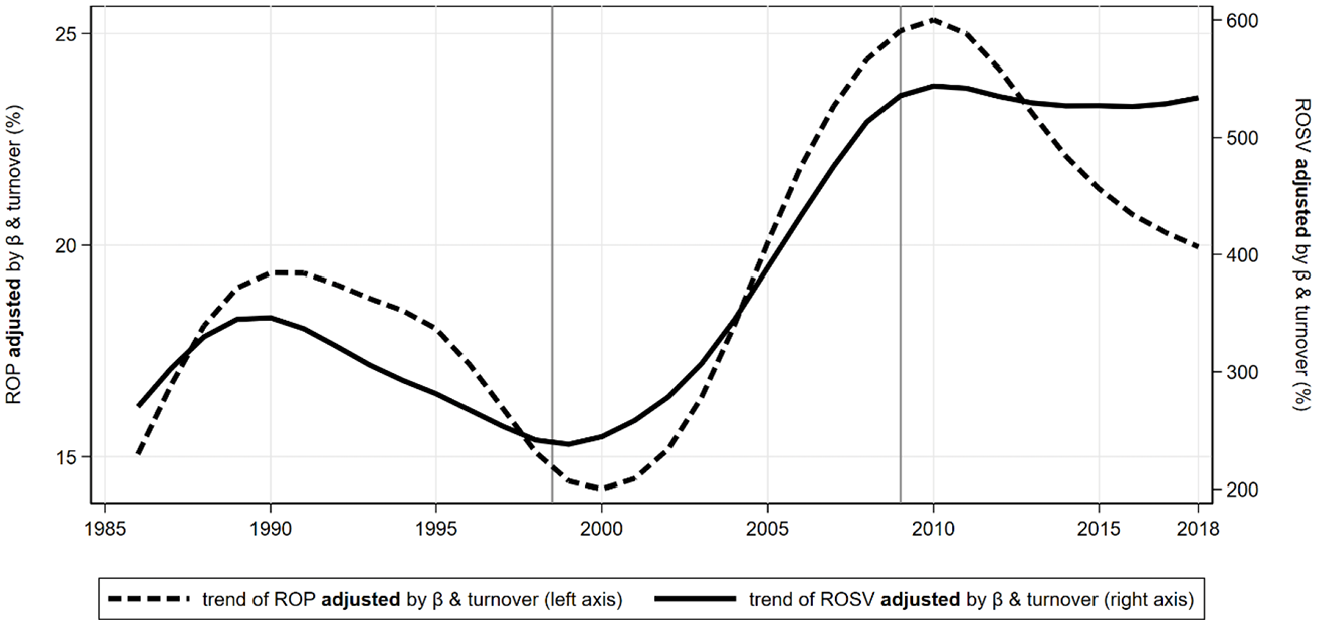
Trends of Rate of Profit and Rate of Surplus-Value (%) adjusted by capital turnover and β.
Once the copper boom finished, profits tended to fall from their previously high levels although they remain at the pre-crisis level of 2005, the rate of exploitation stayed level at 5 (or seven, if turnover is taken into account) of an 8-hour working day, and capital investment continued to rise but more slowly. As a consequence, the ROP fell and the economy was relatively less profitable.
To sum up, living human labour activated relatively more accumulated dead labour, the fraction of living labour – source of profits – relative to dead labour, fell and the economy lost momentum because profits are the means and end to the success for the employers and those profits were in relatively short supply. Employers also went on a ‘investment strike’ when they thought that the government of Michelle Bachelet was about to change the tax laws.
Attention is now focused on the economic performance of the last decade. The observations we made above, clearly show that both the ROSV and the ROP have risen and fallen, according to the relative changes in profits, wages and the composition of capital. The analysis is now applied to the last decades.
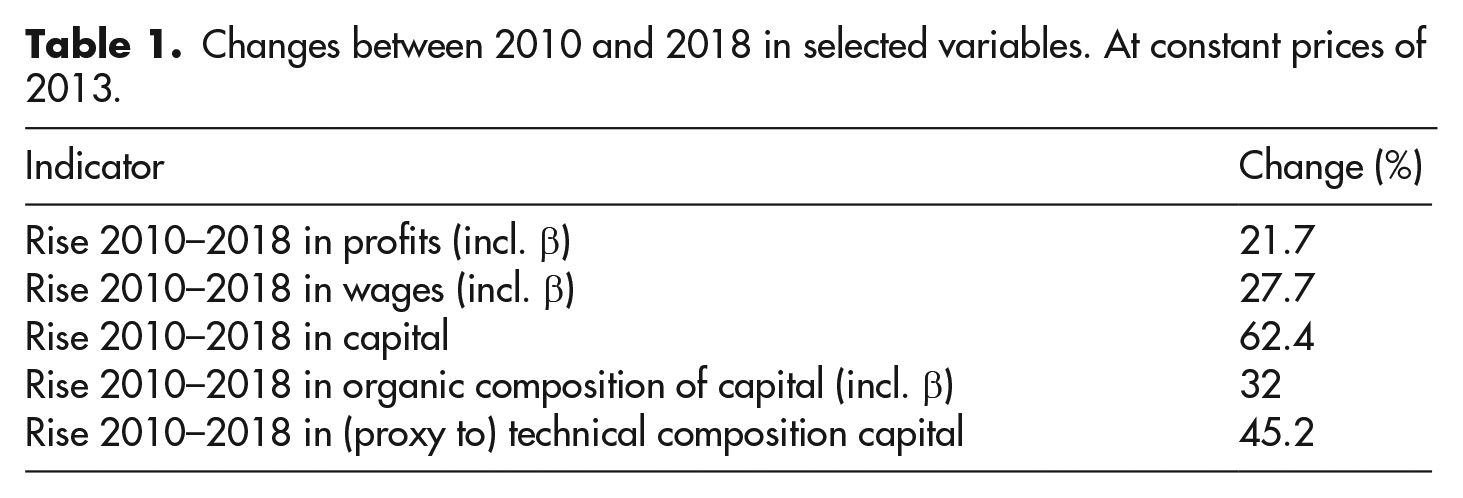
First, changes in these indicators are presented (Tables 1 and 2):
Changes between 2010 and 2018 in selected variables. At constant prices of 2013.
Rate of Surplus-Value and Rate of Profit between 2010 and 2018. Adjusted by β.
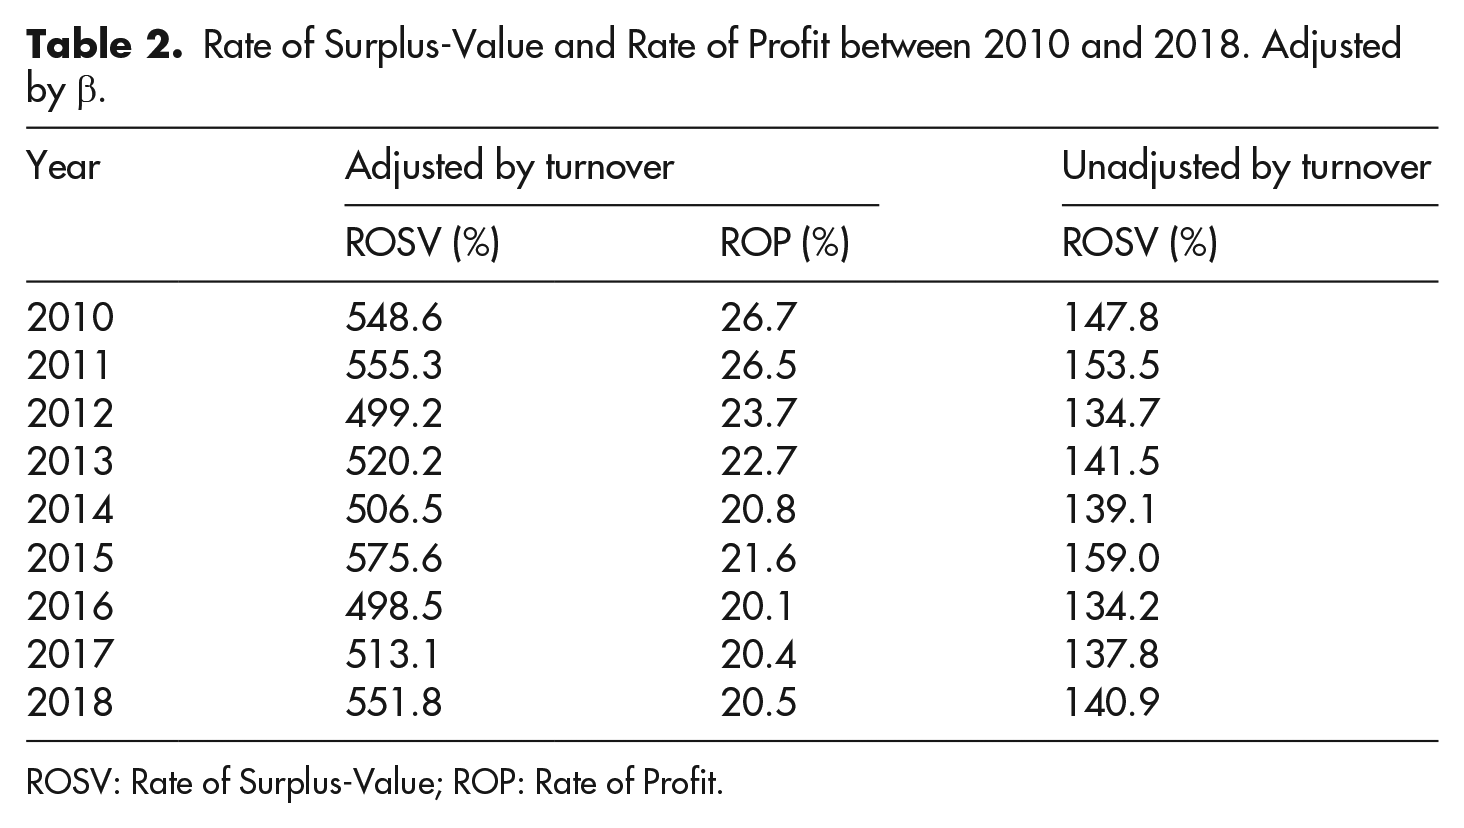
ROSV: Rate of Surplus-Value; ROP: Rate of Profit.
It can be seen that the rise in capital employed is double that of both variable capital (wages) and surplus value (profits). The magnitude of this difference in growth is itself sufficient to explain the continuous fall in the ROP of some 6 percentage points during the period.
The similar rates of growth in profits and wages caused no pronounced trend in the ROSV. 16
The rise in (the approximation to) the Technical Composition of Capital double that of wages and profits, indicates that the workers activated substantially larger amounts of capital. The value of the new capital was relatively low (but not as low as the period of 1990 onwards), as indicated by the lower rise in the Organic Composition compared with that of the proxy for the Technical Composition and the substantially higher rate of increase of capital.
An inspection of the dynamics of the growth of Fixed Capital Stock ‘c’, surplus value ‘s’ and variable capital ‘v’ identifies that, from 2010, the rate of growth of ‘c’ leads that of ‘s’ and ‘v’. This tendency is different from that found after 2000, when ‘s’ led ‘c’ and ‘v’. The consequence of the tendency found after 2010 is that the ROP exhibits a renewed tendency to fall. In the case of the ROSV, the tendency is practically static, as can be observed in Figure 11.
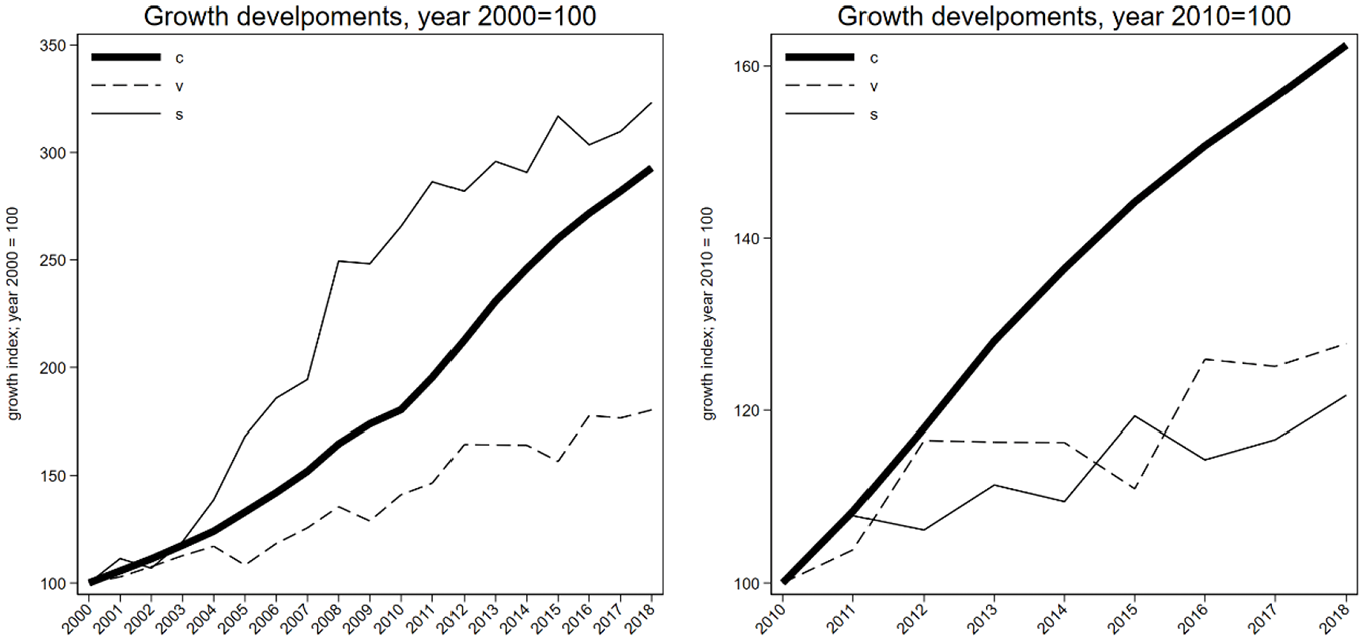
Growth developments in c, v and s. Adjusted by β.
Conclusion
At the beginning of this work, the challenge was stated clearly: to investigate the dynamics of the economy from the point of view of companies that are in the business of making profits. During the development of the investigation, we measured the profits which are born from that unpaid work, which is carried out after the worker has financed his own wage with his work. The surplus value generated by labour power must be enough to finance posterior capital investment, and also to give the good life to those who buy that human capacity.
As such, the dynamics of profit depends not only on the mass of generated profits, but also on the mass of profits that is needed to keep the economic motor running smoothly. It is the law of the ROP that measures this relation between surplus value and accumulated capital. The methodology that Marx uses to investigate this law is that used throughout Capital. That is to say, he eliminates those elements which are not essential for the relation under investigation: the value in each unit of constant capital is ‘fixed’, as is the rate of exploitation.
Once these conditions are imposed, once this ‘abstraction’ is made, an increase in constant capital (imposed by competition between capitalists) results in a fall in the ROP. In other words, when constant capital is accumulated, more and more surplus value is needed to finance this accumulation but there is relatively little surplus value available compared with the great amount needed.
Capitalists can make more constant capital available in two ways: cut the value of labour power and in that way increase the rate of exploitation, or lower the value in each unit of constant capital, making it easier to buy. These alternatives are among those ‘Counteracting Influences’ that Marx carefully investigates.
But when we close in on the economic conditions which operate in reality, in other words when those initial limiting conditions of analysis are discarded, it is clear that the value of each unit of fixed capital could de higher or lower, as could that of labour power and as a consequence the rate of exploitation could rise or fall.
We have seen that the ROP falls under conditions of ‘equilibrium’. However, under those conditions closer to real economic life, the rate could fall, but also rise.
The challenge, then, is to investigate real life conditions and their consequences; we find that it is competition between capitalists which forces them to find ways to lower the cost of new constant and variable capital. It is this competition between capitalists that forces them to search for cheaper constant capital and, raise the ROSV. It is this competition that forces each capitalist to invest more than ‘the competition’ and find ways to cut his or her relative costs and so improve profits because he or she can sell at near market prices, but with lower than market costs.
However, we have seen that the operation of different real life conditions (which are different from those ‘equilibrium’ initial limits), generate various – and different – changes in the ROP: The 1990–2000 decade started the relaxation after the dictatorship and introduced an indispensable improvement in the standard of living of the population, with the aim of stabilizing the historical process of ‘controlled transition’ and preparing the way to higher levels of investment. That process started the investment of large amounts of constant capital at low prices; the value of labour power rose, the approximation to the Technical Composition of Capital started to rise but the Organic Composition of Capital (OCC) fell steeply and the rate of exploitation fell. All in all, the combination of these changes was a fall in the ROP.
The decade of 2000–2010 was the great decade of the copper super-cycle, which drove the importation of great amounts of capital and an enormous rise in profits to levels way above the normal. Enormous amounts of cheap constant capital were invested, the value of labour power did not change greatly, the approximation to the Technical Composition continued to rise and the OCC also started to rise. Profits rose quickly because of high priced copper exports to China, as did the rate of exploitation. As a consequence of these changes, the ROP rose.
The decade of 2010–2018 was that of ‘post copper’. The end of the 2004–2014 cooper boom led to a fall in the rate of investment (although up to 2014, investment continued at a high level), a relative fall in the increase of profit levels (although profits remained high and cooper prices stayed at the levels reached in 2005, see Figure 3), but wages continued without major changes. Economic stagnation under these conditions can be observed through the fall in the ROP, although the rate of exploitation stayed relatively stable because wages rose at the same moderate rate as profits, the approximation to the Technical Composition continued to rise as did the OCC.
Footnotes
Notes
Author biographies
![]()