
Abstract
Diffuser Augmented Wind Turbines (DAWTs) offer higher power outputs than a bare wind turbine of the same size. Most DAWTs have the rotors at the diffuser throat but Bagheri-Sadeghi et al. suggested that optimal power may be obtained with the rotor located on the verge of the flow separation point and for a diffuser angle higher than normal. This proposition was tested by 3D computational fluid dynamics (CFD) simulations on nine small DAWTs with diffuser angles over a standard range. The test results indicate that higher power output can be obtained from DAWTs with the rotor placed aft of the diffuser through the throat and with longer blade span than those with rotor at the throat. Some DAWTs had low power output suffer from severe airflow leakages through the blade plane, both azimuthally and radially. An azimuthally non-uniform flow separation was induced when the rotor was placed close to the diffuser exit. A blade tip vortex was detected in all tested geometries.
Introduction
Diffuser Augmented Wind Turbines (DAWTs) can produce higher power outputs than their bare counterparts principally due to the diffuser inducing higher wind mass flow rate through the turbine (Ding et al., 2023; Lilley and Rainbird, 1957; Lipian et al., 2020; Rahmatian et al., 2022). The throat of the diffuser has the smallest cross-sectional area, resulting in the highest average wind velocity. Furthermore, for an empty airfoil-profiled diffuser, the average axial wind velocity can be greater than U∞, the upstream wind velocity, by more than 50% with the velocity gain much higher near the diffuser wall (ten Hoopen, 2009; Kesby et al., 2017; Song et al., 2019; Bontempo et al., 2023). With an appropriately designed blade, this velocity profile can result in higher turbine power generation improving the attractiveness of DAWTs. Drawn by the high wind mass flow rate and by extension, a reduction in cut-in speed, many engineers accept the limitation to the blade span and place the DAWT rotor at the diffuser throat (Bontempo and Manna, 2020b; Igra, 1975; Kogan et al., 1961; Song et al., 2019; Van Dorst, 2011; Vaz et al., 2021).
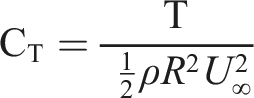
Having the rotor placed at the throat, the DAWT rotor is exposed to a higher average axial airflow, but imposes a limit to the blade span, which is also a vital controlling parameter to the turbine power output. Using the actuator disc model in Computational Fluid Dynamic (CFD) simulations, a series of optimisation processes were carried out (Bagheri-Sadeghi et al., 2018, 2021) to determine the maximum power output from a DAWT, by adjusting the following variables: (a) Coefficient of Thrust, (CT): defined as (b) diffuser Angle, (α): angle between turbine axis and chord line of diffuser profile (c) clearance between Blade Tip and Diffuser wall (k) (d) rotor axial position (x): axial distance between the diffuser leading edge and the rotor
Bagheri-Sadeghi et al. (2018, 2021) indicated that the power coefficient does not vary significantly with x when α ≈ 28°, and that the optimal Cp can be achieved by placing the rotor aft of the throat with the blade tip very close to the diffuser wall on the verge of the flow separation. Their test range for α was predominantly over 25°. With these high values of α, flow separation is very active inside the diffuser, and unsteady flow and restricted wake expansion may be entailed which are not desirable in DAWT design (De Vries, 1979). The diffuser angle of many DAWTs is less than 20° and possibly down to 6° to avoid flow separation development (Hansen et al., 2000; Igra, 1977, 1980; Van Dorst, 2011). As such, it is prudent to further investigate the relationship between power output and x with lower α values.
DAWTs were designed to have the rotor placed at the throat based on the favourable velocity profiles in an empty diffuser, whereas the velocity profile on the ‘rotor plane’ in an operating DAWT is very different based on CFD simulations using actuator disc model (Hansen et al., 2000). In a ‘real’ DAWT, the rotor is a solid and the ‘rotor plane’ does not exist. To determine the power output of a ‘real’ DAWT, it is more accurate to simulate the flow around the rotor blades, and in so doing, determine the power output and Cp of the turbine. The easiest way of undertaking this work is through 3D CFD simulations. Although this approach is computationally time consuming, it has become increasingly popular due to the availability of comprehensive CFD simulation software to consider a broad range of design configurations (Bontempo and Manna, 2020a; Song et al., 2019; Zahle et al., 2018). Furthermore, it is possibly the simplest and most accurate approach to acquire the aerodynamic data of an operating turbine, given that it is extremely difficult to accurately measure the flow inside the swept circle and behind the blades.
This study used a 3D solver in CFD simulations to compare the airflow distributions in DAWTs with the rotor placed at the diffuser throat and aft of the diffuser throat at two locations with similar parametric conditions. There are three geometries in each of the three sets. The tested α values were 8°, 12° and 16°, all below the α range tested by (Bagheri-Sadeghi et al., 2018, 2021). R and x were the other two adjusting variables. The next section describes the set-up of the base model used for the CFD simulations, the validation of the predicted results compared to experimental data, and the derivations of the other tested models.
CFD simulation model description and validation
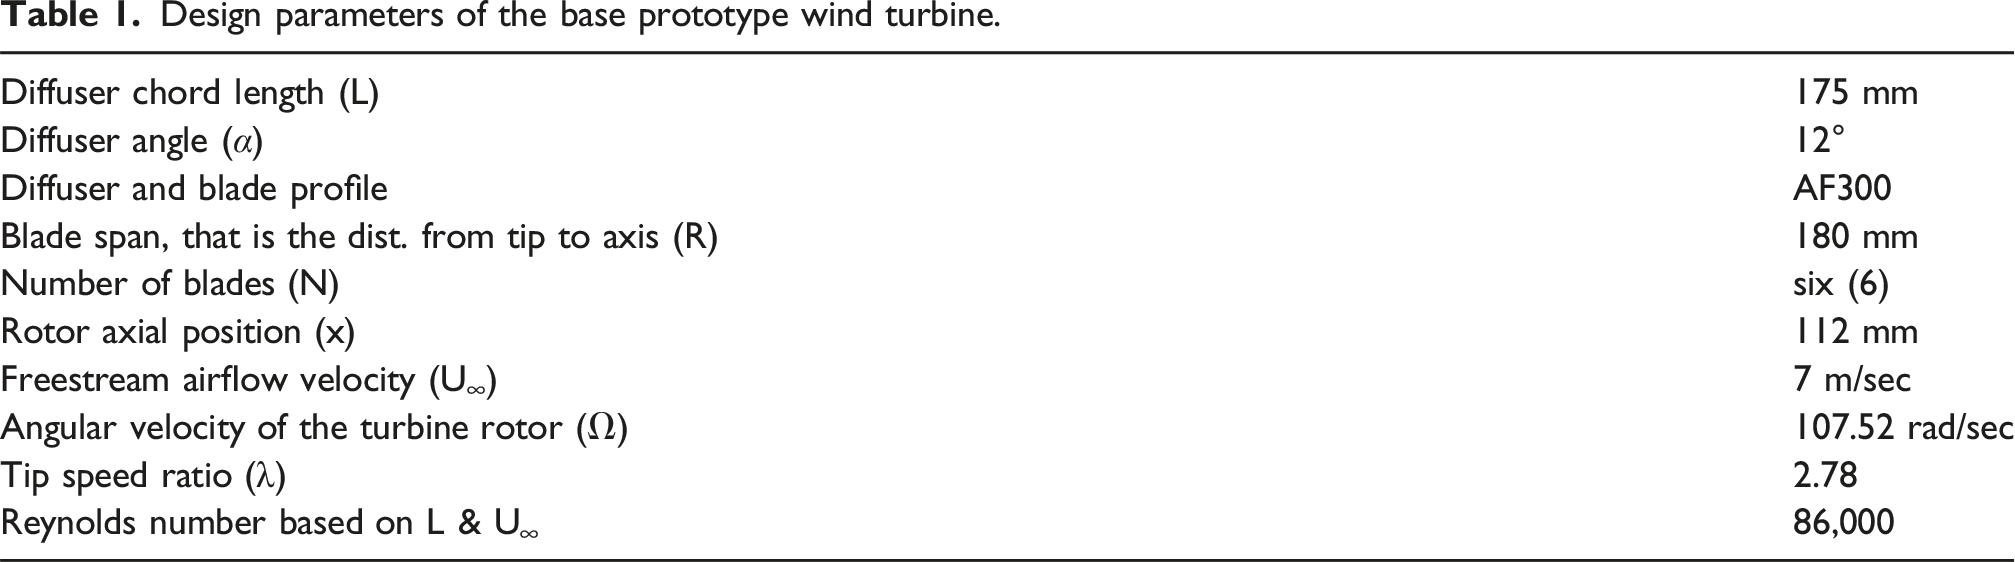
Design parameters of the base prototype wind turbine.
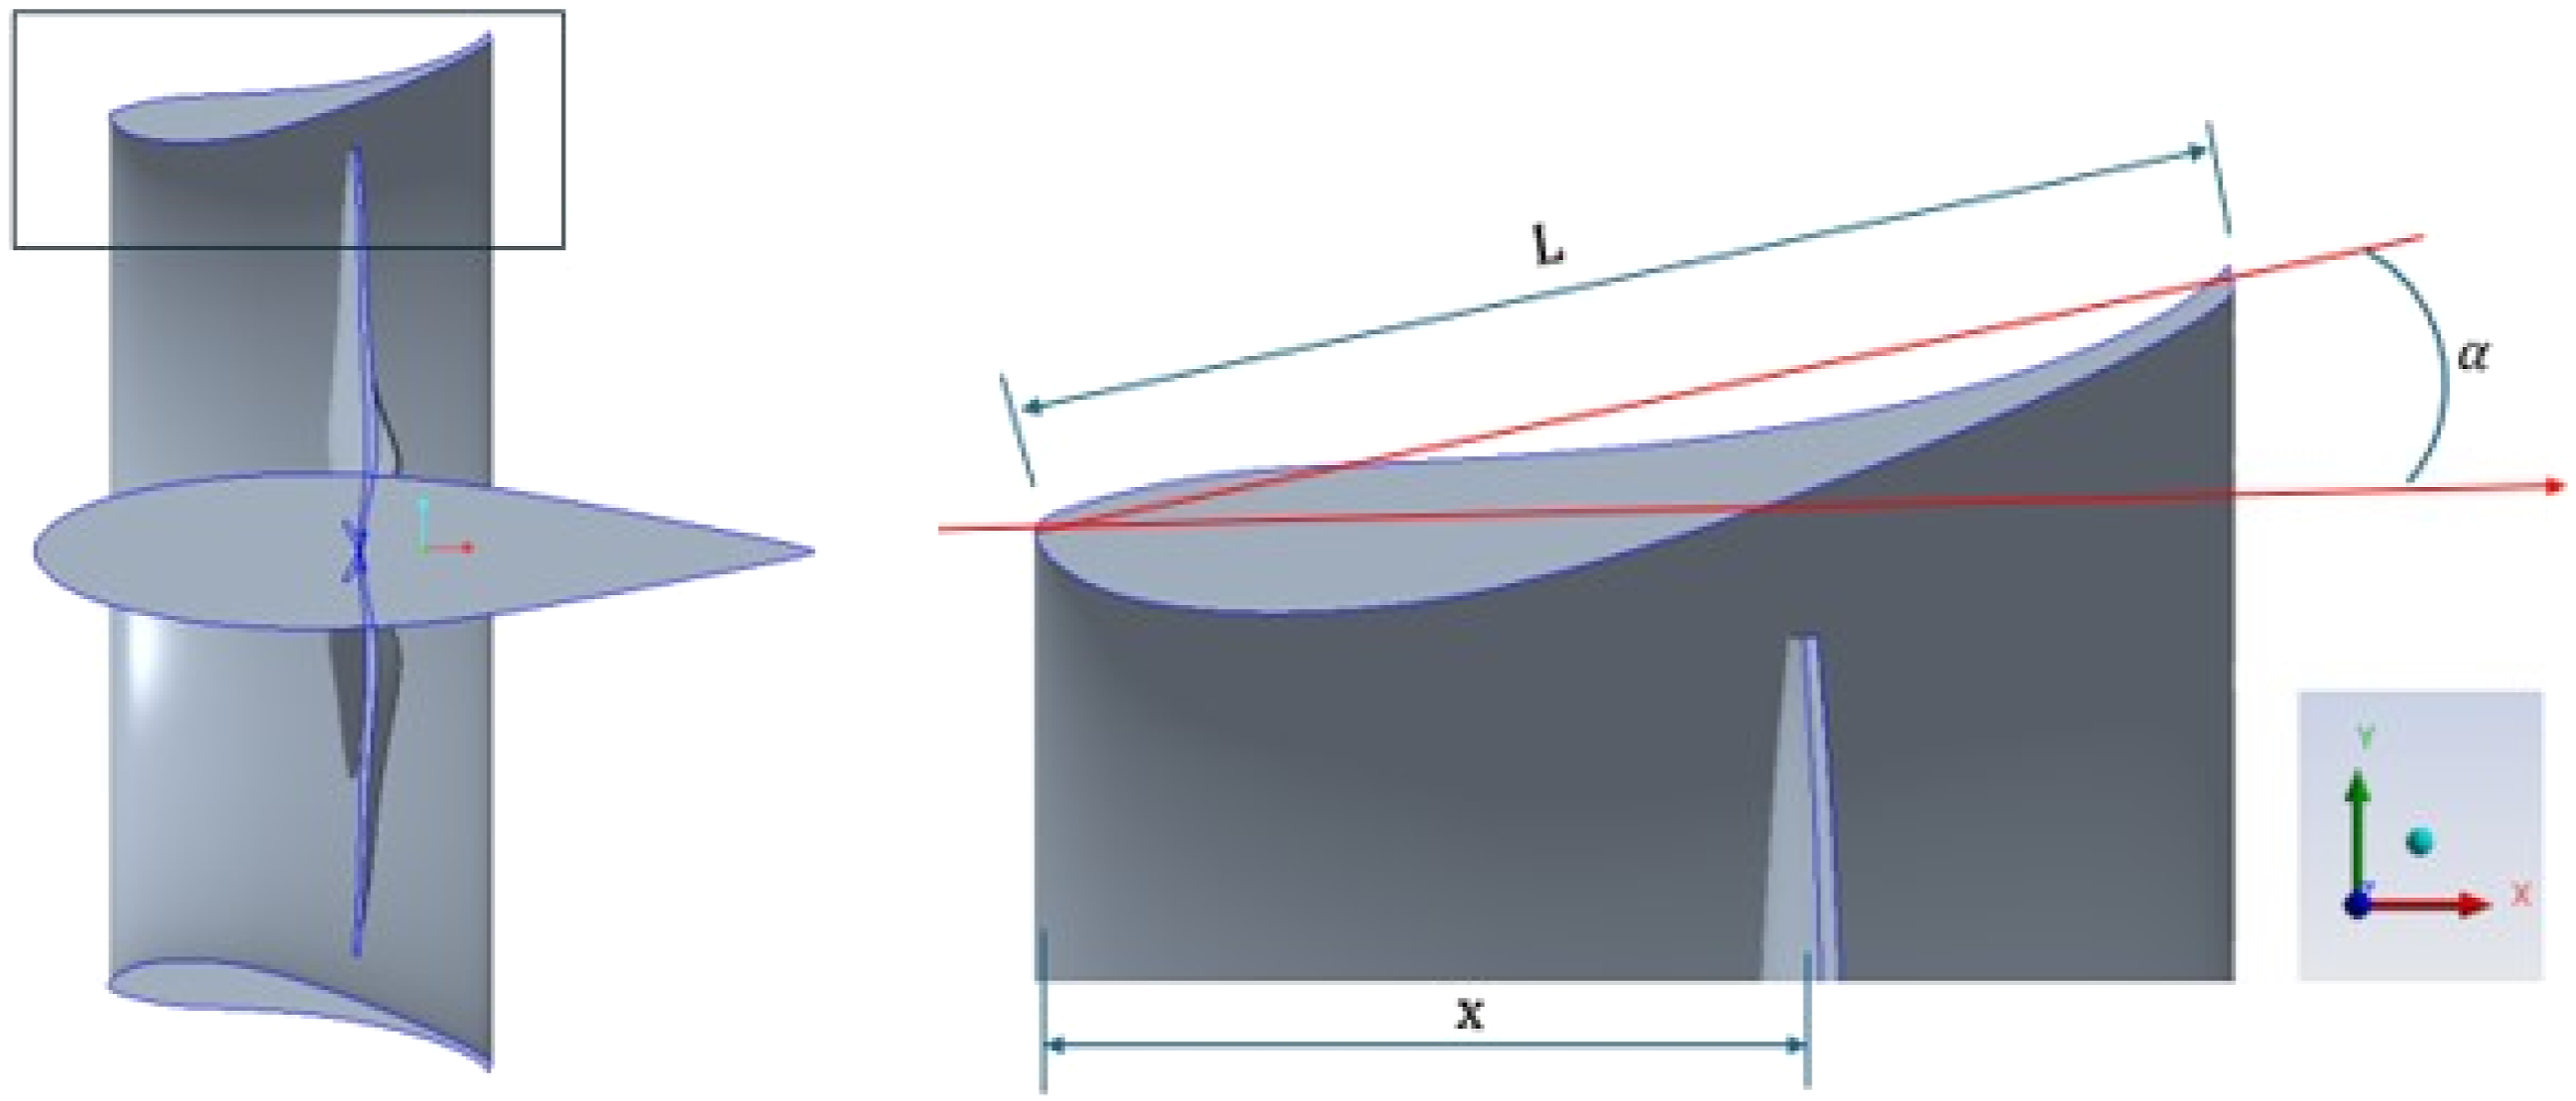
Sectional view of base and close-up.
The nominally 180 mm long rotor blade was digitally constructed by creating 14 construction sections with an AF300 airfoil defining the shape of each of these sections. The twist of these airfoil profiles was designed to attain the optimal resultant angle of attack at the target λ of 2.78. Each twist is centred at a point on the chord line 1/3 from the profile’s leading edge, with all the twist centres aligned in a straight radial line. The curved surface connecting these profiled sections forms the complete shape of the blade. The profile chord length and the corresponding twist angle for all construction sections are shown in Figure 2(a). (a) Blade dimensions of chord and twist, (b) centre body profile.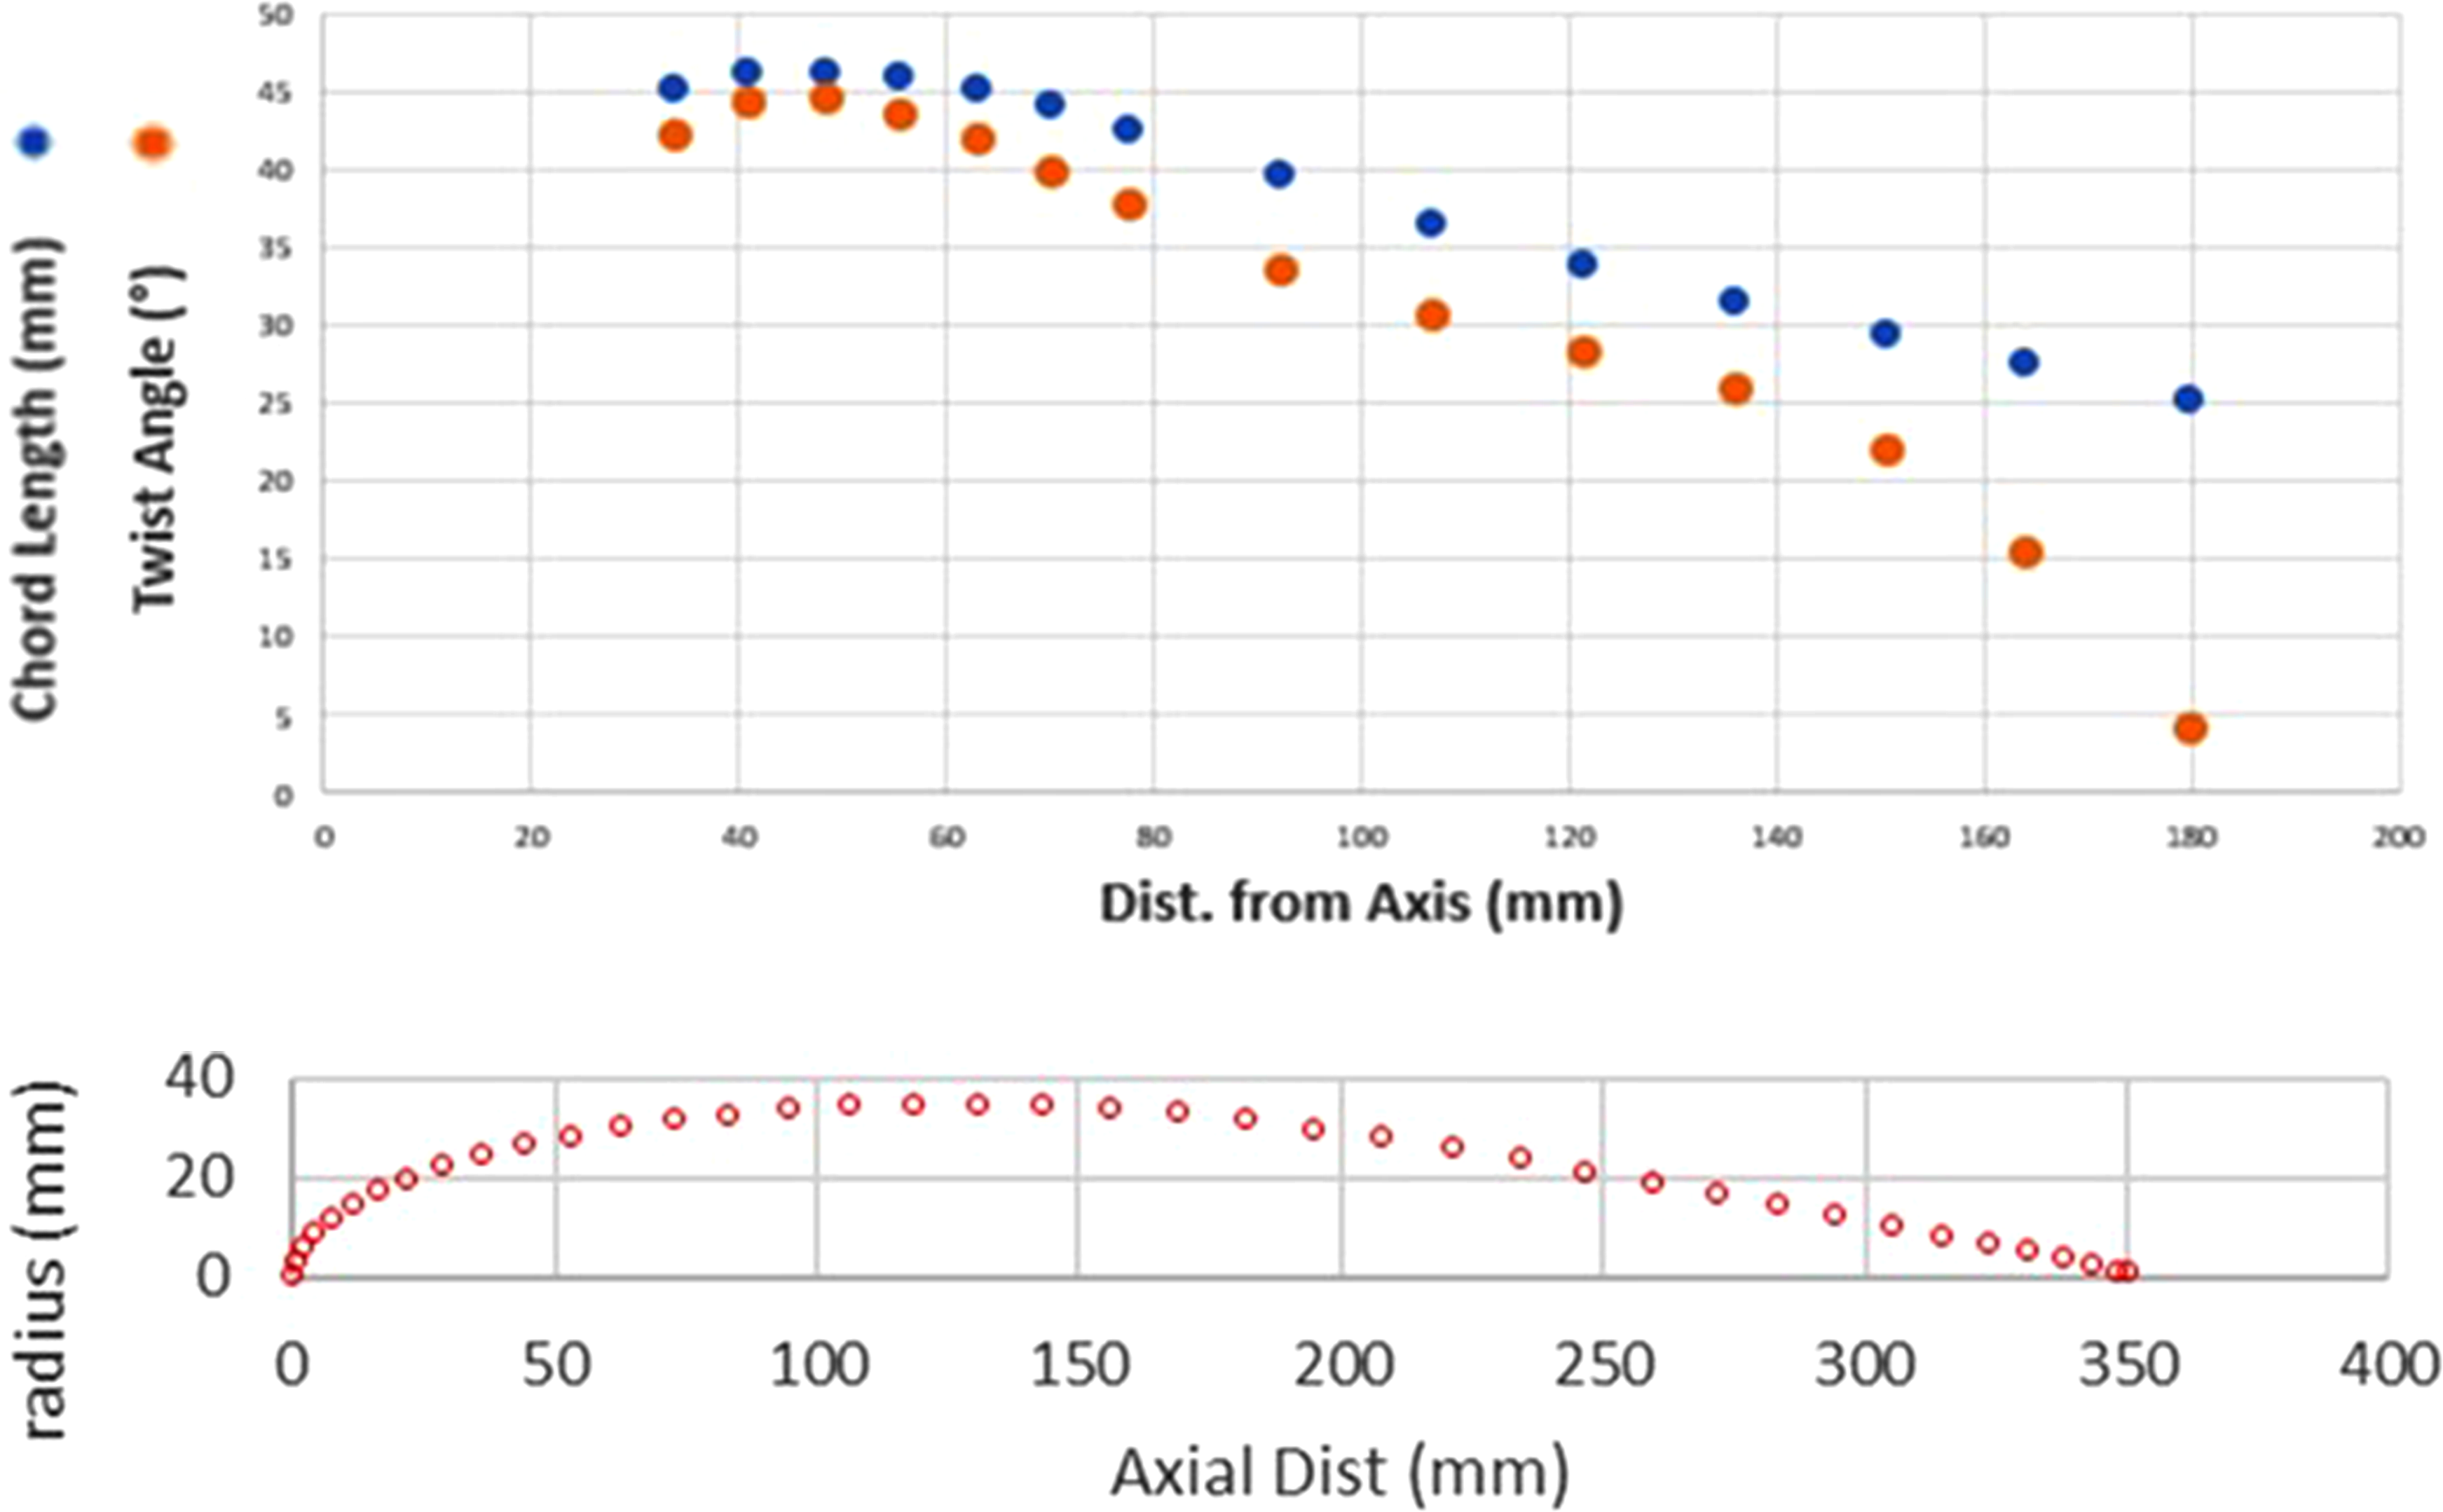
The axisymmetric airfoil-profiled centrebody is 350 mm in length, has a maximum radius of 35 mm at 1/3 of its chord, see Figure 2(b). The six blades are mounted on the centrebody at the point of the maximum radius.
The detailed profile dimensions of the rotor blade and centrebody are tabulated in the Appendix.
Using the diffuser chord length (L) for normalisation, the flow domain dimensions are shown in Figure 3. The highest blockage ratio in the simulations reported in this paper is less than 1%, the highest ratio was 7.4% in Kesby’s wind tunnel measurements (Kesby, 2018). There are six equally spaced blades in every tested geometry; thus, the sector angle of the test domain is 60° and periodicity is assumed in the CFD simulations. The circular cylindrical domain is divided into six congruent sectoral subdomains. Only one of the sectoral subdomains is submitted for simulation. Sectoral flow domain of a DAWT geometry with dimensions.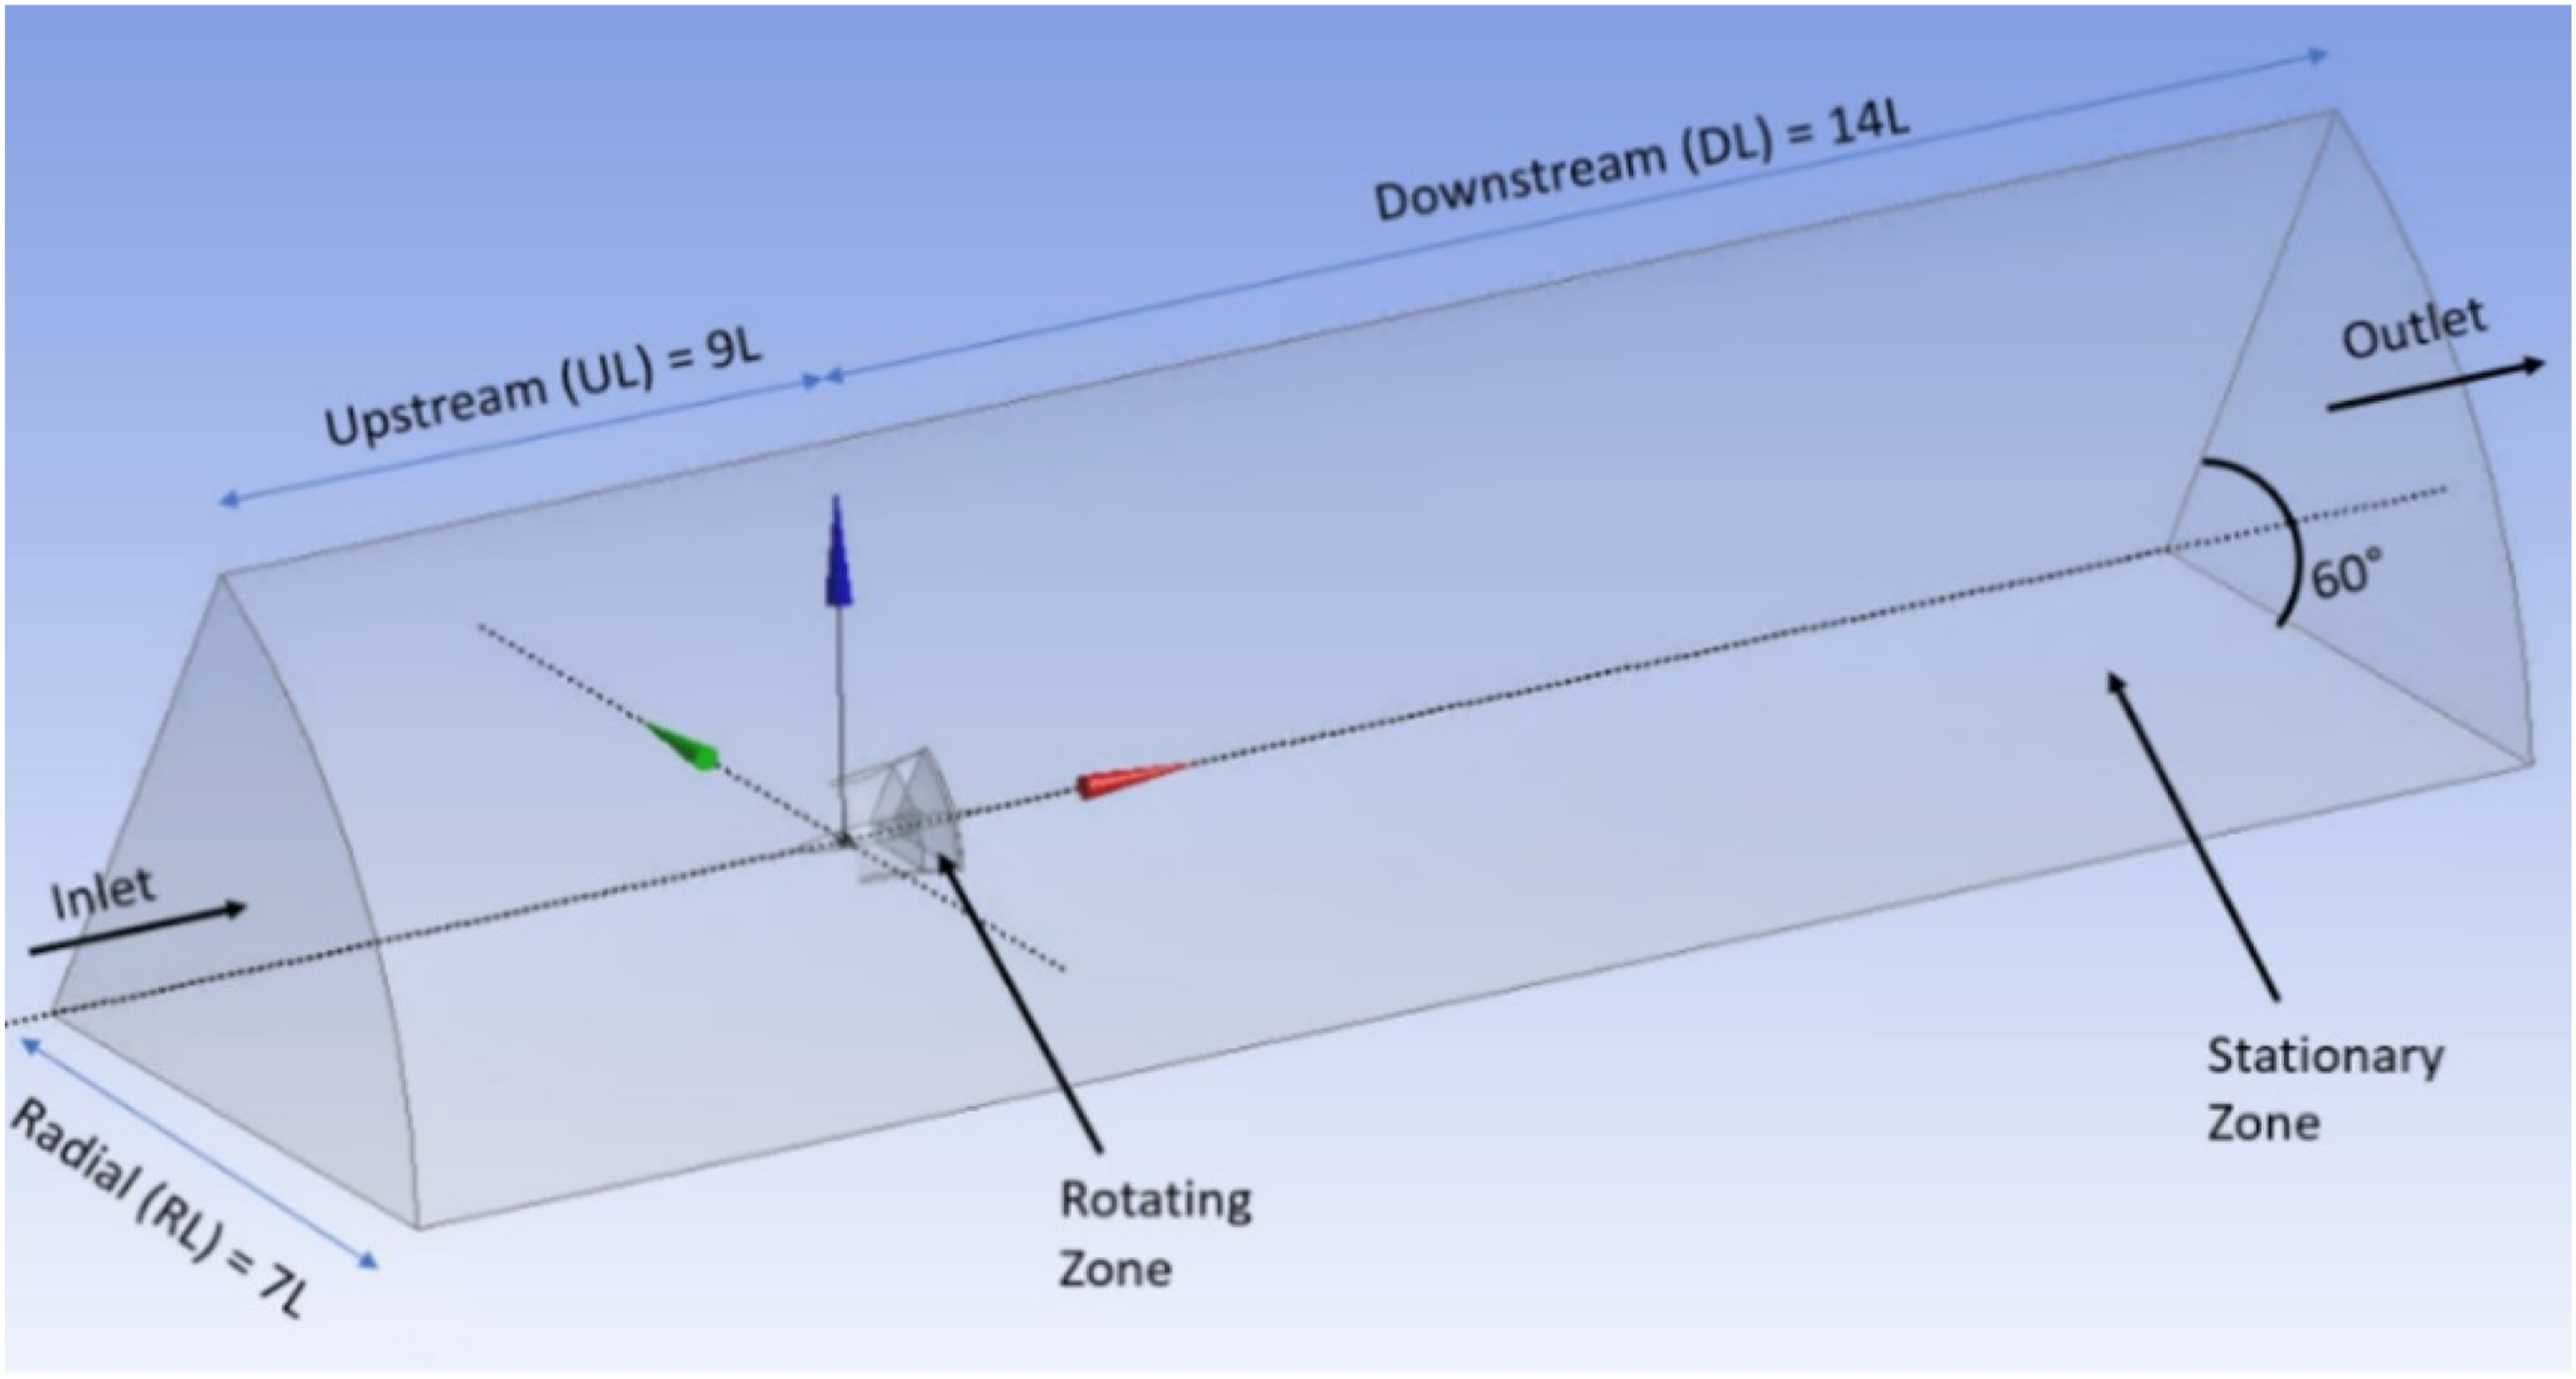
The sectoral domain consists of two zones: rotating and stationary. The former is cylindrical in shape enclosing the entire rotor blade, with part of the diffuser inside wall as the circumferential surface, see Figure 4(a). The remaining flow domain is the stationary zone. Three regions expected to have small active eddies were identified: I. the proximity of the blade tip and its immediate downstream region, II. the proximity of the diffuser trailing edge and its immediate downstream region, III. the proximity of the blade trailing edge and its immediate downstream region. Rotating zone and the active small eddies regions.
Higher mesh resolutions were set in these regions, as shown in Figure 4(b)–(d).
The unstructured meshing regime for this study was constructed using ANSYS Fluent Meshing 2020-R2. There are five levels of surface mesh size, applying to all turbine blade surfaces and the interfaces between the two zones. The blade’s tip face is the surface with the highest mesh resolution followed by the two trailing edges. Low growth rate was set for the blade trailing edge and the rear interface of the rotating zone, region (III) described above, to create a region of small volume mesh downstream of the blade trailing edge, to help model the complex flow behind the turbine. The overall and close-up views on the meshing are shown in Figure 5(a)–(d). More inflation layers were set over the walls in the rotating zone. The normal distance from the wall can be non-dimensionalised by the local skin friction and the fluid properties, y+. After convergence for each simulation, the maximum value of y+ of the first inflation layer at all the walls were examined and required to be less than unity before acceptance on the tested simulations. Meshing structure towards to diffuser trailing edge and on the blade tip face.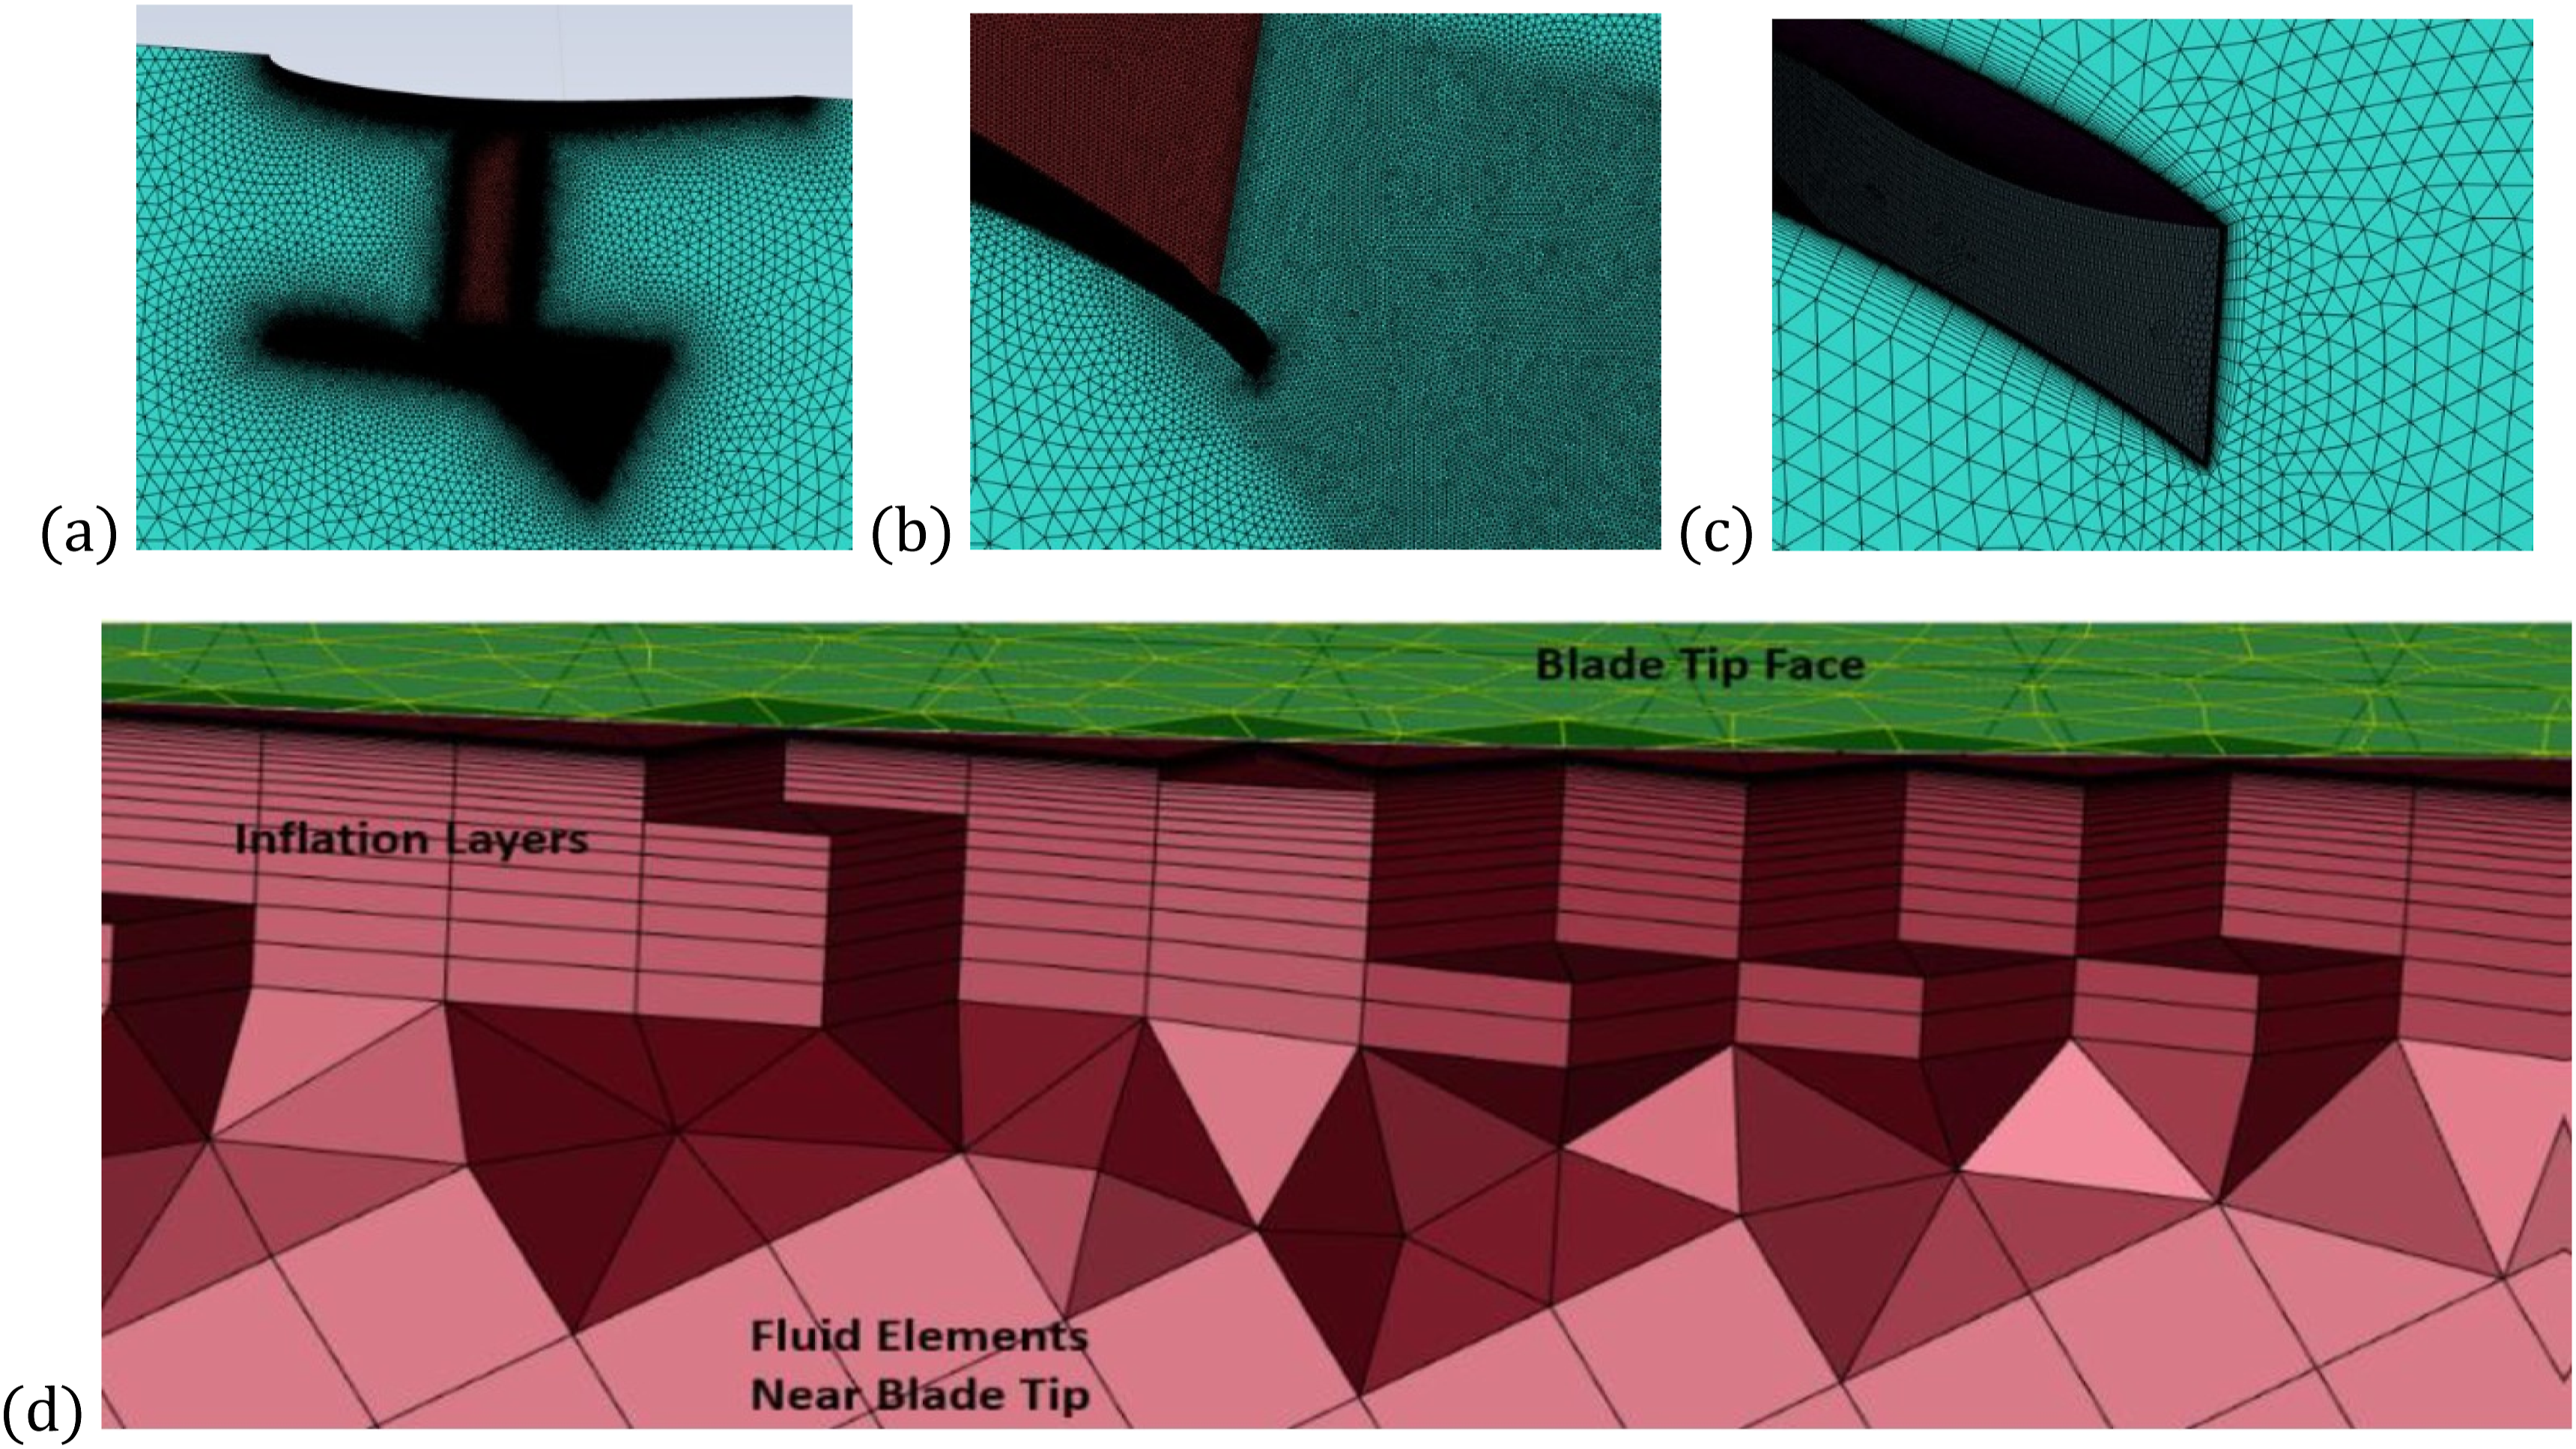
The mesh element number for each tested geometry tested was 25–30 M, with over 40% in the rotating zone. ANSYS Fluent 2020-R2 was used to solve the incompressible RANS equations with the k-ω SST turbulent flow model. Multiple reference frame was the method adopted to calculate the properties of the fluid inside the rotating zone.
The angular velocity of the turbine, Ω, was calculated against a U∞ range of 5 to 10 m/sec for a constant λ and was applied to the geometry Base for CFD simulations. The predicted turbine power outputs are shown in Figure 6, together with the wind tunnel measurements obtained by Kesby (2018), where the cubic curve between power and U∞ was plotted using the simulation result at U∞ = 7 m/sec. The simulation results agree with the cubic curve and the experimental measurements with less than 0.3% variation, with only a slight overprediction at U∞ = 9 m/sec (≈3.5% variation with experimental results). The outcome of this comparison indicates the appropriateness of the CFD simulation settings used in this study. CFD simulation outputs comparison to experimental results.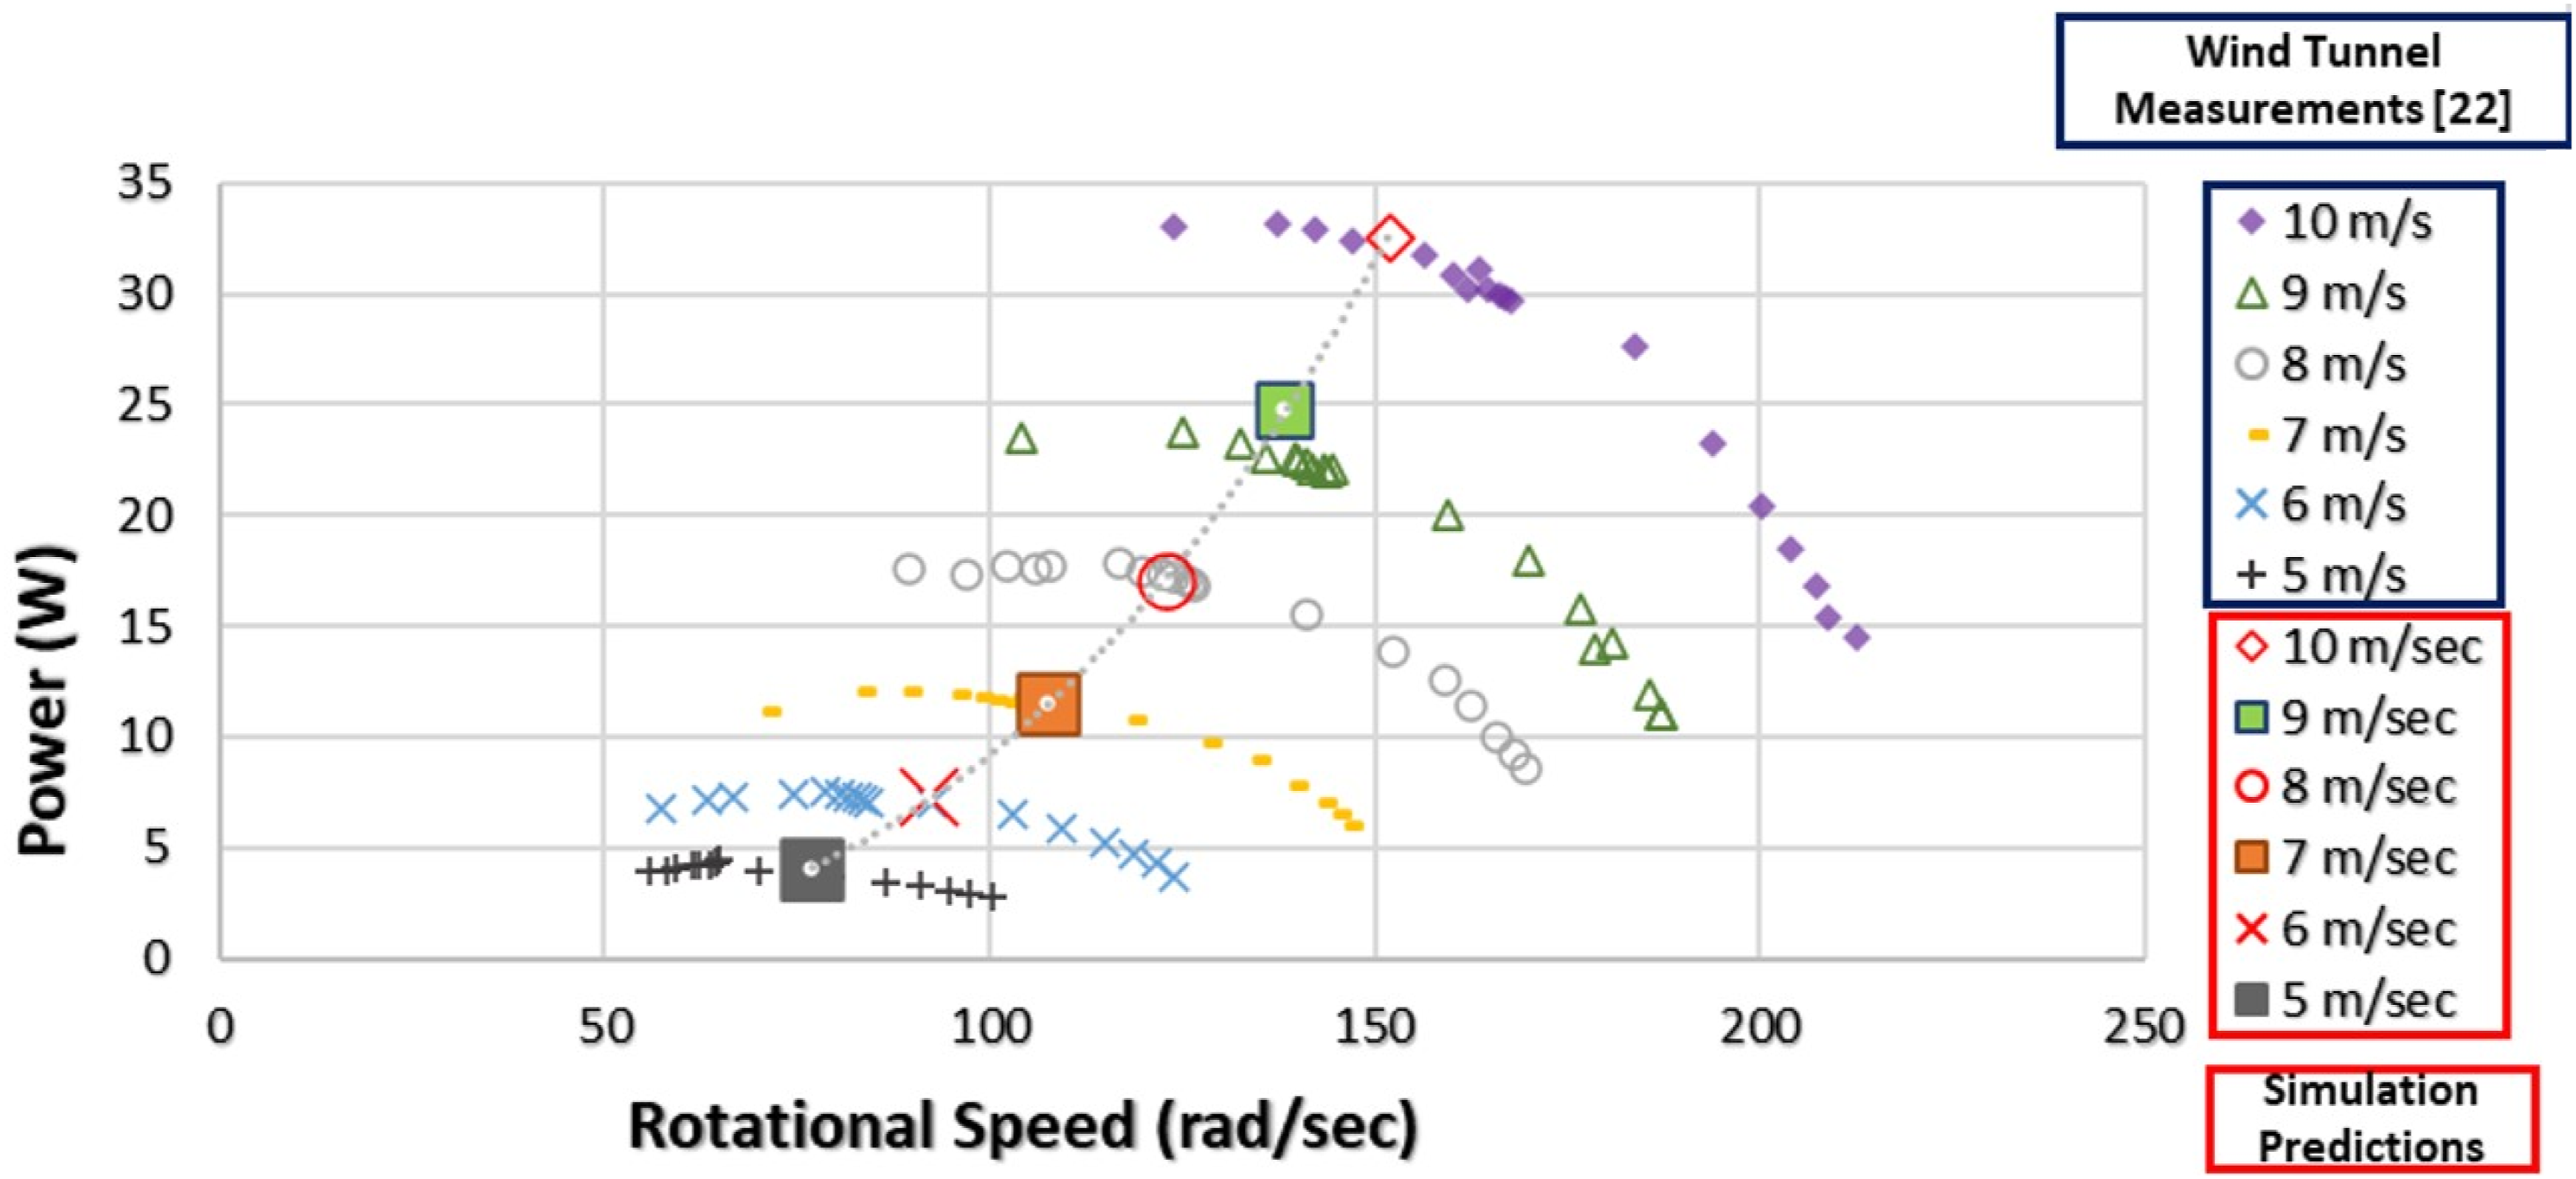
Sensitivity tests were done on these parameters: the domain dimensions, inflation layers and turbulent intensity on U∞, Each of these parameters was varied by 5% generating six different sets for CFD simulations using U∞ = 7 m/sec. These predicted power outputs were comparable to the results of the Base case, with less than 0.1% variation.
All the simulated DAWT geometries created for this study were derived from Base by adjusting the following parameters: diffuser angle (α), rotor axial position (x), and blade span (R).
Blade tip locations when α = 12°.
Results and analyses
The DAWTs with α = 12° were submitted to CFD simulations with U∞ = 7 m/sec and Ω = 107.52 rad/sec; the predicted results are listed in Table 2. An additional simulation test was carried out on an empty diffuser with the same α, and two axial velocity profiles are shown in Figure 8. The profile at the throat has a peak velocity close to the diffuser wall at 1.76 U∞. The other profile, taken at the same axial location as the rotor of Base, has a sharp drop in at the radial distance of 167 mm from the axis, indicating that the flow starts separating from the diffuser wall at an axial position of x < 112 mm. Axial velocity radial profile in empty diffuser with α = 12°.
Simulation results from DAWT geometries of α = 12°.
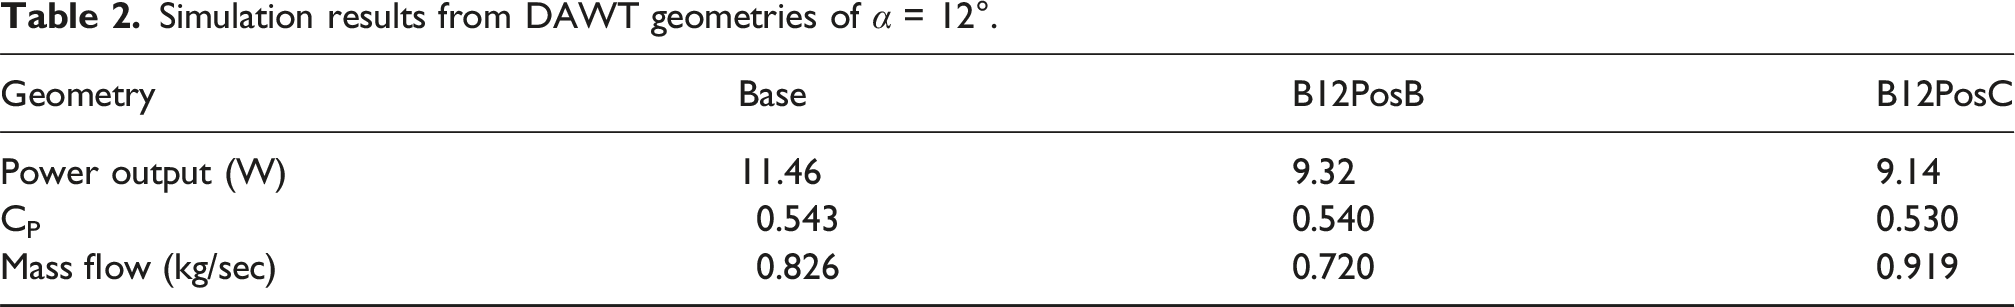
Base and B12PosC are located at the same axial position with the former having a longer blade span and performing better in power output. Its Cp value is higher by a margin of 2.5%, showing no adverse effects by flow separation on the performance of Base. Whether any flow separation exists in these tested operating DAWTs have been determined in an airflow study, presented and discussed later in this paper.
The air mass flowing through the swept circle represents the volume of kinetic energy for the rotor blades to extract energy from the wind, so it is an indicator of the turbine power output. As shown in Table 2, B12PosC has the highest air mass flow rate but has the lowest power output, possibly because it has the lowest blockage ratio – the ratio between the rotor projected area and the local cross-sectional area. The turbine blades are mounted on the thickest position on the centre body, with a radius of 35 mm, which is a substantial portion of the local cross-sectional area. To understand the relationship between the air flowrate and the turbine power output, the airflow distributions around the rotor blade needs to be investigated.
Figure 9(a)–(c) shows the axial velocity contours for the 3 DAWTs on the axial plane through the rotor blade. Affected by the spinning rotor, the flow distributions around the turbine blade have no resemblance to the velocity profiles in an empty diffuser. There are some common features applicable to all three geometries: I. Attached to the centre body of each of the DAWTs, there is a large recirculation vortex with the point of separation locating immediately behind the blade root. II. No significant flow separation is found inside the diffuser, except a pair of small recirculation vortices attached to the diffuser square trailing edge. In the case of Base, the vortex pair may be stretching into the diffuser inside wall only by a small portion. III. The highest axial velocity in each of the DAWTs is about 3 times of U∞ and is in the gap between the blade tip and the diffuser bypassing the rotor swept circle. Axial velocity contours with streamlines on rotor plane along x-axis [no colour scale on the streamlines]: (a) Base, (b) B12PosB, (c) B12PosC.
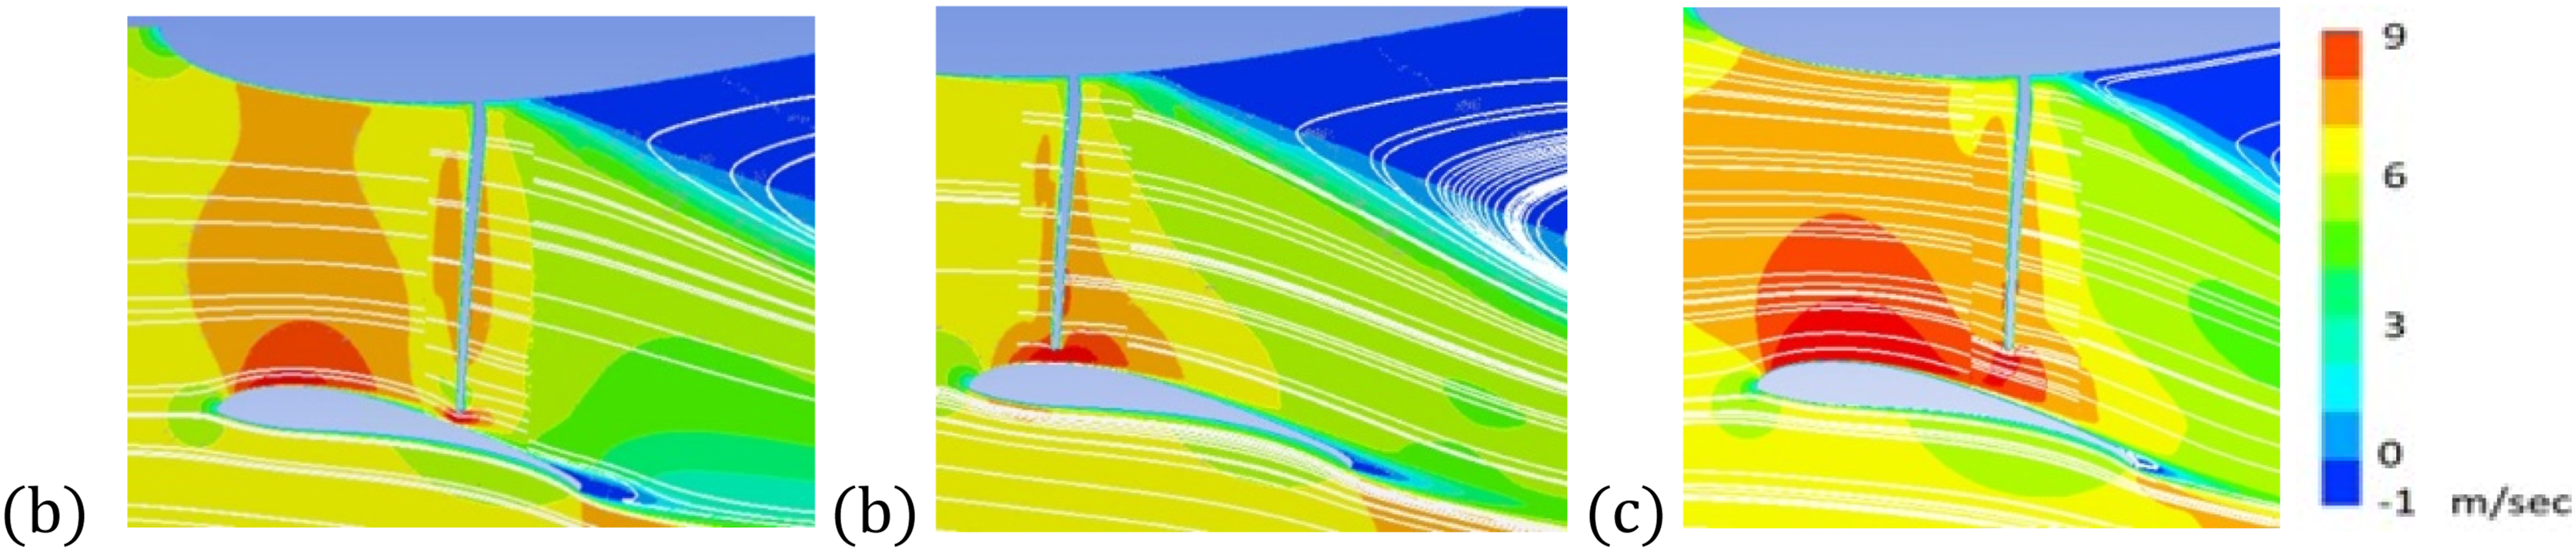
Figure 10(a)–(c) displays the axial velocity contours at the diffuser exit for the three considered cases. The contour patterns are generally irregular caused by the turbulence in the wake region behind the rotating blades. The exception is the inviscid flow from the recirculation vortices, noting that in the region shown by dark blue contours, the air is flowing axially in the counter mainstream (negative) direction. These are vortex rings encircling the tail end of the whole centre body. The flow separation vortex in Base is not a ring, occurs only in a small azimuthal span downstream of the rotor blade with no noticeable pitch lag, Figure 10(a), where negative axial flow is shown by the dark blue. On the same contour plot, there is another patch of negative axial flow, spanning across to the adjacent sectoral domain. This is not related to flow separation, and it is in fact a BTV. Axial velocity contour at diffuser exit: (a) Base, (b) B12PosB, (c) B12PosC.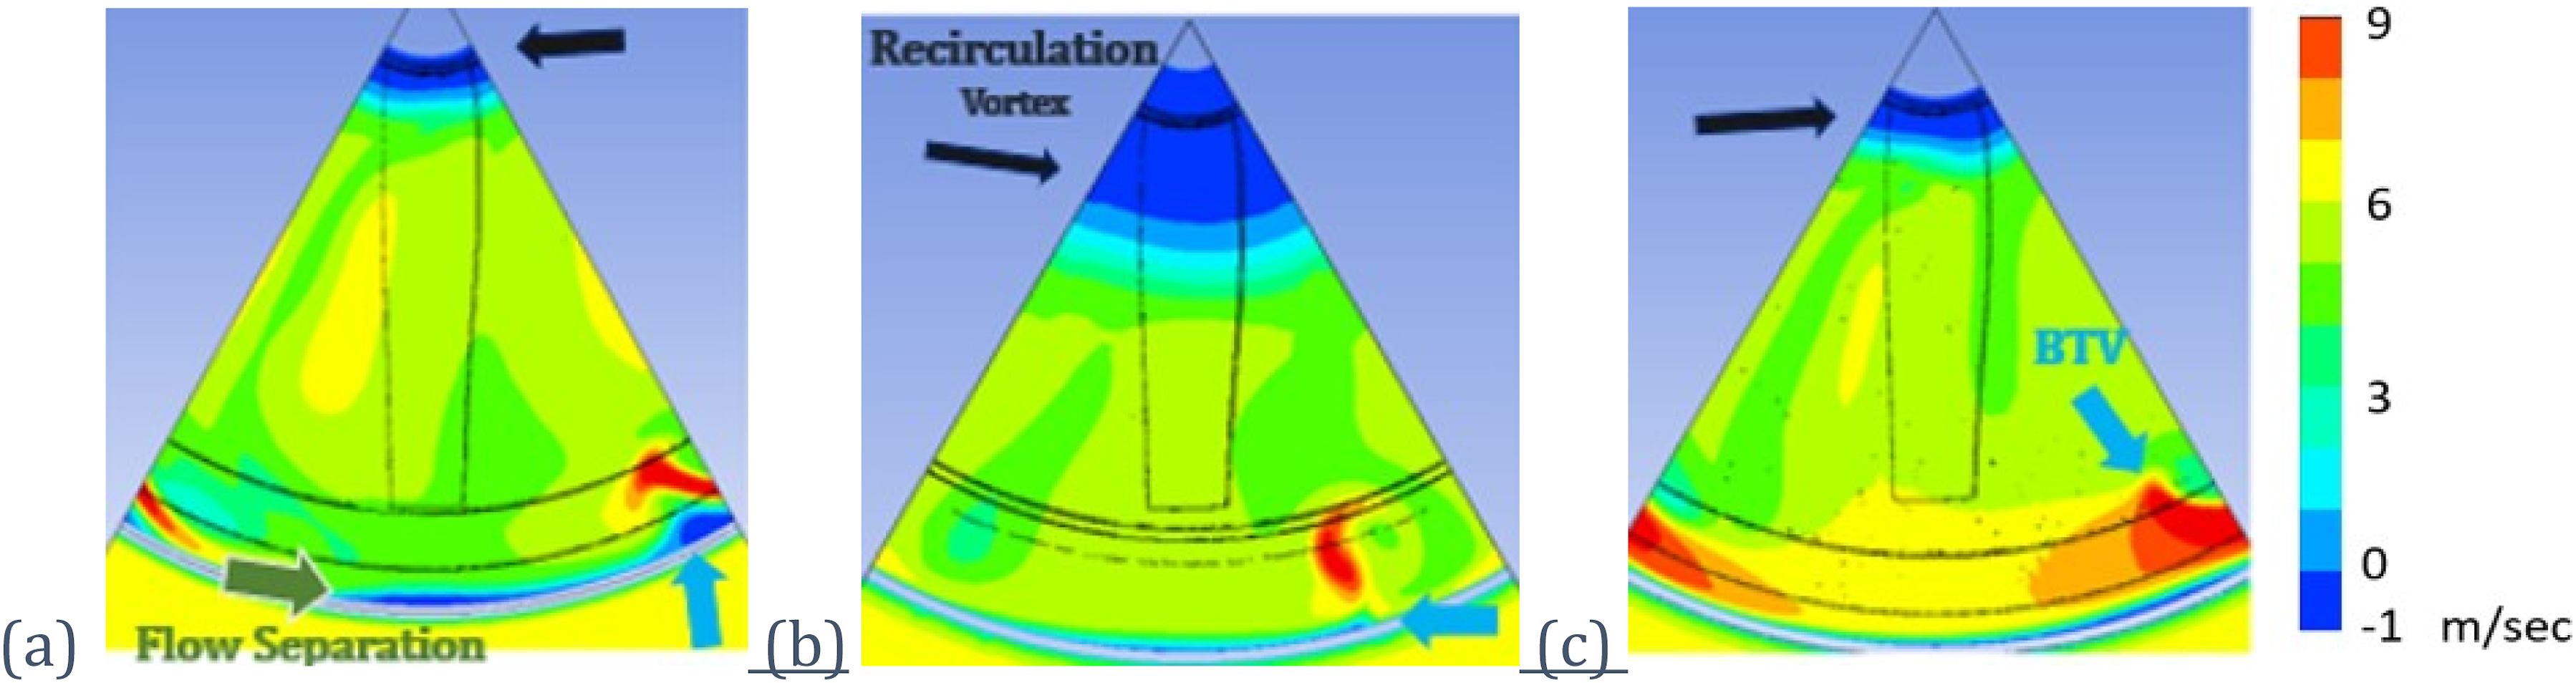
DP is the plane along the domain axis on the interface between the modelled sectoral domain and the adjacent one. The azimuthal velocity contours on DP for the 3 DAWT configurations are shown in Figure 11(a)–(c). The BTV in Base is the strongest determined by the following two measures: the magnitude of the azimuthal velocity at the BTV, and the axial distance the BTV has moved as it reaches DP. The azimuthal contour map does not show any BTV in B12PosB, but the vortex is shown on the axial velocity contour at the diffuser exit, indicating that its BTV is not intense enough to travel azimuthally to the plane DP. This indicates that Base has the strongest BTV and that the BTV in B12PosB is the weakest. The highest axial velocity is found at the blade tip on the rotor cross-section because the blade tip is where the BTV is formed. The BTV rotates in the same direction as the DAWT rotor, thereby reducing the power output of the turbine. Even though Base has the highest loss due to the BTV, it still has the highest in power output. Azimuthal velocity contour on DP: (a) Base, (b) B12PosB, (c) B12PosC.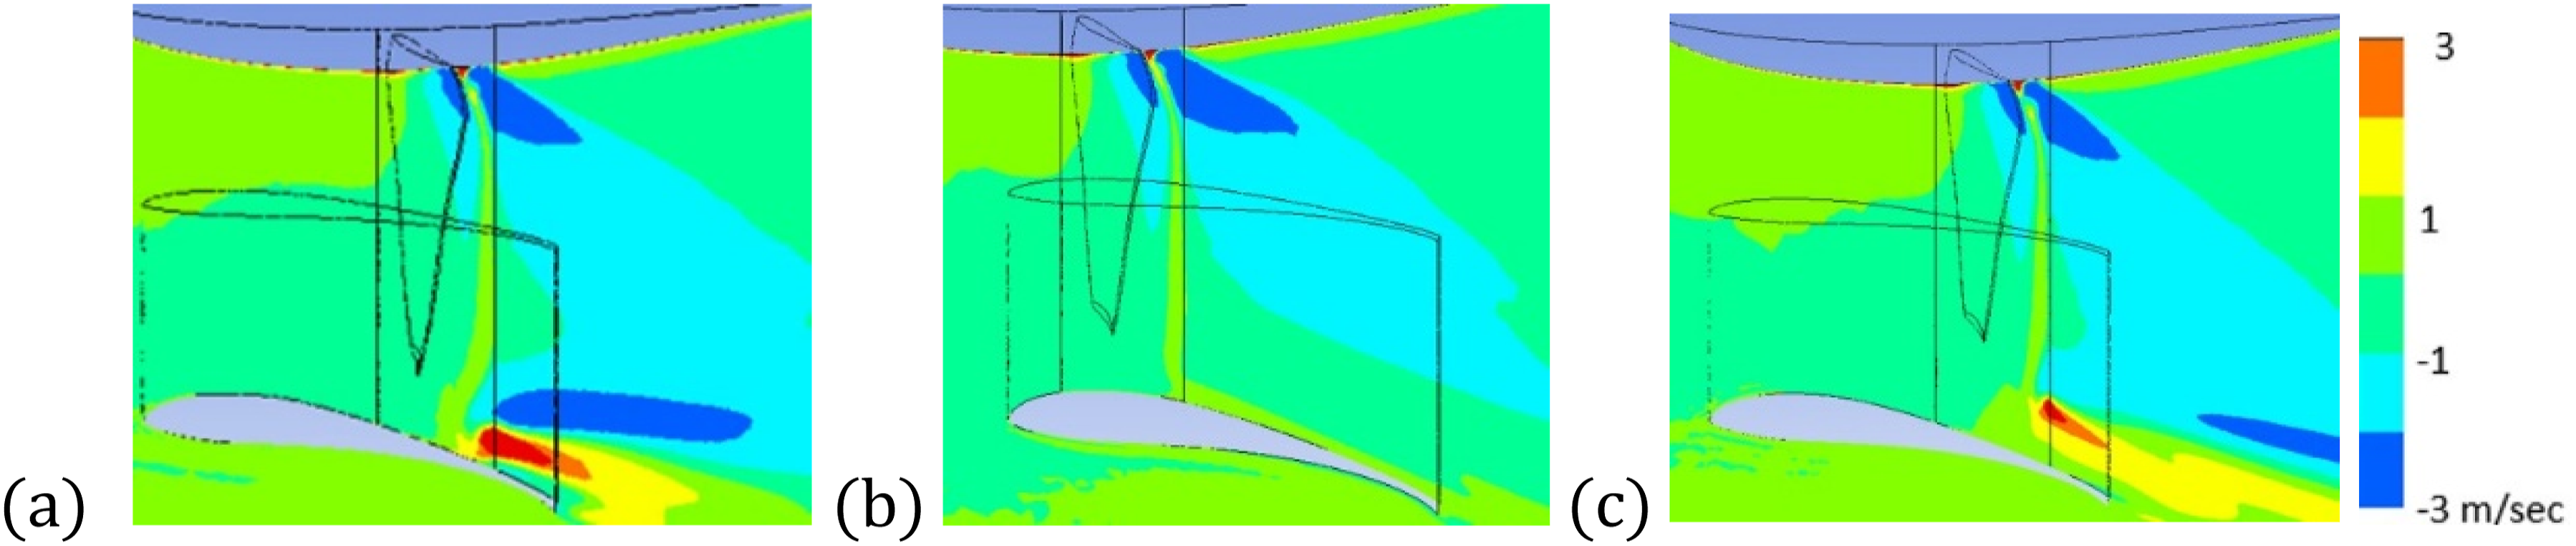
Even though the Reynolds Number level is relatively low at 86,000, the skin friction component of the wind load on the walls will be minimal compared to the pressure component. Thus, the power output of a DAWT can be estimated by the following integral over the entire blade surface: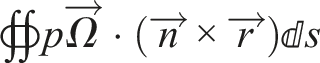
The pressure distribution on the blade is affected by the nearby airflow. A series of streamtube flow paths were created to illustrate this interrelation – see Figure 12(a)–(e). In this figure, the streamlines are coloured for categorisation, not for scaling. The pressure distribution on the blade surfaces is shown to highlight the relative locations of the streamlines. Four short straight lines were defined close to the rotor blade surface; three of these lines are shown in Figure 12(a), with the other short straight line located on the other side of the blade and in the middle. In Figure 12(b), the streamlines going through the short straight lines illustrate how the fluid flow around the blade and the interactions with the blade surfaces. These streamlines represent the air velocity relative to the rotating blade at the local radial location, with the disappearance of a streamline indicates the fluid is travelling at the same local velocity of the blade. (a–e) 3D streamlines flowing onto and around the rotating blade.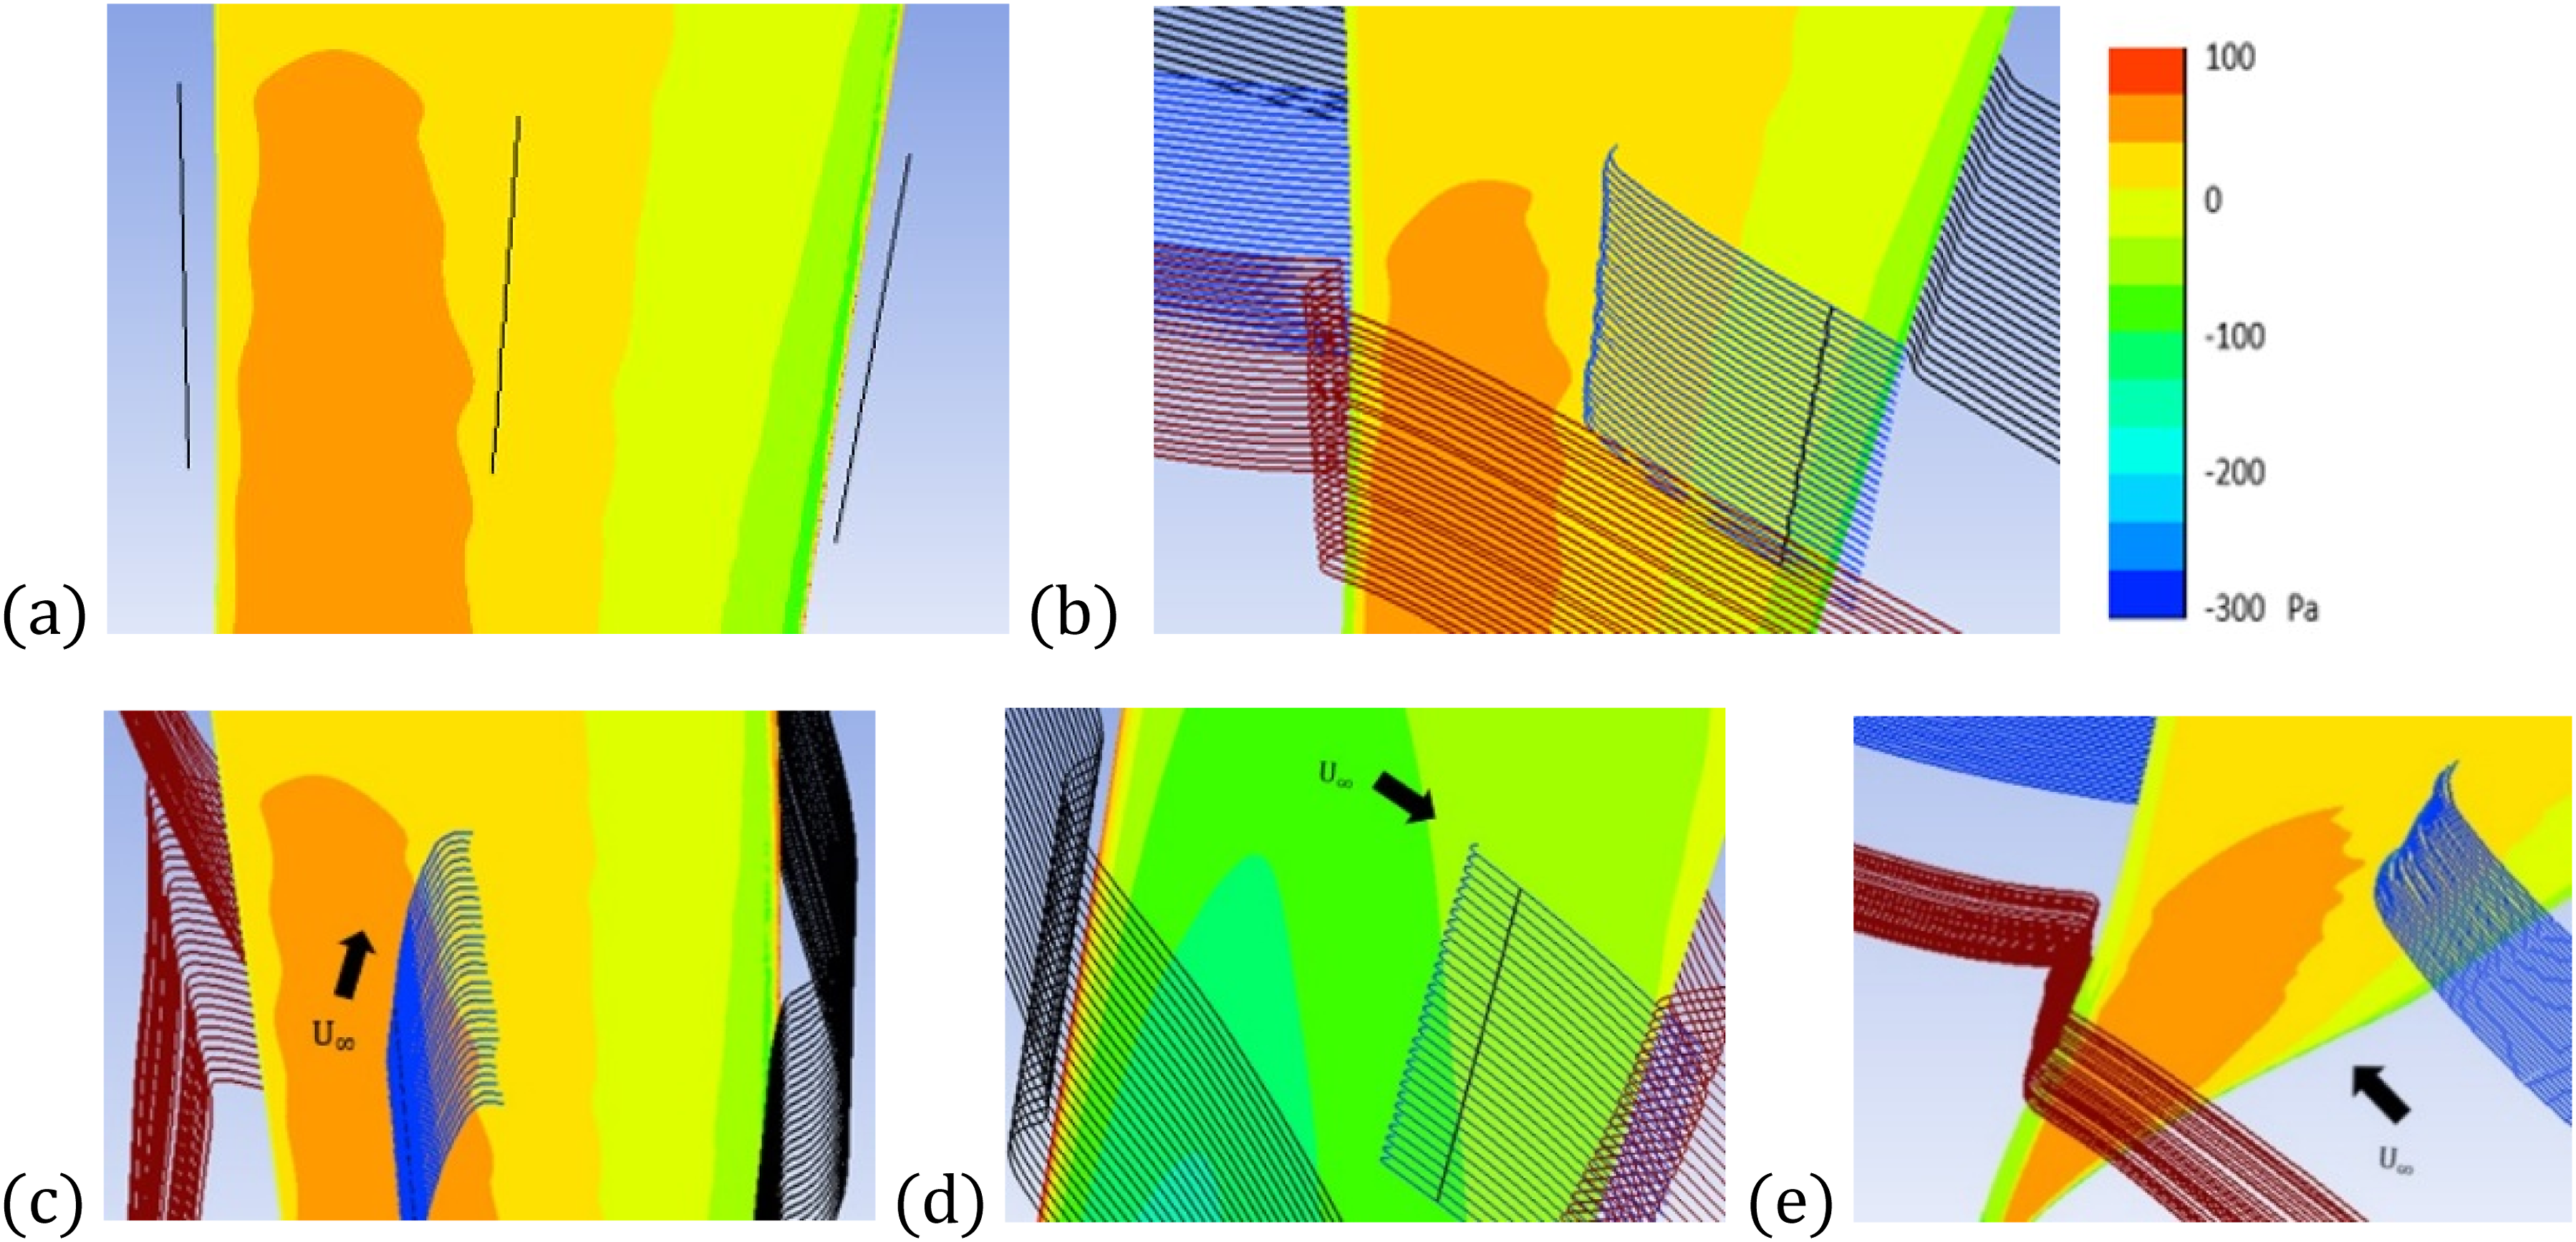
As shown in Figure 12(c), the blue lines indicate the fluid flow diverting from the direction of the mainstream to turn towards the blade leading edge as it approaches the blade surface, then disappearing. On the other side of the rotor blade, the blue streamlines appear to come out of the blade with no trace, as shown in Figure 12(d), indicates that the fluid is travelling at the same azimuthal velocity as the blade, separating from the blade and turning into the axial direction to follow the mainstream flow. The streamtube (in black) are redirected slightly to go around the blade’s leading edge. Figure 12(e) exhibits how the streamtube (in maroon) bends around the blade’s trailing edge resulting in a momentum change in the azimuthal direction.
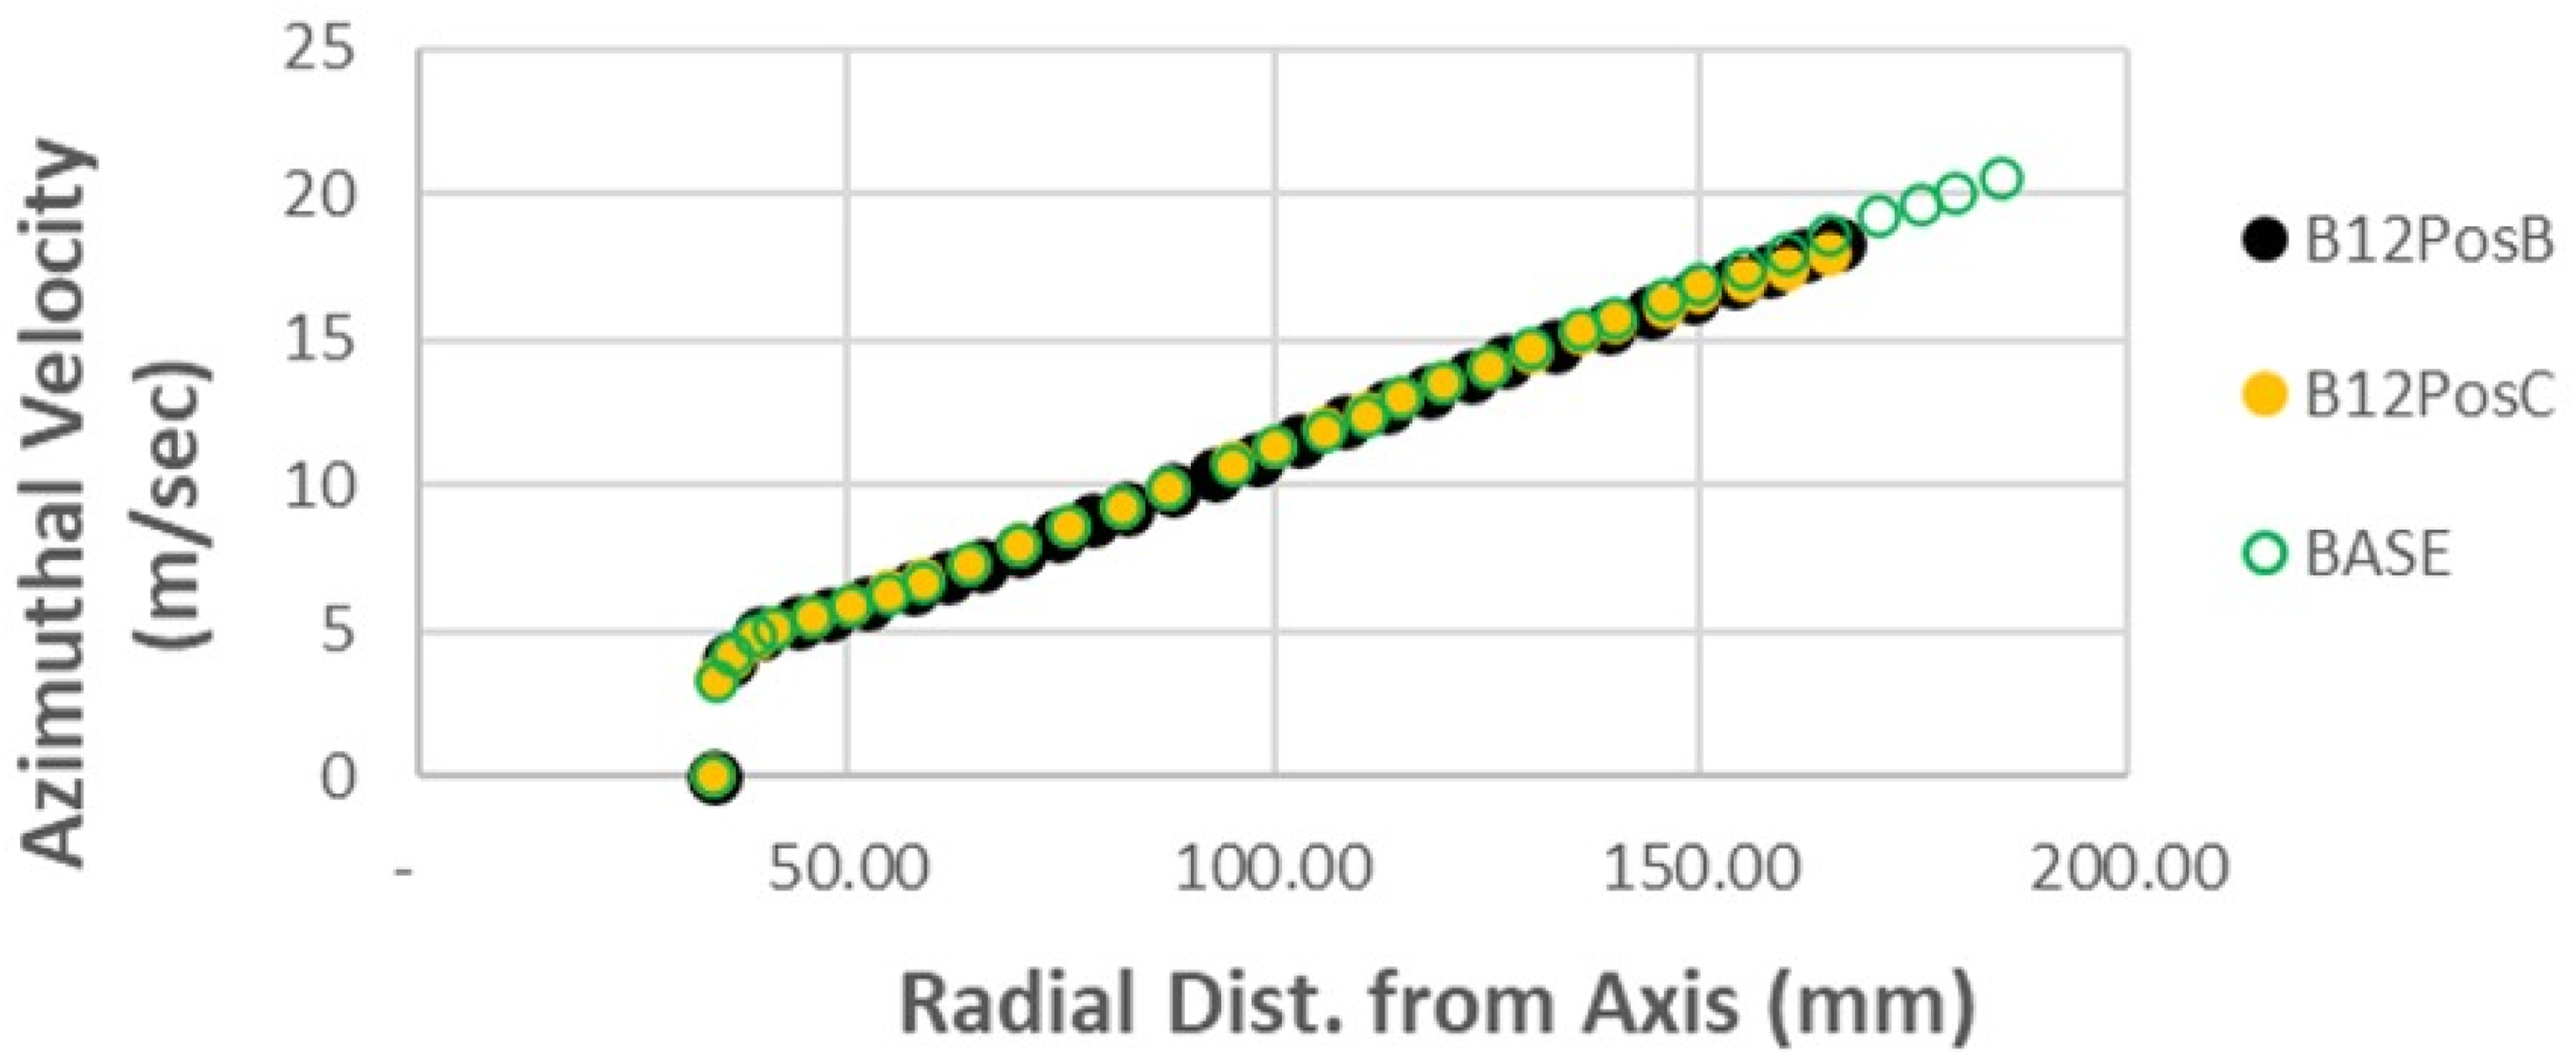
As illustrated in Figure 12(a)–(e), the axial airflows are diverted into the azimuthal direction and vice versa in the proximity of the blade surfaces. These flow diversions exert pressure on the blade surfaces and provide the torque to rotate the turbine. Far upstream, there is no angular momentum in the streamtube going into the DAWT as defined in the simulation boundary conditions, and from the conservation of angular momentum, the azimuthal airflows are in the opposite direction to the rotor rotation. Figure 13(a)–(c) displays the patterns of these circulations with the fluid flowing azimuthally from one blade to the adjacent blade. The radial components are more noticeable in the tip regions, especially in Base and B12PosC; however, they do not contribute to the angular momentum of the airflows. When considering the azimuthal circulation, all 3 DAWT geometries have very similar azimuthal flow profiles, as shown in Figure 14. The similarity in the magnitude in the azimuthal velocity is remarkably consistent and is a function of the angular velocity of the rotor. 2D streamlines on cross-section through the rotor: (a) Base, (b) B12PosB, (c) B12PosC. Azimuthal velocity on DP at rotor location.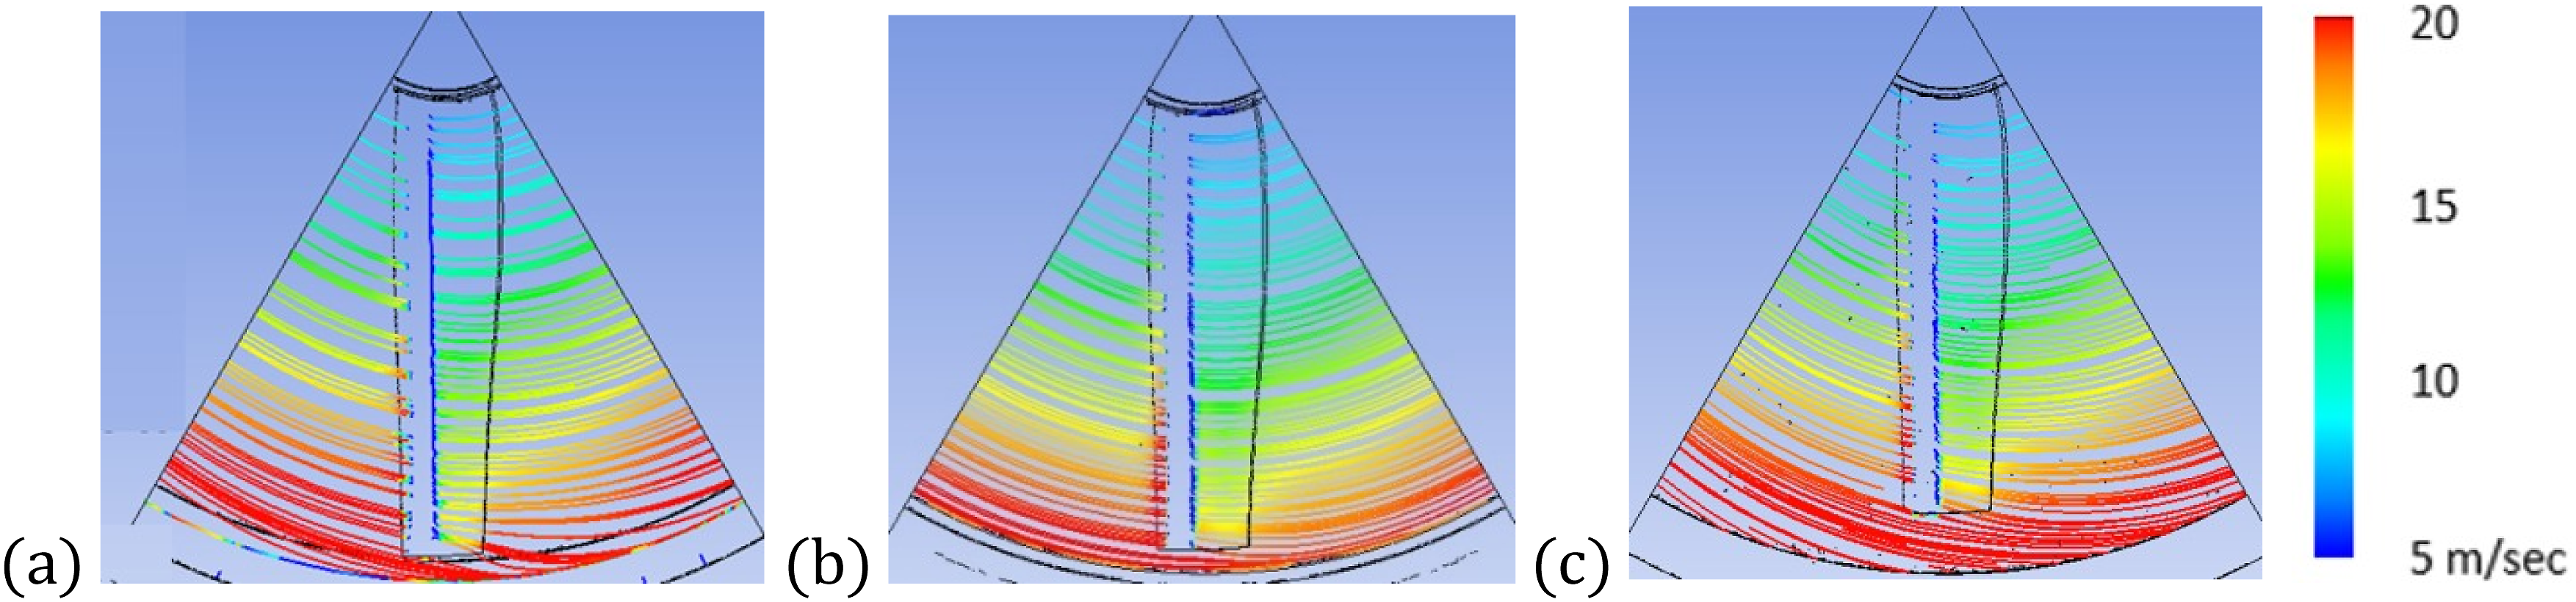
B12PosC has a k value more than 3 times of the other two geometries allowing its high mass flow rate in the diffuser to bypass the swept circle, identified by the contour regions in red and deep red in Figures 9(c) and 15(c). This is a mass flow leakage in the radial direction. As shown in Figure 15(a) and (b), this radial leakage also occurs in the geometries with a small k value. The highest axial velocity occurs in the region between the blade tip and the diffuser wall, at the value of about 3U∞ for all three geometries. This radial leakage is a loss to the turbine power generation; some of the leaked mass may end up forming a BTV. Axial vel. on cross-section through the rotor: (a) Base, (b) B12PosB, (c) B12PosC.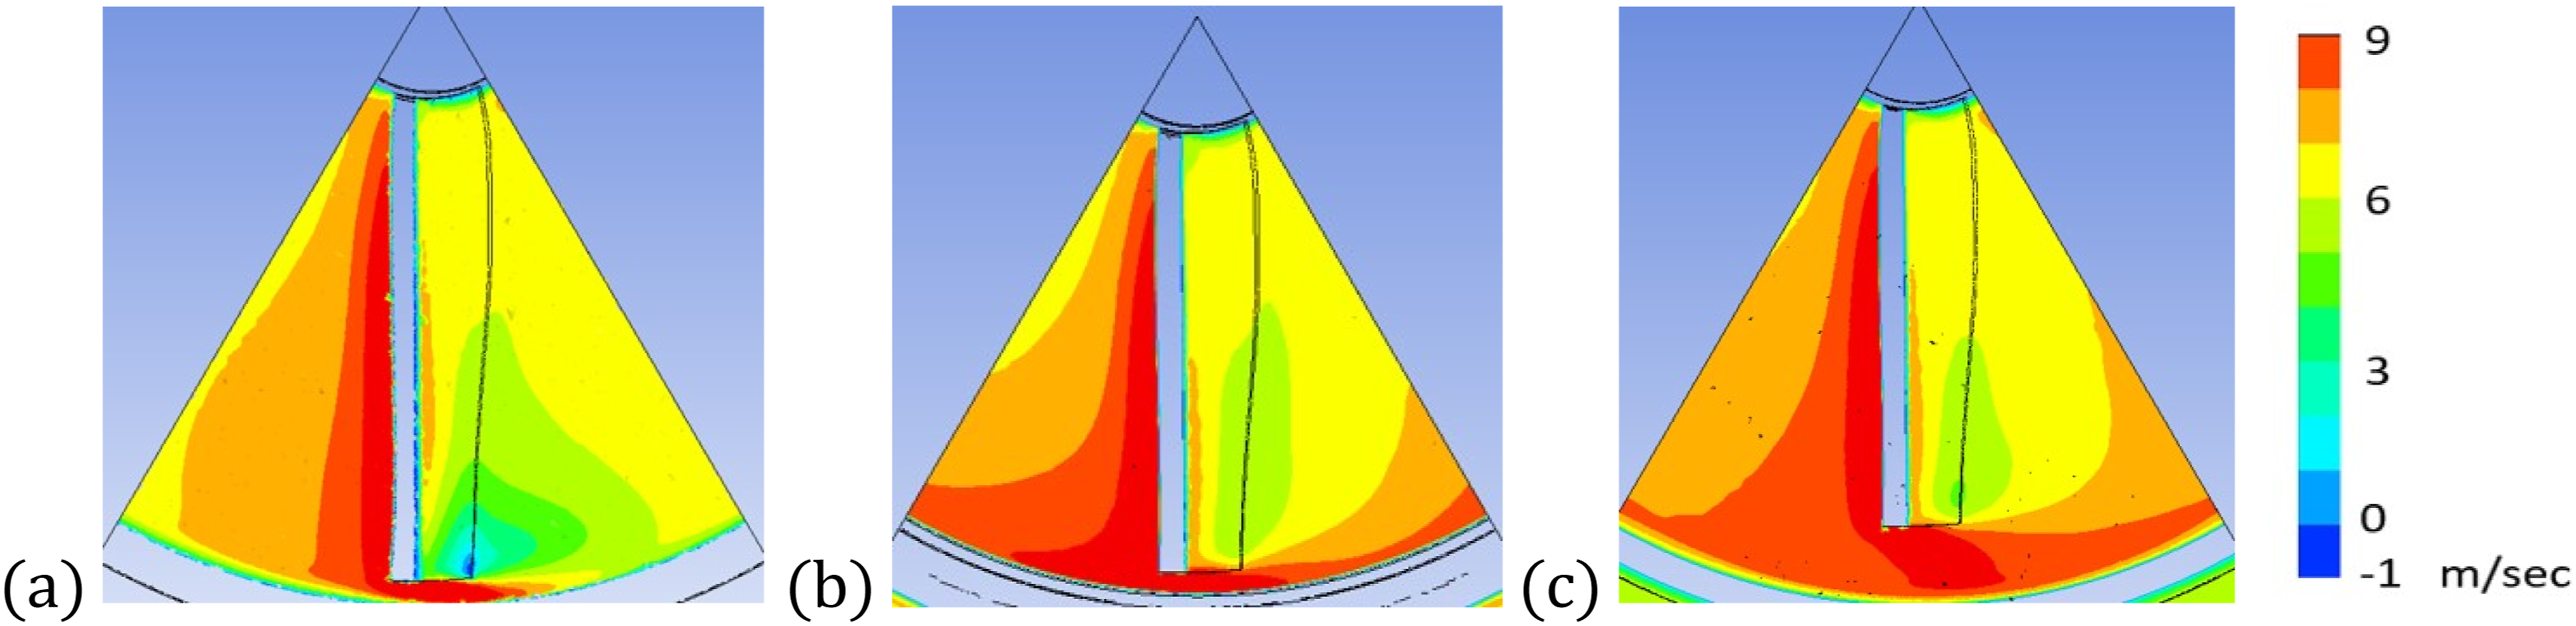
The axial velocity distributions over the cross-sections through the rotor, as shown in Figure 15(a)–(c), indicate that large volumes of air are flowing quite far from the blades in B12PosB and B12PosC. The 2D flow patterns on the near-tip cross-blade planes are shown in Figure 16 (a)–(c). Many streamlines in the high axial flow regions do not change in flow direction. These airflows are too distant from the rotor blades to contribute to the turbine’s power generation, and they are inside the swept circle. This is an azimuthal mass flow leakage. Axial velocity contours with 2D streamlines at 0.9R (streamlines are not colour-scaled).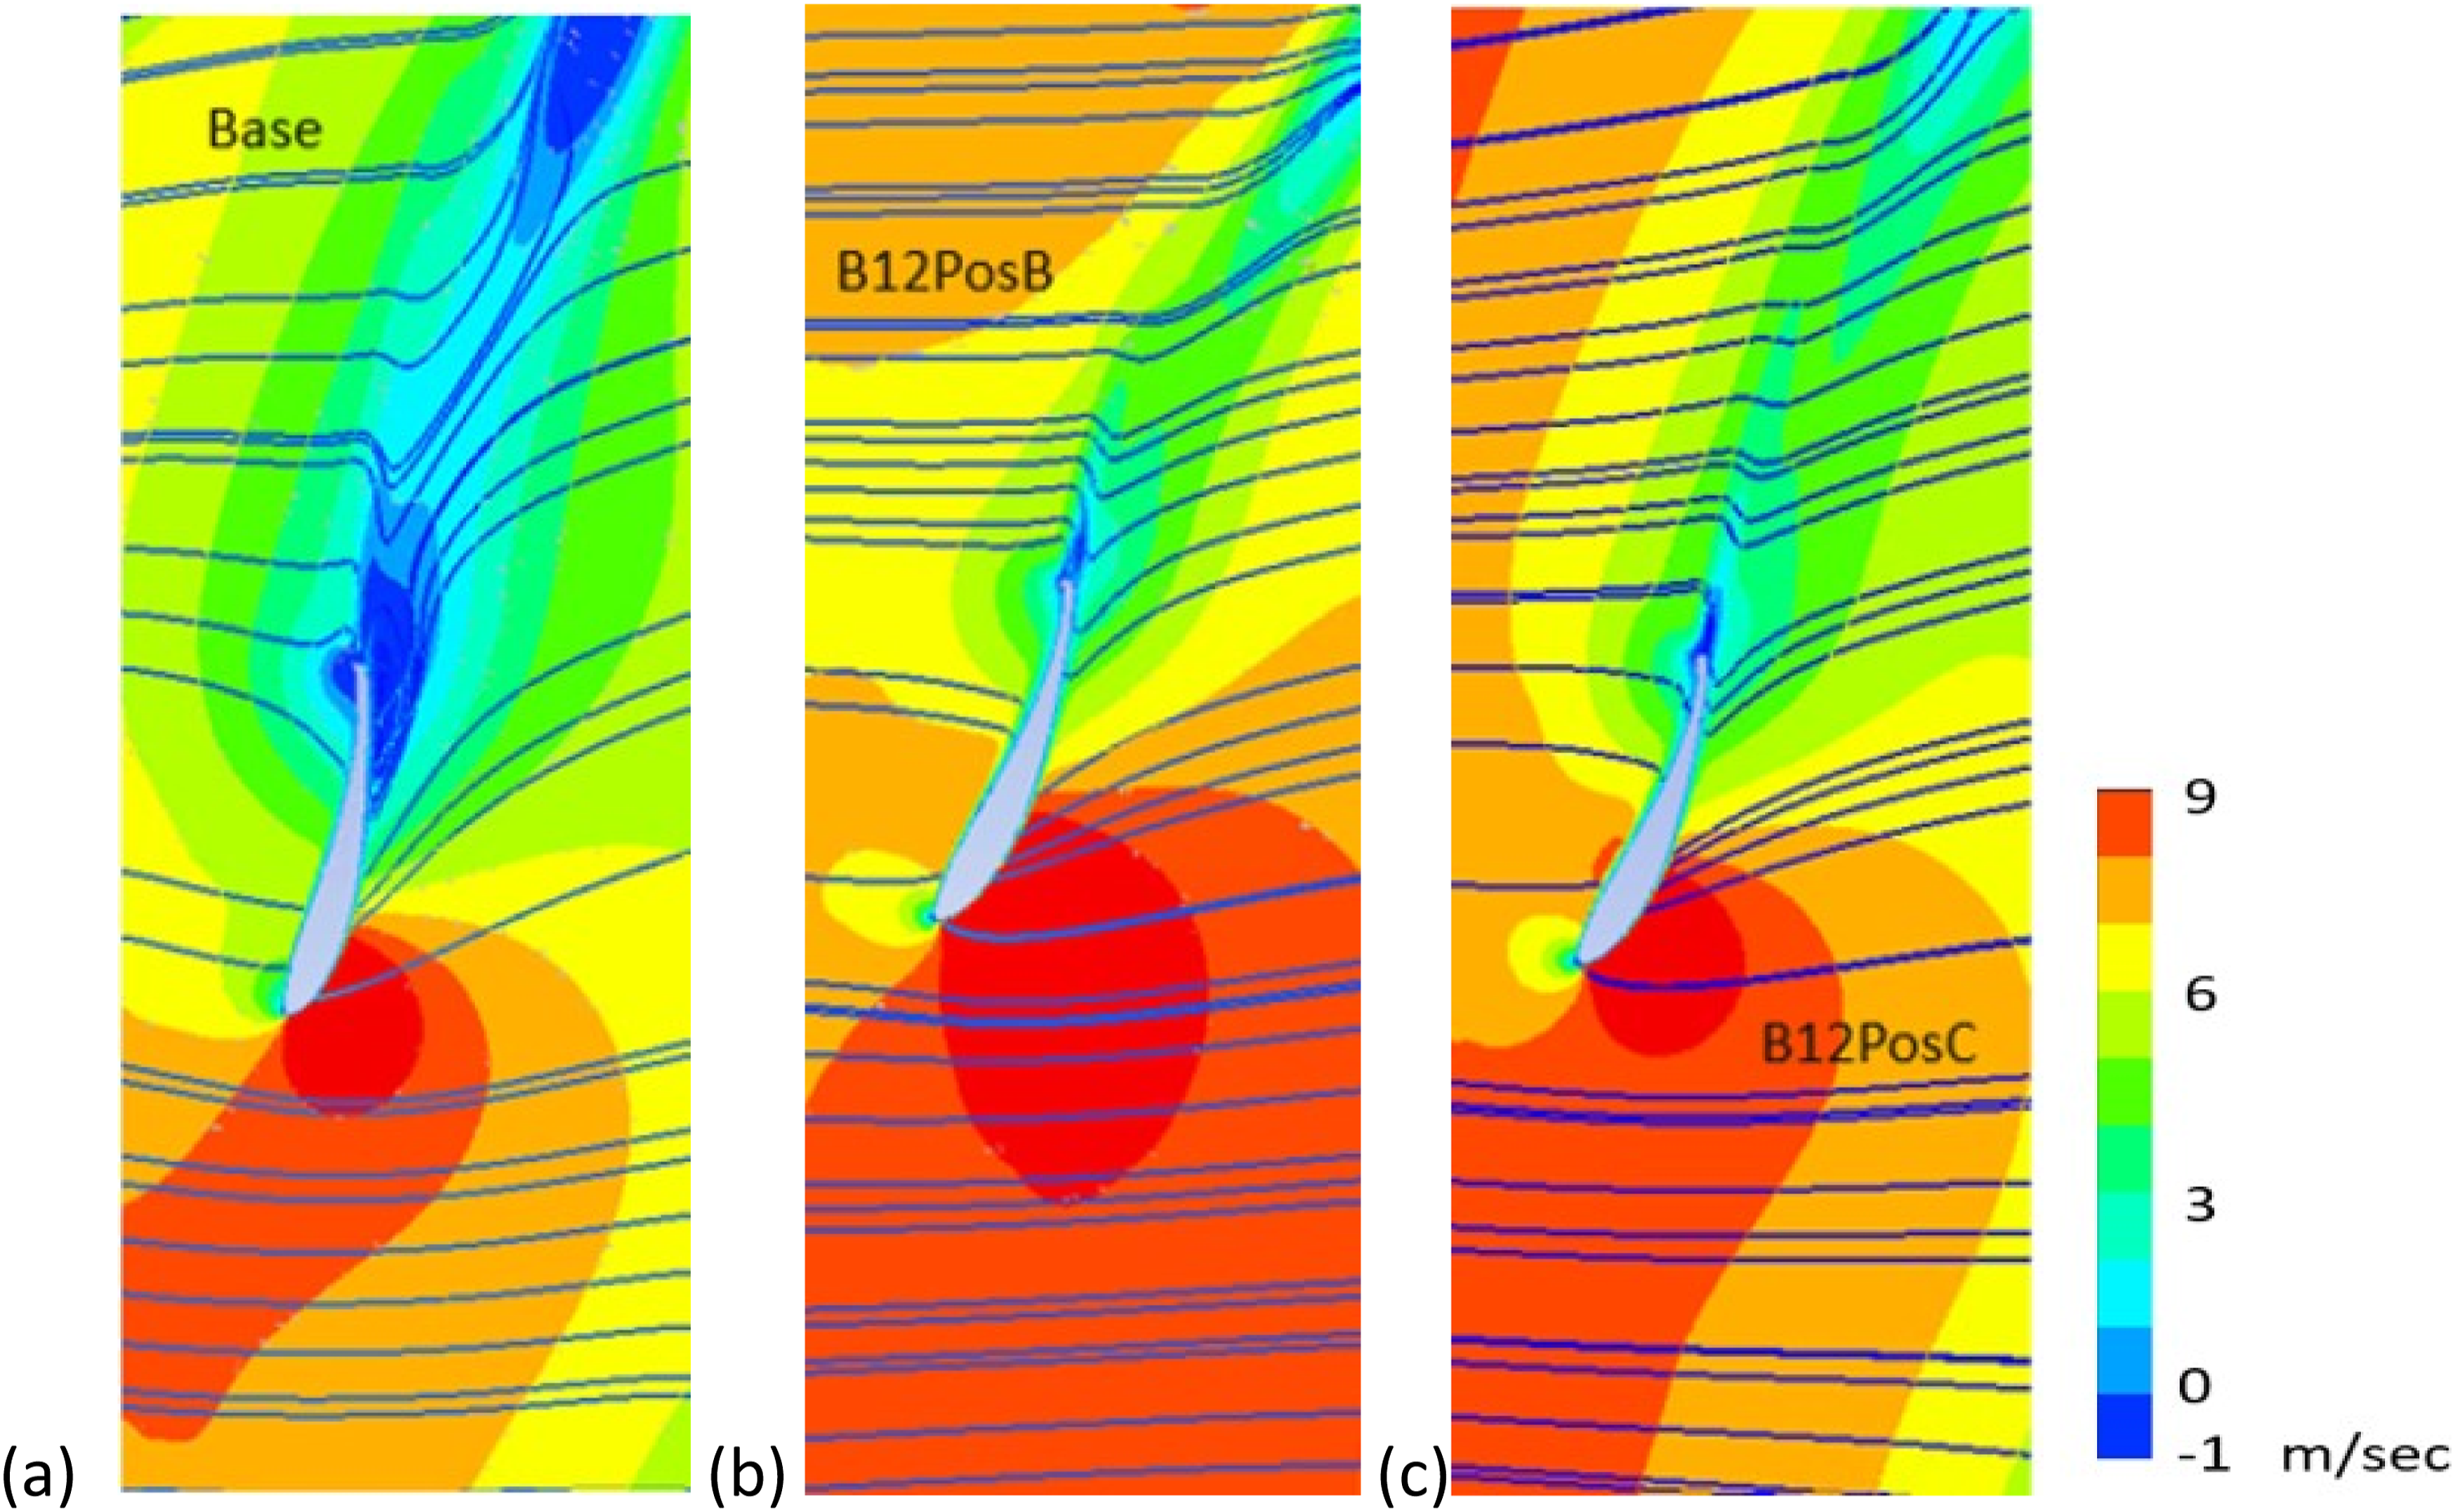
Determining from the axial velocity distributions, as shown in Figures 15 and 16, Base has the least leakage both radially and azimuthally. This finding is confirmed by the predicted power output, as Base has the best Cp value, compared to the other two tested geometries. Nonetheless, it also has the strongest BTV.
Simulations results from DAWT geometries.
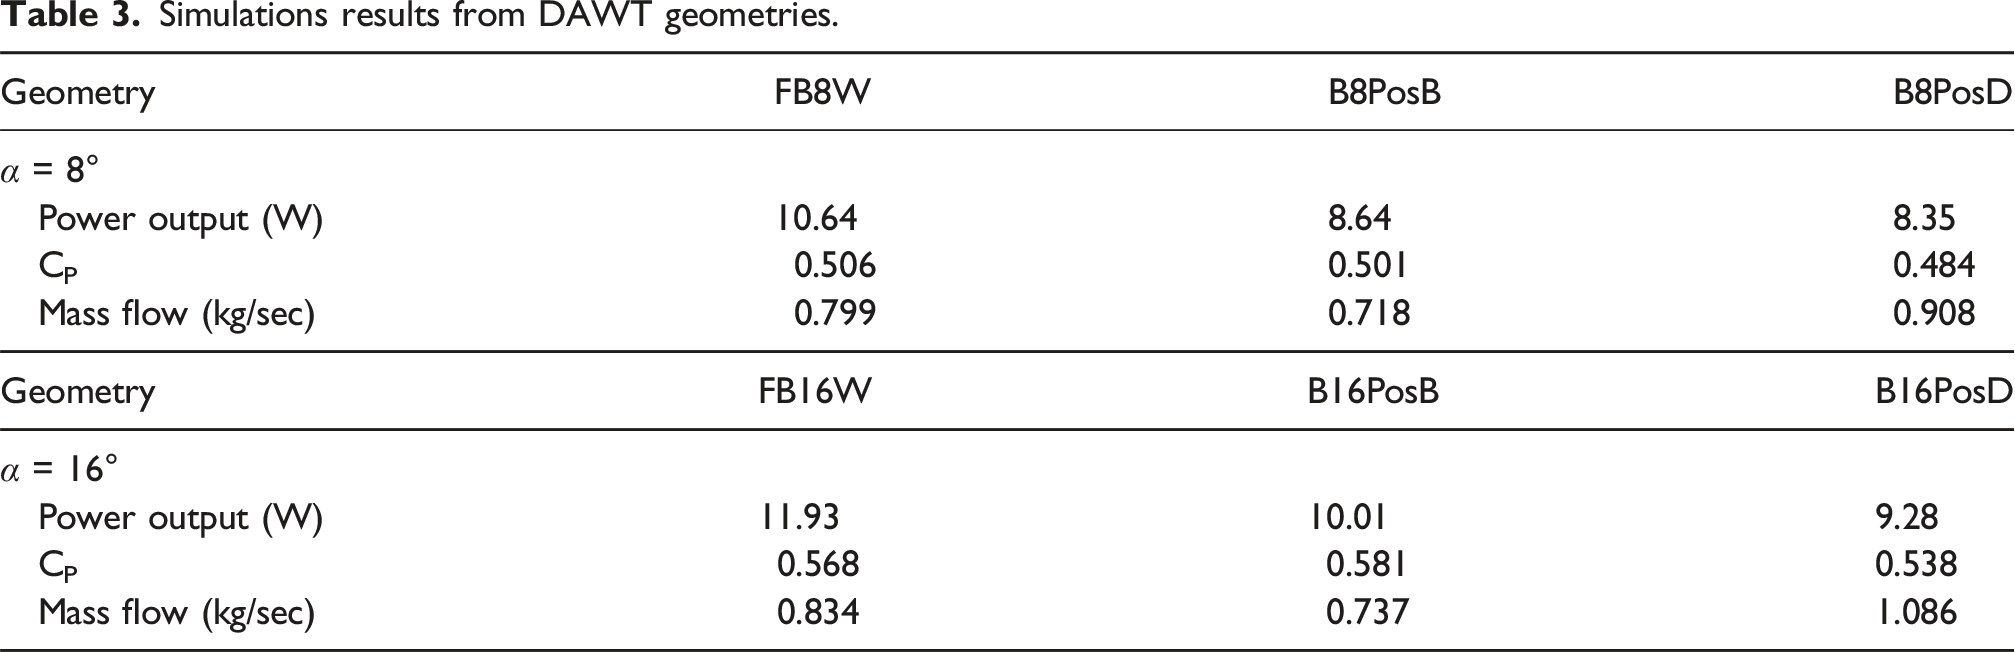
As previously stated, for all α values, the diffusers were set up to have the same throat radius. All BαPosBs have the same blade span; hence, their blockage ratios do not vary with α. Likewise, all FBαWs (including Base) have R = 180 mm, and their rotor axial positions were adjusted to have the same value of k, therefore, their blockage ratios are also unchanged against α. As the flowrate increases with α, the power coefficients increase as well. The power coefficients of BαPosBs increases faster than those of FBαWs. When α = 16°, Cp of B16PosB is larger than Cp of FB16W, meaning that the wind conditions is slightly less favourable for the DAWT when the rotor is placed aft of the throat, with the higher power output due to the longer blade span.
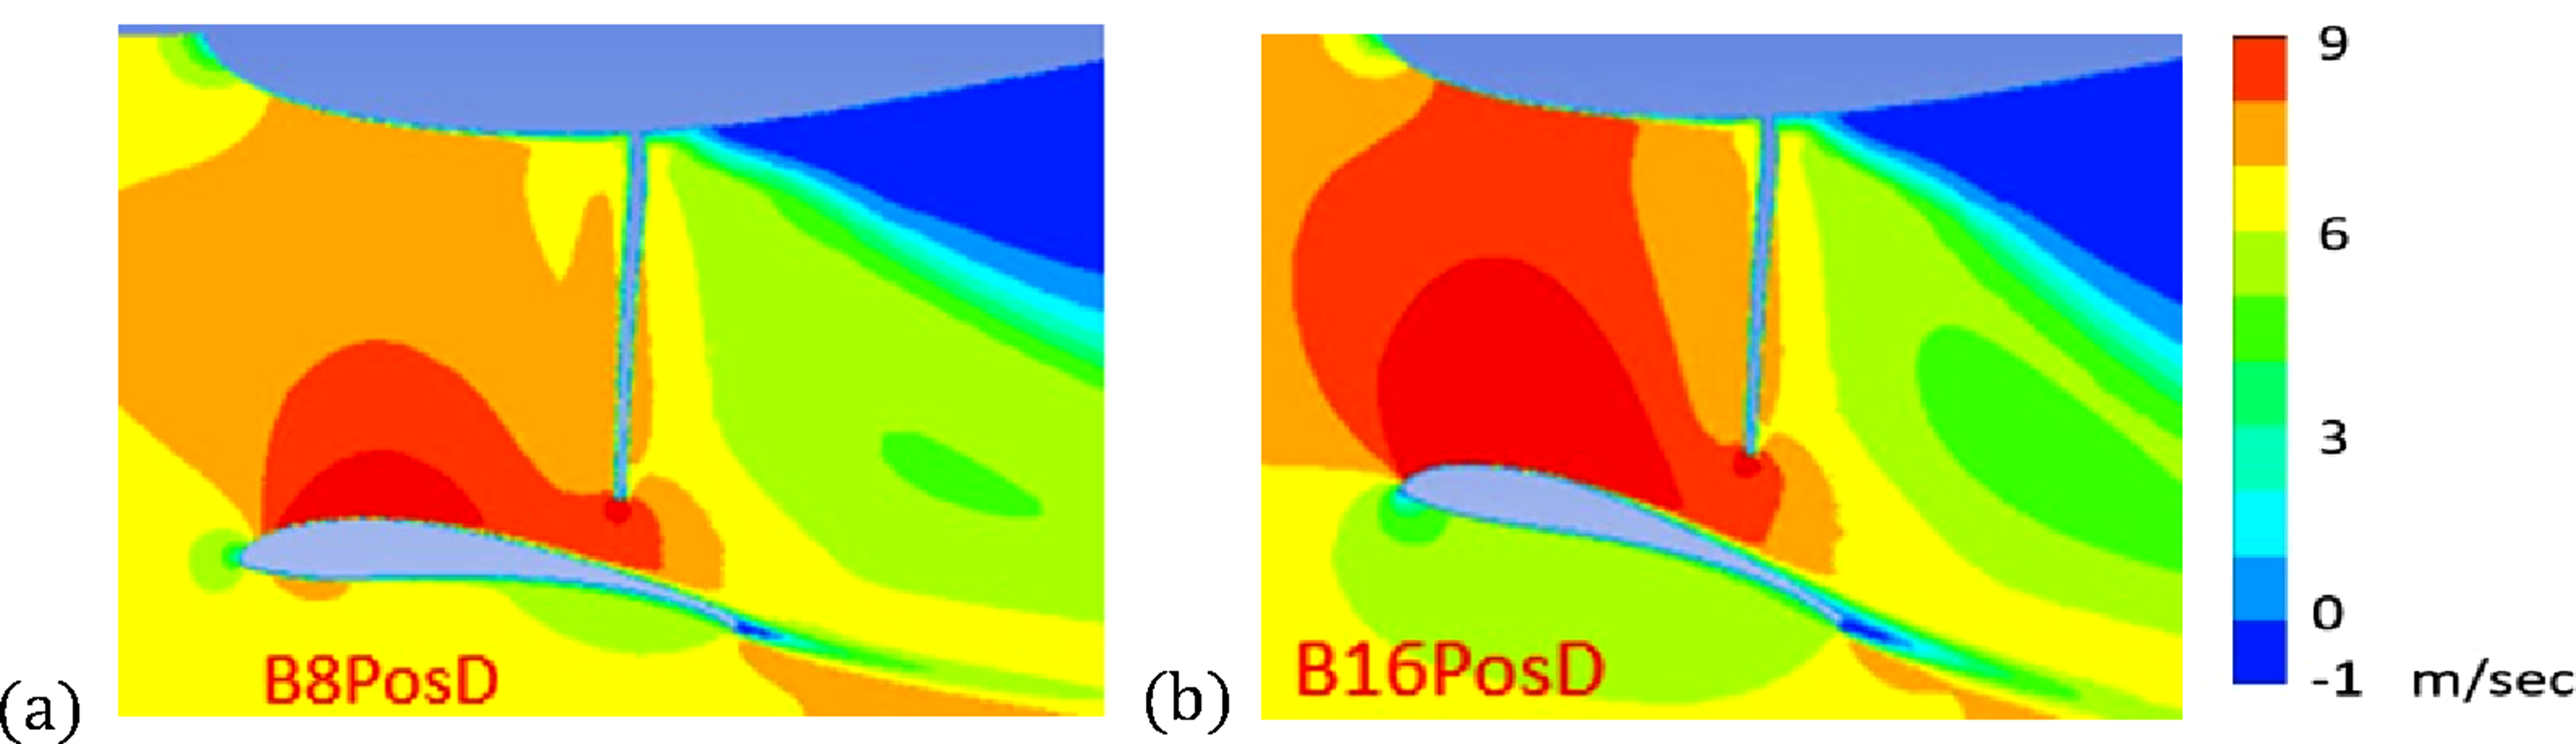
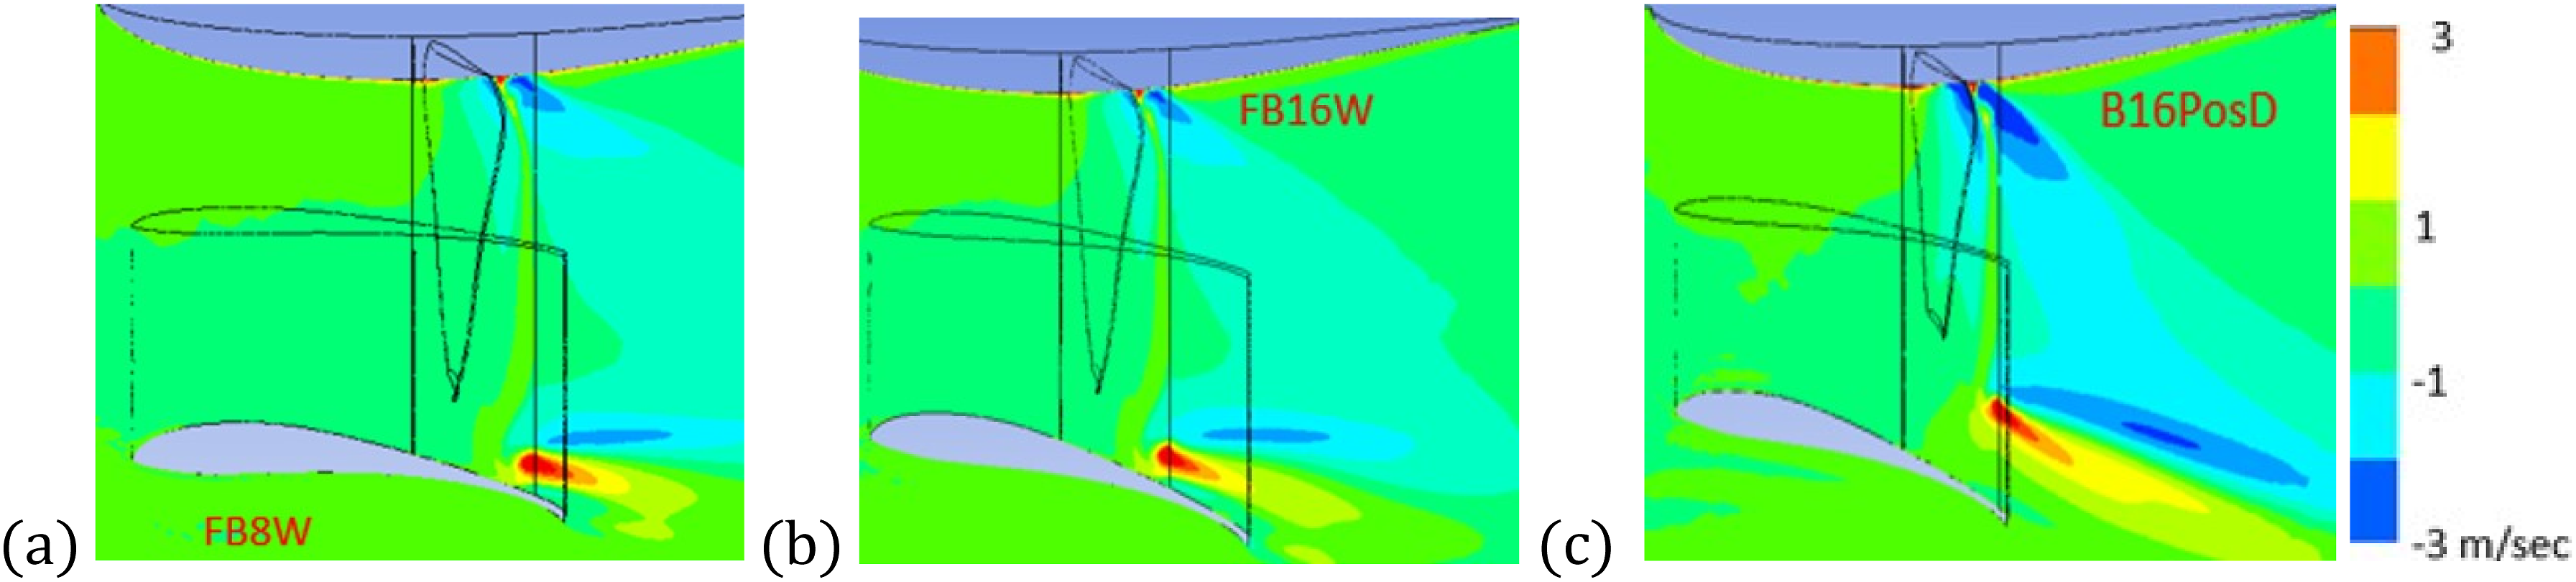
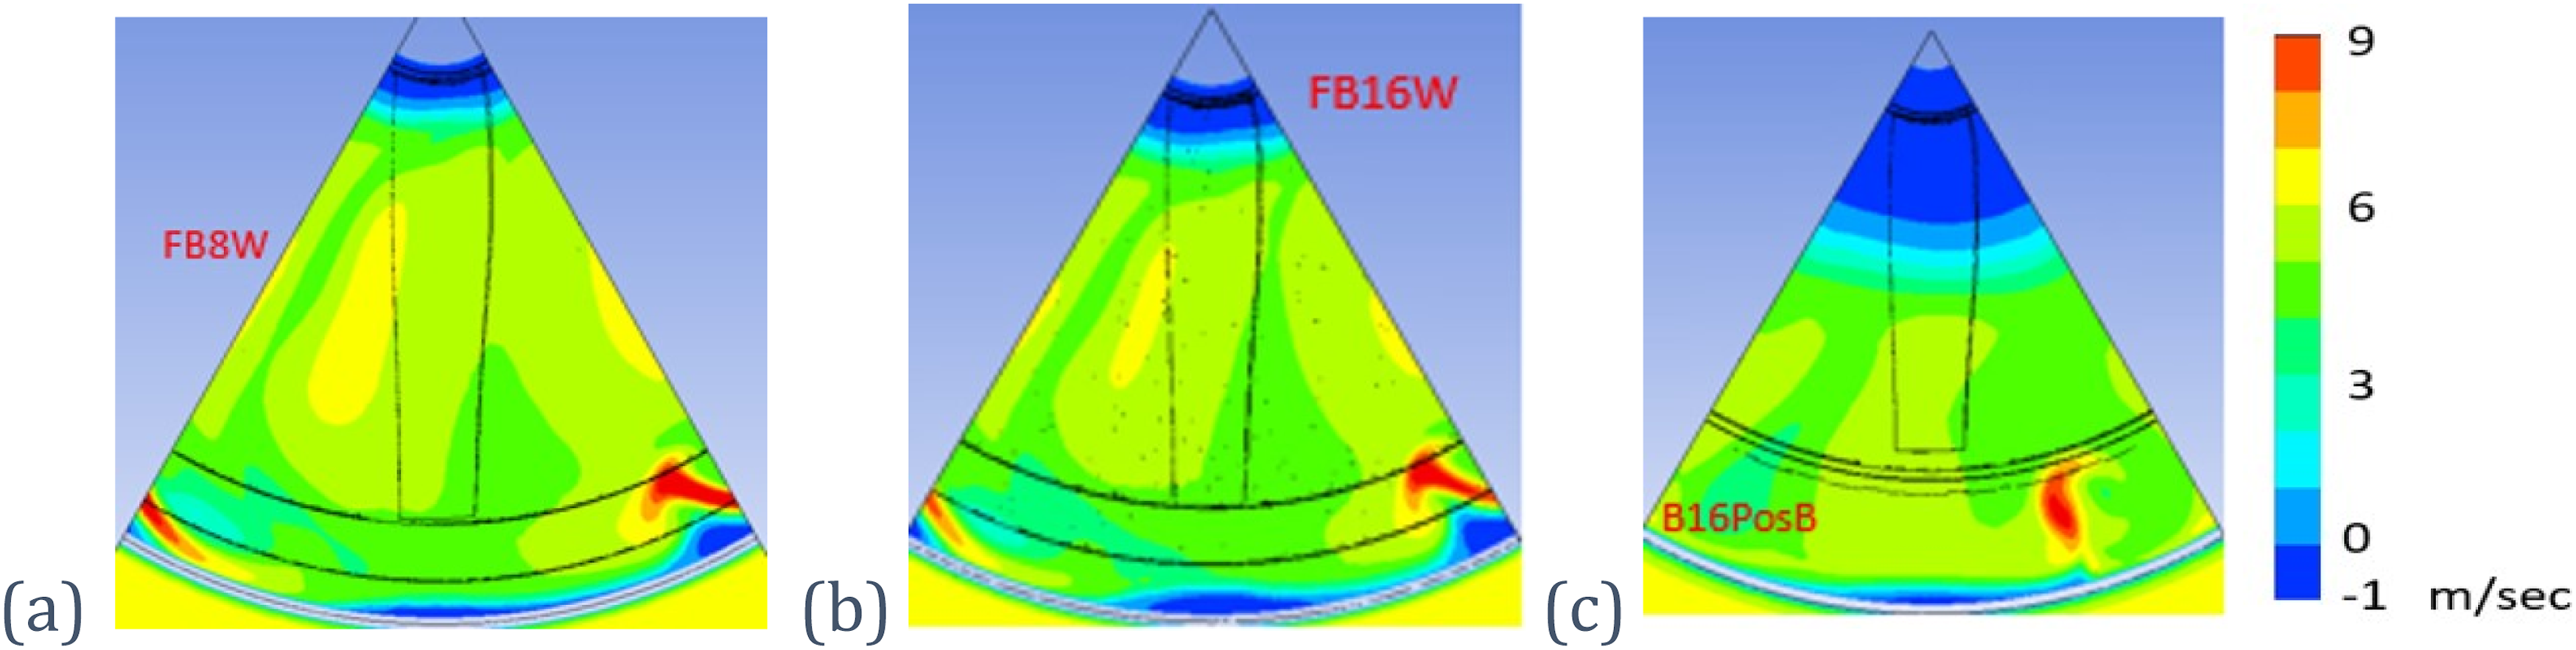
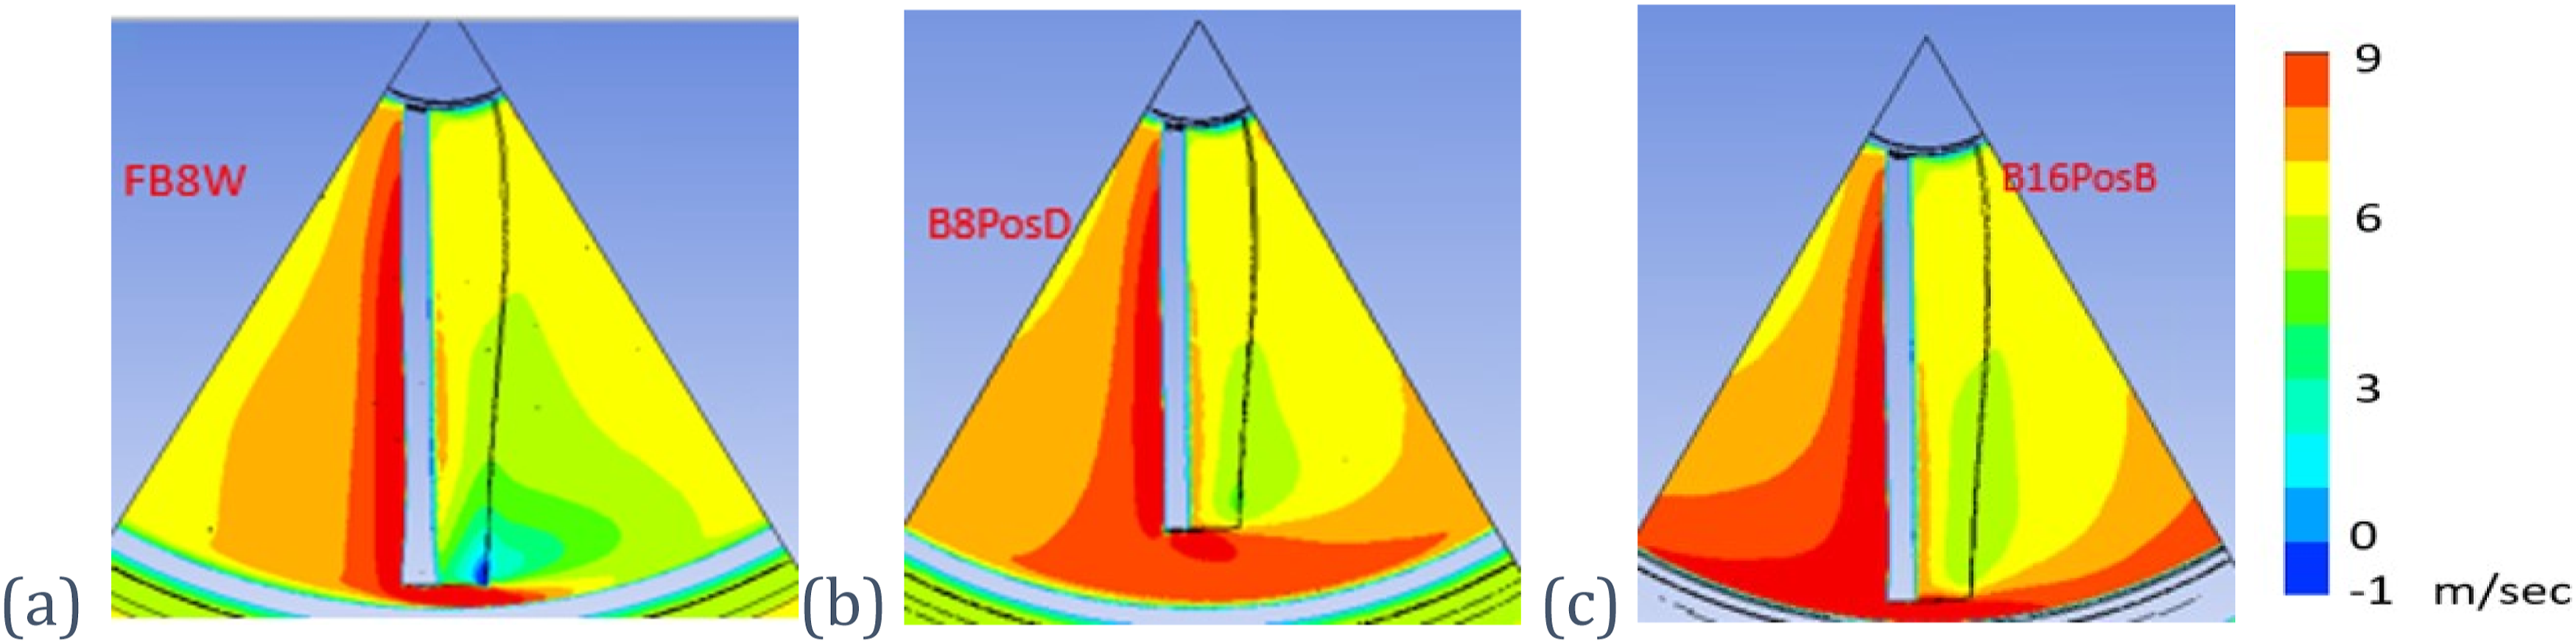
Figures 17–20 inclusive are the velocity contours on various planes for the DAWTs of the different α′s. Many findings of the results described above for α = 12° are also replicated, with the following generalisations or additions: I. There is a large recirculation vortex ring attached to the centre body, with the point of separation very close to the blade root. II. The highest axial velocity in the flow domain occurs inside the tip clearance enclosure close to the blade tip face, at a value of about 3U∞ for all the tested DAWT geometries. This is part of the radial flow leakage. III. A BTV occurs in all tested DAWT geometries; its strength varies in different geometry. The geometry produces the highest power has the strongest BTV. IV. In the diffuser of an operating DAWT, there are two vortices attached to the small square diffuser trailing edge. The vortex pair is contained to the width of this edge unless the rotating blade or the BTV is close to the diffuser exit. If so, one of the two vortices stretches into the diffuser inside wall forming a flow separation, but it covers only a small segment on the diffuser exit. V. BαPosB has the rotor at the throat and the mass flow is the lowest of the three, and its azimuthal leakage is the highest. Although it is the geometry with the weakest BTV, it is not the DAWT giving the highest power output. VI. Base or FBαW has a small k value, but it has the strongest BTV in the set with the same α. Axial vel. contours on rotor plane along x-axis. Azimuthal velocity contours on DP. Axial velocity contour at diffuser exit. Axial vel. Contour on cross-section through the blade.
Discussions and conclusions
Only nine geometries were simulated for this study owing to the high computational time required for 3D CFD simulations. This small number may not be enough to evaluate the optimal configuration of a DAWT for maximum power output; nevertheless, the simulation results from these DAWTs are adequate to ascertain the following findings, within the tested range of α: (a) A DAWT with a higher diffuser angle (16°) has a higher air mass flowrate and generates more power; and (b) With the same α, a higher power output can be attained from a DAWT with the rotor placed aft of the throat and with longer blade span than the one with the rotor located at the throat.
The flow separation vortex in an operating DAWT, detected in this study, is segmental and quite small and only exists if the rotating blade tip is close to the diffuser exit. If the size reduction of the flow separation vortex is caused by the induced circumferential velocity created by the turbine’s rotation as suggested by (Armfield and Fletcher, 1989; Clausen et al., 1993; Phillips, 2003), there should be some azimuthal pitch lead or lag between the rotor blade and the segmental vortex location. The vortices found in Base, FB8W and FB16W, as shown in Figures 9(a) and 19(a) and (b), are aligned well azimuthally with their rotor blades. As this vortex and the blade are aligned, increasing the blade span, that is by increasing x and decreasing tip clearance, to obtain higher power output could result in the blade tip protruding into the flow separation vortex, reducing the potential power increase from the increased blade length. As such, if maximum turbine power is desired, there is a limit for the proximity of the blade tip to the rim of the diffuser exit, either along the diffuser wall or radially.
When the rotor is located at the diffuser throat, there is a large volume of airflow inside the swept circle not contributing to the power generation and coined as ‘azimuthal leakage’ in this paper. To harness some of this ‘escaped’ wind energy, adjusting the rotor blade number (N) or the tip speed ratio (λ) may lead to improved turbine power output; however, further research is required.
The geometry and axial position of Base was replicated from one of the prototypes used in Kesby’s experiments (Kesby, 2018), with the highest power output obtained at Ω = 107.52 rad/sec when U∞ = 7 m/sec. These U∞ and Ω values are in the setting for all the DAWT geometries tested in this study. For this DAWT geometry, it is possible the turbine power output may peak at a different rotational speed and at different rotor axial locations.
For a DAWT with the rotor placed at the diffuser throat, the formation of BTV is suppressed (Lilley and Rainbird, 1957). The phenomenon is also observed in this study. It was suggested that the BTV suppression is caused by the small value of k (De Vries, 1979; Phillips, 2003). BαPosBs and FBαWs (including Base), with the same k value of 7 mm, have a pocket of air leaking through this clearance adjacent to the blade tip at an axial velocity of 3U∞. The volume and intensity of this leakage signifies the magnitude of the blade tip losses, not necessarily related to whether a BTV is formed.
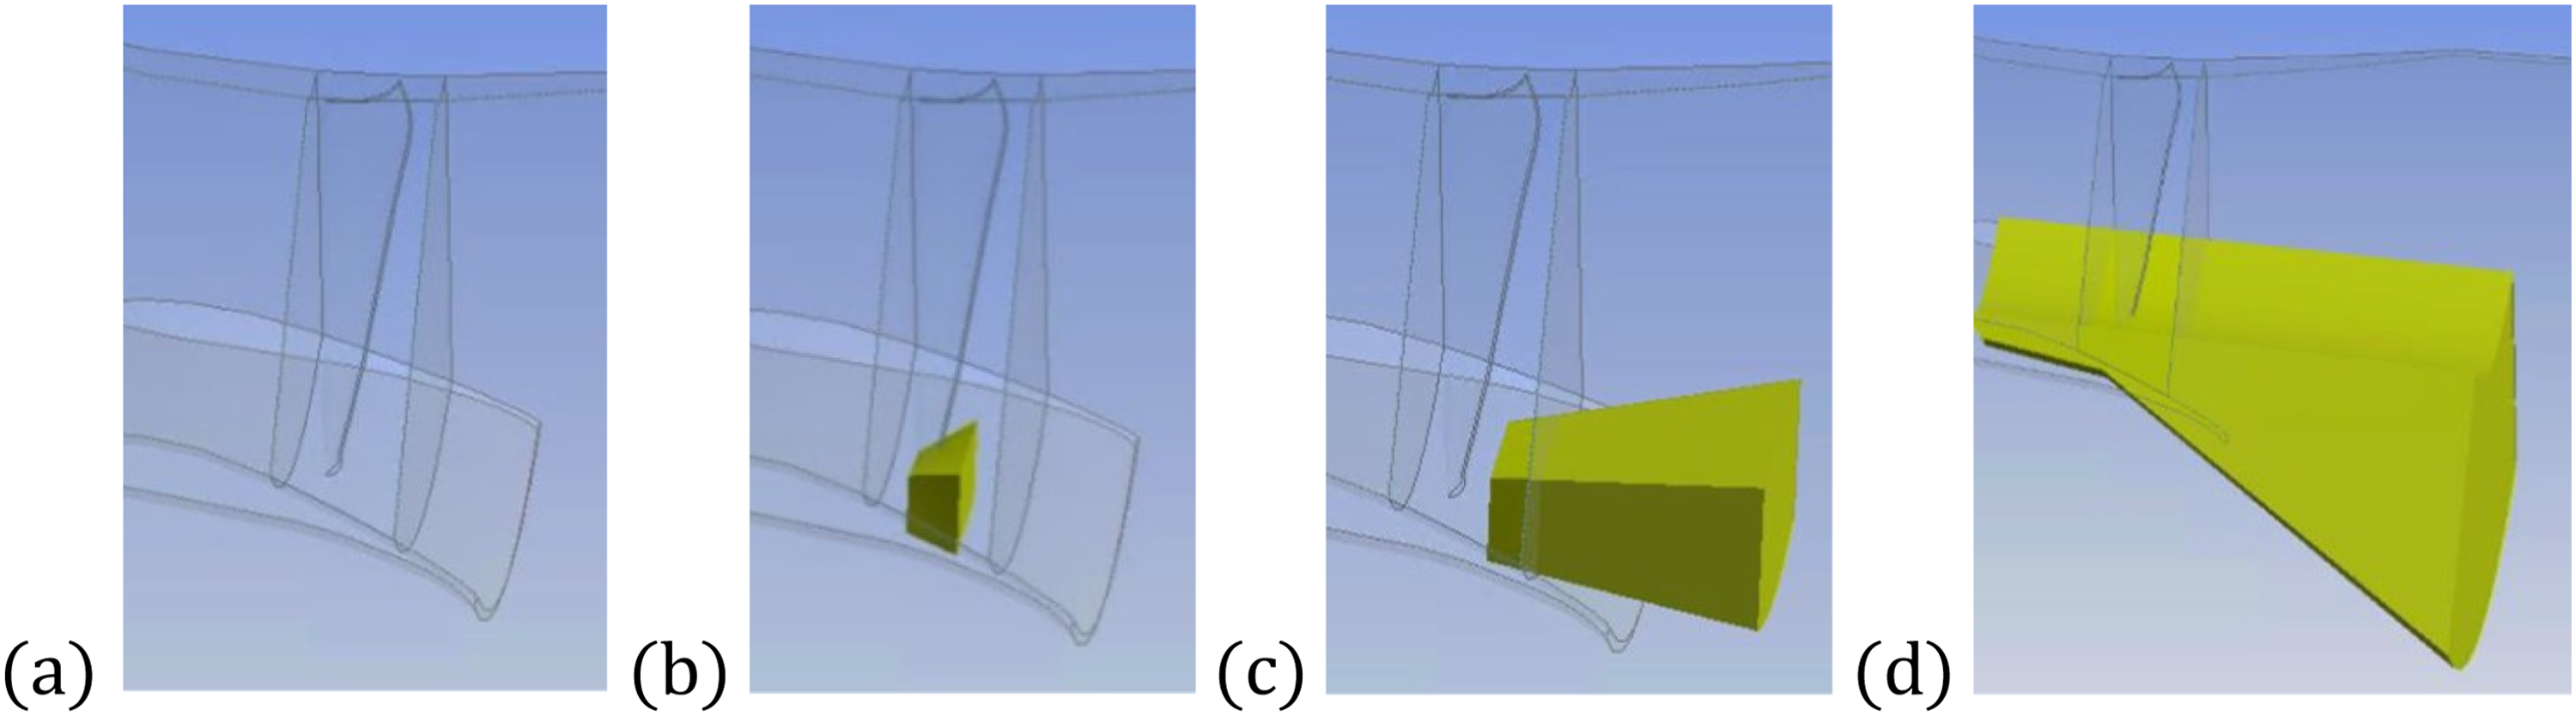
As previously stated, the DAWT geometry for this study was obtained from (Kesby, 2018), with the model of the blades of Base constructed to have the tips flat and square. As the k value is measured along the blade twist centreline, the actual distance to the diffuser wall is non-uniform on the tip face of Base, as shown in Figure 21, leading to a discrepancy of about 1.5 mm from one extreme on the tip face to the other. This discrepancy is further exacerbated as x or α is increased. For those geometries with the blade tip close to the diffuser wall, BαPosB and FBαW, the blades are trimmed by rotating the profile at the designated rotor location giving a uniform clearance between the blade tip and diffuser wall, also shown in Figure 21. To eliminate the non-uniformity of the blade tip to diffuser wall gap, the profiled trimming method should be selected for any investigations into tip gap reduction. Blade tip configurations for DAWTs with different rotor locations.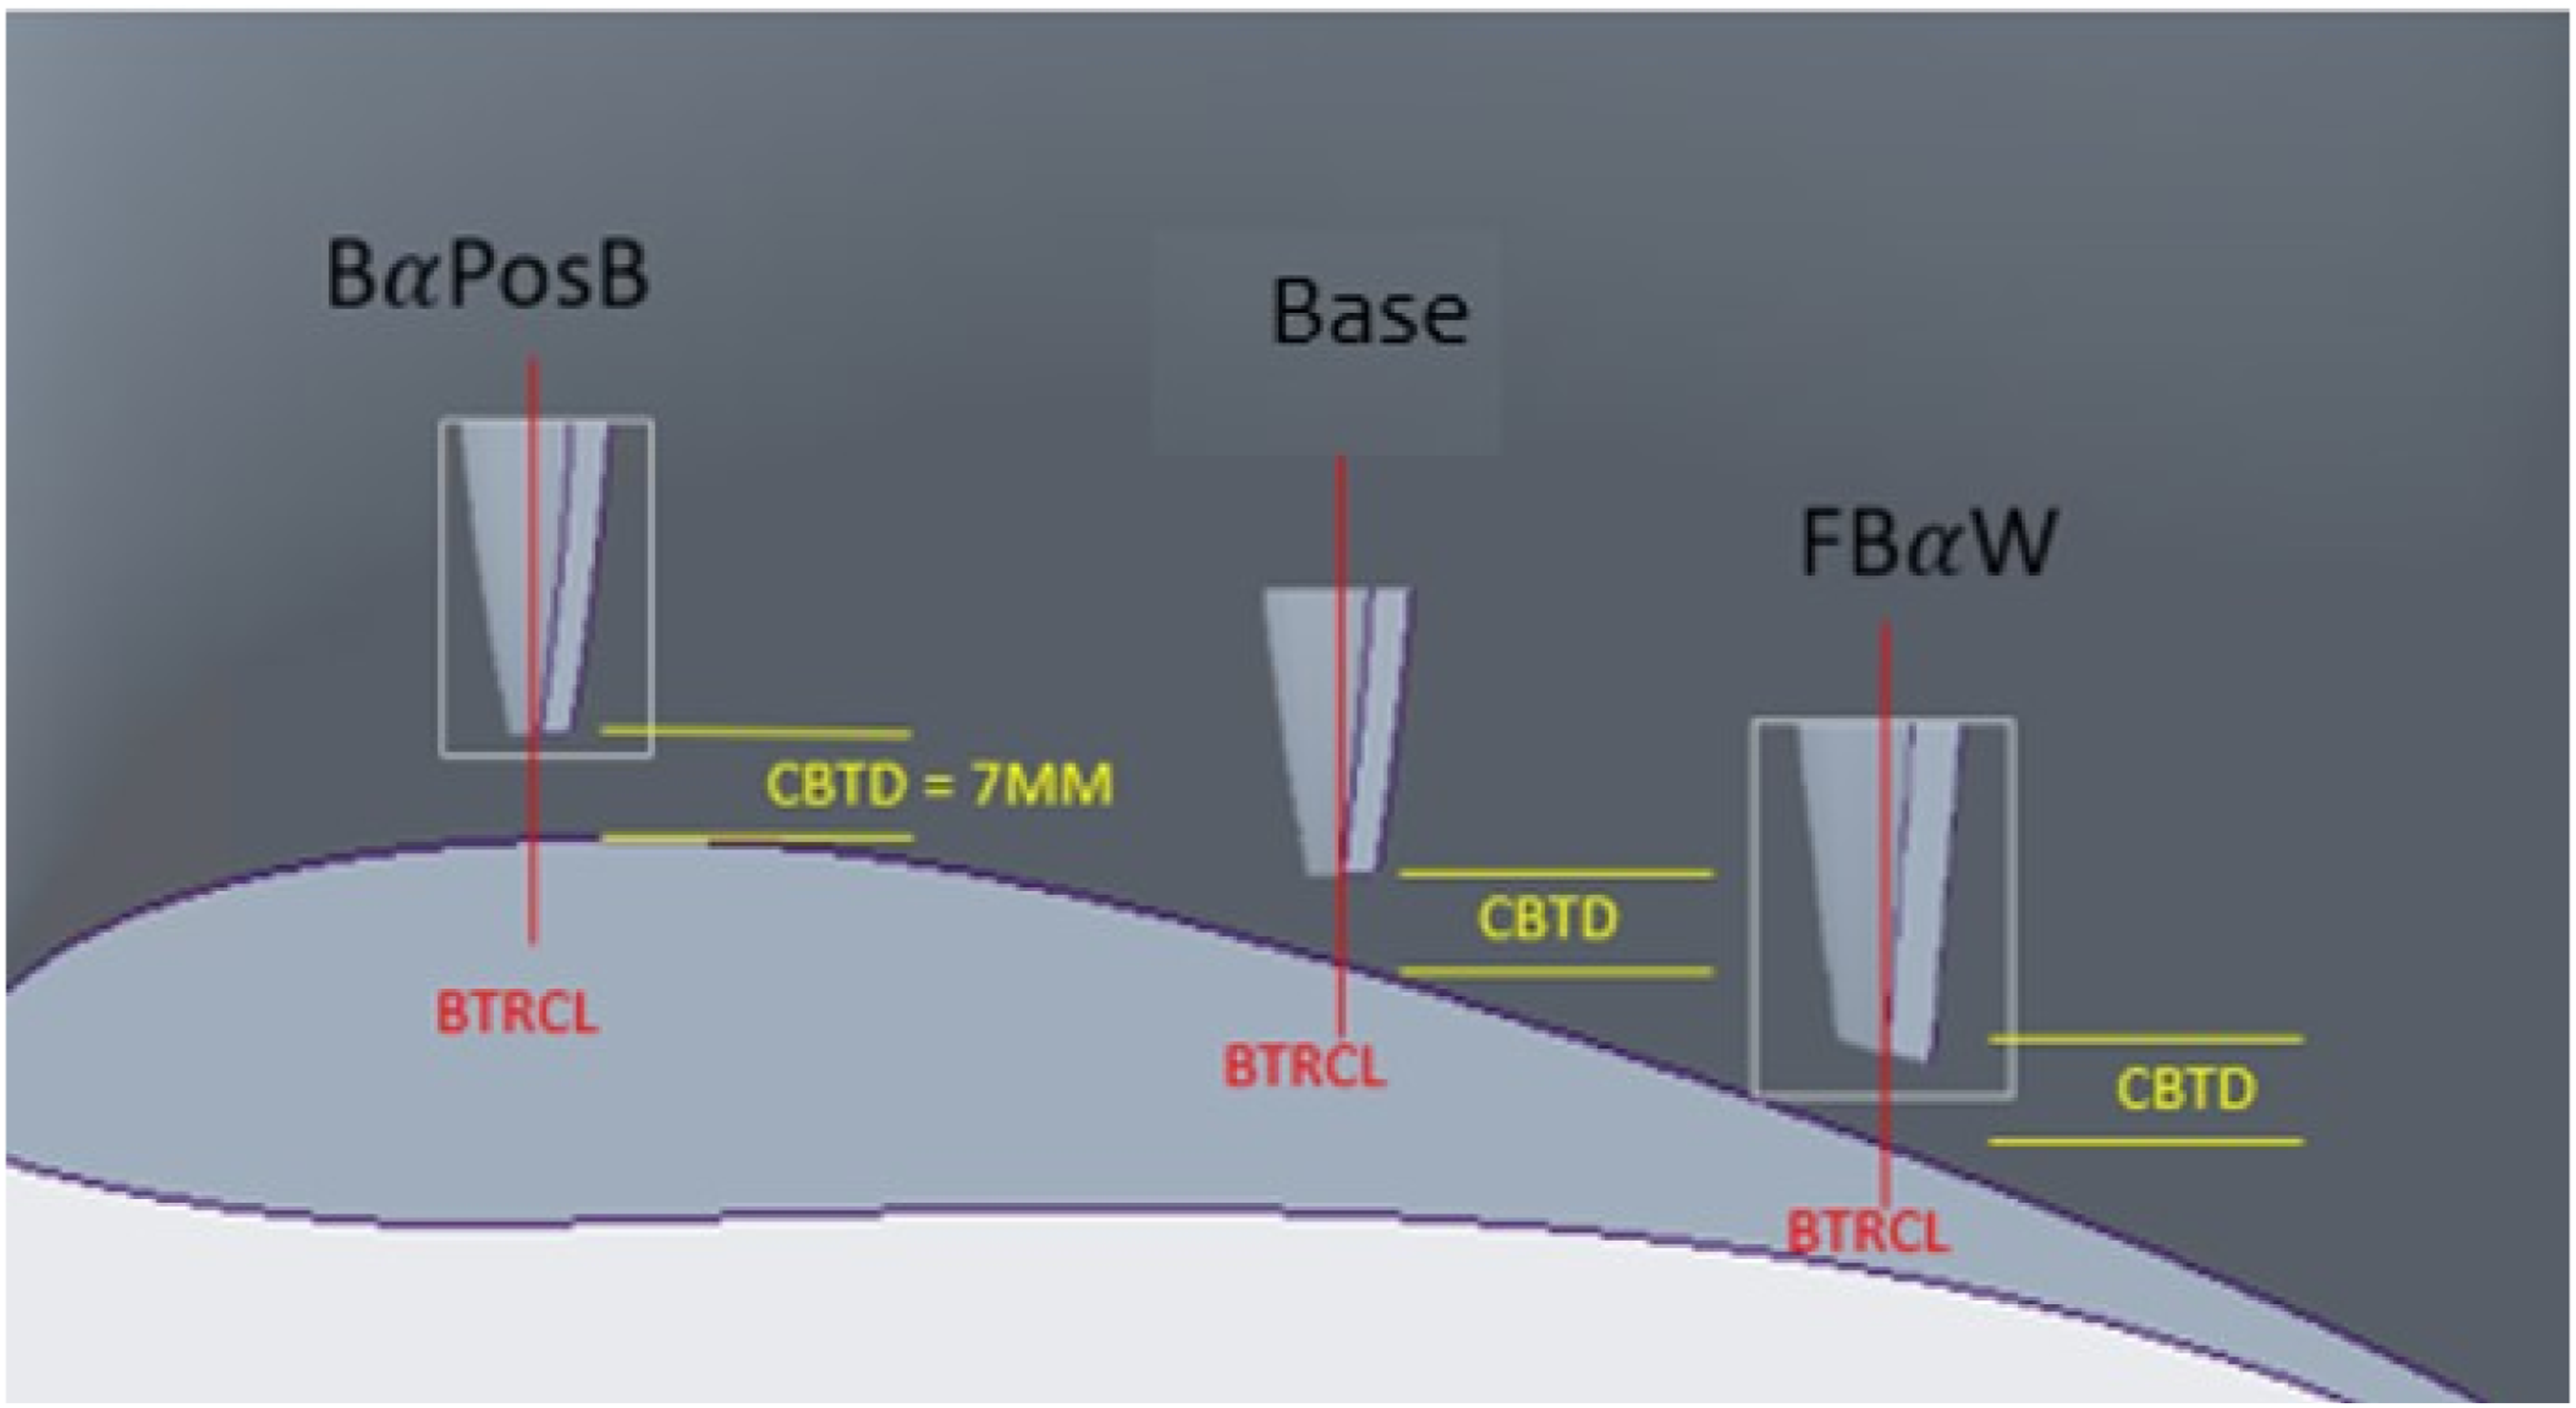
A non-uniform clearance at the blade tip is inevitable in a ‘real’ DAWT, due to fabrication defects and material wear. A sensitivity test on how such a defect affects the turbine power output has been performed by the authors using 3D CFD simulations and a paper is in progress. Indicatively, the impact is minimal within the tested k range.
The negative pressure behind the DAWT draws air through the diffuser from its entrance and from far downstream, recirculating some flow against the mainstream creating a vortex ring attached to the centre body. Furthermore, the vortex ring separation point is very close to the blade root so much so a good portion the diffuser interior is in this recirculation zone or closely affected by it. As part of the recirculation, the radial flow shifts the axial airflow outward towards the diffuser wall which is beneficial to the turbine’s power output. The total airflow through the diffuser is increased by the recirculating inviscid flows along the turbine axis supplementing the air stream from the entrance. The work presented in this paper cannot substantiate the benefits of the recirculation to the turbine power generation, but its impact on the velocity distributions inside the diffuser has been clearly illustrated. From the few research studies which have included a centre body (Heikal et al., 2018; Jafari and Kosasih, 2014; Phillips et al., 1998; Shives and Crawford, 2011), the size and location of the recirculation vortex varies with the shape of the centre body. Furthermore, the centre body size and the blade mounting location are the main airflow blockage factors, thus affecting the airflow rate into the DAWT rotor. Hence, the centre body geometry is a DAWT design parameter.
The thrust coefficient (CT) is a design parameter for rotor blades, especially when the actuator disk model is applied in the CFD simulations. Not making the normal assumption of a constant CT across the disk, Shives and Crawford (Shives and Crawford, 2011) introduced a non-uniform loading factor (Cnu) to adjust the CT value radially in their work on optimising the DAWT power output, with the major outcomes of this work shown in Figure 22. The two inviscid flow generating features, the recirculation on the centre body and the flow separation on the diffuser, are reasonably large when the optimal case was identified. Although their rotor is positioned at the diffuser throat, the results presented in this paper are in good agreement with the results of Shives and Crawford (2011) indicating that inviscid flows in DAWT are not necessarily detrimental to turbine’s power output. The size and location of these two flow features are greatly influenced by the behaviour and characteristics of the rotor blade. It further signifies the importance of CT as a turbine design parameter. Axial velocity contour on Cp optimisation with non-uniform CT (Shives and Crawford, 2011).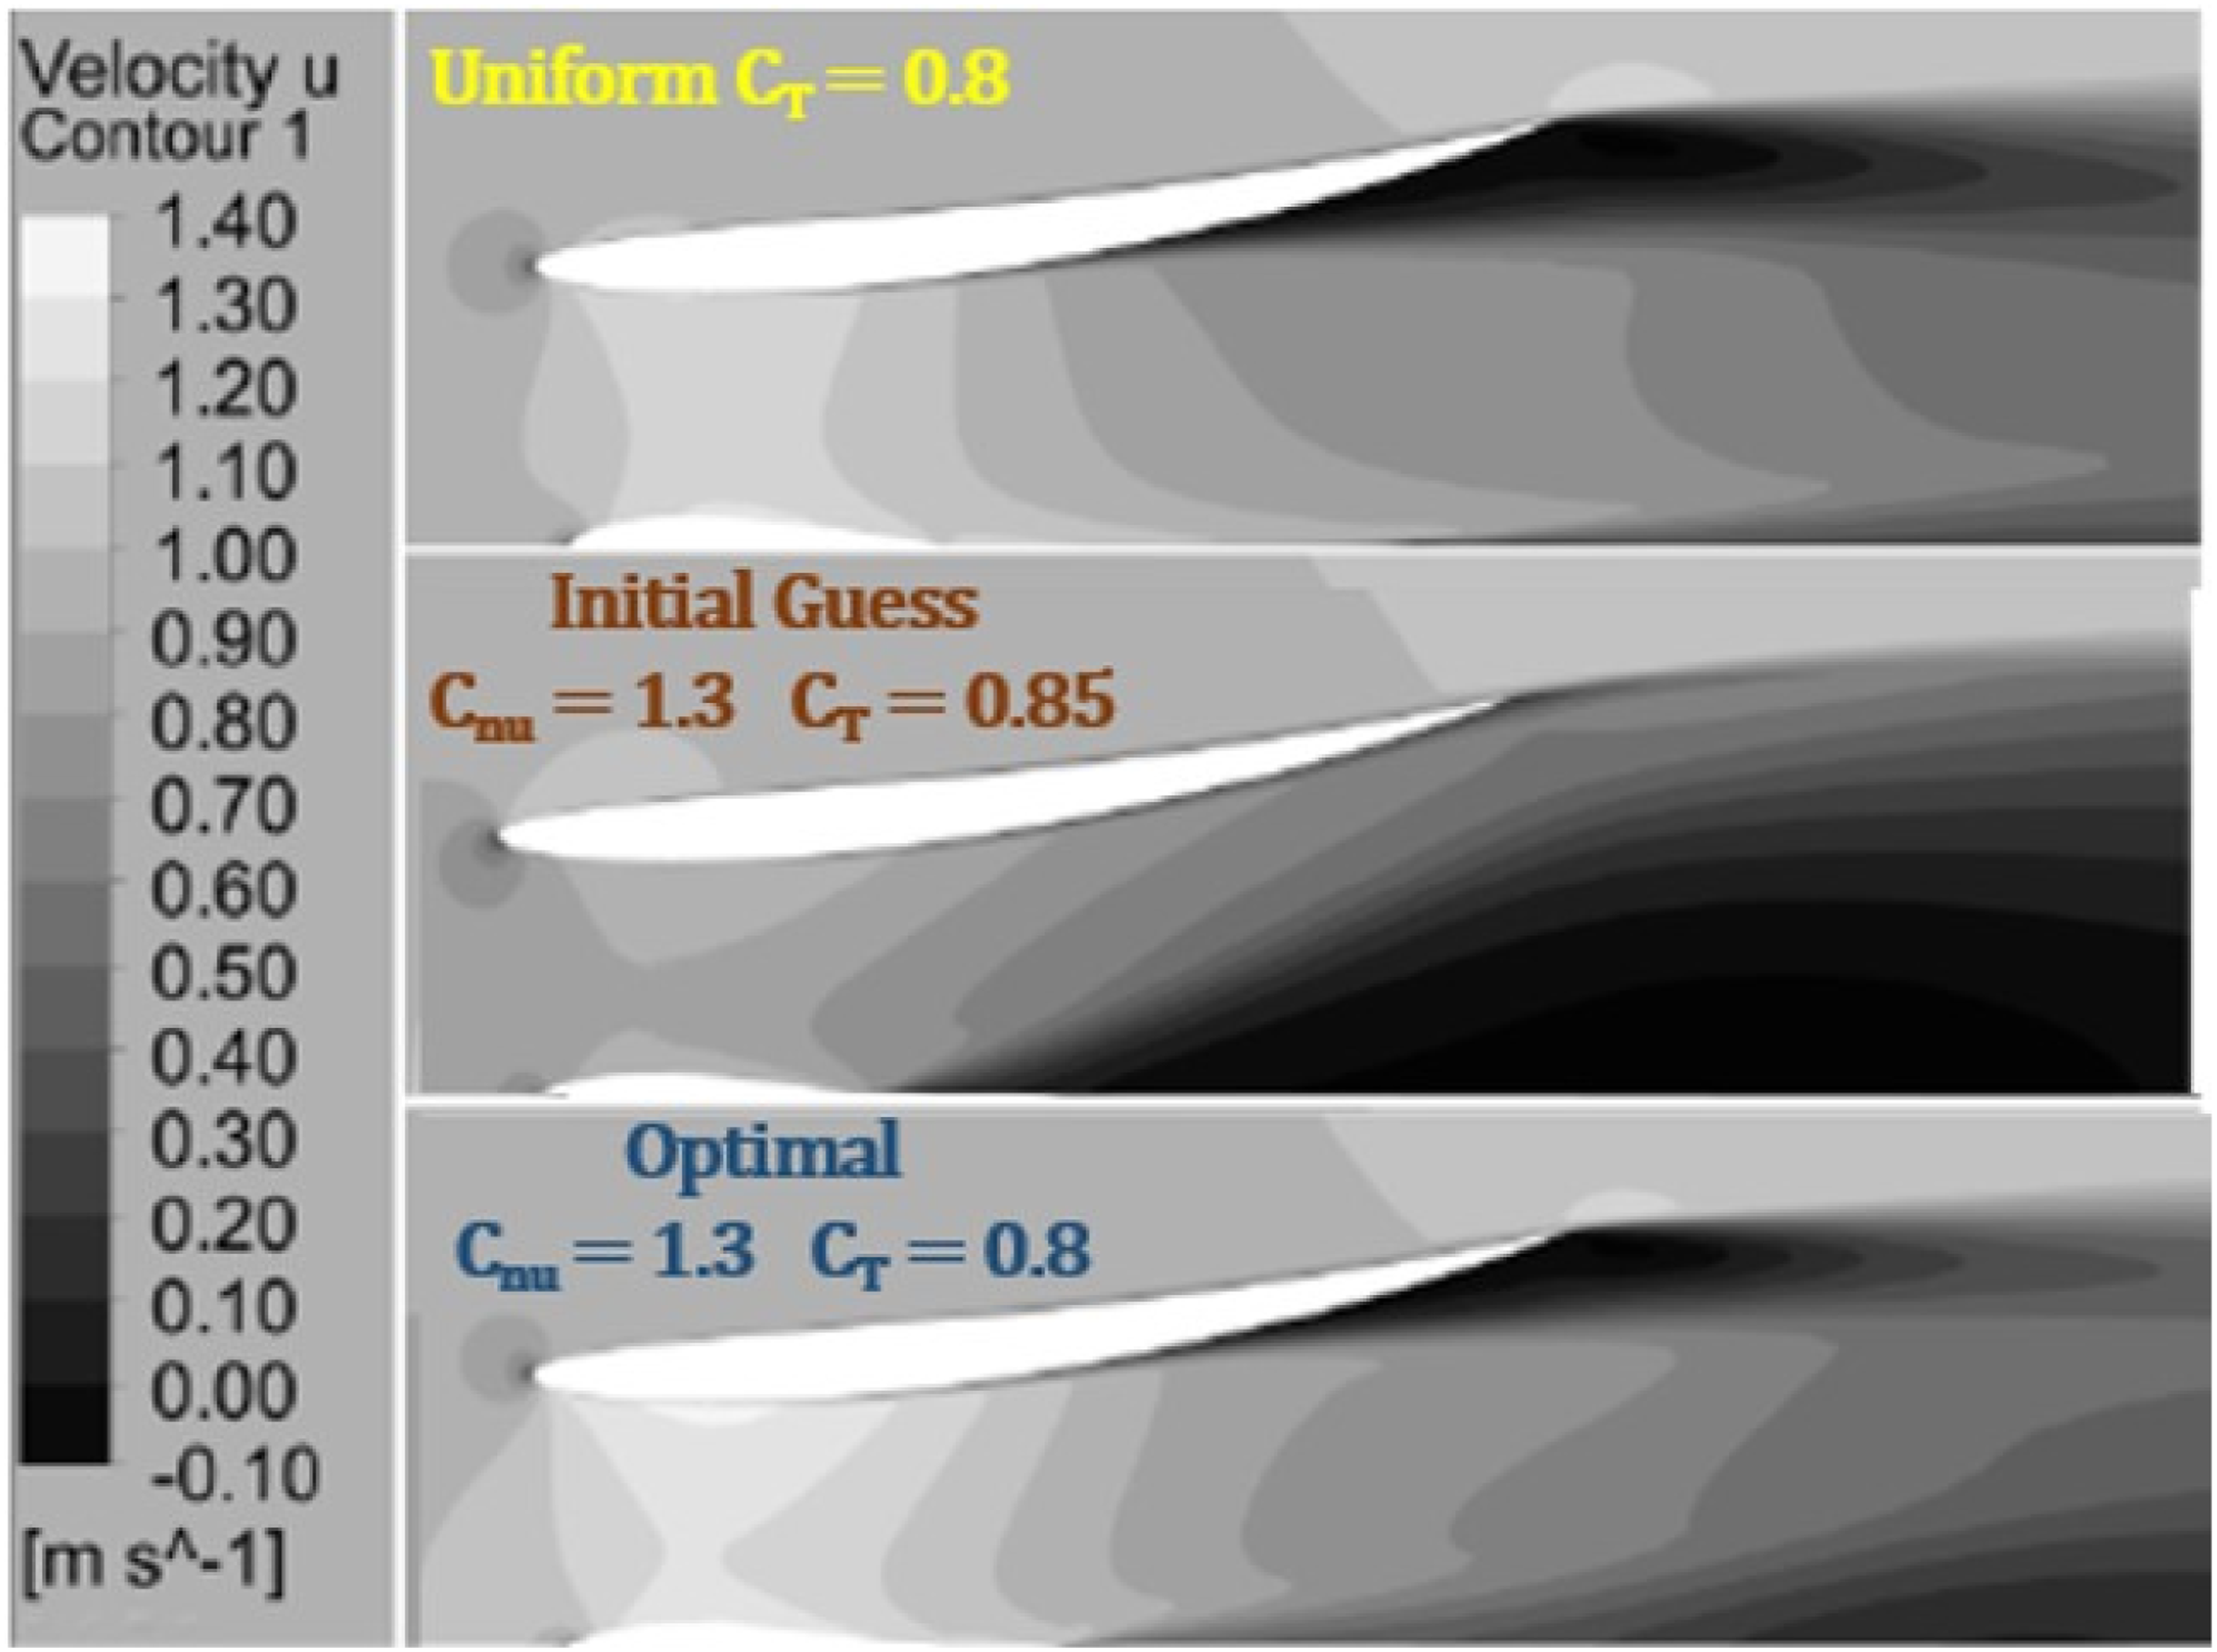
Footnotes
CRediT author statement
Funding
The authors received no financial support for the research, authorship, and/or publication of this article.
Declaration of conflicting interests
The authors declared no potential conflicts of interest with respect to the research, authorship, and/or publication of this article.
Data Availability Statement
The Fluent outputs, case-files and data-files, underlying this study are available upon request to the author by email.
Appendix
Rotor blade profile dimensions.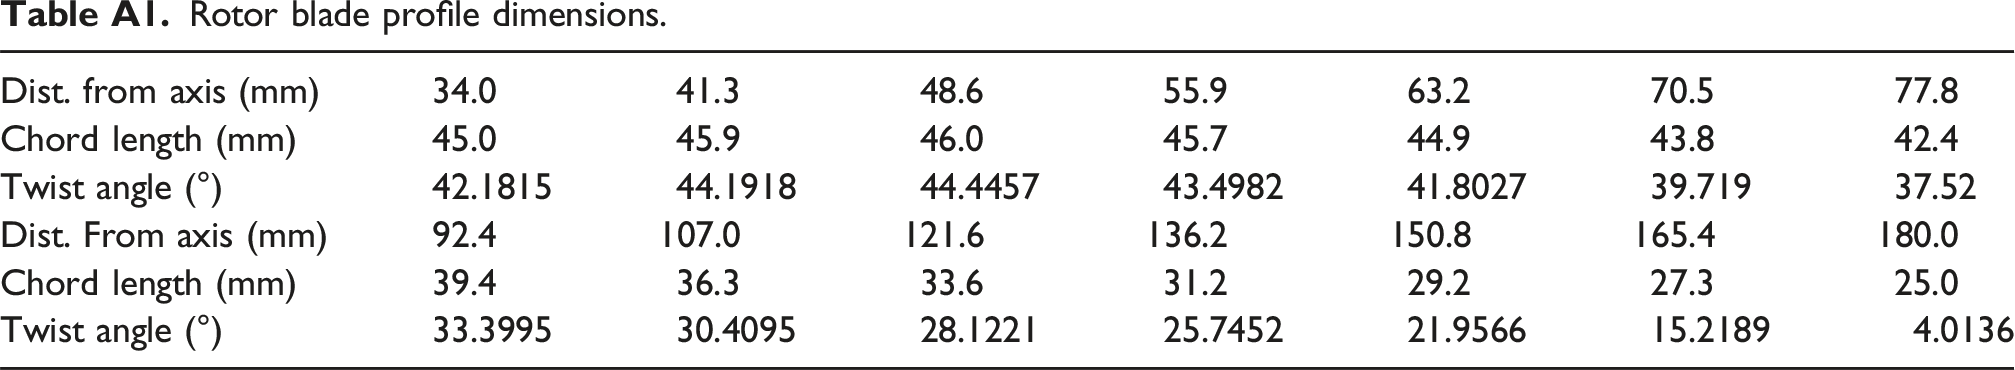
Dist. from axis (mm)
34.0
41.3
48.6
55.9
63.2
70.5
77.8
Chord length (mm)
45.0
45.9
46.0
45.7
44.9
43.8
42.4
Twist angle (°)
42.1815
44.1918
44.4457
43.4982
41.8027
39.719
37.52
Dist. From axis (mm)
92.4
107.0
121.6
136.2
150.8
165.4
180.0
Chord length (mm)
39.4
36.3
33.6
31.2
29.2
27.3
25.0
Twist angle (°)
33.3995
30.4095
28.1221
25.7452
21.9566
15.2189
4.0136
Centrebody profile dimensions.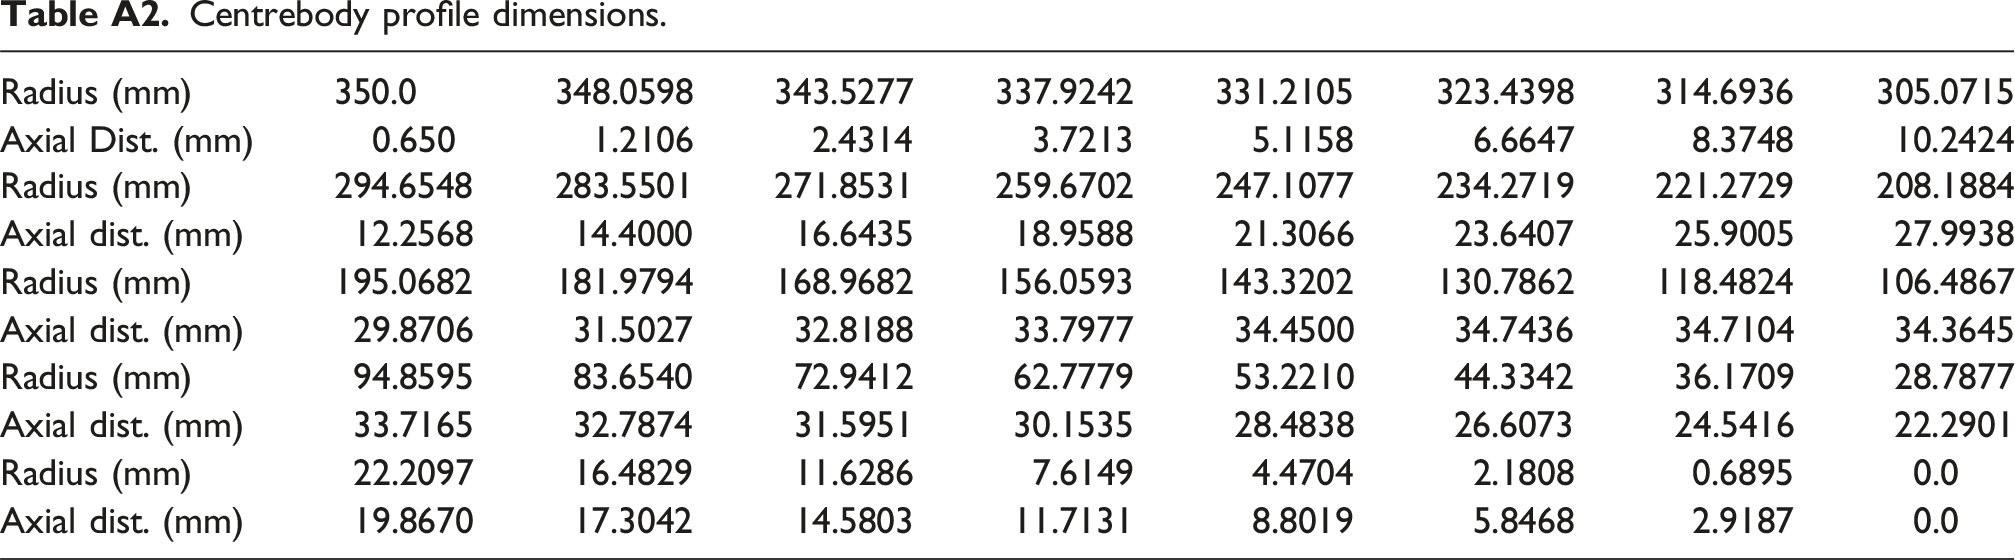
Radius (mm)
350.0
348.0598
343.5277
337.9242
331.2105
323.4398
314.6936
305.0715
Axial Dist. (mm)
0.650
1.2106
2.4314
3.7213
5.1158
6.6647
8.3748
10.2424
Radius (mm)
294.6548
283.5501
271.8531
259.6702
247.1077
234.2719
221.2729
208.1884
Axial dist. (mm)
12.2568
14.4000
16.6435
18.9588
21.3066
23.6407
25.9005
27.9938
Radius (mm)
195.0682
181.9794
168.9682
156.0593
143.3202
130.7862
118.4824
106.4867
Axial dist. (mm)
29.8706
31.5027
32.8188
33.7977
34.4500
34.7436
34.7104
34.3645
Radius (mm)
94.8595
83.6540
72.9412
62.7779
53.2210
44.3342
36.1709
28.7877
Axial dist. (mm)
33.7165
32.7874
31.5951
30.1535
28.4838
26.6073
24.5416
22.2901
Radius (mm)
22.2097
16.4829
11.6286
7.6149
4.4704
2.1808
0.6895
0.0
Axial dist. (mm)
19.8670
17.3042
14.5803
11.7131
8.8019
5.8468
2.9187
0.0