
Abstract
This work investigates the prospect of rotor broken bar defect diagnosis in squirrel cage induction generator-based wind turbine using fuzzy logic system (FLS) of the stator currents. The generator current signal is analyzed through the power spectral density (PSD) to diagnose the magnitudes and frequencies associated with various defects. These magnitudes and frequency components are used to apply the system of Fuzzy logic by simulation software.
Introduction
Squirrel cage-type rotors of induction generators based wind turbines are robust, trustworthy, and inexpensive. Therefore, they are commonly used in renewable energy conversion systems (Sumathi et al., 2015). Several existing wind farms include squirrel cage induction generators (SCIG) and about 20% to 30% of all faults are caused by rotor cage defects (Bonnett and Yung, 2008). However, the electrical and mechanical faults of these generators predominantly disturb productivity and need rehabilitation (Singh and Sundaram, 2021a, 2021b, 2022; Singh et al., 2018, 2019a, 2019b, 2019c, 2019d, 2021), which provides particular obstacles in the production of electrical power, specialists advise turning them off early because they may lead to a complete stop of the generator. Rotor broken bars (BRBs) fault is produced by thermal tiredness because of periodic thermal stress on the end ring-bar connection that happens due to various thermal factors of bars and lamination steel. As mentioned in Stojicic et al. (2011, 2011), a diagnostic system that is capable to reveal the evolution of broken bar faults at an early stage is based on phase current signal analysis and provides the ability to commute from preventive to predictive maintenance and hence to minimize expenses. As stated by Jover Rodríguez and Arkkio (2008), intelligent techniques are classified as neural networks, genetic algorithms, and fuzzy logic systems. FLS may be inserted into fault detection in squirrel cage induction generators. The use of FLS to detect defects in wind turbines has appeared as the best answer for the diagnosis online (Boukaka et al., 2014; Saghafinia et al., 2012).
One fuzzy logic algorithm is proposed for identifying the rotor broken bar fault and analyzing its severity. The detection and analysis of the rotor broken bar fault carried out in this paper are divided into three sections. This work is arranged as follows. In the second part, the mathematical theory of FLS is explained and utilized in the stator current analysis. In Part 4, the application results of the fuzzy logic system are discussed. Part 5 gives the conclusions.
Wavelet transform theory
To eliminate restrictions in time-frequency representation existing in other techniques, the wavelet transform has been provided as a solution to this problem (Yan et al., 2014). Essentially, wavelet is a limited periodical function beginning and ending by the value zero. In other words, its function integrates at zero. WT is just an expanded FT accompanied by alterable windows. WT applications contain, for example: compressing of data and images, and attenuation of noises.
The mother wavelet, W(t), suggested by Morlet is expressed as:
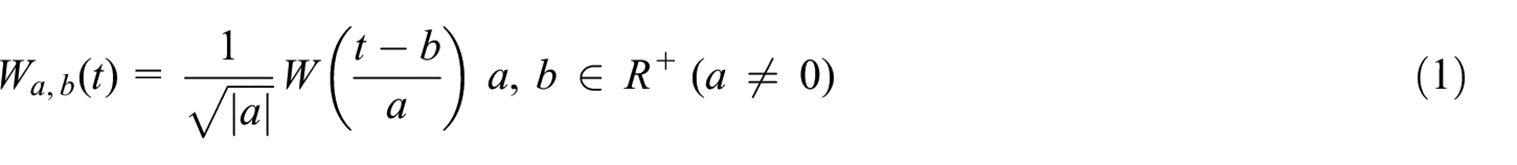
With: a and b are the dilation and translation parameters that have the role of measuring the scale degree and determining the wavelet time location respectively. These two parameters help the process of manipulating the shape of the mother wavelet by scaling and shifting over the signal which has been analyzed. The robustness of wavelets is the capability to adjust the resolution of both time and frequency at the same moment (Yan et al., 2014). For the case where the absolute value of the parameter a is less than 1 that means high frequencies and small time widths, If otherwise, so the opposite situation. This adjustment conforms to Heisenberg’s uncertainty principle, as other time-frequency methods.
Continuous wavelet transform
By using the convolution operation of the continuous original signal i(t) and the wavelet functions W(t), the wavelet transform can be obtained:
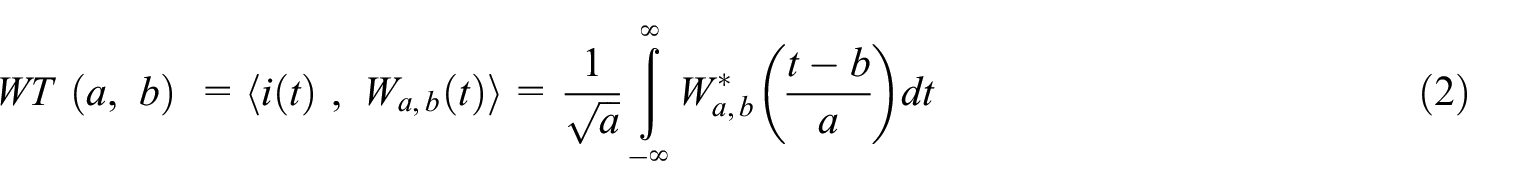
With: W(t) and
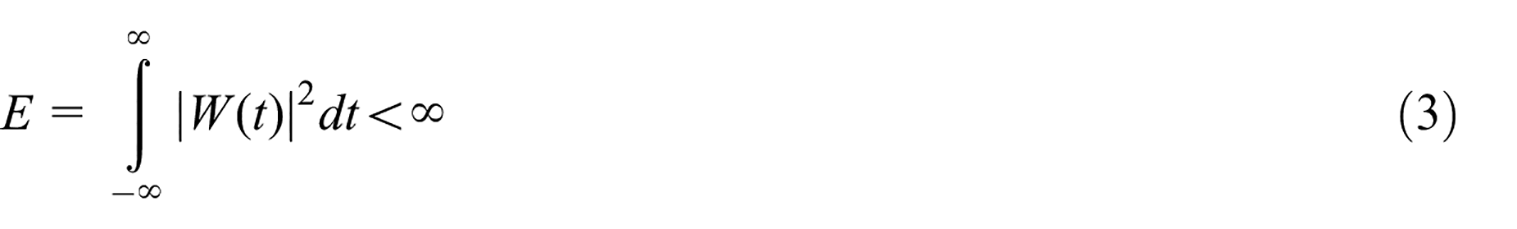
1. By using the integral of the amplitude square of the base wavelet, it must obtain a specific energy as formulated in this equation.
2. The FT of i(t) should not appear at the zero frequency (neglected component). In other words, i(t) should be an average of zero. To verify the condition of admissibility as expressed by equation (4).
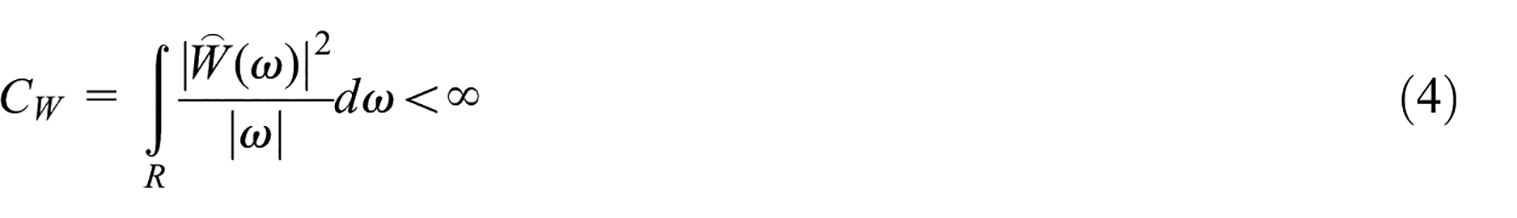
Any transform has significance in practice exclusively when it is confirmed that there is its corresponding inverse transform (Li et al., 2015). So the presence of inverse wavelet transform is guaranteed by this requirement.
3. For each complex WT containing zero and real values, it should include the value of zero means and real numbers for negative frequencies.
The original signal i(t) can be reconstructed through the inverse transformation of a classified wavelet.
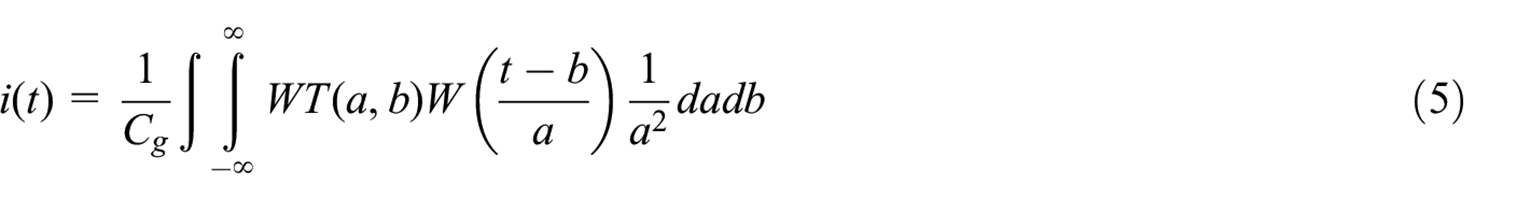
According to the second requirement mentioned previously, equation (5) means that the original signal i(t) has finite energy. By the reason of a great amount of dilation and translation parameters should be calculated with a continuous wavelet transform. In terms of calculation, this transform has low effectiveness in comparison with a discrete wavelet transform and wavelet packet transform.
Discrete wavelet transform
To promote practical computational application, a numeric form of continuous wavelet transform is provided by discretizing the dilation and translation parameters because the continuous wavelet transform is considered a redundant tool in DSP. By analyzing the original signal with 2 N of length using discrete wavelet transform at various frequency ranges, each range of them is related to a specific frequency resolution. Through low-pass and high-pass filters, the original signal is analyzed to approximation and detail coefficients; the sampling signal length is decreased by 2 during every pass. The coefficients of approximation are the values obtained by the low pass filter as well as the coefficients of detail are those given by the high pass filter. DWT is obtained by discretizing a and b. The important step is the operation of sampling the parameters a and b to ensure accurate reconstitution of i(t) resulting from the wavelet transform. Depending on the various levels of discretizing process many forms of the WT exist. Just suppose that a = a0 j and b = ka0 j b0, where a0 > 0, we can discretize a and b. Generally, we have a0 = 2 and b0 = 1, thus the scale is sampled along a dyadic sequence. By making a specific selection of W(t) ∈ L2(ℜ), the following orthogonal wavelet is built through a dyadic discretization:

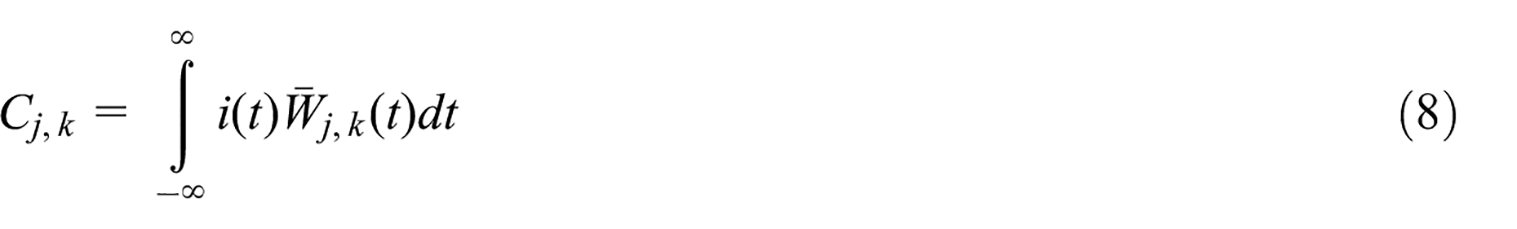
While all function components are orthogonal, so this function is orthogonal and in this case the product of all their basic functions resulting in zero. By the discretizing process of equation (6), it can obtain the reverse discrete wavelet transform of i(t):
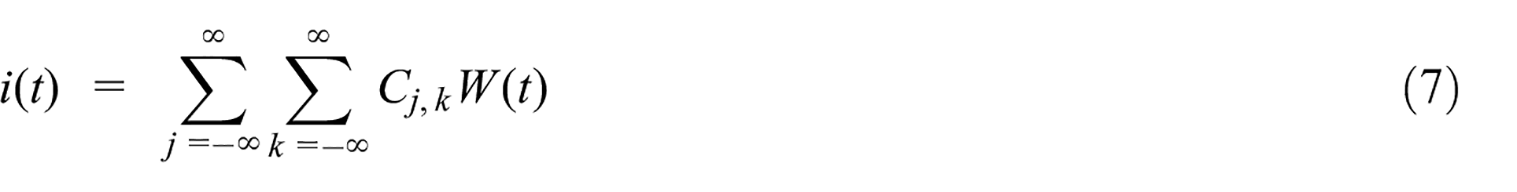
Where: Cj,k is defined as the coefficient of wavelet derived from the original signal i(t) and the dual function
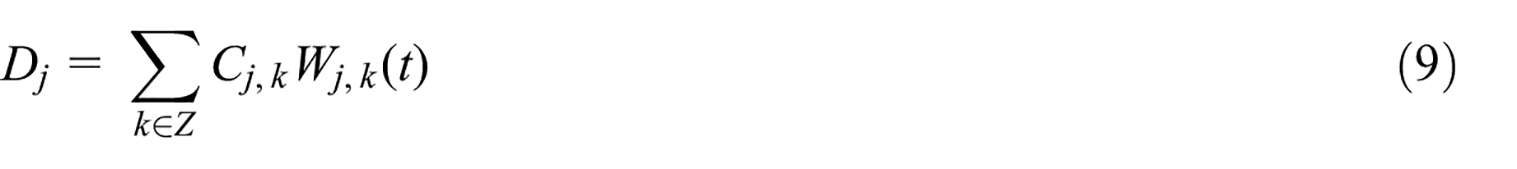
Through specific approximations and details obtained from the original signal, much knowledge can be extracted from the DWT. Equation (9) formulates the signal details at each level j as well as equation (10) expresses the signal approximations at level J by collecting all corresponding details (Antonino-Daviu et al., 2009; Pons-Llinares et al., 2012).
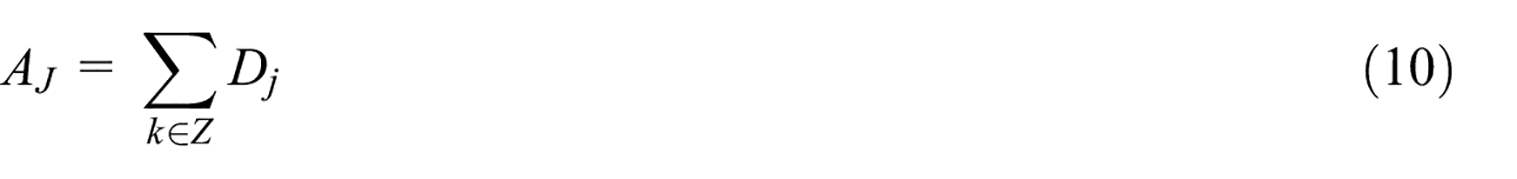
The redundancy is out of the question to the wavelet that forms the details and approximations through the DWT are lower than the original signal. This amazing feature is what reduces the computational cost of DWT compared to those required in CWT. Thus, equation (11) appears the bilateral composition of the original signal, and equation (12) shows the reconstructed signal.

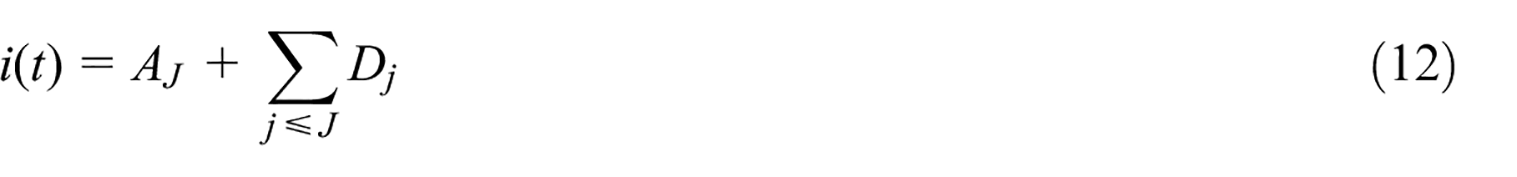
With i(t) is the real signal and j is the level of decomposition (j=1, 2, …, J). Aj is the low-frequency coefficients (approximations) and Dj is the high-frequency coefficients (details) of y(t) at the jth decomposition level. The decomposition architecture of a J-level is illustrated in Figure 1. It is clear that Dj and Aj are extracted from high-pass and low-pass filtering at each level with downsampling. After the decomposition of y(t) by the J-level, the filtering process can represent DWT based on the algorithm of Mallat where the real signal is decomposed into independent frequency bands.
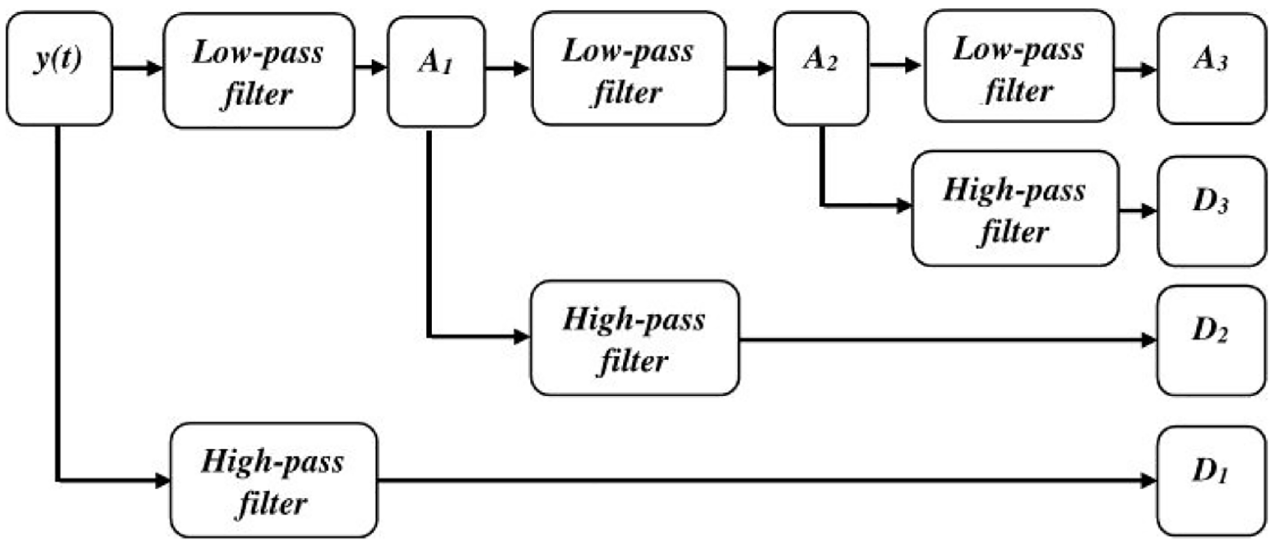
Example of decomposition scheme with three levels.
Many wavelet families that are particularly helpful in this study have been included. The following is a list of some basic families such as Daubechies, Haar, Coiflets, Biorthogonal, Morlet, Symlets, Meyer, and Mexican Hat. Also, we have other actual wavelets including Reverse Biorthogonal, Gaussian derivatives family, and FIR-based approximation of the Meyer wavelet. Complex Wavelet families are the third category which contains: Morlet, Gaussian derivatives, Shannon, and Frequency B-Spline. All of these wavelets can be used to detect BRB defects. It is recommended to use a high mother wavelet to minimize the overlapping impact at the cost of a long time of computation. However, because of the strength of this applied technique, the lower mother wavelet order is also capable to reach fairly reasonable outcomes.
Fuzzy logic-based diagnosis approach
FLS is also recognized as a multi-valued logic obtained through fuzzy sets for approximate thinking. The use of FLS in fault diagnosis of electric drives is proposed by Benbouzid and Nejjari (2001)Lasurt et al. (2000), and Mini and Ushakumari (2012). Throughout the diagnostic operation, some cases of defects cannot be classified as “good” or “bad.” As fuzzy logic imitates human reasoning, so it is applicable for failure detection based on mysterious information. The diagnosis method via fuzzy logic may be advanced by the integration of human knowledge and expertise with fuzzy sets and rules (derived from the magnitude characteristics of the input variables). These fuzzy rules and sets are helpful in the formularization of the knowledge database based on fuzzy inference, the squirrel cage induction generator faults can be detected by the application of a composition rule of fuzzy inference. This fuzzy inference system includes the fuzzy system input variables, output variables, and linguistic variables.
Fuzzy system input-output variables
The phase current, magnetic field, vibration signal, speed, and digital signal processing (DSP) are considered the input variables for the fault diagnosis algorithm. The squirrel cage induction generator condition can be extracted by observing the amplitudes of each signal mentioned above of the generator under different fault conditions. The interpreting of results, straight from the input variables is more complicated because input magnitudes are ambiguous. Thus, fuzzy logic is applied to appear numerical data of signal as linguistic information. The present paper applies FLS for BRB fault detection and for analyzing the severity of fault in squirrel cage induction generators. The magnitudes of tow frequency sidebands (1±2s)f obtained from power spectral density (PSD) of the phase currents are used as input variables. The generator condition (GC) is selected as the output variable. All the system inputs and outputs are identified by using the fuzzy set theory.
Linguistic variables
The main tools of FLS are linguistic variables. Their values are words or sentences in a natural or artificial language, for presenting significative systematic manipulation of mysterious and inexplicit concepts. In the case of BRB fault analysis, the output is the term set T(GC), interpreting generator condition, “GC,” as a linguistic variable, could be T(GC) = {Healthy (H), Faulty (F), Severe Faulty (SF). The input variables are the amplitudes of left frequency BRB sideband LA(fbb), and right frequency BRB sideband RA(fbb) which are interpreted as linguistic variables, with term set T(Q) = {Low(L), Medium(M), High(H)}.
Where Q = LA(f bb ), and RA(fbb) respectively.
Fuzzy membership functions (fuzzification)
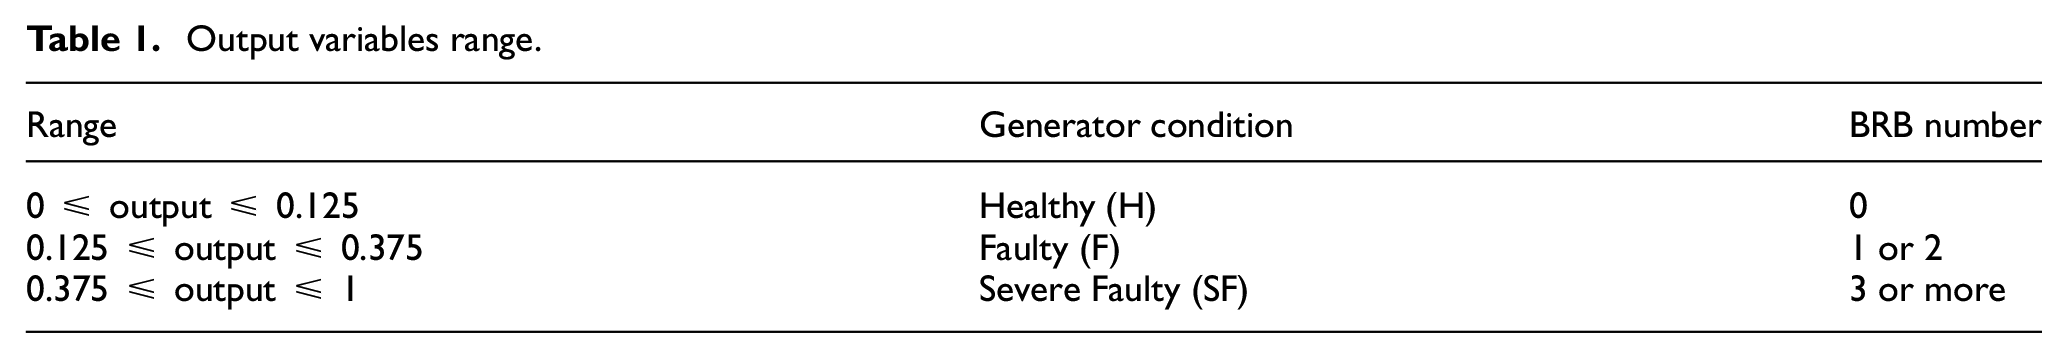
The original signal data can be converted into fuzzy data for best manipulation based on certain membership functions which are the trapezoidal functions in our study. Table 1 contain fuzzy output membership function values and corresponding generator condition for BRB faults.
Output variables range.
Fuzzy rules and membership functions are structured by monitoring the data set. it is necessary to know better the phase currents data, so membership functions must be provided for all input and output variables. For the detection and diagnosis of faults, the phase currents and their digital signal processing DSP are transformed to fuzzy values and considered as inputs. Thereafter, the outputs are estimated by a fuzzy logic inference system using the knowledge base.
Base of rules
The main section of fault detection using FLS is the rules base structure (Azgomi et al., 2013; Jover Rodríguez and Arkkio, 2008; Lin et al., 2013; Maslak and Butkiewcz, 2013; Medina et al., 2010). The acquisition of knowledge starts from the conversion of human reasoning concerning generator states into a rule base. Based on diagnosing defects using the PSD technique (with Matlab toolbox), a fuzzy set of 10 rules has been made, including the fuzzy logic inference system. Regarding input variables, the letters S (Small), M (Medium), and B (Big) have been taken above. For Generator Conditions (GC) Healthy, Defect, and Severe Defect.
Defuzzification
For the defuzzification step, the value of the output linguistic variable deduced by the Fuzzy rules will be transformed into a discrete value. The goal is to get a unique discrete numeric value that best performs the inferred fuzzy values of the output linguistic variable, namely the distribution possibilities (Azgomi et al., 2013; Jover Rodríguez and Arkkio, 2008). Thereby, defuzzification is the inverse transform that transforms the output of the Fuzzy domain into a numeric domain. Table 1 demonstrates the range of output variables.
DWT-PSD-FLS results
Test description
The studied technique was experimentally proved in a PC-based diagnostic system on three squirrel cage induction generators with identical properties. Our test is carried out for data sensored from mentioned generators with the power of 4 kW; one in good health rotor, second with one BRB, and the third with two BRBs. For each test, the generator is connected to a wind turbine that acts as a source of mechanical power, and on the other hand, this generator is connected to an appropriate electric load as illustrated in figure 2.
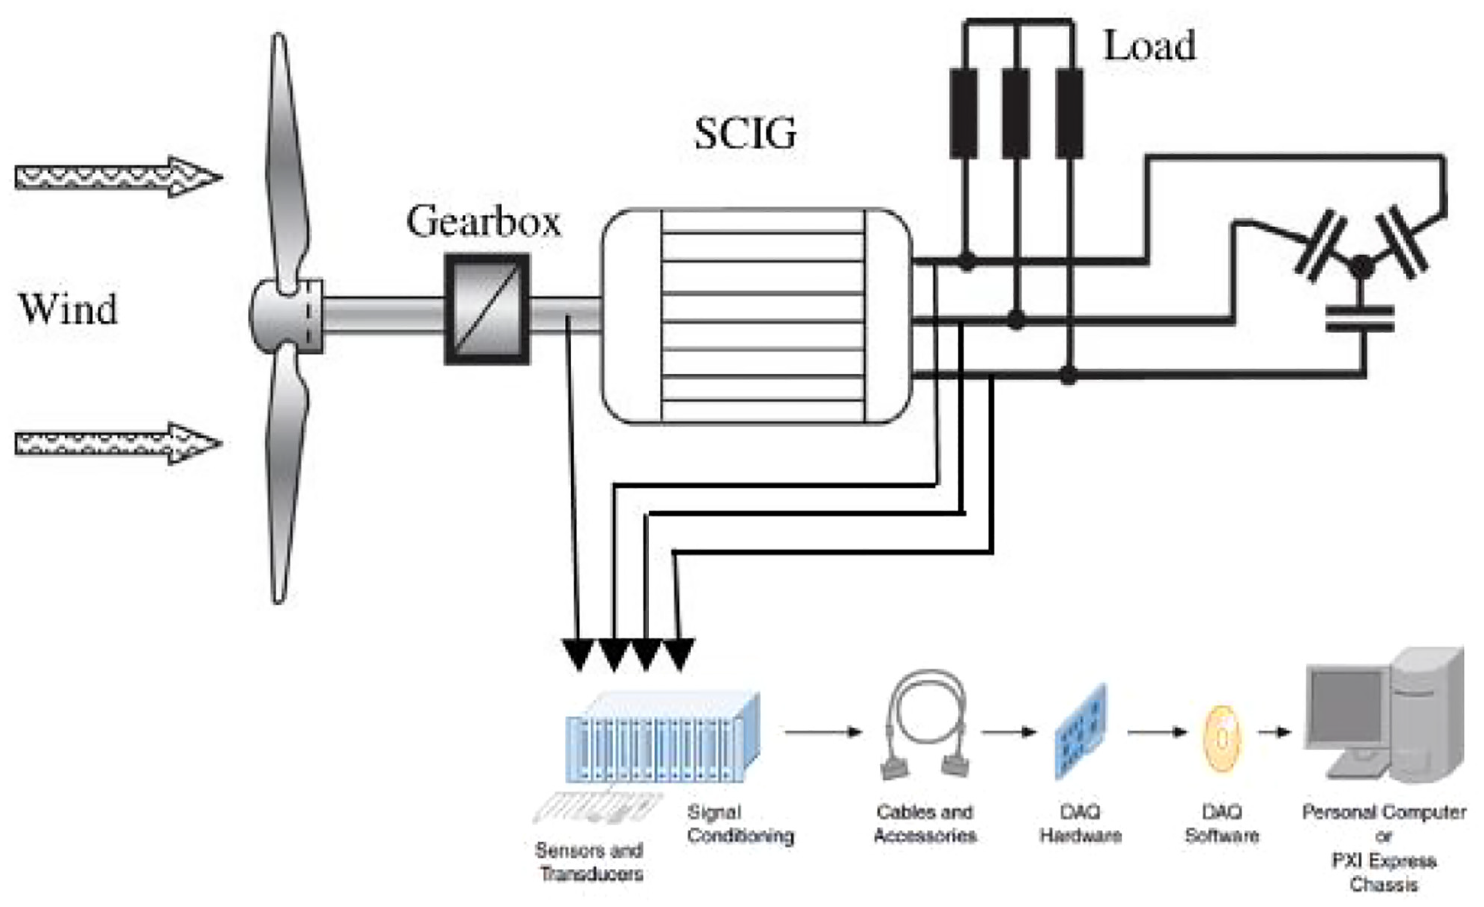
Test model of wind energy system.
Our goal is to use the signal analysis of the current generator envelope by a fuzzy logic system for two generators with BRBs (defective) and compare them with the first generator (health).
PSD results
When the sampling stage of the phase current is made, and then analyzed by using a classical method MCSA, such as PSD techniques (precisely MUSIC technique). Three kinds of the spectrum are given to compare their PSD obtained from stator currents IPhase (traditional technique).
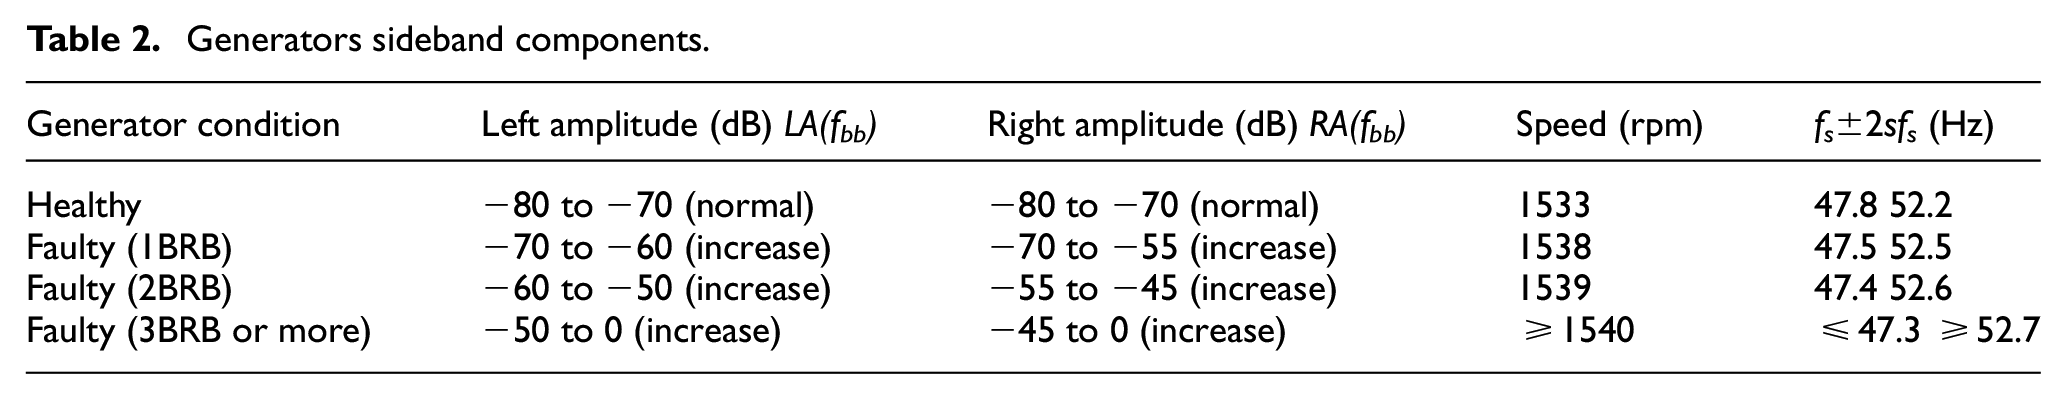
Figure 3 shows the spectra of the stator current at the proximity of the fundamental frequency. When the BRBs number becomes great, the same is true for the magnitude of the sideband components associated with the fault, also the space between the sideband components and the main component. The frequencies related to the broken rotor bars state are detectable in experiments implemented at load state for the case of 1 BRB, the slip is (s = 2.5%), and for the case of 2 BRBs (s = 2.6%), and more than 3 BRBS (s = 3.1%). For the healthy case (s = 2.2%), the sideband components are fully buried under the spectral leakage of the main frequency component as illustrated in table 2.
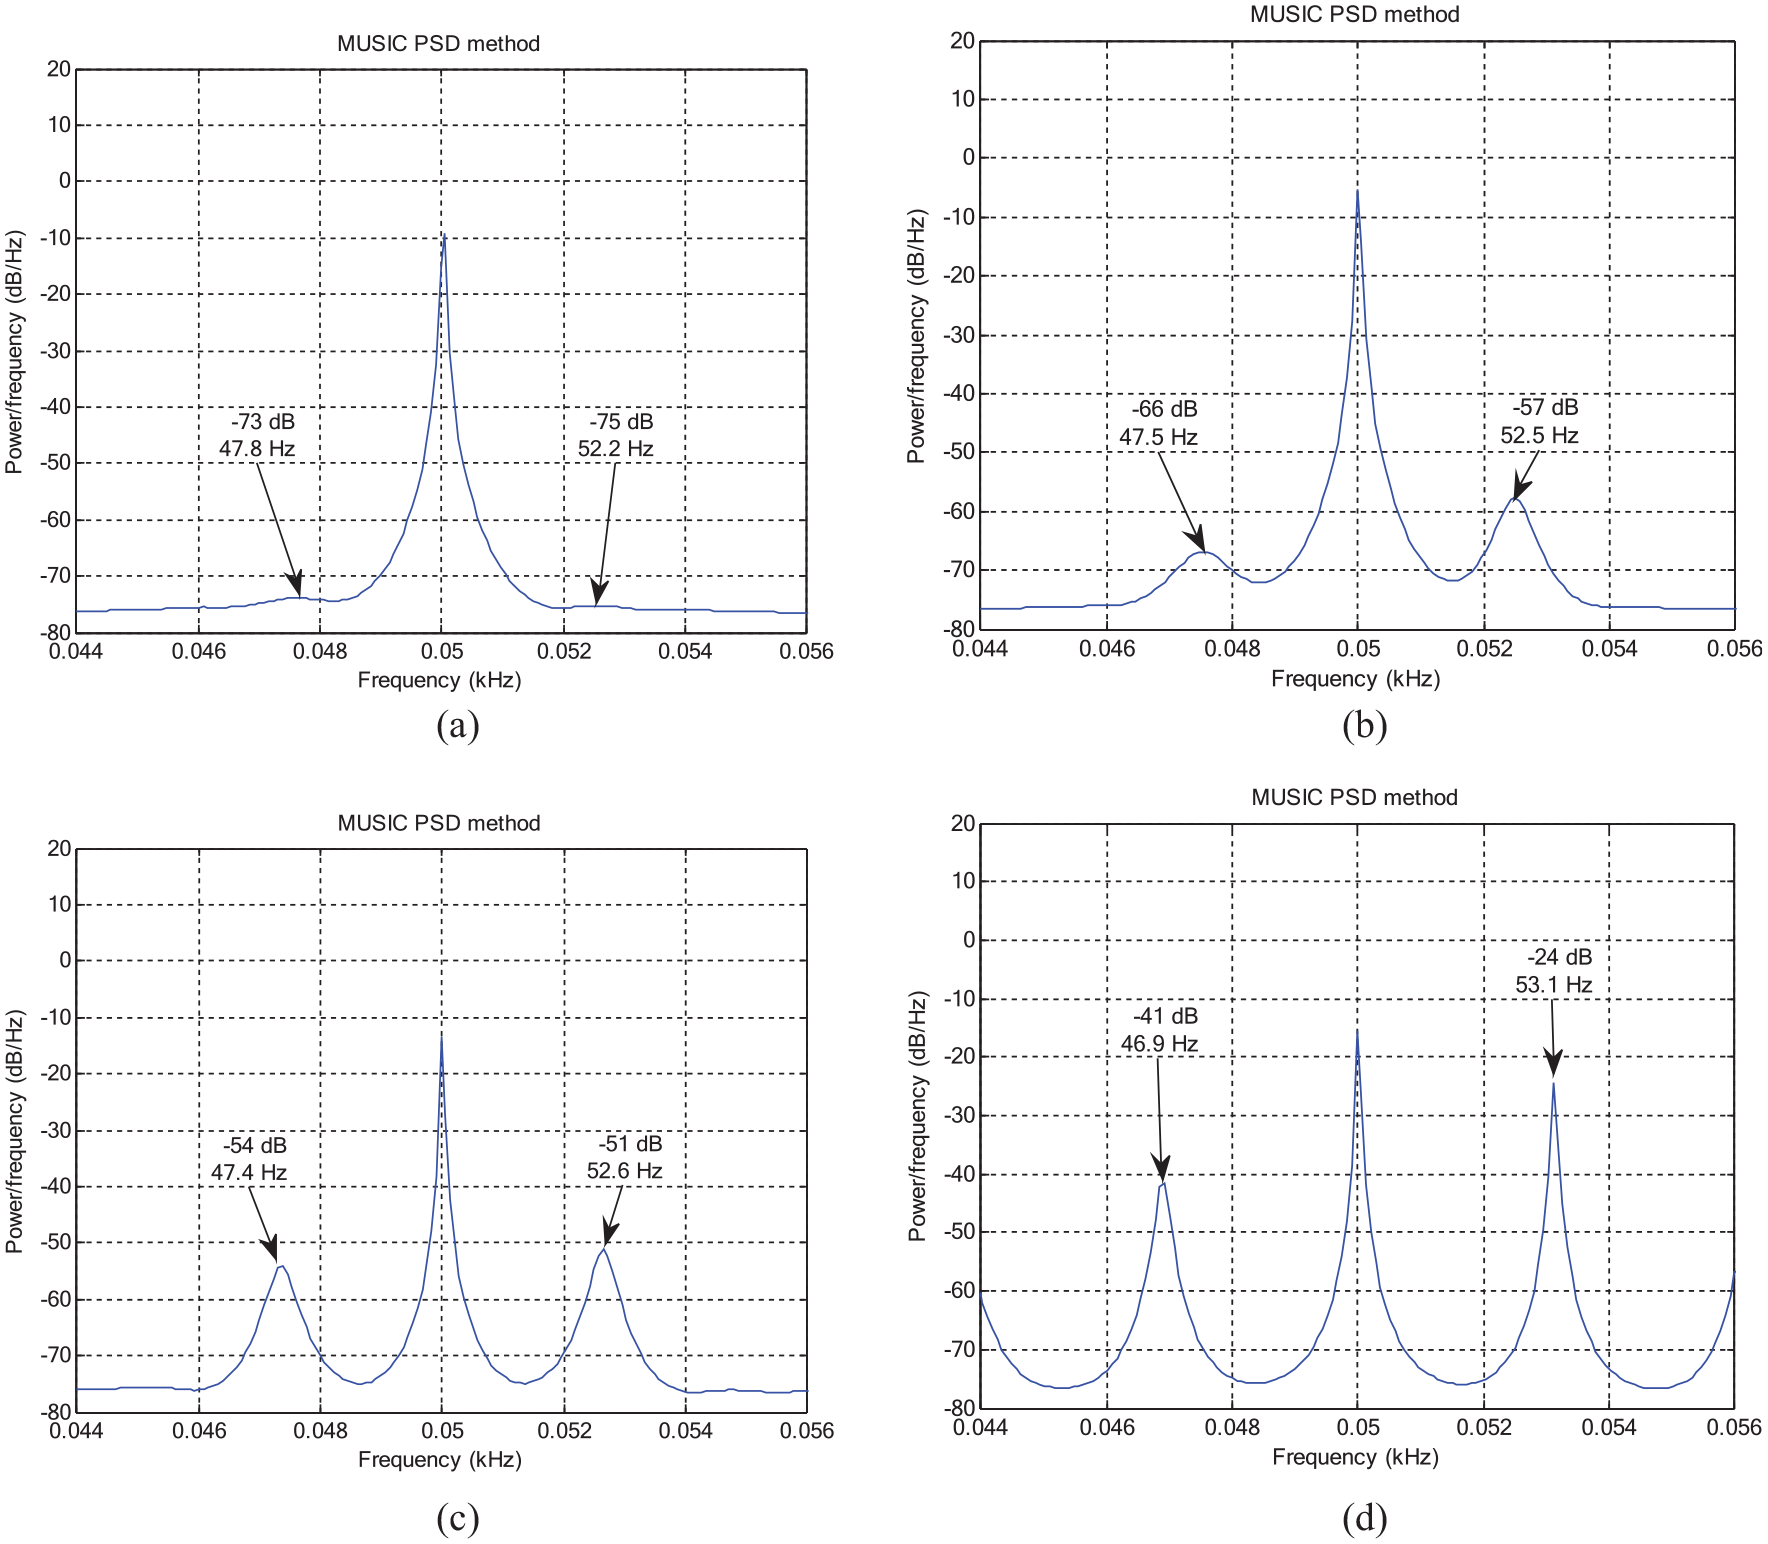
Stator currents spectrums: (a) health rotor, (b) defective rotor (1 BRB), (c) defective rotor (2 BRBs), and (d) defective rotor (≥3 BRBs).
Generators sideband components.
The spectra of phase current with one, two, and three BRBs are given in Figure 3(b) to (d) respectively. The characteristic frequency components (1±2ks)fs are presented clearly at the magnitude spectra of the phase current.
To confirm that the harmonics (1±2ks)fs shown in the above spectra are induced from the existing of BRBs fault, the spectra of the phase current when the SCIG runs with a healthy rotor (Figure 3(a)) are given and compared with defective rotors. This signal processing contributes to supporting the truth that the presence of BRBs in the generator can create peaks in spectra at the harmonics (1±2ks)fs.
Note that the spectra peaks illustrated at the harmonics (1±2ks)fs are certainly produced from the existence of few or many broken bars. So, at the base of this information, it is acceptable to set up the fault diagnosis of rotors by processing the spectra of target peaks.
To make a fault detection of squirrel cage rotors without having to compare with any reference (reference created from a healthy generator), the definitive resolution is closely related to this question “Is the studied rotor defective or not?” can be done only from the signal that has been analyzed. It is known that the entire squirrel cage generators have a small asymmetry due to the construction stage that appears in the phase current spectra at the lower component (1−2ks)fs. Simultaneously, the speed fluctuation generates an extra component of higher frequency (1+2ks)fs induces in the phase current spectra as given visibly in Figure 3. But, squirrel cage generators producers guarantee that the generators offer as little asymmetry as it can be the major reason of the defects. So, this will be developed the diagnostic methods. The phase current spectra and particularly the frequency peak at (1+2ks)fs are discussed. Typically, that peak is too weak or equal to zero concerning a normal generator. This process ignores spectral leakage and can be useful when conventional FFT treatment does not provide obvious outcomes.
FLS description for diagnosis and decision
The process of Fuzzy Logic is explained previously: firstly, a crisp set of input data (The magnitudes of tow frequency sidebands (1±2s)f obtained from power spectral density (PSD) of the phase currents are used as input variables) are gathered and converted into a fuzzy set using fuzzy linguistic variables, fuzzy linguistic terms (The input variables are the amplitudes of left frequency BRB sideband LA(fbb), and right frequency BRB sideband RA(fbb) with term set T(Q) = {Low(L), Medium(M), High(H)}, and the outputs variables interpreting generator condition with term T(GC ) = {Healthy (H), Faulty (F), Severe Faulty (SF)}) and membership functions which are the trapezoidal functions in our study, this step is known as fuzzification. Afterward, an inference is made based on a set of rules. Lastly, the resulting fuzzy output is mapped to a crisp output using the membership functions, in the defuzzification step.
To ensure the effectiveness of the FLS, many experiments have been carried out under different generator conditions with adequate load: Health rotor, 1 BRB, 2 BRBs, and more than 3 BRBs. Firstly, we have masked all generators for unknown the number of BRB, secondly, we have classified and tested each generator without any information about the rotor condition. Figure 4 and Table 3 present the FLS results of each generator diagnosis (value normalized and real). By execution in the fuzzy logic toolbox of MATLAB software, the survey of the 10 rules carried out and the outcome with a unique normalized discrete numeric value equal to 0.25 for the first masked generator, which includes in 0.125 ≤ output ≤ 0.375 range (Table 1—Range of output variables), so this result indicates that the rotor condition is faulty (F).
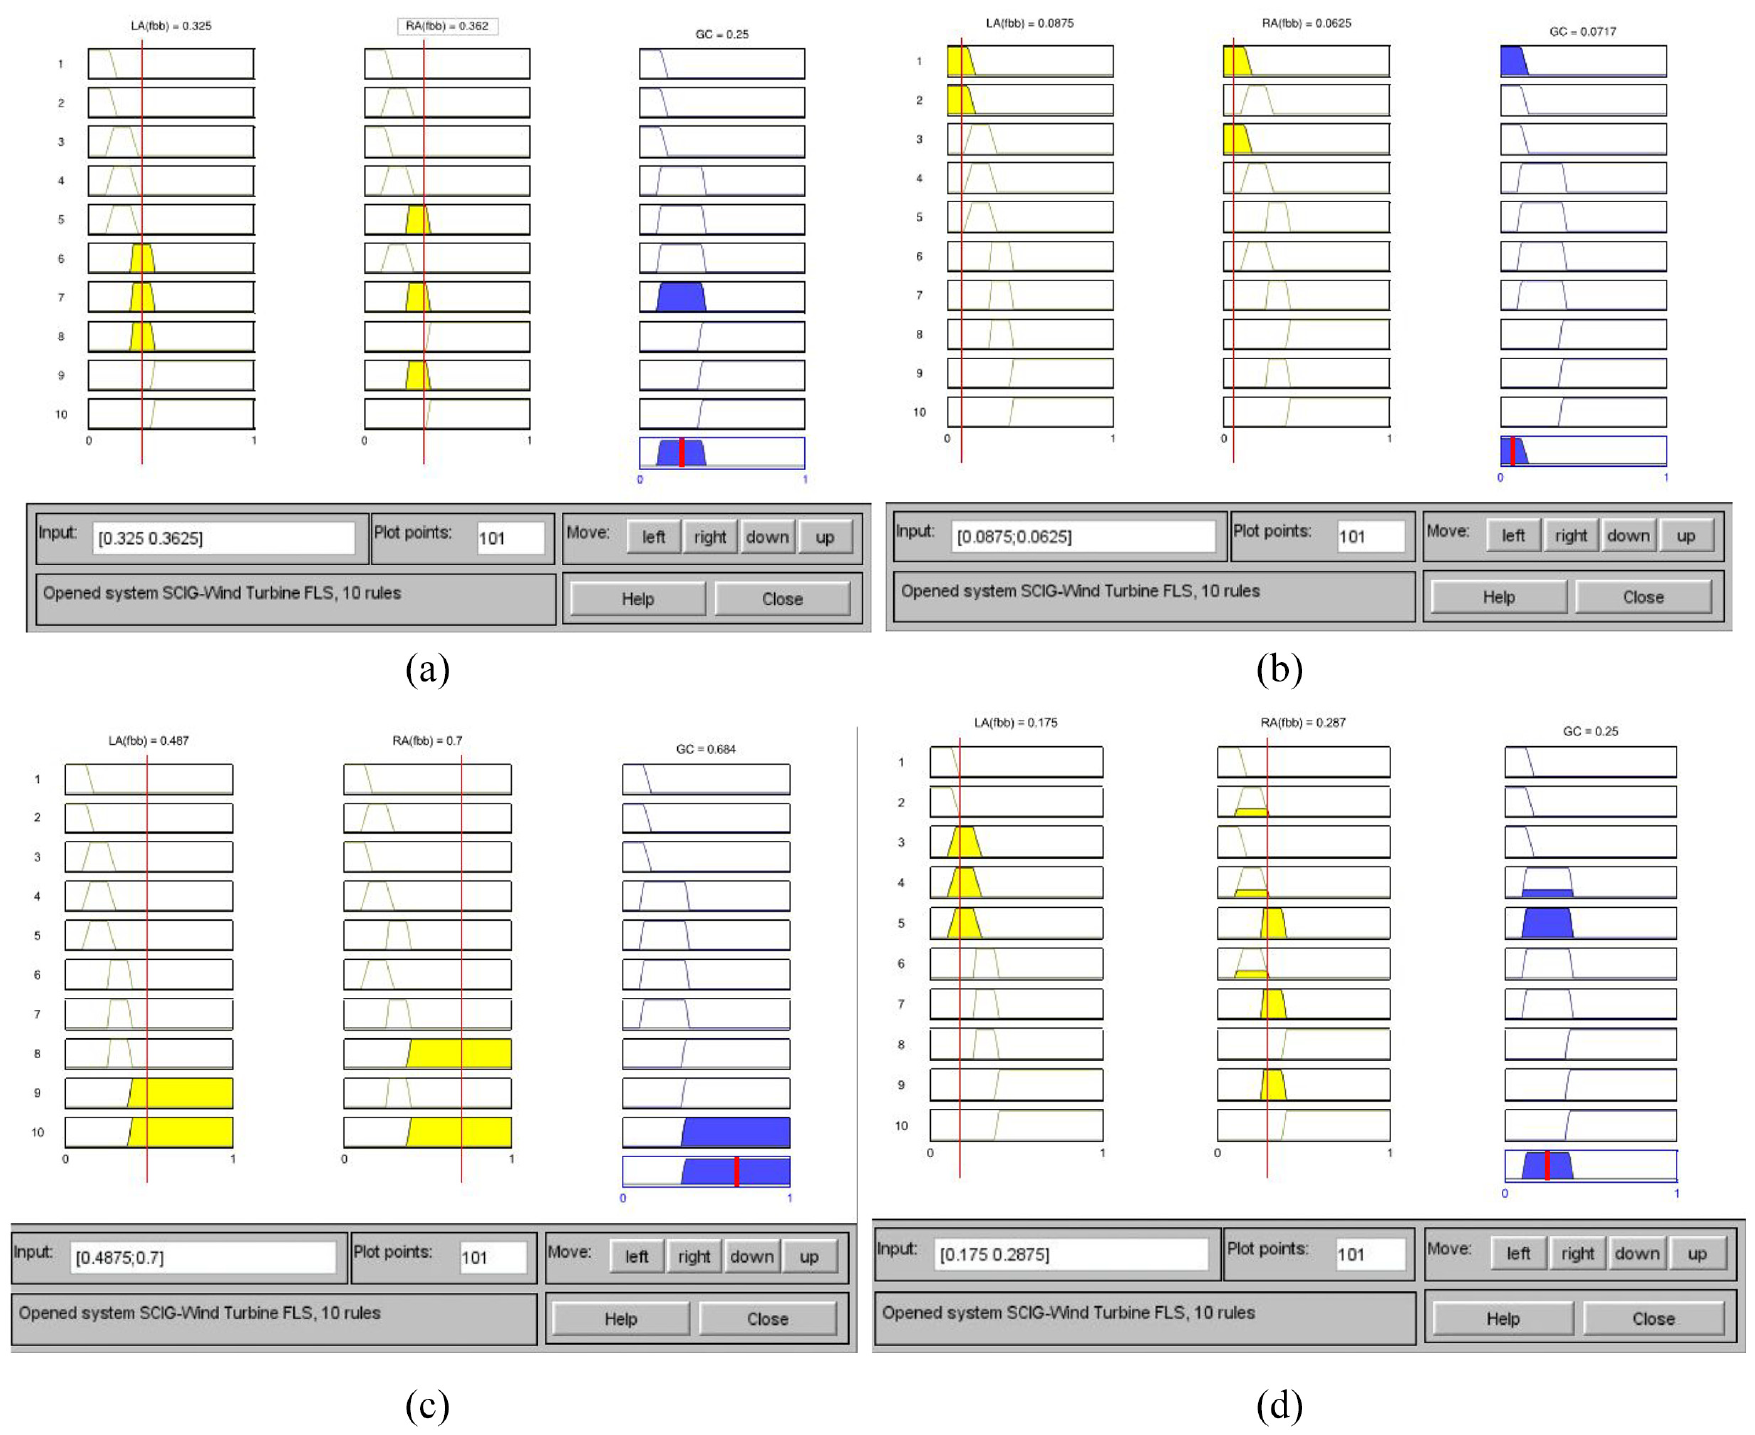
FLS results: (a) first masked generator, (b) second masked generator, (c) third masked generator, and (d) fourth masked generator.
FLS diagnostic results.
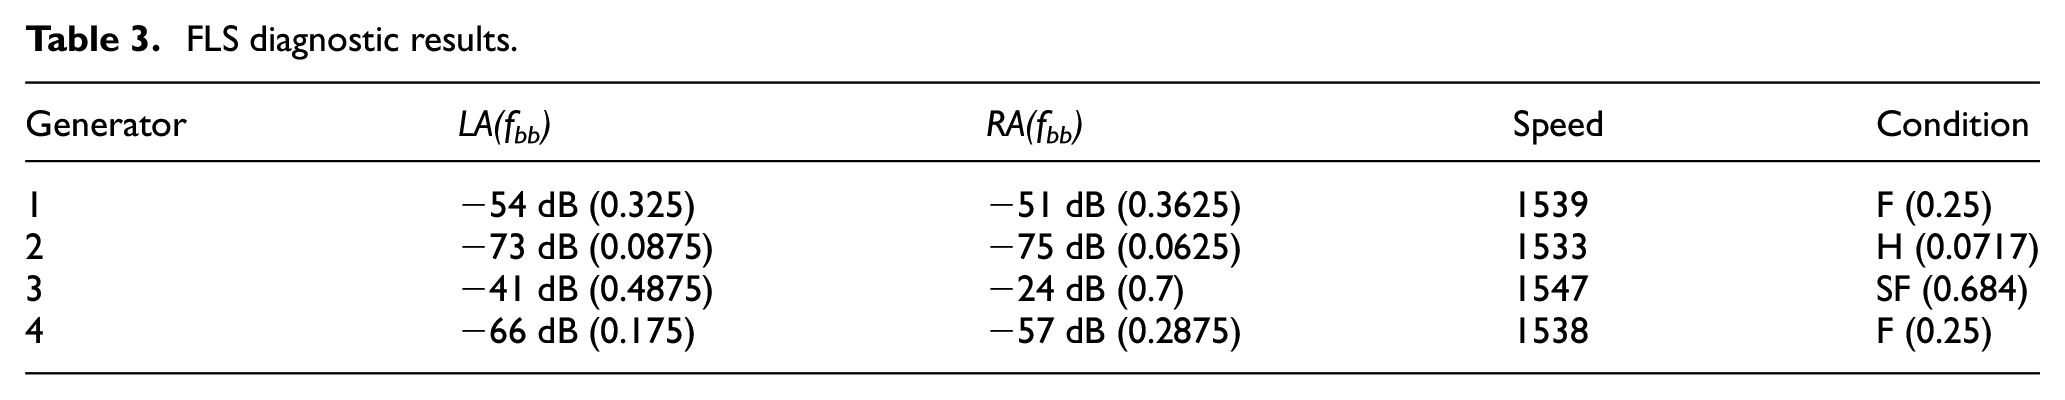
Figure 4(b) and the second row of Table 3 show the result of the second generator. By execution in the fuzzy logic toolbox of MATLAB software, the survey of the 10 rules carried out and the outcome with a unique normalized discrete numeric value equal to 0.0717, which includes in 0 ≤ output ≤ 0.125 range (Table 1—Range of output variables), so this result indicates that the rotor condition is healthy (H).
Figure 4(c) and the third row of Table 3 show the result of the third generator. By execution in the fuzzy logic toolbox of MATLAB software, the survey of the 10 rules carried out and the outcome with a unique normalized discrete numeric value equal to 0.684, which includes in 0.375 ≤ output ≤ 1 range (Table 1—Range of output variables), so this result indicates that the rotor condition is severe faulty (SH).
Figure 4(d) and the fourth row of Table 3 show the result of the fourth generator. By execution in the fuzzy logic toolbox of MATLAB software, the survey of the 10 rules carried out and the outcome with a unique normalized discrete numeric value equal to 0.25, which includes in 0.125 ≤ output ≤ 0.375 range (Table 1—Range of output variables), so this result indicates that the rotor condition is faulty (F).
Conclusion
In this work, an online condition-monitoring system based on fuzzy logic was improved and experienced. A detection technique using FLS to decide the status of squirrel cage generators has been tested. For getting an effective diagnosis, the characteristic frequency components of the spectra of phase current are the inputs to FLS that transform them into linguistic variables of fuzzy subsets and their associated membership functions. The output of FLS appears as the generator status. The outcomes delivered from this fuzzy logic system are excellent and eligible to detect broken bar defects of squirrel cage generators based on wind turbines established in far and away areas.
Footnotes
Declaration of conflicting interests
The author(s) declared no potential conflicts of interest with respect to the research, authorship, and/or publication of this article.
Funding
The author(s) received no financial support for the research, authorship, and/or publication of this article.