
Abstract
With increasing the number of wind turbines approaching the end of their service life, it has become crucial for businesses to understand and assess safety and security issues related to the decommissioning phase of wind farm asset lifecycle. This paper aims to develop, for the first time, a Bayesian Network (BN) model for the safety assessment of offshore wind farm decommissioning operations. The most critical safety incidents are identified and their corresponding risk-influencing factors (RIF) are determined. The impacts of human errors as well as procedural and mechanical/electrical failures on the safety and efficiency of decommissioning operations are thoroughly analysed. The findings of the study revealed that the most critical RIFs during offshore wind decommissioning operations include: visibility, crew fatigue, number of personnel per operation, proper safety procedures, crane integrity, number of lifts available in the wind farm, inspection frequency, as well as equipment design.
Keywords
Introduction
The offshore wind energy industry is experiencing an increasing number of wind farm installations approaching the end of their service life. Asset management strategies for these end-of-life offshore wind farms (OWF) require an approach that rigorously incorporates ‘decommissioning’ in asset lifecycle planning. In offshore wind projects, the decommissioning stage is relatively immature compared to the construction stage and thus there is a need to pay closer attention to decommissioning (Invernizzi et al., 2020). Many project management scholars have concluded that there is a dearth of research related to the decommissioning stage of renewable energy projects and the offshore wind industry is not an exception (e.g. see Kaiser and Liu, 2018; Locatelli et al., 2020). Decommissioning is defined as the final stage of the wind farm asset lifecycle. Generally, offshore wind decommissioning operations involve four key stages: planning and consenting stage, transport and logistics stage, lifting and loading stage and post-decommissioning stage (Shafiee and Adedipe, 2022). Some motivations for decommissioning include: expensive repair/repowering costs, high failure rate of old wind turbines, introduction of newer and more efficient wind turbine models, etc. As OWF structures have a weaker structural integrity at the end of their service life, the safety of operations during the decommissioning stage will become more critical than that during the commissioning stage.
To date, seven OWFs from five countries have been decommissioned. These projects include: Vindeby from Denmark, Hooksiel from Germany, Lely from the Netherlands, Utgrunden I and Yttre Stengrund from Sweden and Blyth and Beatrice Demonstration from the UK (Adedipe and Shafiee, 2021). Figure 1 shows projected trends for the cumulative OWF decommissioning capacity in the coming years, calling for an increase in decommissioning activities throughout the world. As more and more wind turbines are coming close to the end of their useful life of 20–25 years, evaluation of the decommissioning costs and risks to make an informed investment decision is becoming highly relevant (G+ Global Offshore Wind Health and Safety Organisation, 2020; Interreg North Sea Region Decom Tools, 2019).
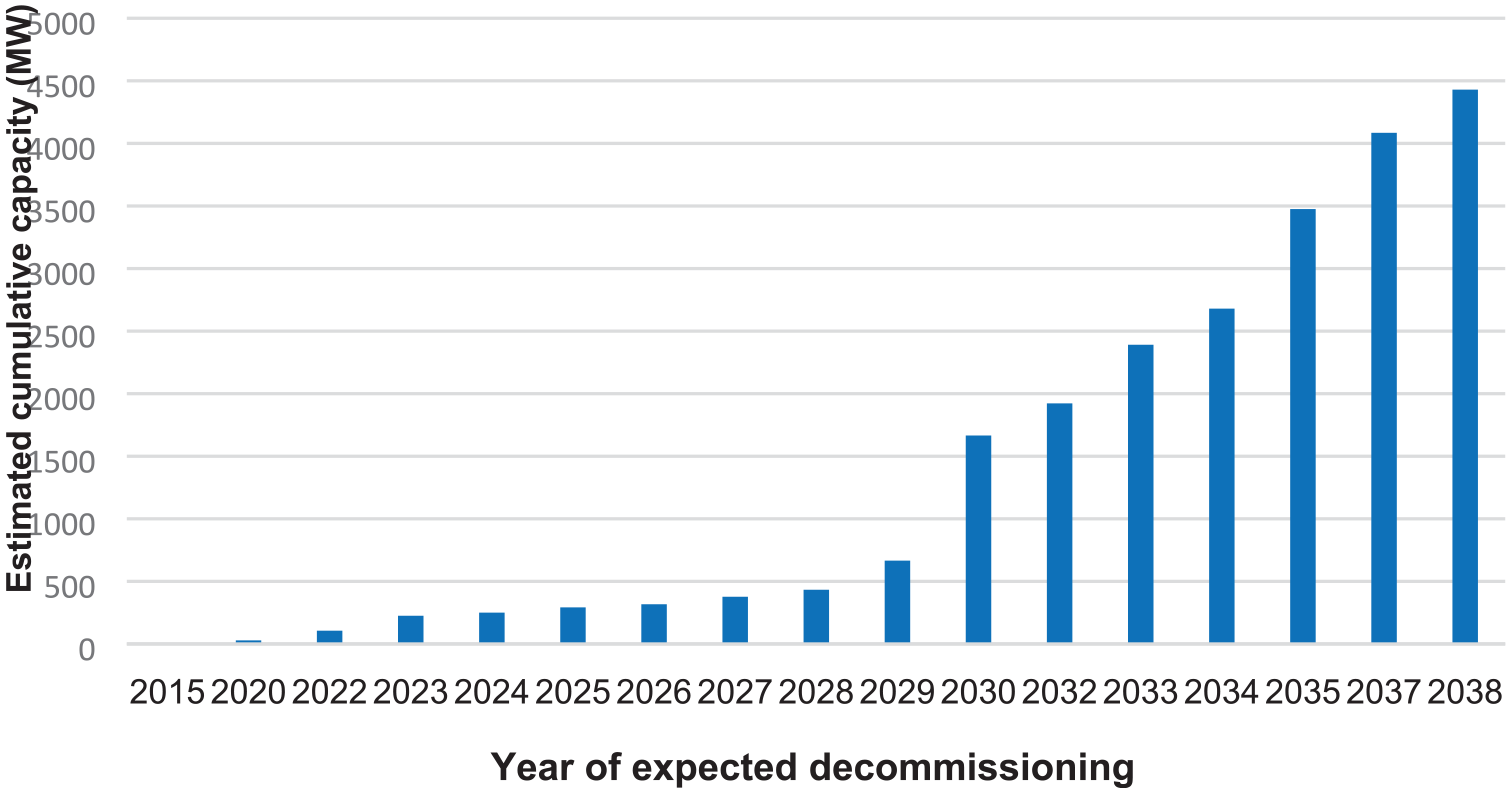
The projected cumulative capacity of offshore wind farm decommissioning (Topham and McMillan, 2017).
Decommissioning of offshore wind turbines and their related infrastructure involves some hazards that have been scarcely addressed in the published literature. Risk management includes the identification, assessment and evaluation of all relevant hazards in order to minimise, monitor and control the likelihood and/or impacts of unpredictable events causing loss or damage (Shafiee, 2015). The risk assessment conducted for each lifecycle stage is distinct as there are many different hazards with a variety of risks that can be encountered in each stage/activity of the lifecycle. Although this study focuses mainly on technical risks associated with decommissioning activities, there are also some financial risks involved.
There are several unknowns in OWF decommissioning process and due to the limited research into decommissioning safety, this study aims to propose a probabilistic graphical Bayesian Network (BN) for the risk assessment of OWF decommissioning operations. BNs are used in this study to capture uncertainty in complex systems/operations, identify critical risk factors conditional on other factors, conduct both forward and backward analyses (i.e. bottom-up or top-down risk assessments), update decisions when new data/information becomes available (i.e. re-assessment of risks) and to include utility nodes in order to observe the effects of risks on costs and contingency planning. When applying BNs to OWF decommissioning risk assessment, attention will need to be paid to how to include the subjective parameters (such as organisational factors) in the model. BNs can help project managers, operators and regulators identify safety critical tasks during the decommissioning stage and specify some control measures to lower the risk to an acceptable level. Identifying the potential decommissioning risks early on may also inform wind turbine design and manufacturing processes. To the best of our knowledge, this is the first study that applies the BNs to risk assessment of OWF decommissioning operations with the aim of identifying safety-critical factors to explore potential benefits in improving safety engineering practices throughout the asset lifecycle.
The remainder of the paper is structured as follows. Section 2 provides an overview of Bayesian modelling for OWF asset lifecycle risk assessment. Section 3 presents the proposed BN methodology for application in OWF decommissioning safety assessment. Section 4 reports the results and discusses them in detail. Finally, the conclusion and further work are presented in Section 5.
Research background
Risk analysis research in offshore wind energy
There are a number of methodologies that have been applied to risk assessment research in the offshore wind energy sector. These risk assessment methodologies include some conventional techniques – such as hazard identification (HAZID), hazard and operability (HAZOP), fault tree analysis (FTA), event tree analysis (ETA), bow-tie diagrams, failure mode and effects analysis (FMEA), failure mode, effect and criticality analysis (FMECA), etc. – and some probabilistic risk assessment (PRA) techniques including Monte Carlo modelling and Bayesian Belief Networks (Mehdi et al., 2020). According to Aven and Renn (2009), risk management is best expressed in terms of uncertainty and outcomes, with the challenge of converting subjective knowledge to probability values. Modelling the uncertainty is important in risk assessment, but there may be some limitations in capturing unknown unknowns when predicting the risks (Aven and Zio, 2014). We propose that this need offers an opportunity to adopt probabilistic methods such as BNs in risk assessment. In this study, we apply BNs to OWF decommissioning risk management because of their capability of identifying uncertain deviations/potential hazards and updating assessments when new information becomes available.
Very few studies have focused on BN applications in offshore wind risk management (see Adedipe et al., 2020). BNs have been used more recently in risk management studies because of their near-real-time ability to update assessments based on information obtained from operations or inspections. BNs have the capability to include different parameters including environmental, human and organisational factors during risk assessments and are able to quantify conditional probabilities based on the relationship between different parameters (Ashrafi et al., 2015). Friis-Hansen and Simonsen (2002) reported that the risk assessments using BNs produce more efficient and accurate results than using FTA and ETA methodologies. BNs can also be combined with other tools to improve the accuracy of assessments. For example, some derivatives of BNs including hierarchical Bayesian network (HBN) can be adopted to model the dynamic states of different parameters/variables represented by nodes (Adedipe et al., 2020). Mehdi et al. (2020) developed a dynamic method for real-time risk assessment of vessel operations (navigation) near an offshore renewable wind energy installation. The authors concluded that dynamic risk assessments still need to be used in conjunction with static risk assessment methods. Taflanidis et al. (2013) proposed an automated risk assessment tool to model the dynamic behaviour of offshore wind turbines operating in uncertain environments.
As presented by other scholars, BNs offer a powerful visual and quantitative solution for integrating information gathered from different life cycle stages, which is often a concern for asset decommissioning managers within the energy sector (Locatelli et al., 2020). Because of their capability to update risk assessments with the use of both subjective and objective prior data, BNs show good promise to be adopted by offshore wind energy industries. Furthermore, BNs allow for more accurate modelling of technical, personnel, financial and environmental factors that may pose risks to OWF decommissioning projects (Adedipe et al., 2020).
OWF asset lifecycle safety assessment
Safety is a very important factor to consider throughout the OWF asset lifecycle. As reported by G+ Global Offshore Wind Health and Safety Organisation (2020), the lifting operations have been identified to be the highest incident-prone activity in OWFs, followed by maritime operations and surveys. As the decommissioning phase involves extensive lifting, handling and moving of many heavy items, improving the safety of lifting operations would result in improved safety of the decommissioning processes. As the conventional deterministic techniques for quantitative risk analysis are limited, it is suggested to apply BNs to predict the risks associated with lifting operations. BNs can also show the relationships between different parameters connected within a network because of its conditional probability estimation capacity.
BN literature for OWF safety assessment
Advanced models like BNs have been applied in different stages of the OWF asset lifecycle, including the design, construction, commissioning and operation and maintenance (O&M). Scheu et al. (2016) presented the challenges involved in OWF risk management including the trade-off between level of detail and accuracy, incorporating uncertainty due to environmental conditions, ease of understanding and communication of results at all levels within the asset management team and high dependability of the risk assessment results on the quality of input data. All these concerns have been addressed in other OWF applications by using BNs, either as a stand-alone tool or in conjunction with other well-established risk assessment tools. Adedipe et al. (2020) presented a review of risk assessment studies that applied BNs in the offshore wind energy industry. The authors proposed BNs as a probabilistic tool to incorporate environmental, organisational and human related factors in risk assessment. They concluded that BNs have been applied the most to the O&M stage of OWF lifecycle.
For the design stage, Mendoza and Köhler (2019) proposed a BN decision framework to find an optimum design for an offshore wind turbine monopile based on the evaluation of the expected consequences of failure. They use BNs to show the relationship between design parameters and add decision and utility nodes (influence diagrams). For the installation stage, Leontaris et al. (2018) proposed BNs with the use of Uninet software as a probabilistic decision-support tool to assess the risks associated with installation and logistics of OWFs. They showed that BNs can be used to model the activity interdependence during installation operations, generating more realistic and trustworthy estimates of activity durations. This may also be explored for the decommissioning phase. Cheng et al. (2019) developed a fuzzy BN and Monte Carlo simulation (MCS) model to calculate OWF installation schedule risks as well as total project duration. The authors presented the use of BNs to identify critical risk factor(s) influencing duration as well as understand the uncertainties posed by activity risks.
For the O&M stage, Li et al. (2020) performed a reliability analysis on floating offshore wind turbines (FOWT) using BNs, mapped from FTA. The authors proposed the use of BNs to improve the reliability of FOWTs during the operation stage. Another study conducted by Asgarpour and Sørensen (2018) applied a BN-based risk model as a decision-support tool to estimate the remaining useful life (RUL) of assets based on updated inspection results. Dinwoodie et al. (2013) proposed a decision support analysis based on Bayesian Belief Networks and decision trees to determine optimal operating strategies and associated risks of OWFs. For additional applications, readers can refer to Dai et al. (2013).
Kim et al. (2020) developed a dynamic probabilistic method based on BN and clustering analysis to quantify the risks associated with offshore wind turbines. Babaleye and Kurt (2020) proposed a framework for the application of hierarchical Bayesian analysis (HBA) for data collection and the BNs to perform probabilistic risk assessment of offshore decommissioning projects. For logistics risk assessment, Rahman et al. (2020) proposed the application of advanced BNs to logistics operations of supply vessel emergency response in offshore marine locations because of the limited knowledge about the hazards and risks involved. This may be applied to consequence analysis in risk assessment. Friis-Hansen and Simonsen (2002) proposed a BN method to improve ship safety by obtaining causal event(s) occurrence probability in a ship-ship collision accident. This method can be useful in particular in cases where more than one lifting vessel is required for OWF decommissioning operations to model vessel collision risks on site. Ruud and Mikkelsen (2008) presented the steps involved in a generic offshore marine lifting operation using cranes, determined factors influencing the associated risks and proposed some mitigation measures. For further reading about the applications of BNs in safety assessment, readers can refer to Hänninen (2014).
Within the offshore wind energy industry, the review by Adedipe et al. (2020) showed that only few papers have applied BNs to risk analysis. Ashrafi et al. (2015) presented BN applications for making inferences to assess and improve wind energy system reliability as well as monitor the risk level in continuous time. In Kougioumtzoglou and Lazakis (2015), BNs were applied to rank critical wind energy system components on the basis of failure probability data. An analysis was also performed to compare the results obtained from BNs with those from FMECA results. Luque and Straub (2019) presented optimal risk-based inspection strategies for structural systems based on BNs. Kim et al. (2020) conducted a study on collision risk assessment of OWF installation vessels during the installation stage. The authors studied passing, drifting and attendant vessel collisions as well as the factors that may influence them. BNs were applied to risk assessment in two ways: firstly, they were used to understand the impact of different failure causes on incidents. Secondly, they were applied in determining the risk profile of operations based on incident locations (area on a wind farm) and the anticipated consequences.
The current paper studies the application of BNs in risk assessment of OWF decommissioning process, in particular lifting operations. A risk management plan is developed based on high-priority incidents to be mitigated, the related repair or contingency cost allocation, as well as the hazards that need to be deescalated. In order to manage these hazards and avoid schedule delays, or worse still, fatalities, there is a need to apply probabilistic methods such as BNs because of their higher robustness and flexibility. As the number of lifting tasks in OWF decommissioning increases so will the number of operational uncertainties. BNs can incorporate higher degree of uncertainty than conventional techniques. Thus, BNs are an ideal tool for risk assessment in highly uncertain operations or scenarios as they can update the probability of occurrence of the potential causal incidents during lifting and loading operations.
The proposed model
Introduction to BNs
BNs are probabilistic modelling tools which are directed acyclic graphs (DAGs) that represent problem space variables as nodes and their relationships to one another using arcs (links). They are otherwise known as belief networks as they are fundamentally based on Bayes’ theorem, which states that the belief about an entity is based on existing evidence but can be changed when new evidence becomes available (Jensen and Nielsen, 2007; Li et al., 2021; Pearl, 2014). BNs are gaining a reputation for being representative of real scenarios and their causations, their robustness and reliability (Conrady and Jouffe, 2015). It can be expressed mathematically by:

where H is the hypothesis/incident, D is the observed data, P(H|D) is the posterior probability (probability of H given observed data, D), P(H) is the prior probability distribution or belief of a hypothesis/incident H, P(D|H) is the likelihood function of the observed data, D and P(D) is the normalisation constant. Prior probability distributions are based on the collected data that can represent the uncertain system/operation variables to be observed.
Usually, the failure rates that are incorporated into risk analysis are not updated when there is new information. BNs bridge this gap in order to ensure that risk knowledge about operations is updated on a regular basis when necessary. BNs show the connection and interdependencies among different nodes in a network and can be mapped from other models like fault tress, event trees, bow-tie diagrams, etc. (Bobbio et al., 2001; Khakzad et al., 2013; Taleb-Berrouane et al., 2020). Compared to conventional methods such as FTA, the BNs are more beneficial because of their flexibility and more realistic outputs (Rahman et al., 2020; Yazdi et al., 2022). The probability values of the root nodes are the prior probabilities, which may be deterministic or probabilistic within the network depending on the prior data source. The conditional probability table (CPT) is developed for each node when developing a BN model to take into account variable dependencies and interactions and incorporate the uncertainty inherent in nodal relationships. The CPT is set to represent chance nodes. BNs allow for explicit expression of different factors that can influence an unwanted outcome/incident. The nodes may have binary states (success or failure) or multiple states. A full description of BNs can be found in Adedipe et al. (2020).
BN software
There are a number of BN software packages available on the market. Some of these packages include Netica, Microsoft MSBN, BayesiaLab, Hugin, WinBUGS, OpenBayes, AgenaRisk and Bayesfusion (Ashrafi et al., 2015; Ciobanu et al., 2017; Li and Shi, 2010; Li et al., 2015; Su and Fu, 2014). Adedipe et al. (2020) reviewed BN software and presented their applications in the wind energy sector. The current study uses Netica software from Norsys Software Corp (https://www.norsys.com/).
BN model development methodology
Figure 2 represents the steps for developing and applying the BN model. These steps include: (i) identification and classification of the variables, (ii) obtaining prior data for each variable, (iii) determining the relationships between each variable, (iv) building a BN model in which each variable is presented as a node and the prior data distribution as an input for each node, and links/arcs are used to show the relationship between each arc, (v) running the simulations (compile) with prior data to obtain posterior probability, (vi) conducting an analysis for mitigation/control, (vii) collecting updated risk data after mitigation and using it as prior data, (viii) inputting updated prior data into the model to obtain more accurate posterior probability results that can support decision making.
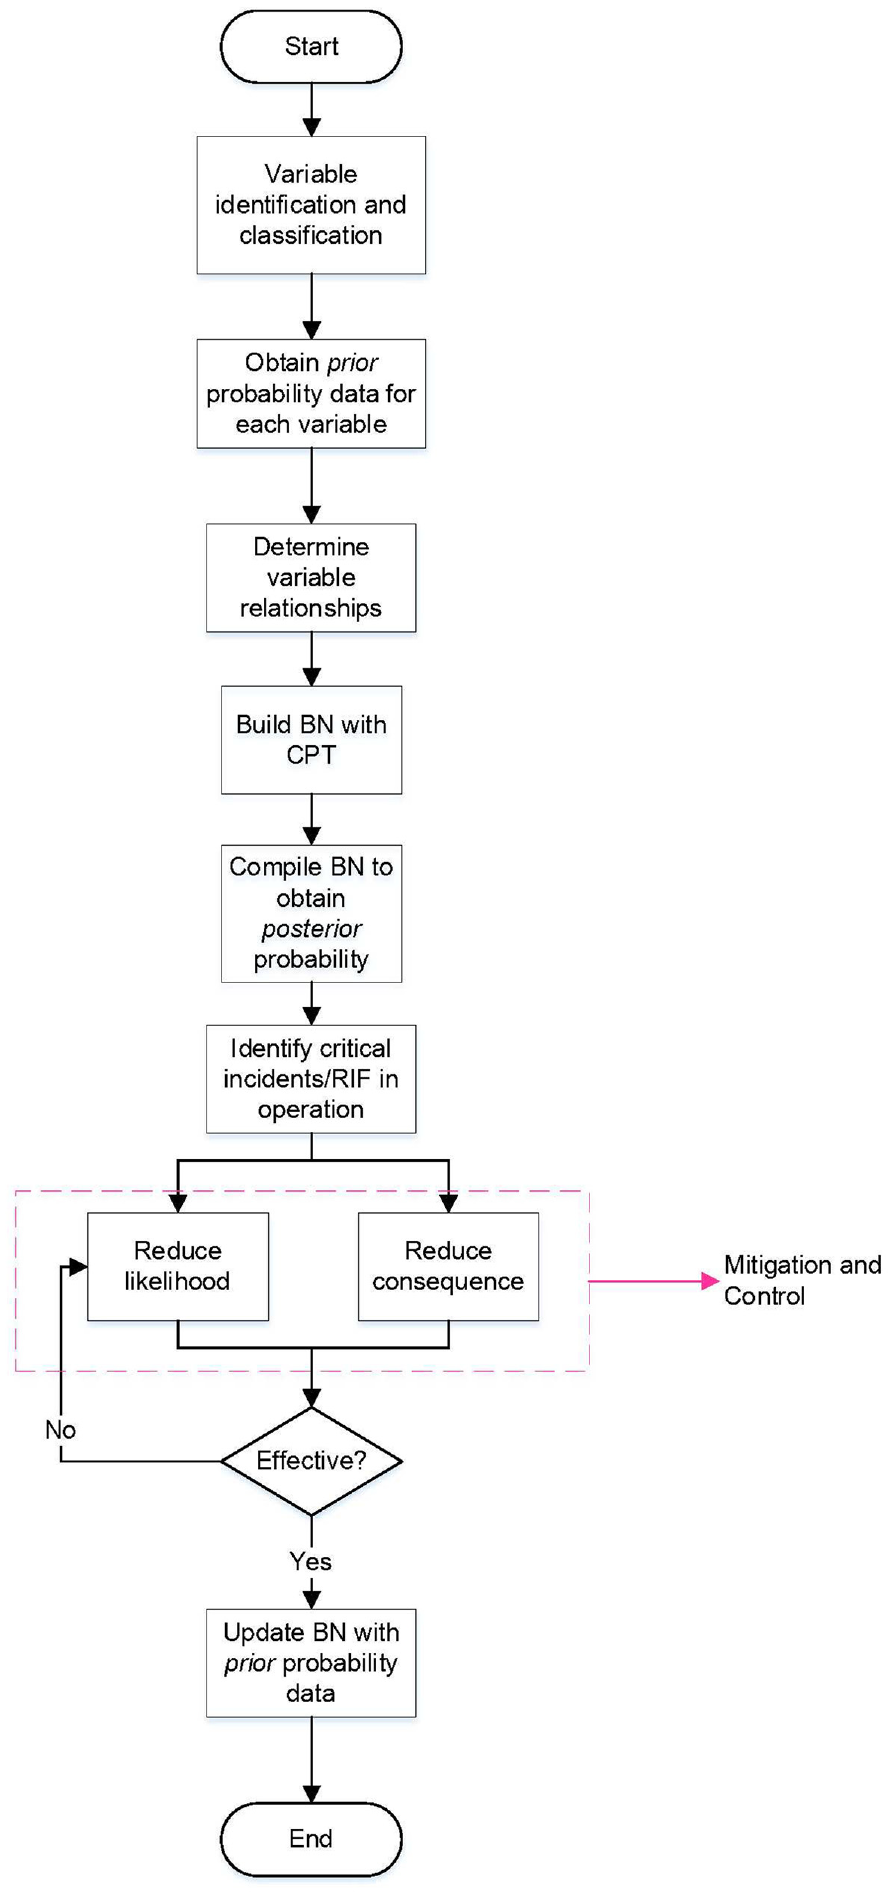
The proposed BN methodology for OWF decommissioning risk assessment.
To develop the BN model for OWF decommissioning risk assessment the following steps were taken:
(i) The potential incidents that can lead to suspended decommissioning operations were identified and grouped by type.
(ii) The relationship between each incident and potential cause(s) was determined; this logic was used for linking the nodes in the BN.
(iii) Prior failure probability data was obtained for each incident and reported in Appendix A.
(iv) The BN model was built by presenting each variable as a node and the prior data distribution as the input for each node, and using links/arcs to input the relationship between each node.
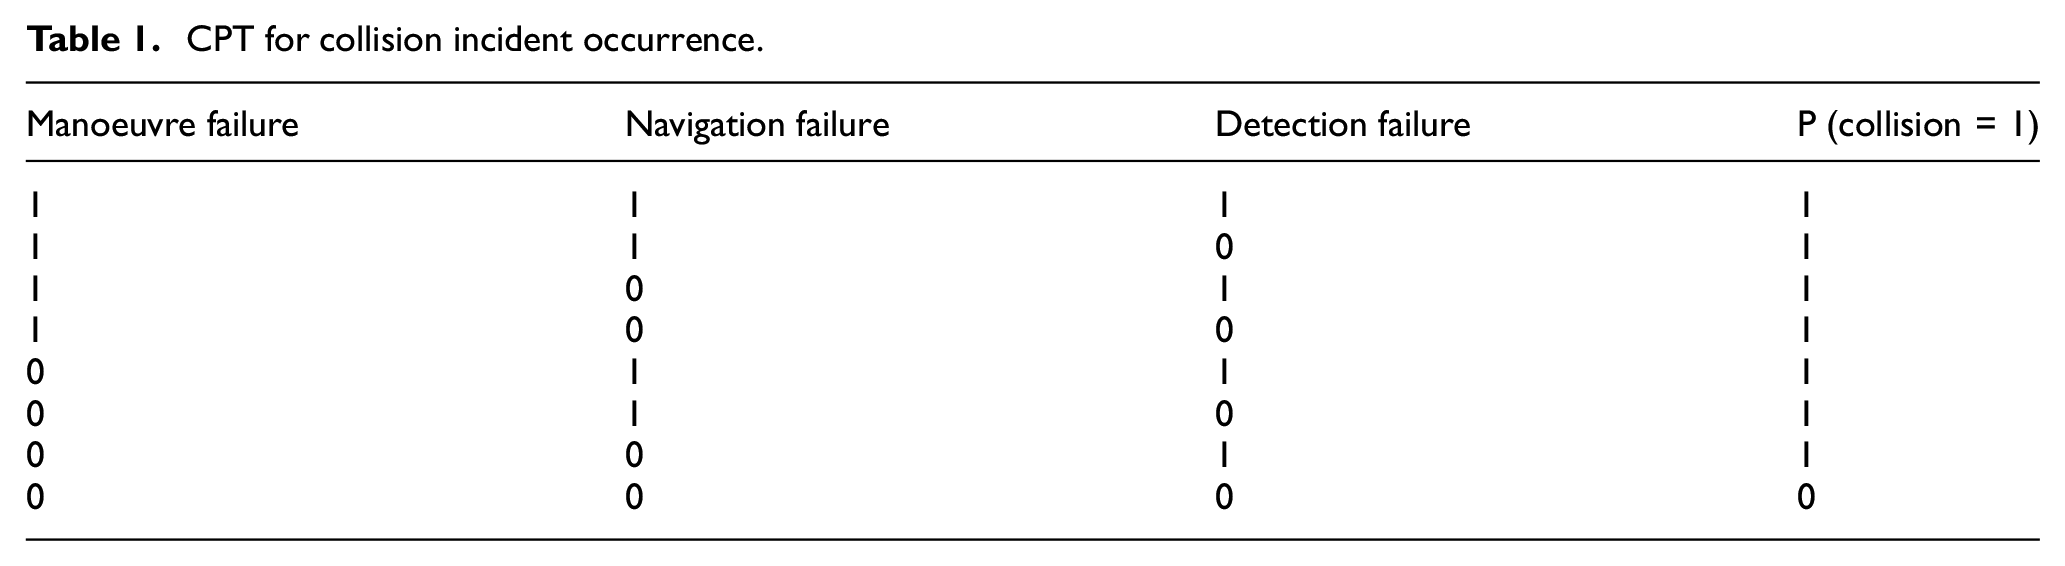
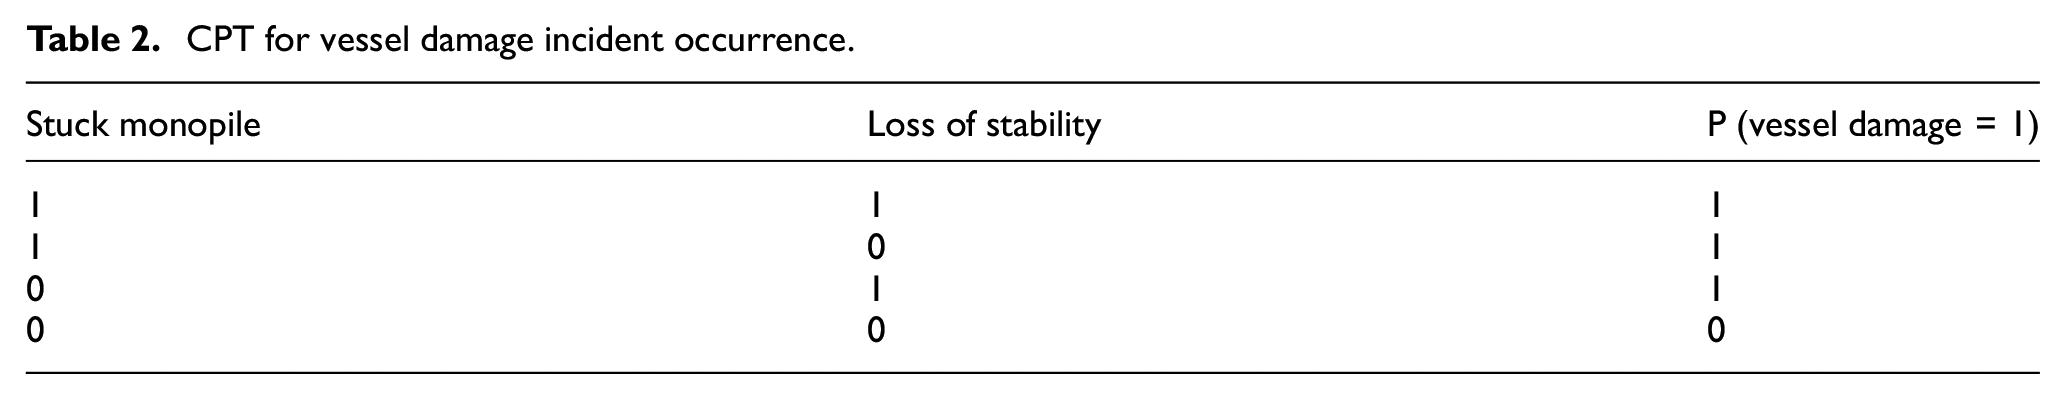
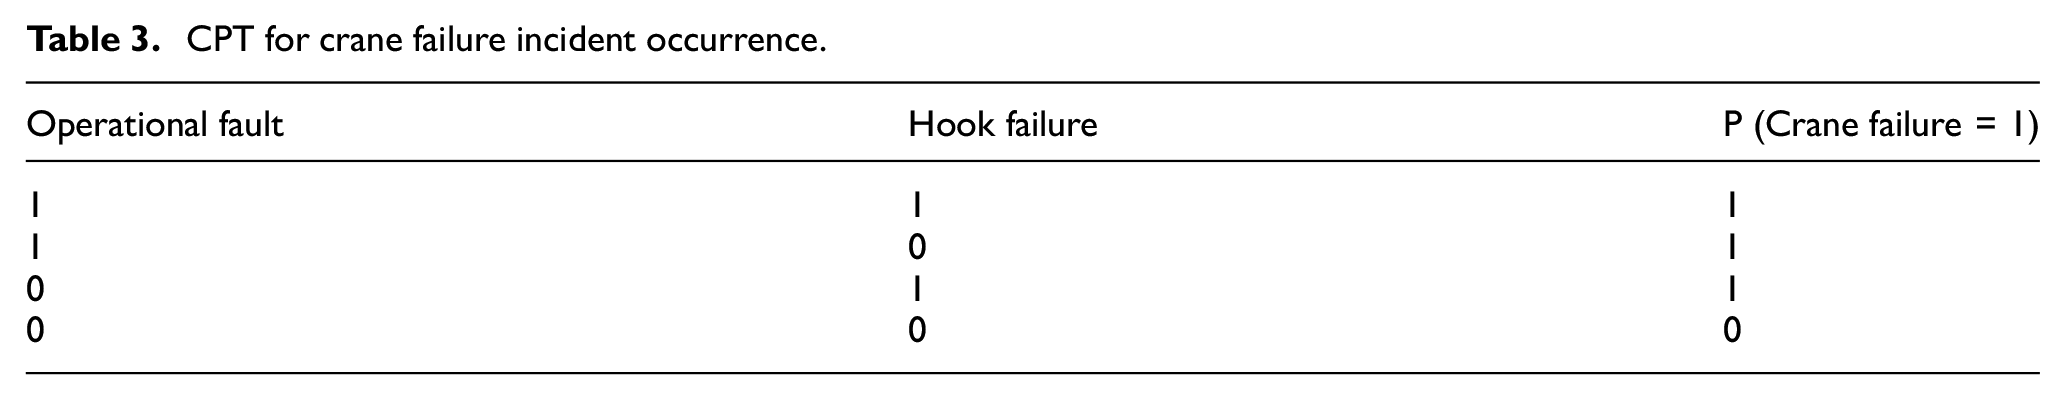
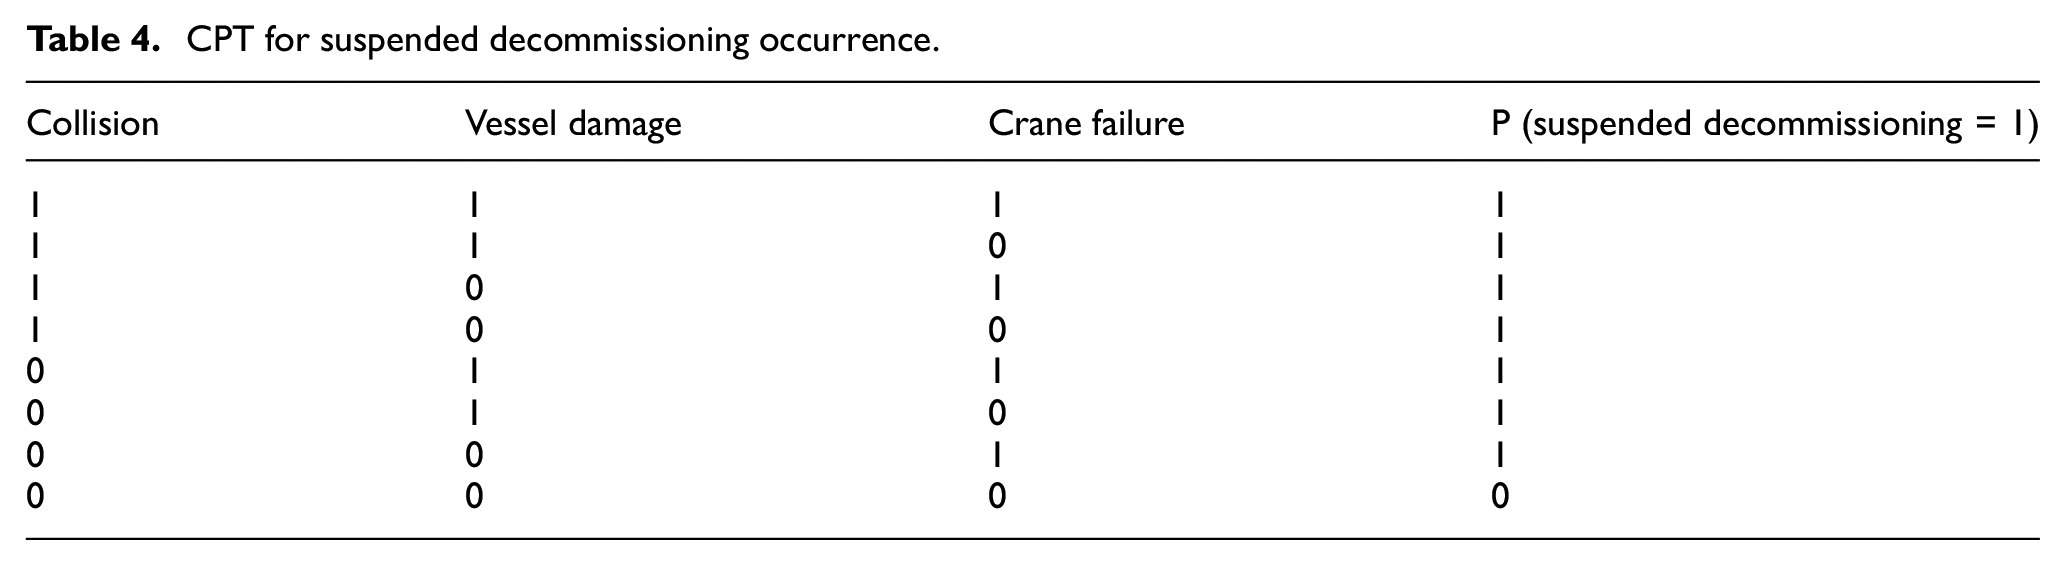
(v) The nodal (incident) dependencies were defined by the CPT for each incident using leaky noisy-OR logic (similar to the Boolean OR operator used in other computational applications). The CPT was encoded in the BN based on the binary function of incident/no incident occurrence (where incident occurrence is denoted by one and no incident occurrence is denoted by zero) showing the nodal relationships among the linked child and parent nodes. Tables 1 to 4 show the CPT for collision, vessel damage, crane failure and suspended decommissioning, respectively.
(vi) After the prior data was inputted into the child nodes and CPT table was developed, the model was compiled to obtain the posterior probability.
CPT for collision incident occurrence.
CPT for vessel damage incident occurrence.
CPT for crane failure incident occurrence.
CPT for suspended decommissioning occurrence.
BN: Overall unwanted outcome
The overall unwanted outcome in this study is considered to be the suspended/halted decommissioning operations (SDO). The likelihood of occurrence of the SDO was determined after the first compilation of the model using the initial prior probability data. Because BNs can be used to understand the impact of more than one incident occurring at the same time during operations, the influence of each causal event can be observed. The effect of each causal event on the outcome was determined from diagnostic, prognostic, updating and influence diagram (cost/utility) modelling.
Diagnosis and prognosis
There are three intermediate incidents for which data was gathered. The nodes each have their associated safety factors/risk-influencing factors (RIF) proposed in this study. All nodes are interdependent, meaning that a change in one node will cause a change in other nodes. For this analysis, we input discrete variables in each node and use binary nodal states. The prior distribution of the failure probabilities is the first set of data used for the first set of computations. The prior data are based on expert knowledge and literature sources in other marine operations, because of the limited available data to date regarding decommissioning operations. The posterior probability is the conditional probability output generated after the BN is compiled. For decommissioning operations, we propose that the BN should be updated for every set of lifts, based on the occurrence/non-occurrence of incidents; on the premise that after every specified set of lifts, the operator/contractor conducts necessary inspections on cranes and other equipment.
Lifting and loading operations are the set of activities involving the lifting and loading and repositioning for another round of lifts. Lifts will be carried out for multiple wind turbines on a wind farm, so our hypothesis is that risk assessment results may not be conclusive for OWF operations until updates are carried out after each set of lifts. During lifting operations, failure may be caused by operational or equipment failures or faults. Suspended decommissioning operations may be caused by a vessel colliding with other vessels on site like a tugboat or support vessel during repositioning after every lift/set of lifts. Similar to collision incidents, vessel allision may also be caused by a vessel colliding with a wind turbine during lifting operations. Vessel damage during lifting and loading operations can be caused by incidents involving poor cutting operations, a serious collision/allision with another asset or by swinging loads that can lead to dropped objects on the vessel. These intermediate nodes are explained below with the potential incident causes.
Collision between vessel and wind turbine
Collision incidents are identified to be caused by different potential incidents between the lifting vessel and other assets (wind turbines, transportation or support vessels). The probability of occurrence of collision was estimated based on the following causal incidents: navigation, manoeuvring and detection failure. Appendix B shows the BN developed for a collision incident between lifting/loading vessels and a wind turbine. The probability of a collision incident is conditional on the probability values of all 16 child nodes and their corresponding RIFs. Manoeuvre failures have a higher likelihood of occurrence than the other potential incidents based on the prior data inputted.
Vessel damage
Vessel damage can be caused by other incidents besides collision during decommissioning operations. The events illustrated in Figure 3 show the causal events/incidents related to decommissioning of monopile-mounted wind turbines. From the initial prior data, it is found out that incidents associated with stuck monopile have a higher likelihood of occurrence compared to loss of stability. Thus, incidents associated with stuck monopile can be investigated further, without ignoring the other incidents.
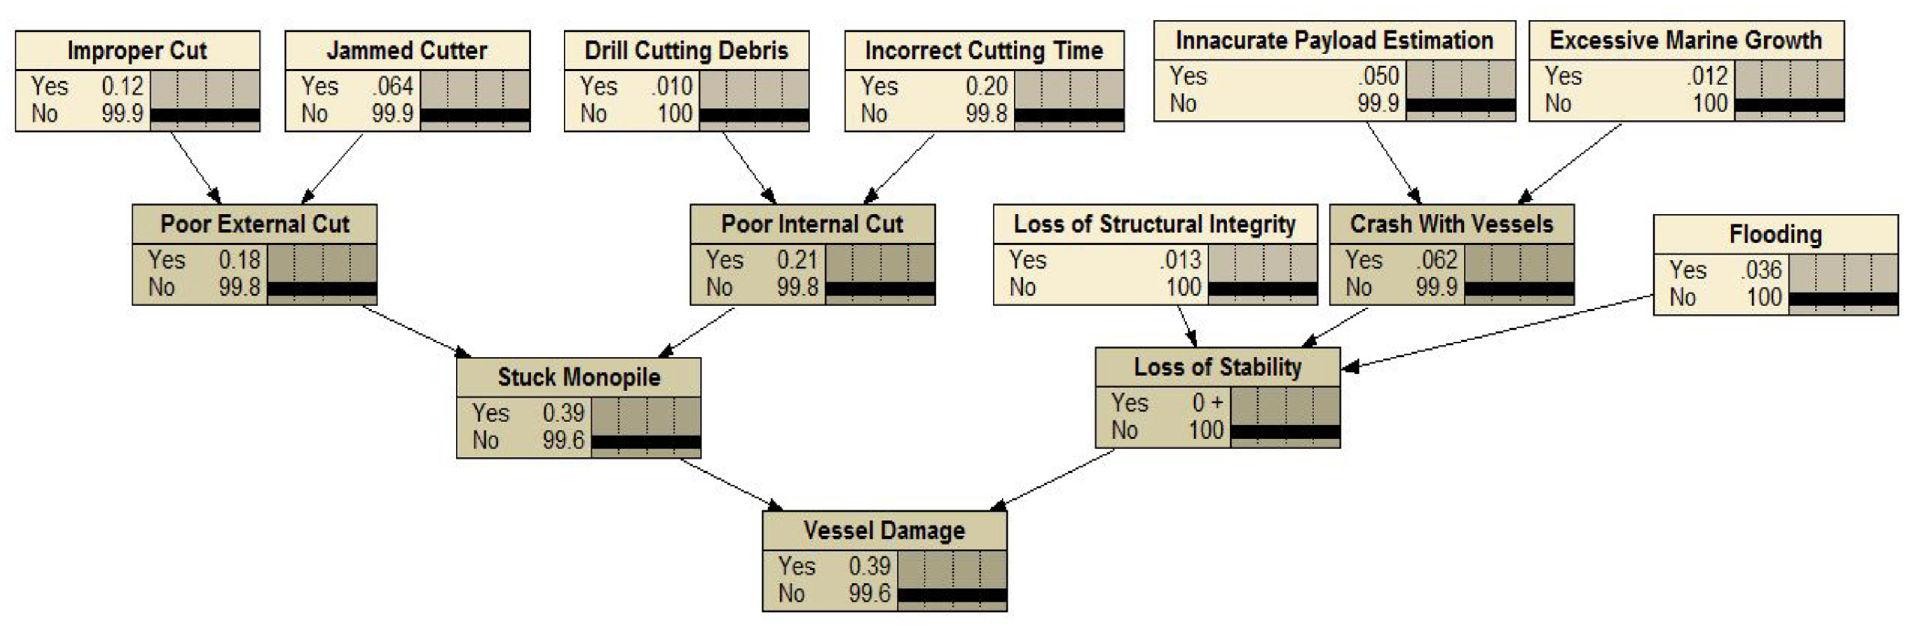
The BN model for vessel damage.
Crane failure
Cranes are central to the lifting operations during decommissioning as their failures can hamper the success of the decommissioning project. All crane vessels and equipment must obtain a certificate indicating that they are fit for use in the offshore environment and under the anticipated conditions. The crane can fail for numerous reasons and Appendix C presents the causes related to hook failure and operational faults.
Risk driving factors in OWF decommissioning
Risk-driving factors in OWF decommissioning are identified for different incidents based on surveys from experts, sample risk registers and the factors reported in literature. The risk-driving factors are different from an operation to another one; thus, the risk-driving factors of the installation stage will be different from those of the O&M stage. We identified the risk-driving factors using a BN to update the belief for improved risk analysis. This study identifies several risk factors related to critical incidents that were identified for lifting and loading operations during the decommissioning stage.
Bayesian updating
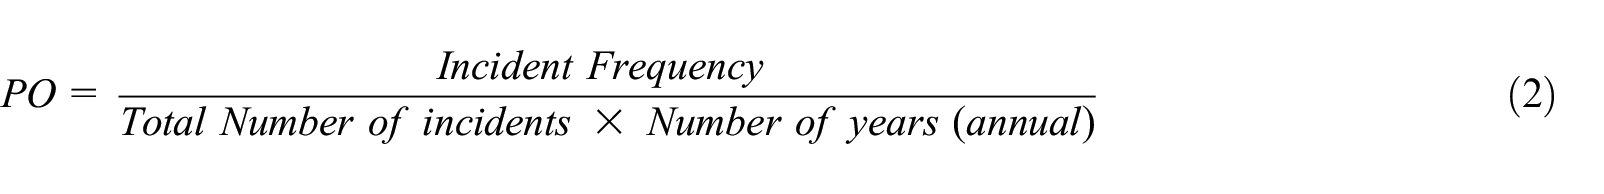
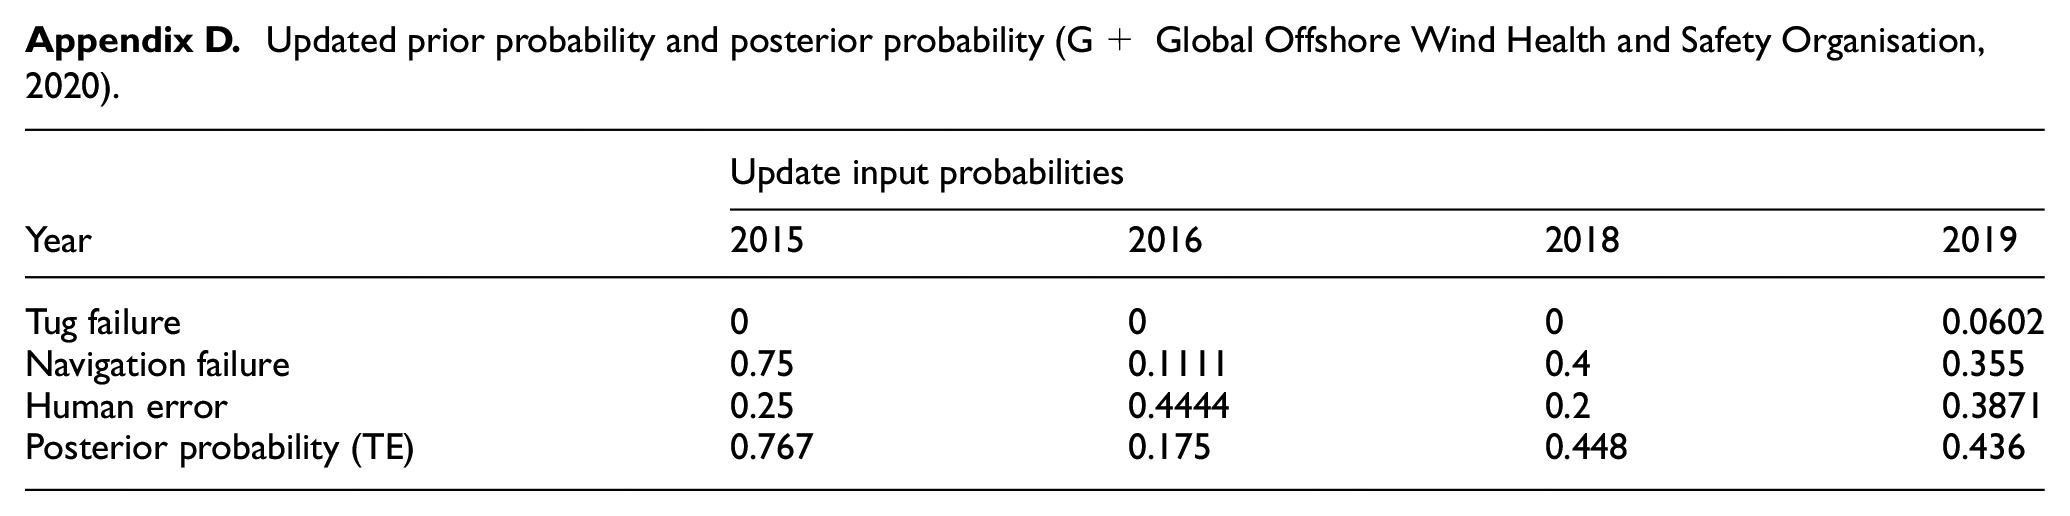
In order to re-assess the decommissioning operation outcome (i.e. updated posterior probability with new belief), operational data were incorporated into the model. The Bayesian updating was conducted for jack-up/barge vessel, tug and crew transfer vessel incident data which was collected from G+ Global Offshore Wind Health and Safety Organisation (2020) (see Appendix D). An update during the decommissioning stage might be required for two main reasons: (i) when new data becomes available and (ii) when operational safety is improved. The incident frequency was converted to probability of occurrence data using equation (2) (Uğurlu et al., 2015). The probability estimates were calculated on an annual basis, independent of past years.
Influence diagrams
Influence diagrams are an extension of the BNs, which include decision nodes and utility nodes like the cost of intervention when the risk reaches a certain level (Luque and Straub, 2019). The impact of different interventions (such as repair, replacement, additional inspections, etc.) on the operational outcomes were assessed by including a decision and utility node within the network. A binary state (repair or no-repair) was used in decision nodes to assess the impact that interventions may have on intermediate nodes in the network (collision, vessel damage and crane failure) as given in Appendix E. The ratio of repair costs to cost of no-repair (when no intervention is conducted) was assumed to be 100:1000 (1:10) (Yang and Frangopol, 2018).
Results and discussion
Output: Unwanted outcome
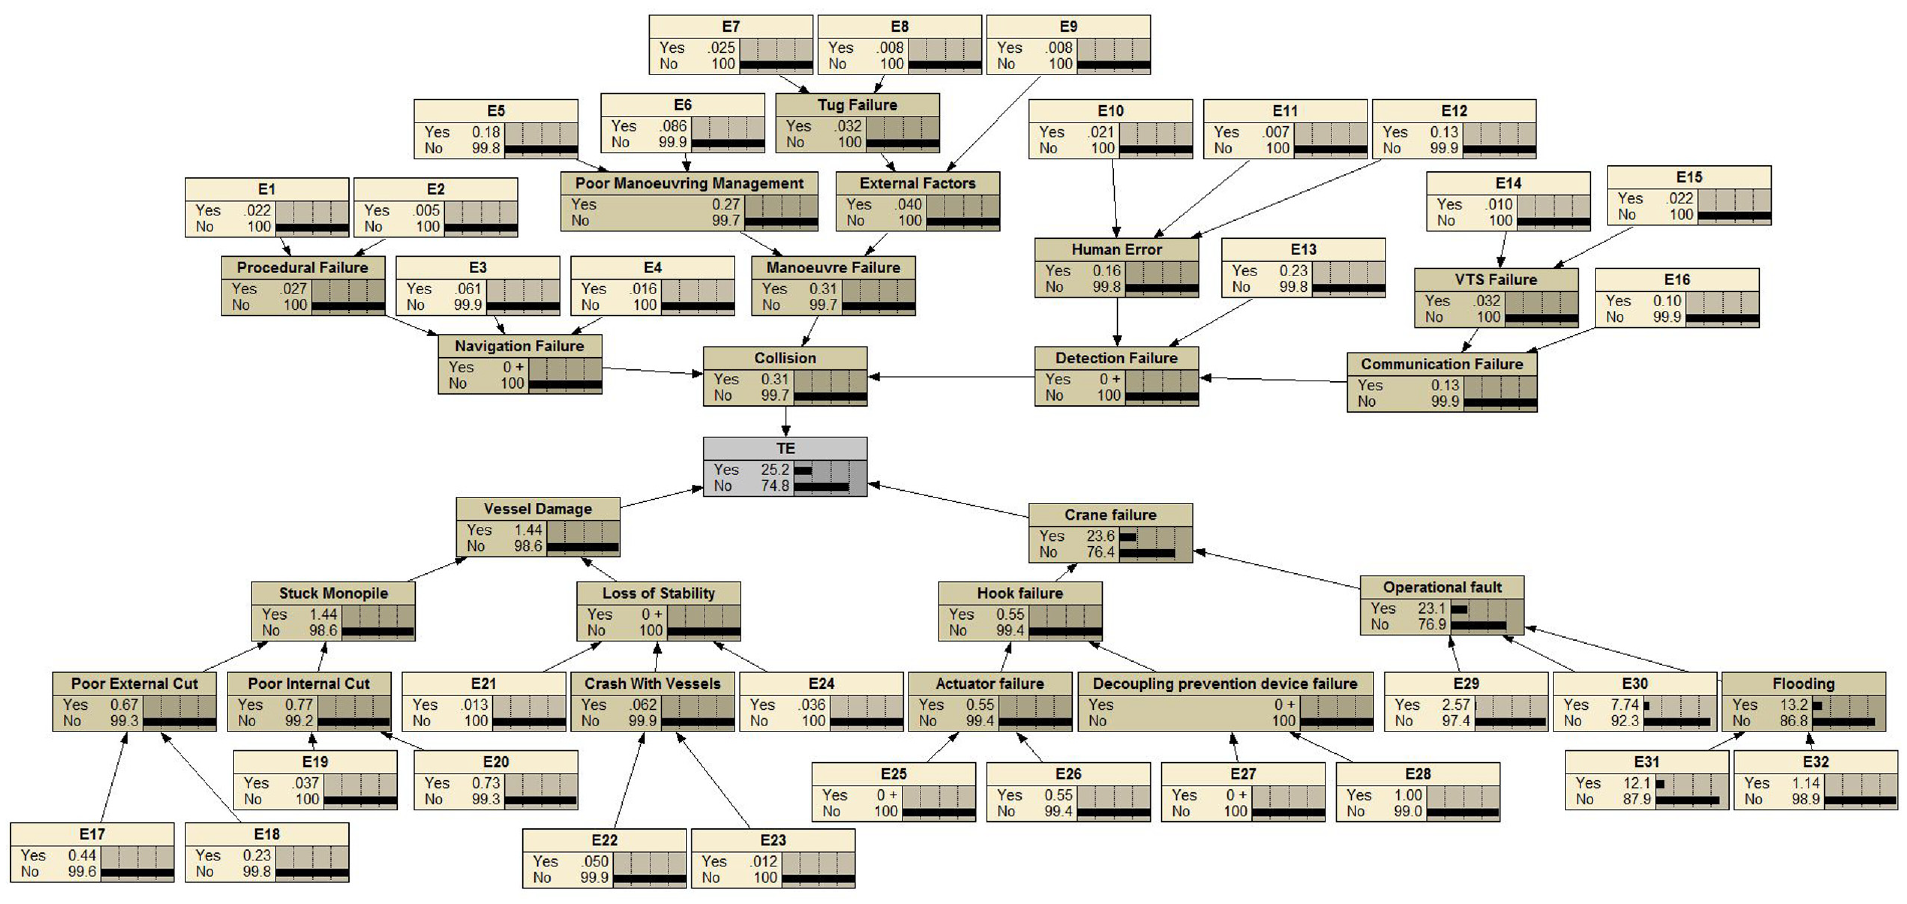
As shown in Figure 4, the posterior probability (likelihood of occurrence) of suspended decommissioning operation with neglecting the environmental factors was estimated to be 0.0688. Sixteen critical factors were identified to have the greatest impact on the outcome among which the crane failure was found to contribute the most to suspended lifting and loading operations, followed by collision and vessel damage, respectively.
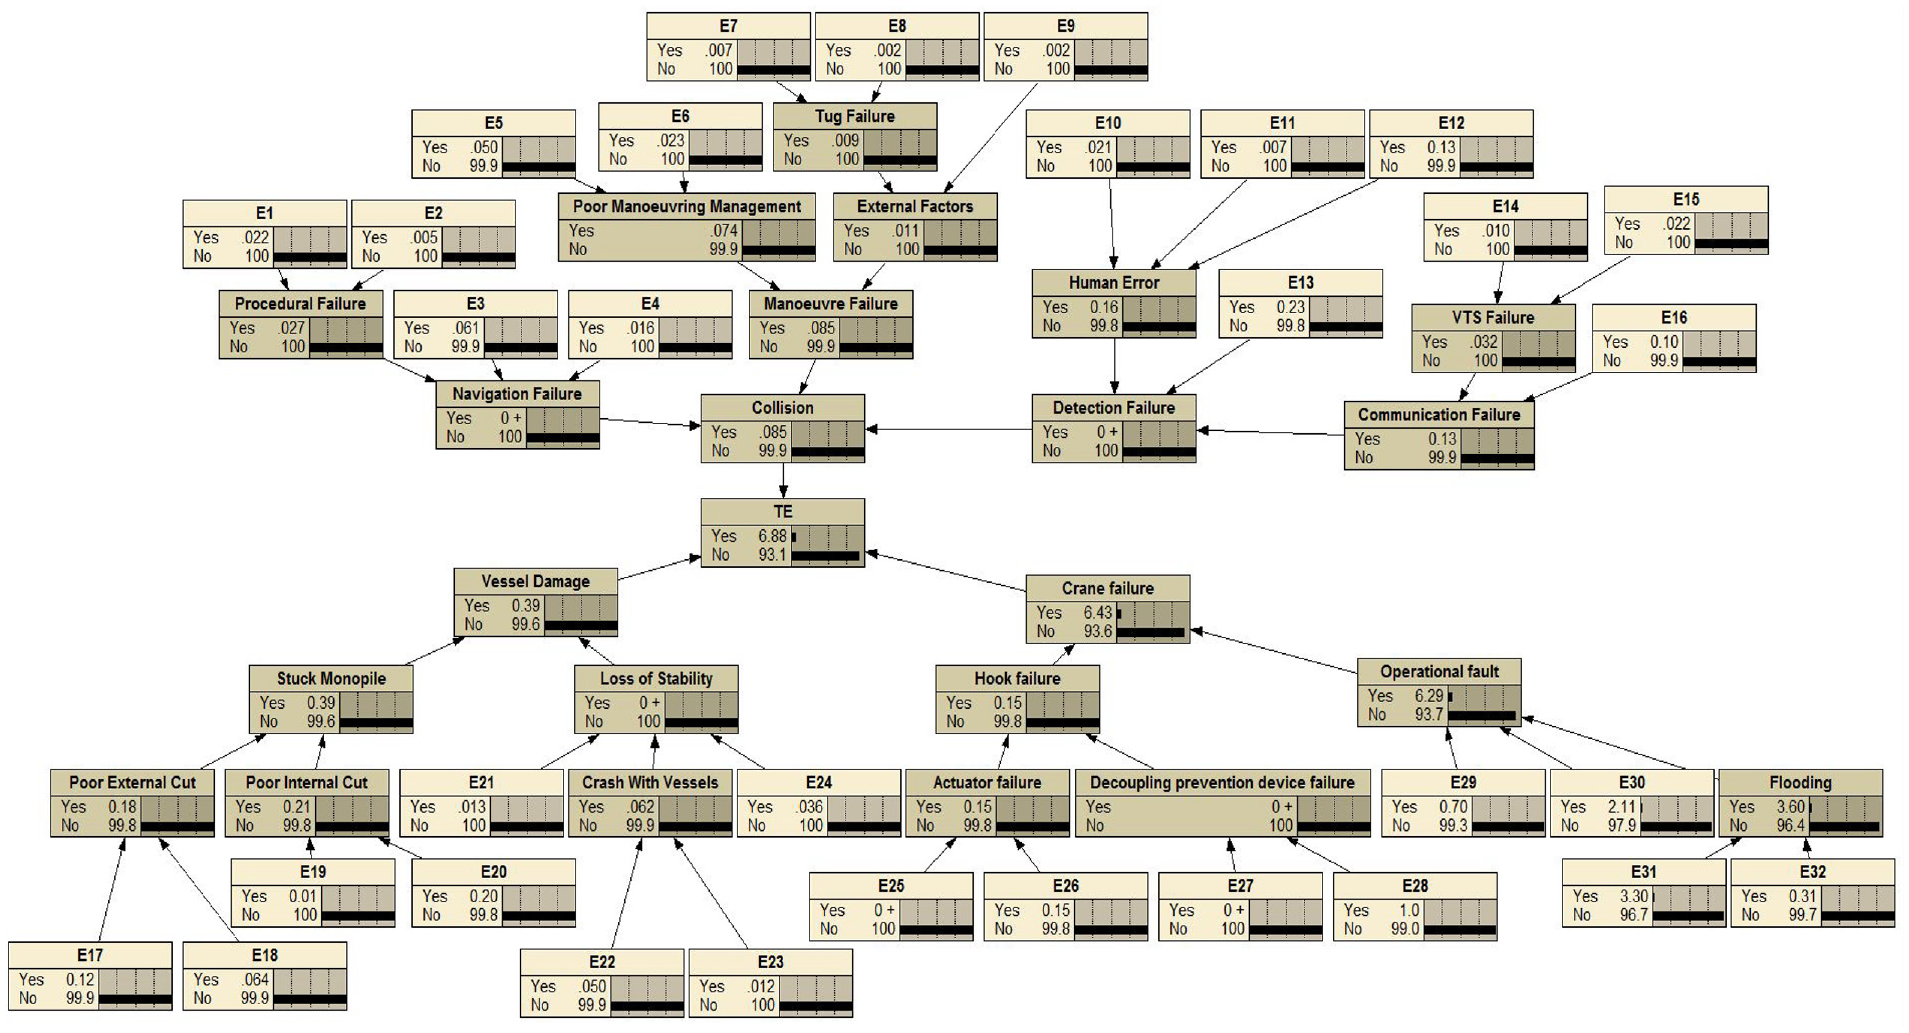
A BN model showing the conditional probability of suspended decommissioning operations.
The most critical factors for each incident are presented below, where a breakdown of the unwanted outcome probability of failure is given.
Intermediate incident: Collision
The initial likelihood of occurrence of a collision incident was 0.00085. Among the incidents, the collision was found as the least contributor to suspended operations. The incidents that contributed the most to a collision incident include: inefficient use of navigation equipment (E3), faulty manoeuvre master (E5) and error of watch keeping officer (E6).
Intermediate incident: Vessel damage
The likelihood of occurrence of a vessel damage incident was estimated to be 0.0039. This incident was found to be the second largest contributor to suspended operations. The incidents that contributed the most to a vessel damage incident include: jammed cutter (E18), inaccurate payload estimation (E22) and vessel flooding (E24).
Intermediate incident: Crane failure
The likelihood of occurrence of a crane failure was estimated to be 0.0643. This estimate is significantly higher than probability of the collision and vessel damage incidents. In a crane failure incident, the three most influencing factors are identified as: structural failure (E25), control system fault (E26) and obstructed vision (E32). These findings can be likened to the fact that cranes are sensitive to degradation during their operations. Regular inspections and other interventions, however, can reduce the likelihood of occurrence of a crane failure incident.
Diagnosis of child node incidents
An advantage of the BN application beyond the capacity of other techniques is its capacity for both forward and backward analyses (diagnosis and prognosis). Thus, in order to determine the impact of each causal incident on the operation success/suspension, additional forward analysis (diagnosis) was conducted. The BN was used to conduct a diagnosis analysis on incidents affecting the lifting operations and what impacts they will have on successful/unsuccessful operations. The impact was observed by setting the ‘yes’ state of each node in the BN model to zero, one at a time, whilst the other nodes maintaining their states. This meant a certainty that no incident occurred for the observed node. Figure 5 shows that the highest impact on the posterior probability outcome was observed in nodes E31, E30, E29, E32, E20, E26 and E17, respectively. The values of the other nodes were negligible and not presented.
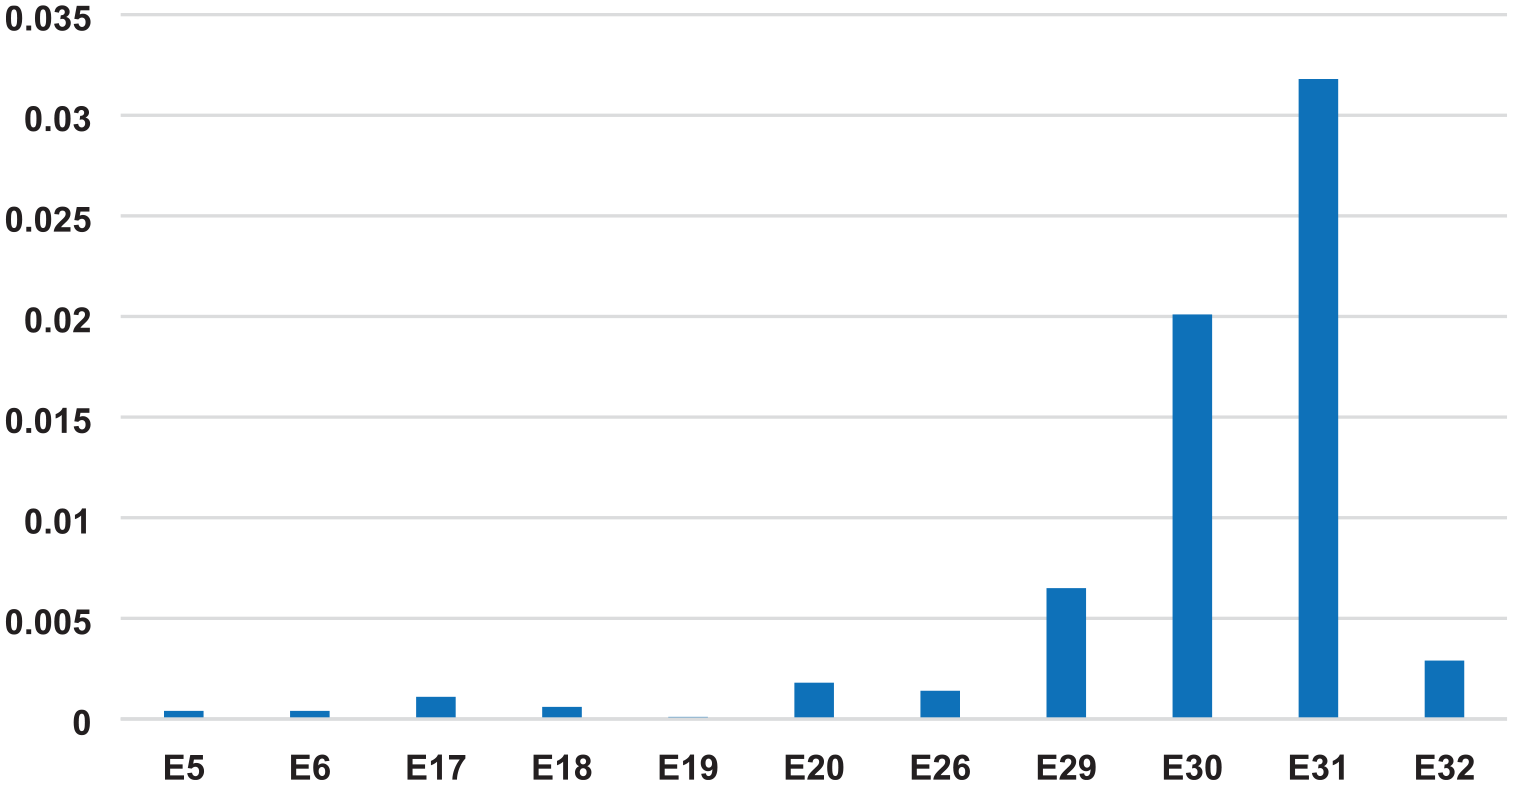
Diagnosis of each node (difference between initial posterior probability and the updated posterior probability values).
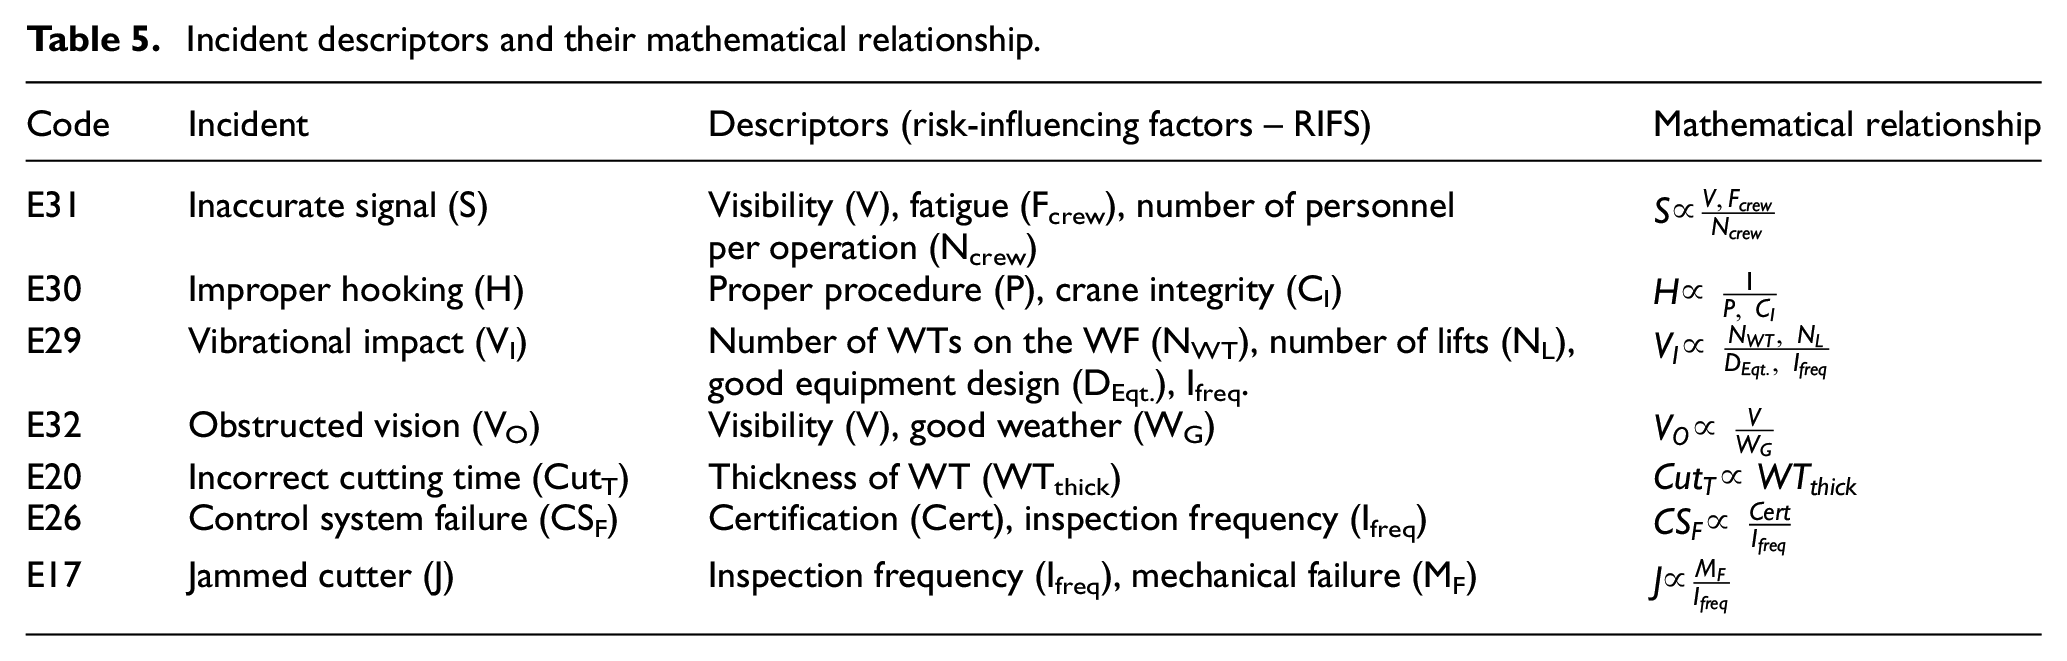
The most critical risk influencing factors (RIFs) were determined by identifying potential causes of the incidents that have the highest impact on lifting operation safety. Each node has its associated RIFs. The high posterior probabilities are associated with the most critical RIFs. The descriptors of each critical incident were determined and are presented in Table 5. The relationships are presented in terms of direct or inverse proportionality. Reducing any of the RIFs will have positive implications on the safety of operations. The most critical RIFs were identified to be: visibility (V), crew fatigue (Fcrew), number of personnel per operation (Ncrew), proper procedures (P), crane integrity (CI), number of WTs on the WF (NWT), number of lifts (NL), inspection frequency (Ifreq.) and good equipment design (DEqt.).
Incident descriptors and their mathematical relationship.
Diagnosis of grouped class of causal events
Another key benefit of using the BN tool during risk assessments is that the diagnosis of causal event groups is also possible. These grouped potential incidents can be collectively assessed to inform safety improvement actions for asset managers, operators and regulators. In this way, if a classified group of events have higher occurrences and impacts, tailored approaches can be developed to improve that incident group. This capability can provide better understanding of the impacts that certain categories of failures/faults can have on operations. For the decommissioning operations, the 16 critical incident child nodes were grouped into three categories of human error related incidents (H), mechanical/electrical incidents (M) and procedural incidents (P) and they were used for multiple-event diagnosis. Human error related incidents can be addressed on a case-by-case basis by training/re-training, improved research into human-mechanical systems, etc.
As shown in Figure 6, child nodes (incidents) can be eliminated in order to observe the effect of a grouped class of incident probabilities relevant to specific analyses. In the example presented, it is assumed that if human error related incidents (E6, E7, E8, E31 and E32) are mitigated/controlled to ALARP, the probability of occurrence of the suspended operations decreases to 0.0337. Secondly, assuming that critical mechanical/electrical related events (E5, E18, E19, E25, E26, E27 and E29) were mitigated/controlled to as low as reasonably practicable (ALARP), the probability of occurrence of the suspended operations was observed to decrease to 0.0597. Thirdly, assuming that critical procedural variables (E9, E17, E20 and E30) were reduced to ALARP, the probability of occurrence of suspended operations was observed to decrease to 0.0457.
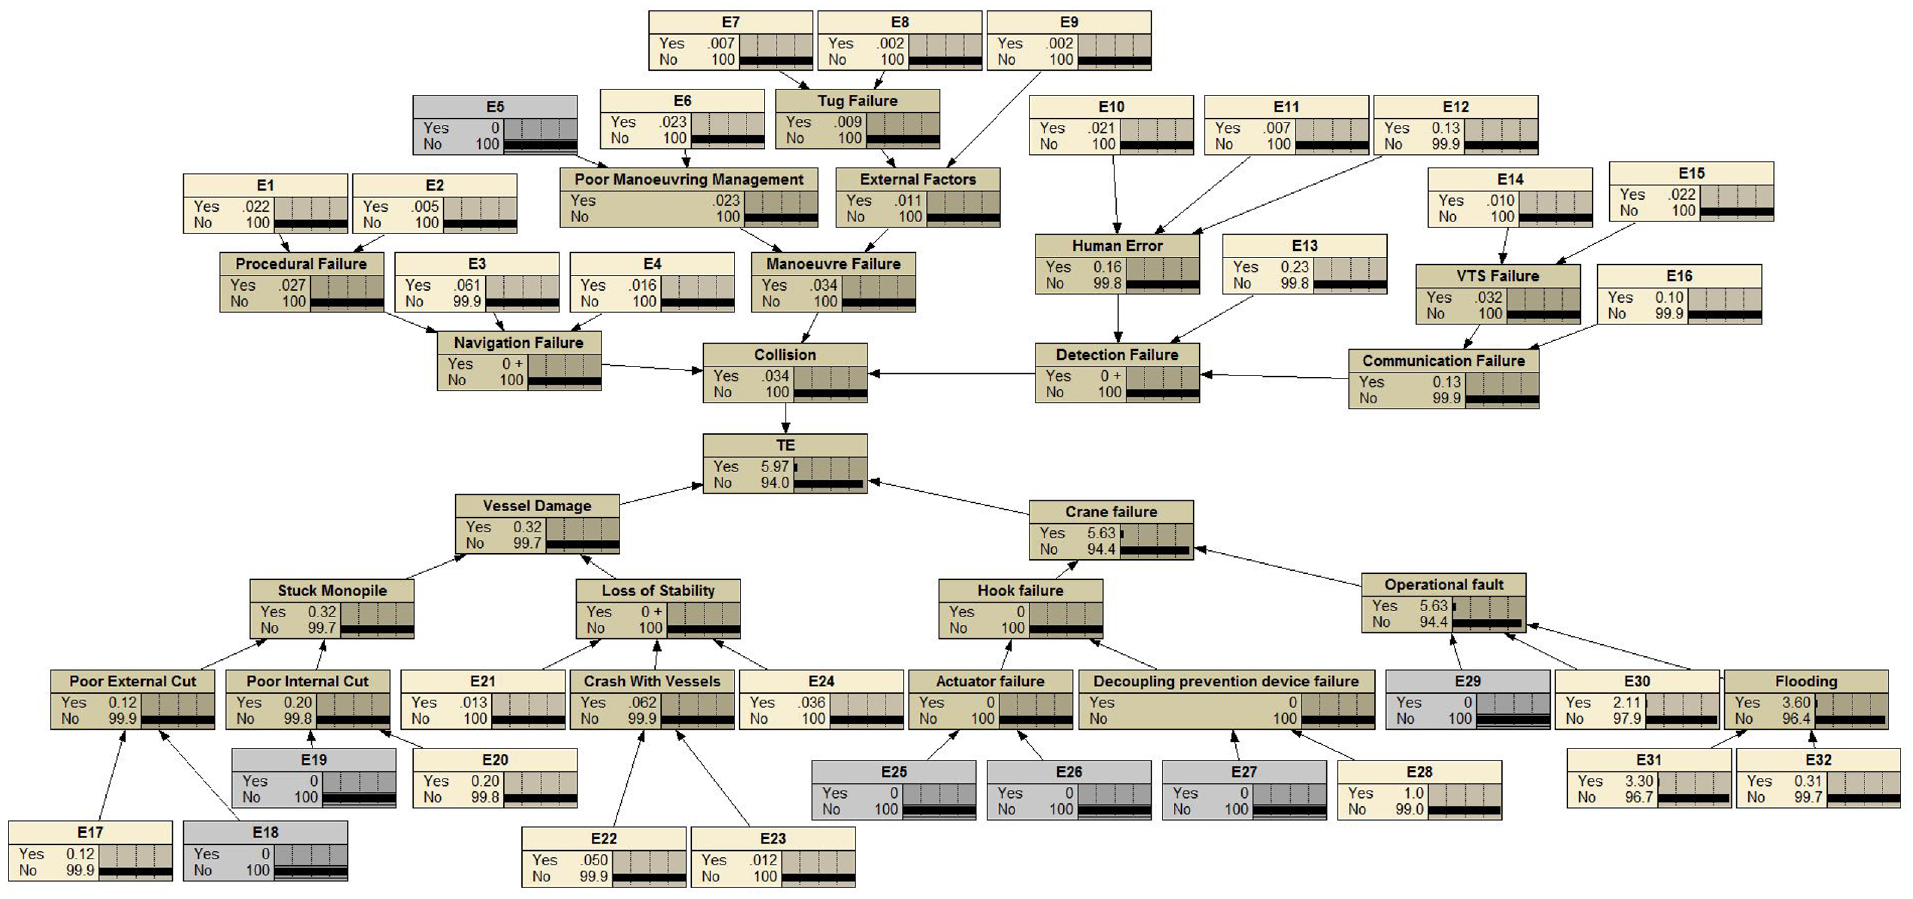
Top event (suspended decommissioning) when mechanical/electrical related incidents are mitigated/controlled.
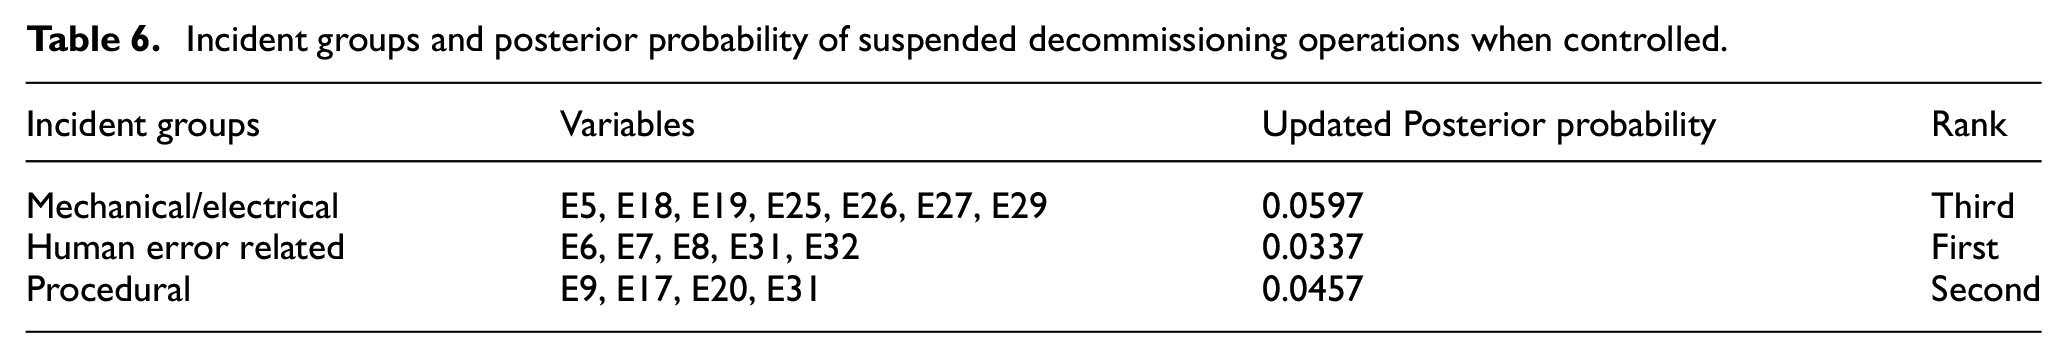
Table 6 shows the most critical incidents identified in each group. Assuming that only one group/class of incidents is treated (mitigated/controlled), the nodes representing the variables (incidents) within each group was set to ‘no’ state in order to model the posterior probability obtainable after treatment. Mechanical/electrical incidents can be prevented by evaluating and improving the system reliability. Procedural incidents can be reduced by understanding the factors related to each group in operational procedures. After modelling the risk treatment of different groups, it was found out that the human error had the highest probability, followed by procedural and mechanical/electrical, respectively. This shows that if human errors are eliminated, the highest safety improvement can be achieved.
Incident groups and posterior probability of suspended decommissioning operations when controlled.
As Figure 7 shows, mitigating the procedural related risks to ALARP reduced the most the likelihood of crane failure incidents. Mitigating the human error related risks to ALARP reduced the most the likelihood of vessel damage incidents. Lastly, mitigating the mechanical/electrical related risks to ALARP reduced the most the likelihood of collision incidents. Overall, based on rankings, the human error contributed the most to each incident type which shows where the efforts of the asset management team are better to be directed. The human error related risks can be reduced to ALARP, even though difficult to eliminate all together, because they are dependent on subjective judgement of the personnel. The main mitigation approach for reducing the human error related risks is to improve automation in decommissioning equipment and systems.
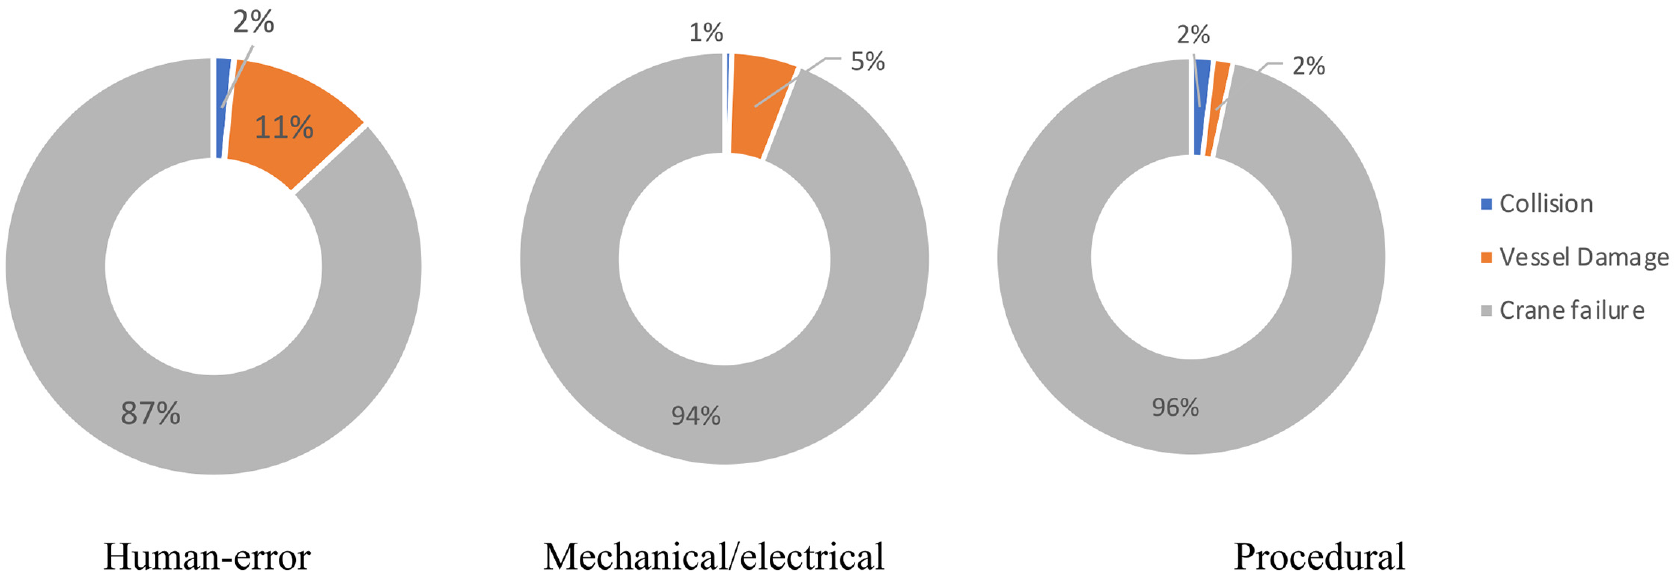
Impact of risk mitigation on OWF decommissioning operation safety.
Prognosis of the causes for suspended decommissioning operations
Prognosis can support safety planning when not all factors are known or well understood for a specific site. BNs can be used to estimate the possible future conditional probability of occurrence of the suspended decommissioning operations and evaluate its effect on the connected nodes, especially if not all incident probabilities are known. Nodes can be eliminated or included during prognosis, particularly if they do not apply to the operation/site being assessed. This is another method in which critical incidents can be observed if all potential mitigation/control efforts have been applied. In Figure 8, a prognosis of the overall outcome and the effects on RIFs were observed. The impact of a likelihood of occurrence of 0.252 for the unwanted event on RIFs is presented.
The impact of increasing expected probability of occurrence on the top event (suspended decommissioning).
Figure 9 shows the incident impacts when the posterior probability of the occurrence of suspended decommissioning operations increases to 0.252. The BNs showed the same trend of increase for every quartile increase (0.252, 0.496 and 0.754) except when input parameters are updated. New prognostic data can be obtained after every lifting and loading operation on a wind farm in order to use the updating feature of BNs for safety assessment improvement.
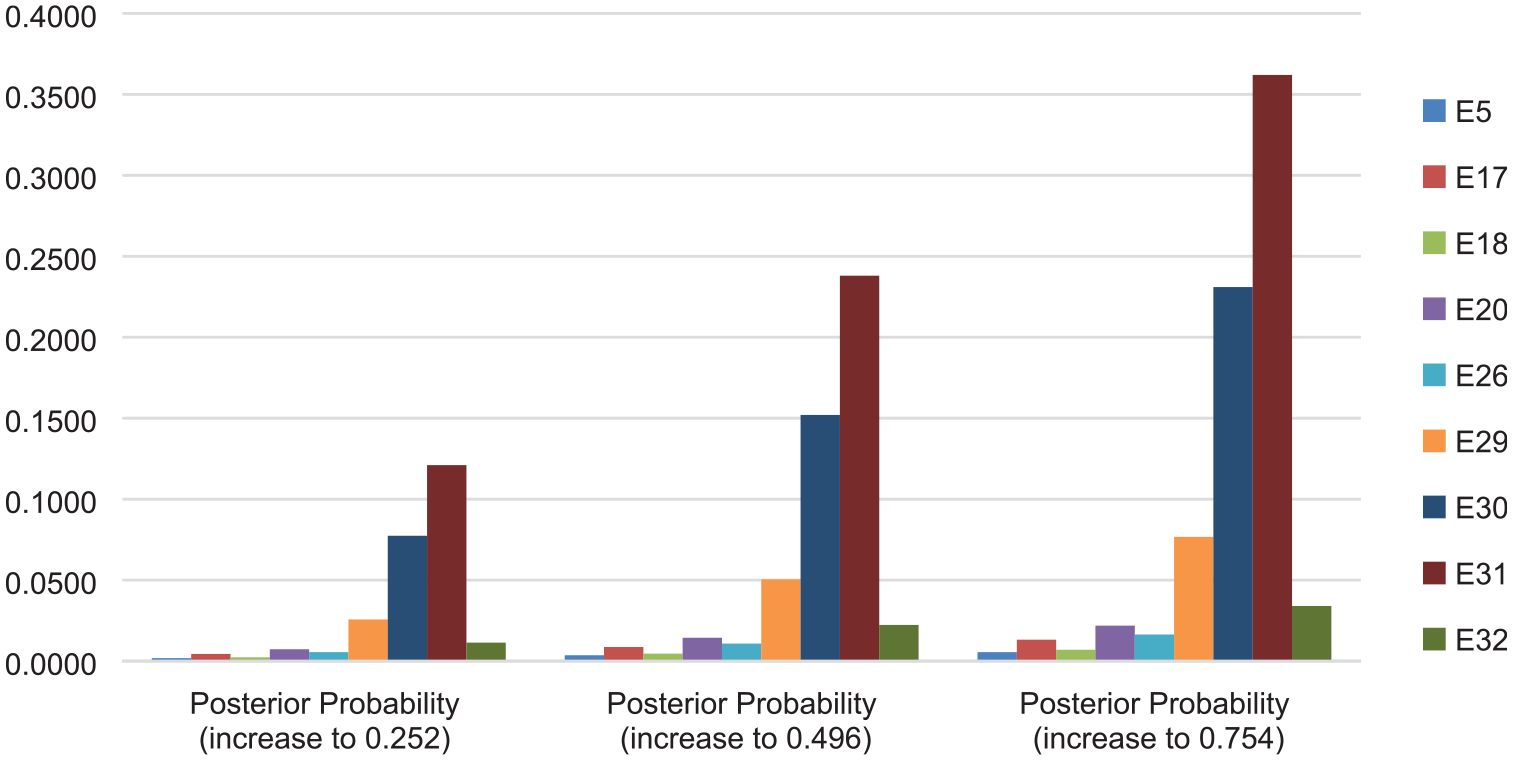
Prognosis of suspended decommissioning operations.
Figure 10 shows the difference between the prior probability and the observed probability of occurrence for each critical incident when the posterior probability is increased to 0.252. With this capability, BNs can be used to observe the effect of potential critical events on suspended decommissioning operations by assessing the impact that each critical event has on the other events. This prognostic capability of BNs can be maximised when there is more operational data available.
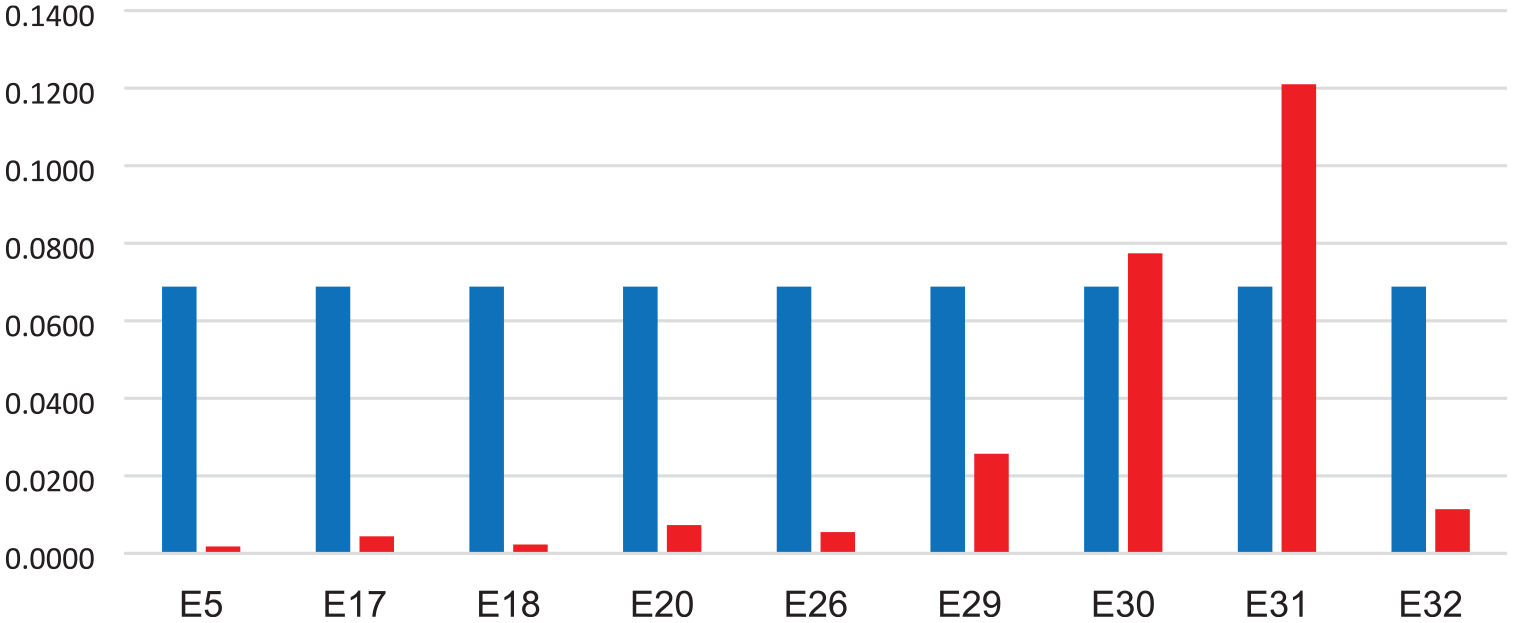
The impact of likelihood of occurrence of failed operations on suspended decommissioning operations (blue: prior likelihood, red: top event increases to 0.252).
Updating BNs
The first round of simulations yielded similar results to what obtained using fault tree analysis (FTA). New data for each potential incident may be obtained from operators, regulators or independent service providers. We present a case where the BN results are updates with new operational incident data. Tug failure, human error and navigation failure nodes alone were updated with new data from G+ Global Offshore Wind Health and Safety Organisation (2020). These data reported incidents only for installation and operation and maintenance (O&M), as seen in Figure 11.
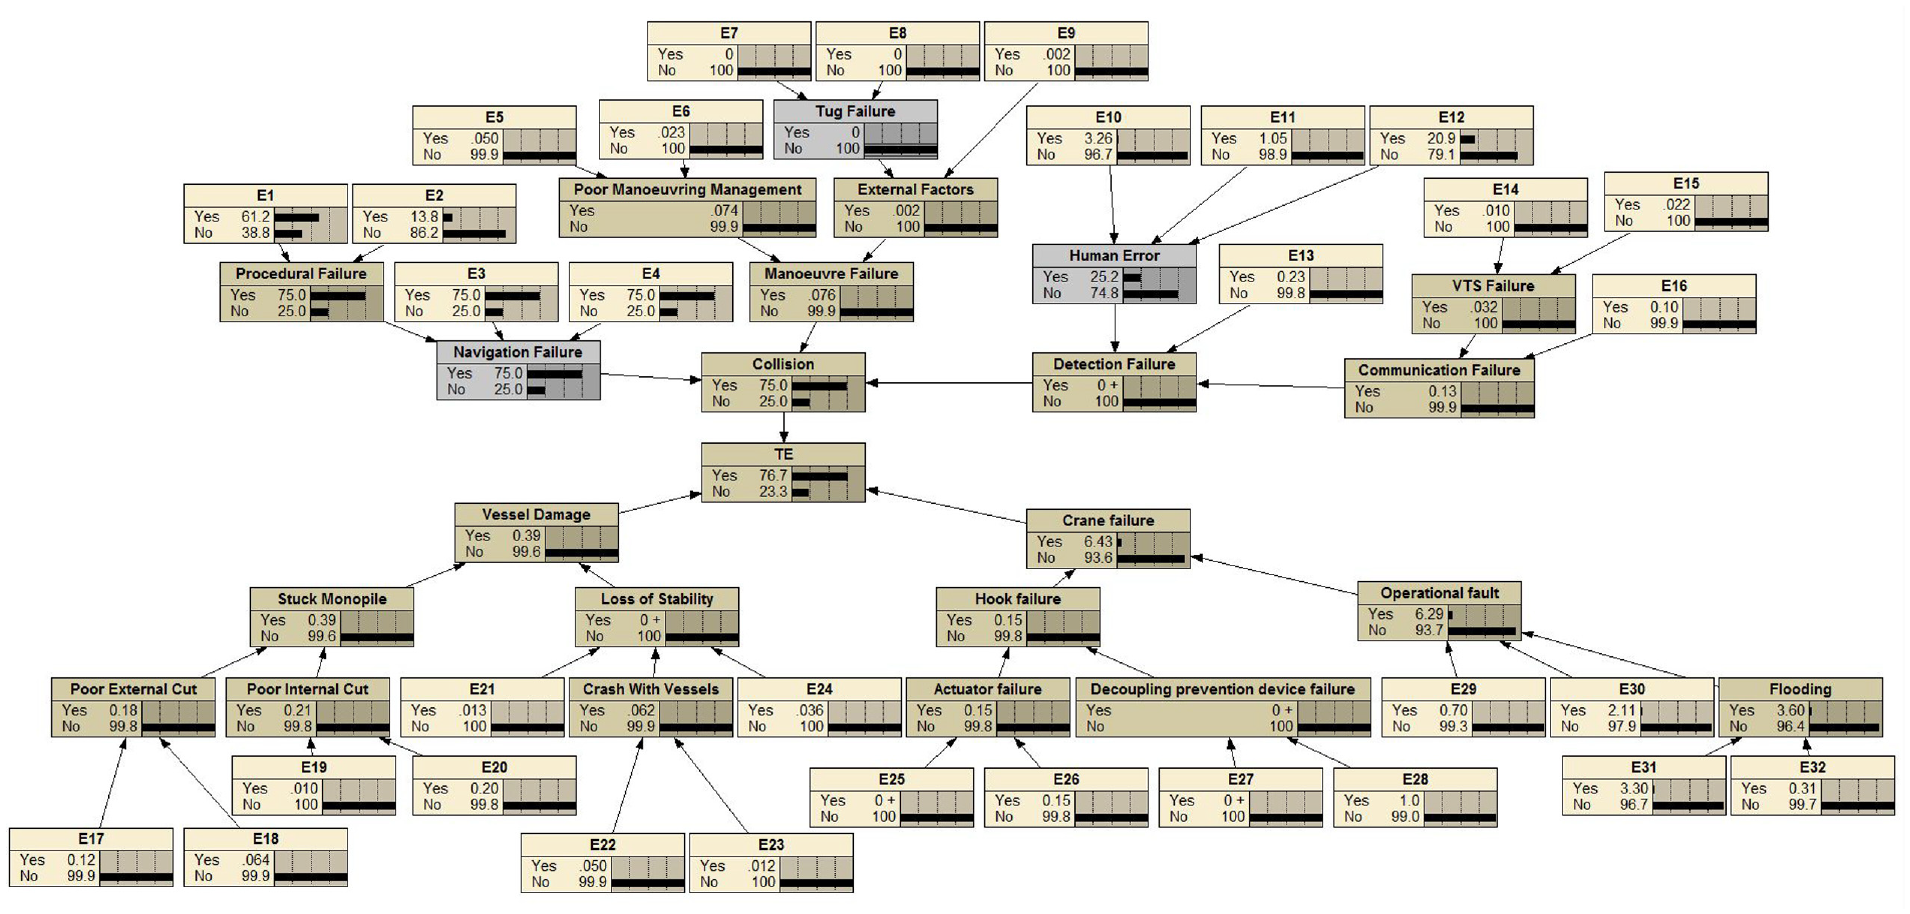
Update with 2015 data (G+ Global Offshore Wind Health and Safety Organisation, 2020).
From Figure 12, it is observed that BNs can be used to model and compare the annual likelihoods of suspended decommissioning operations with a potential to observe trends over time. Based on the recorded navigation, tug and human error related incidents data inputted in the BN model, it was found out that probability of suspended operations decreased in year 2 (update 2), increased with update 3 and marginally decreased in the following year. G+ Global Offshore Wind Health and Safety Organisation (2020) reported no tug, navigational failures or human-error related incidents for 2017. This increase was commensurate with a rise in the OWF operations as reported. Thus, the likelihood of the events leading to higher risks during the decommissioning stage can be deduced using BNs. Unless targeted safety efforts become paramount, an increase in the number of decommissioning projects can imply higher safety concerns (incidents).
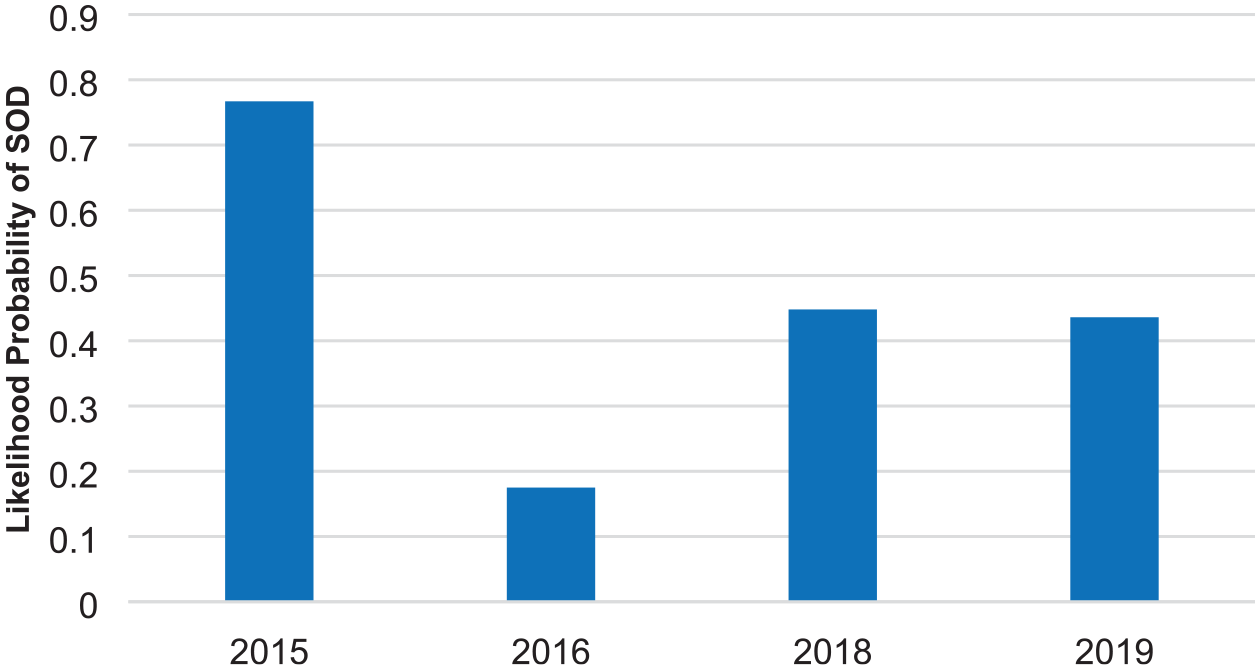
Annual probability of occurrence of suspended decommissioning operations using G+ OWF data.
Extension to an influence diagram (decision and utility nodes)
Project risks have associated costs; thus, the BN model was used to assess the utility of reducing the likelihood of occurrence of the incident, that is, how beneficial it will be to address intermediate incidents. Influence diagrams were developed with the addition of decision nodes in the BN as seen in Figure 13, Appendix F and G. The utility of addressing collision, vessel damage and crane failure were each investigated.
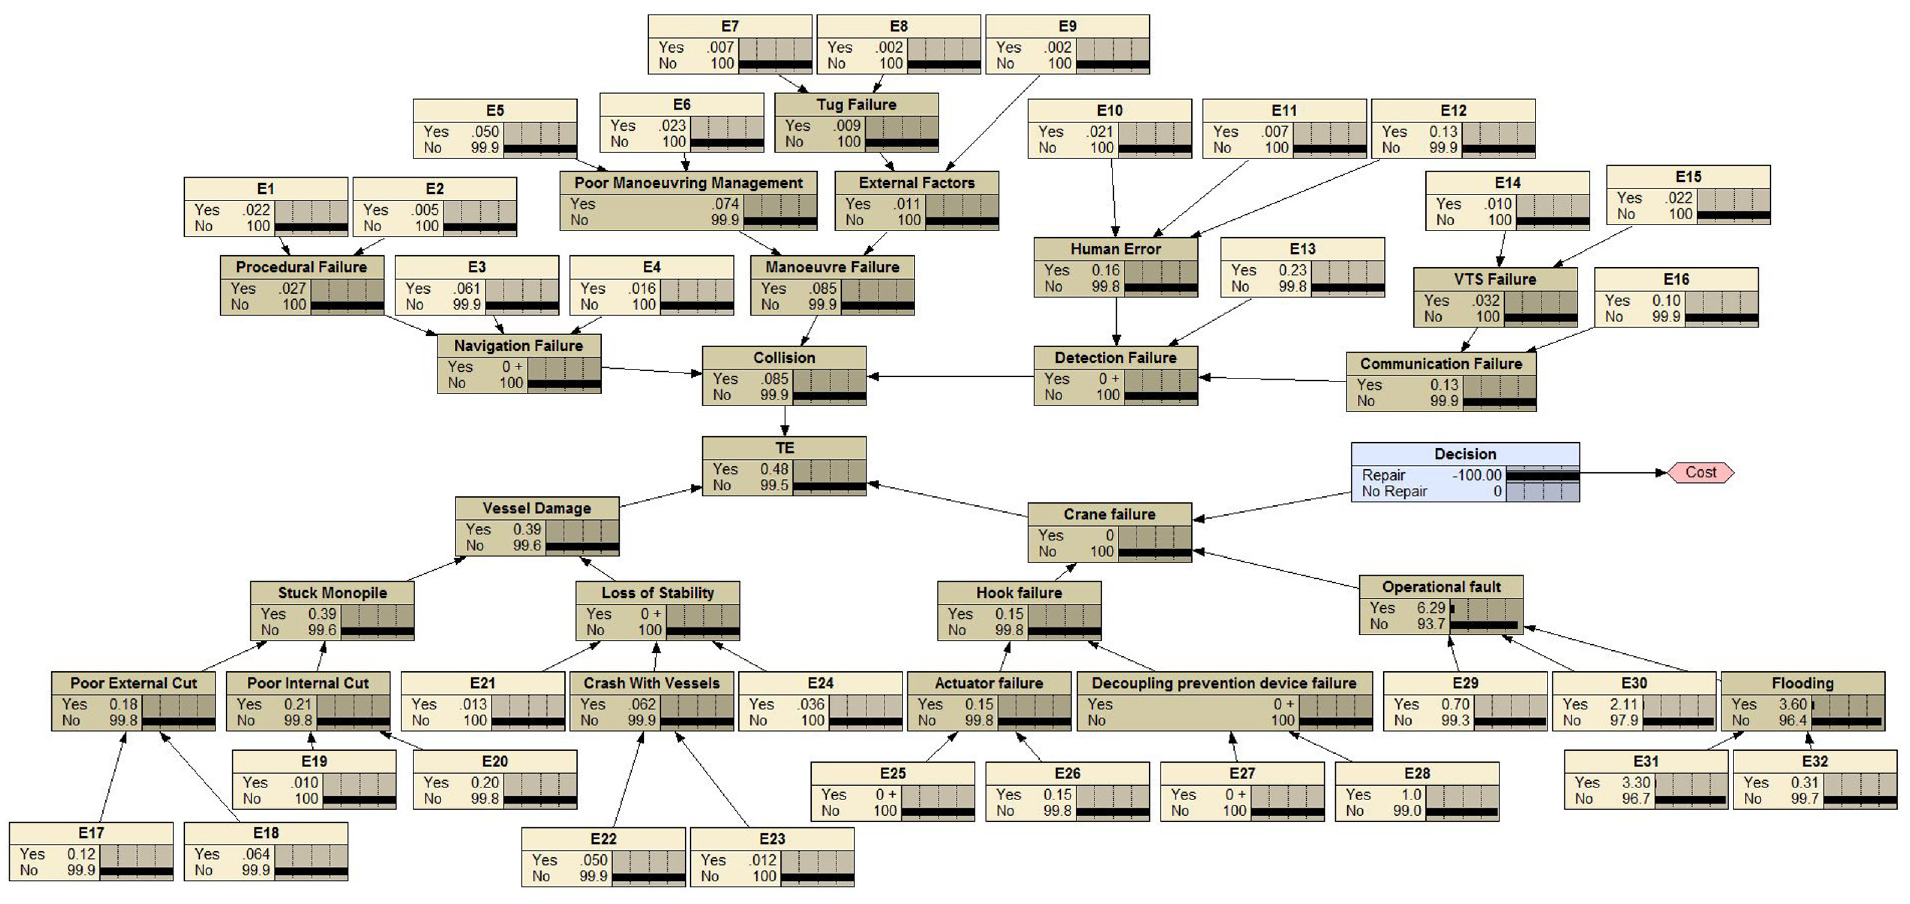
Influence diagram.
As seen in Figure 14, crane failure improved the likelihood of occurrence of suspended decommissioning operations the most when some repair activities on the crane were conducted, or failure causes were eliminated. The likelihood of occurrence of suspended decommissioning operations decreased the most from 0.0643 to 0.005. This conclusion is limited because depending on the severity of each related incident, the consequence would direct risk treatment also. Thus, we propose that estimating the utility of interventions is important; however, a full risk picture with consequence assessment will produce more robust results.
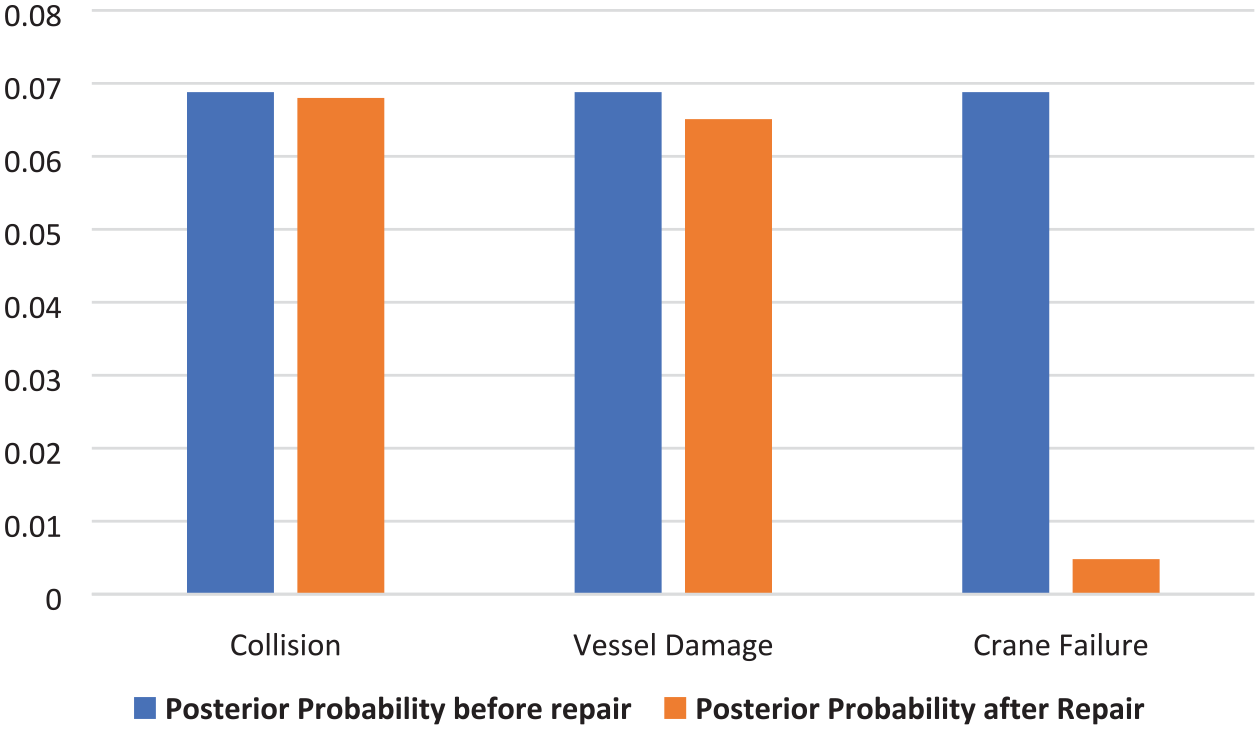
The impact of repair activities on likelihood of occurrence of incidents.
Expansion of BN: Introducing additional variables
Additional variables (nodes) may also be included in a BN analysis that was not included in the network initially when new data is collected. The conditional posterior probability of occurrence of suspended operations can be re-estimated based on the additional nodes. Also, if other operations in addition to lifting and loading operations are to be assessed, the BN model can be expanded to accommodate the additional nodes and model the relationship among all interdependent variables.
Risk management strategy
In order to mitigate the risks associated with OWF decommissioning, two solutions can be considered. One solution is to reduce the likelihood of occurrence of the undesirable events or hazards, and another option is to reduce consequences. This study focused on reducing the likelihood of occurrence of critical factors (incidents) that can lead to suspended decommissioning operations. These estimates will vary on a case-by-case basis because of the uncertainty involved in predicting the likelihood of occurrence of suspended operations. More so, the consequence of each incident will need to be considered on a case-by-case basis.
Conclusion and future works
Due to limited research that has been conducted on the risk management of offshore wind farm (OWF) decommissioning, there is a crucial need to better understand the associated safety hazards. To this aim, this paper presented for the first time a Bayesian Network (BN) model to identify the risks of potential critical incidents as well as the corresponding safety factors associated with OWF decommissioning. The BN model was applied to lifting and loading operations of the decommissioning process. The study identified the most critical hazards and analysed the relationship between them and critical risk-influencing factors in the decommissioning stage. The model was then used to determine how the potential critical risks may occur and what the impact of mitigation/control on the overall probability of occurrence of suspended decommissioning operations would be. The analysis results showed that BNs are more robust than conventional risk analysis techniques as they have the capacity to perform both diagnosis and prognosis assessments and help decision-makers update their knowledge when new information becomes available. With the BNs, the model becomes ‘smarter’ as the network system can be updated on a regular basis when necessary. The prior probabilities of each node are inputted into the conditional probability table (CPT) and then updated when new information is received. Thus, the risk assessment results can become more and more accurate over time.
The proposed BN model was applied to determine what in decommissioning lifting and loading operations can go wrong, how likely they are to occur, and what the most critical incidents and risk-influencing factors (RIFs) are. The most critical safety incidents were found to be related to inaccurate signalling, improper hooking and vibrational impact. The corresponding critical risk-influencing factors were identified as visibility (V), crew fatigue (Fcrew), number of personnel per operation (Ncrew), proper procedures (P), crane integrity (CI), number of WTs on the WF (NWT), number of lifts (NL) and equipment design (DEqt.). This proposes how asset managers and asset owners can benefit from adopting a more adaptive BN-based risk assessment method in OWF decommissioning projects. Beyond this, future works can explore the risks associated with other technical, environmental and regulatory aspects of OWF decommissioning. Additionally, BNs may be used to assess the reliability of safety barriers in OWF decommissioning operations.
Footnotes
Appendices
Updated prior probability and posterior probability (G+ Global Offshore Wind Health and Safety Organisation, 2020).
| Year | Update input probabilities | |||
|---|---|---|---|---|
| 2015 | 2016 | 2018 | 2019 | |
| Tug failure | 0 | 0 | 0 | 0.0602 |
| Navigation failure | 0.75 | 0.1111 | 0.4 | 0.355 |
| Human error | 0.25 | 0.4444 | 0.2 | 0.3871 |
| Posterior probability (TE) | 0.767 | 0.175 | 0.448 | 0.436 |
Declaration of conflicting interests
The author(s) declared no potential conflicts of interest with respect to the research, authorship, and/or publication of this article.
Funding
The author(s) received no financial support for the research, authorship, and/or publication of this article.