
Abstract
Background:
Total-contact orthosis (TCO) is one kind of foot orthosis (FO) that is used to adjust biomechanics in flexible flatfoot.
Objective:
To determine the effects of a TCO on the MLA moment, MLA deformation angle and lower limb biomechanics.
Study Design:
Cross-sectional study.
Methods:
Seven-flatfoot and thirteen-normal foot subjects were recruited by footprint and radiographs. The biomechanics of subjects with normal foot (NF), flatfoot with shoe only (FWOT) and flatfoot with TCO (FWT) were collected in a 3D motion analysis laboratory and force plates. The MLA and lower limb biomechanics in each condition during specific sub-phases of stance were analyzed.
Results:
The NF had larger MLA eversion moment after shod walking (p = 0.001). The FWT condition compared with the FWOT condition had a significantly larger peak MLA upward moment (p = 0.035) during pre-swing, larger peak knee external rotation angle (p = 0.040) during mid stance, smaller peak knee extension moment during terminal stance (p = 0.035) and a larger ground reaction force in the anterior-posterior direction during early stance (p < 0.05).
Conclusion:
Our study found positive effects from the customized TCOs which included an increased TCO angle that led to a decreased peak MLA moment in the frontal plane in flexible flatfoot subjects during walking.
Clinical relevance
Lower limb biomechanics is different from normal in subjects with flexible flatfoot. The design of a TCO affects MLA, ankle and knee biomechanics and may be used to clinically correct biomechanical changes in flexible flatfoot.
Background
Medial longitudinal arch (MLA) of foot has an important role in human locomotion to provide shock absorption, foot stability, and efficient propulsion.1,2 Flexible flatfoot is a condition of foot arch abnormality which affects the entire lower limb function.1,3 Previous studies found that subjects with flatfeet had impaired foot function from greater peak hindfoot eversion angle, ankle plantar flexion moment, peak MLA eversion moment, and smaller peak medial longitudinal arch deformation (MLAD) angle during barefoot walking when compared with normal foot (NF) subjects.4,5
To date, an absence of a universal foot deformity evaluation method has led to a variety of managements in flatfoot including foot orthoses (FO).3,6,7 The main principle of FO is to reduce the symptoms8,9 and adjust the subtalar joint alignment in the neutral position. In a study by Bok et al., 10 they used the resting calcaneal standing position to measure the reduction of calcaneal eversion in children with flexible flatfoot after regularly wearing customized FOs. Either with forefoot or hindfoot postings of FOs, the hindfoot eversion angle and eversion moment were reduced during shod walking.11–13
The MLA structure of flatfoot is a three-dimensional deformity. Besides the calcaneal eversion, the function of the MLA apex in flatfoot should be a concern as the flatfoot has MLA stabilizer deficiency.5,14,15 A study by Sheykhi-Dolagh et al. 16 showed that the arch height index (AHI) decreased as the rigidity of the FO increased and the arch height corrected only in the sagittal plane and during standing. At present, no study has reported the effects of FO on dynamic three-dimensional MLA assessments of the MLA moment and MLAD angle. Besides that, few studies showed a relationship between the FO characteristic and the MLA biomechanical changes. 9
This study aimed to determine the effects of a customized total-contact orthosis (TCO) on the MLA moment, MLAD angle, and lower limb biomechanics. Furthermore, the correlation between the TCO dimensions and the MLA biomechanics was evaluated.
Methods
Participants
A total of 20 females aged 18–50 years with a body mass index less than 25 were recruited from southern Thailand. As gender has an effect on the results of the biomechanics, only females were included in this study. 17 Subjects with neuro-musculoskeletal disease were excluded. The foot types of NF and flatfoot were classified with footprint arch index and foot radiographs (calcaneal inclination, calcaneal to first metatarsal, talonavicular coverage, and tarsal to the second metatarsal angles). 5 Only one foot of each participant was used for the analysis. Each participant signed the informed consent form and the Institutional Review Board approved this study (Ethics ID: 57-226-25-1).
Instrumentation
The kinematic and kinetic data were collected using a three-dimensional motion analysis system (Vicon Mx, Vicon Motion Systems Ltd, Oxford, UK). The system consisted of 10 cameras (MX T20) with a sampling frequency of 100 Hz and three force platforms (OR6, AMTI®, USA) with sampling rate at 1000 Hz.
Intervention
TCOs were customized for the flatfoot group by a certified prosthetist/orthotist (Figure 1(a)). The subtalar joint neutral position of each participant was cast using the foam box technique. The positive cast was modified to create the arch support with 5-mm arch filled and hindfoot posting to control motion. 18 Five-millimeter-thick ethylene vinyl acetate (EVA) and microcellular rubber (MCR) were used to fabricate the TCO. The dimensions of the TCO including the angle, thickness, and length were recorded. The angle was measured from the navicular tuberosity (NT) point relative to the floor. The thickness was measured at the NT point to determine the material thickness. Only flatfoot participants were given the TCO.
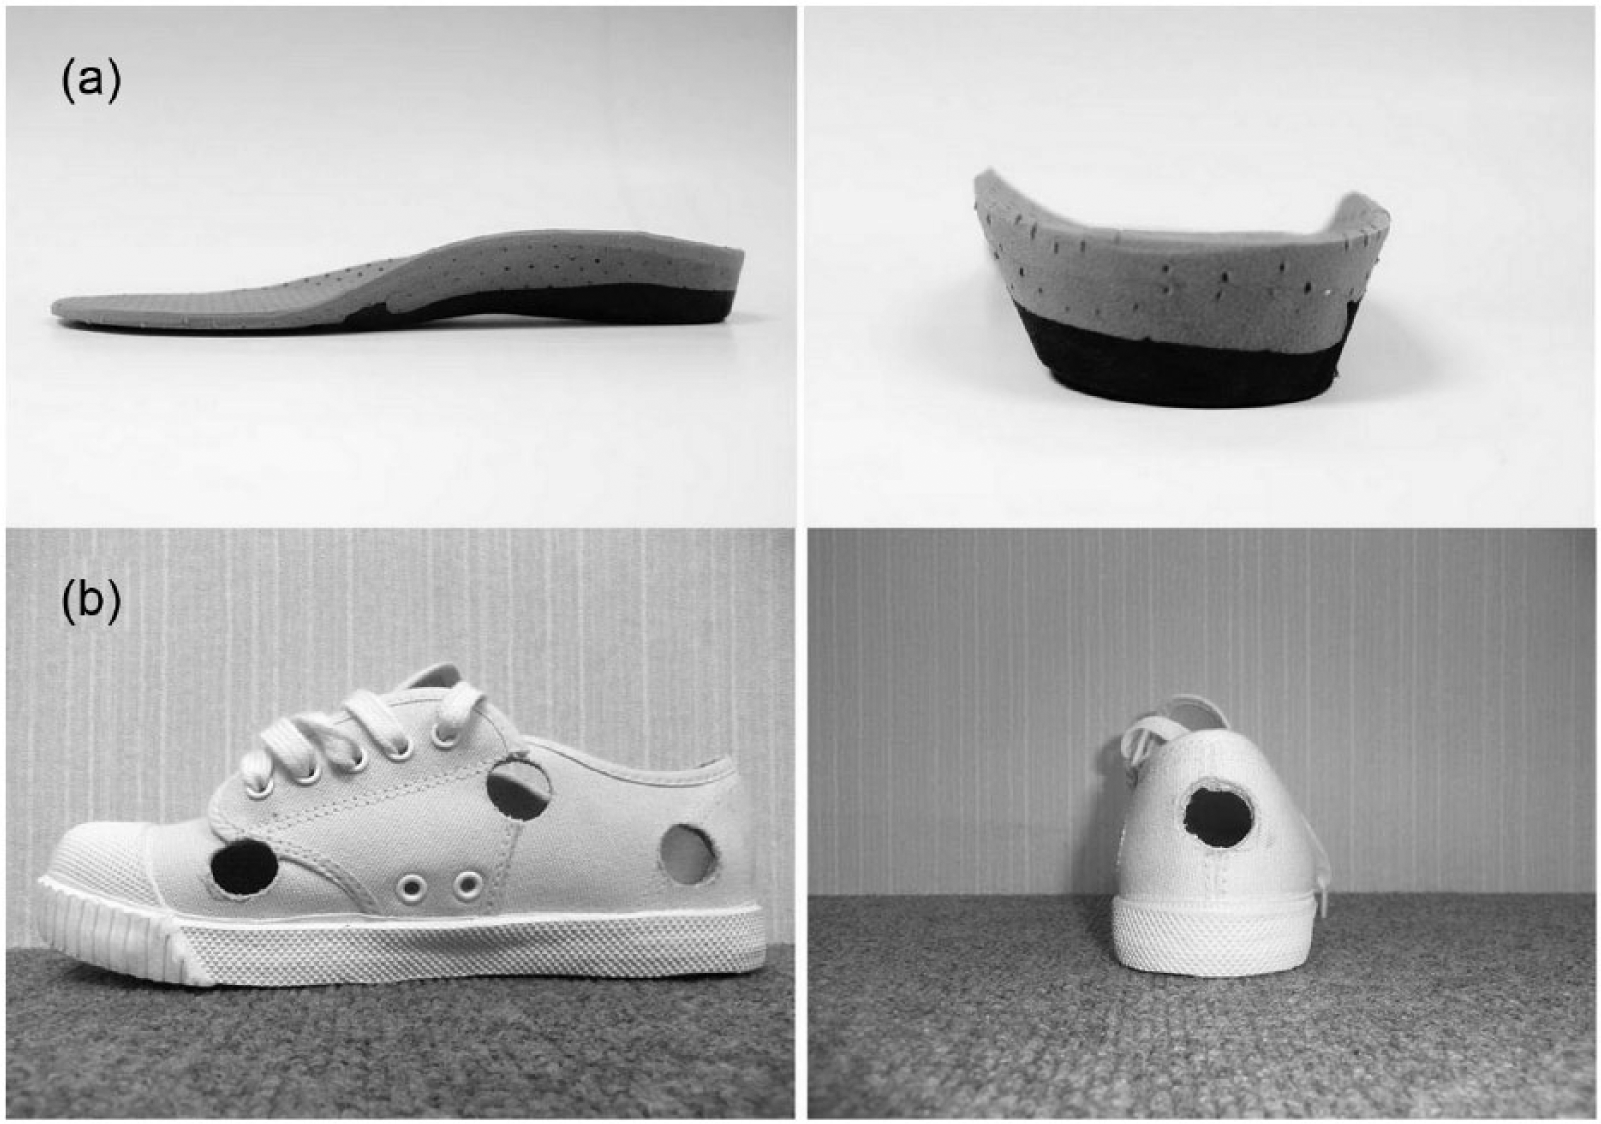
(a) Total-contact orthosis (TCO). Ethylene vinyl acetate (EVA) is an upper layer and the microcellular rubber (MCR) is a lower layer. (b) Flat shoe with toe-only rocker less than 10° (Nanyang©, Nanyang Industry Co. Ltd, Bangkok, Thailand). The holes of the shoe were made in order to visualize the reflective marker during data collection.
Procedure
The Plug-in Gait reflective markers were attached only at the lower limb parts. Additional markers to evaluate the MLA were attached to the participants’ limbs. The MLA markers consisted of the first metatarsal, NT, and medial aspect of the calcaneus (Figure 2(a)). 5 A single walking session was performed for each participant at a self-selected comfortable speed along a 10-m walkway. The static condition was captured through a relaxed standing position. During walking, all trials were collected while wearing flat shoes with toe-only rocker less than 10 degrees (Nanyang©, Nanyang Industry Co. Ltd, Bangkok, Thailand; Figure 1(b)). All participants walked with the same type of shoes. Three successful trials of only one foot on one force platform from barefoot condition and immediate conditions of shoe only and shoe with TCO were collected for the data analysis.
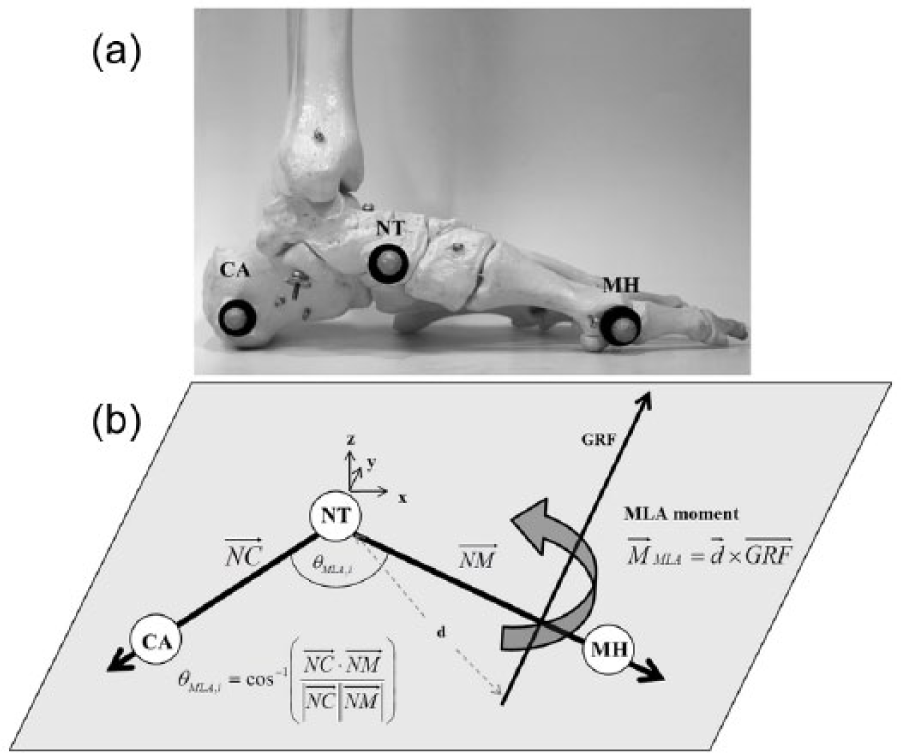
(a) Reflective marker positions of medial longitudinal arch (MLA) structure and (b) graphic demonstration of MLA moment and MLA angle calculations.
Data analysis
All kinematic and kinetic data were filtered using the Woltering filter with the predicted mean square error of 10. In each specific stance phase, the MLA biomechanics, MLA moment, and MLAD angle were analyzed (Figure 2(b)). 5 The MLA moment was the cross product of the ground reaction force (GRF) and the displacement of center of pressure (COP) from NT. The MLA moments acting about the y, x, and z axes were the moments in the sagittal, frontal, and transverse planes, respectively. The MLA angle was calculated from cosine function between vector of navicular-to-metatarsal bone (NM) and navicular-to-calcaneus bone (NC) and its deformation during stance from standing position represented as MLAD, which was used to determine the foot arch flexibility. The kinematics and kinetics of the ankle, knee, and hip joints were also measured. The positive directions of rotation in this study were defined as downward, dorsiflexion, inversion, adduction, and internal rotation. 5 This study evaluated the peak of angle, moment of the MLA, ankle, knee and hip joints, and the GRF and COP excursion in the medial-lateral direction. Each parameter between the groups was analyzed during 100% of the stance and also in each subphase: loading response (0%–16% of stance), mid stance (17%–48% of stance), terminal stance (49%–81% of stance), and pre-swing (82%–100% of stance).4,19 The data were evaluated for distribution using skewness and kurtosis tests and then compared between the groups using GraphPad Prism 5 software (GraphPad, San Diego, CA, USA) with unpaired t-test (for normal and flatfoot groups and normal and flatfoot with TCO groups) and paired t-test (for flatfoot without and with TCO conditions). The correlation between the TCO dimensions and the MLA biomechanical parameters was determined with Pearson’s correlation coefficient. The significance level was set at p-value < 0.05.
Results
There were significant differences in MLA moment during shod walking among the NF, flatfoot without TCO (FWOT), and flatfoot with TCO (FWT) conditions. The data are presented as the mean difference in each condition and standard deviation among the data (Figure 3). The demographic characteristics of the participants are presented in Table 1. None of the characteristics were significantly different between the groups.
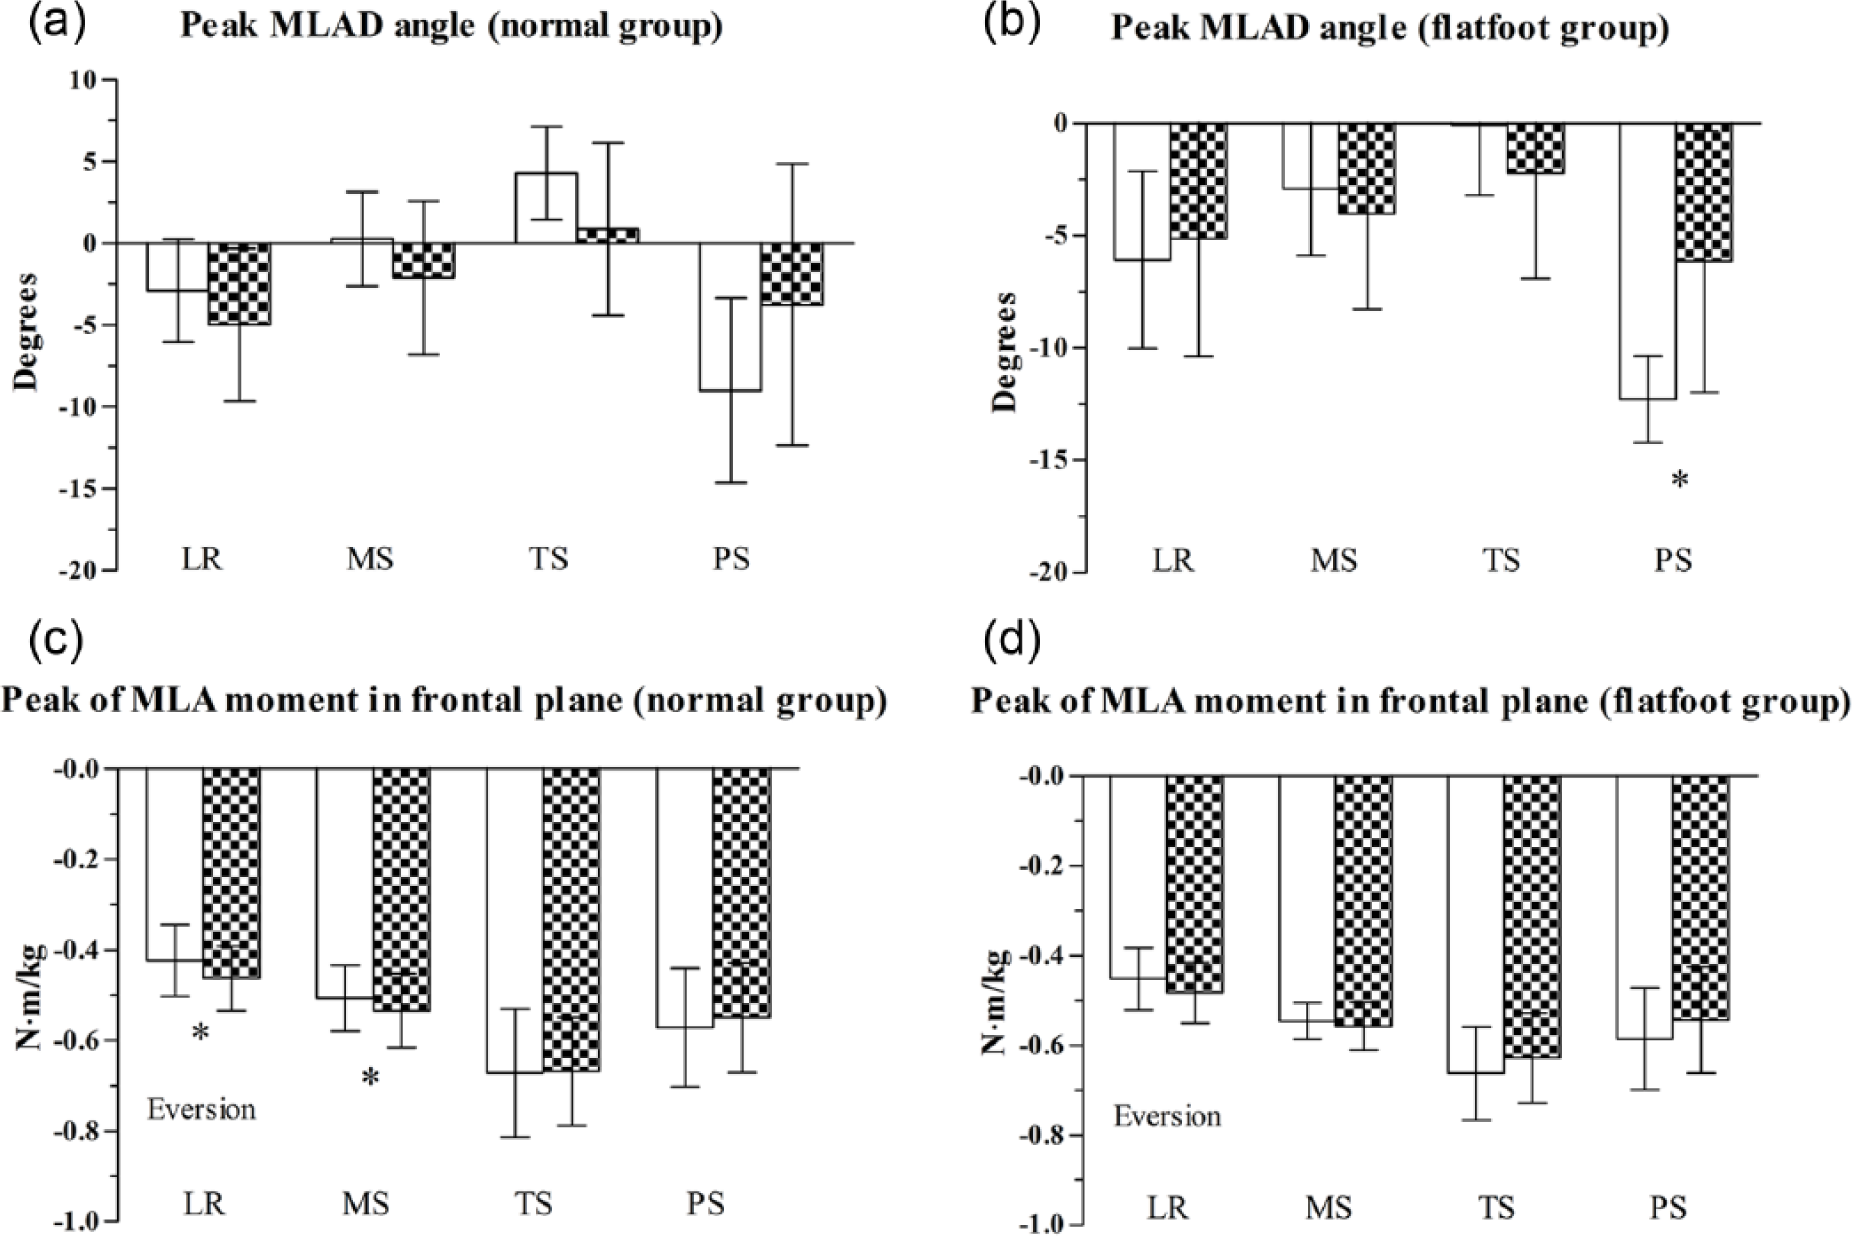
Flat shoe effects. Comparisons of peak MLAD angle (above) and MLA moment in frontal plane (below) of two foot types, normal (a and c) and flatfoot (b and d) groups, in each phase of gait between two conditions (barefoot condition in white bar and shod condition in chessboard bar): LR = loading response (0%–16% stance), MS = mid stance (17%–48% stance), TS = terminal stance (49%–81% stance), and PS = pre-swing (82%–100% stance). For the peak MLAD angle, the positive value represents the greater MLAD angle relative to the angle during standing, while the negative value represents the smaller MLAD angle.
Participants’ characteristics (mean ± SD).
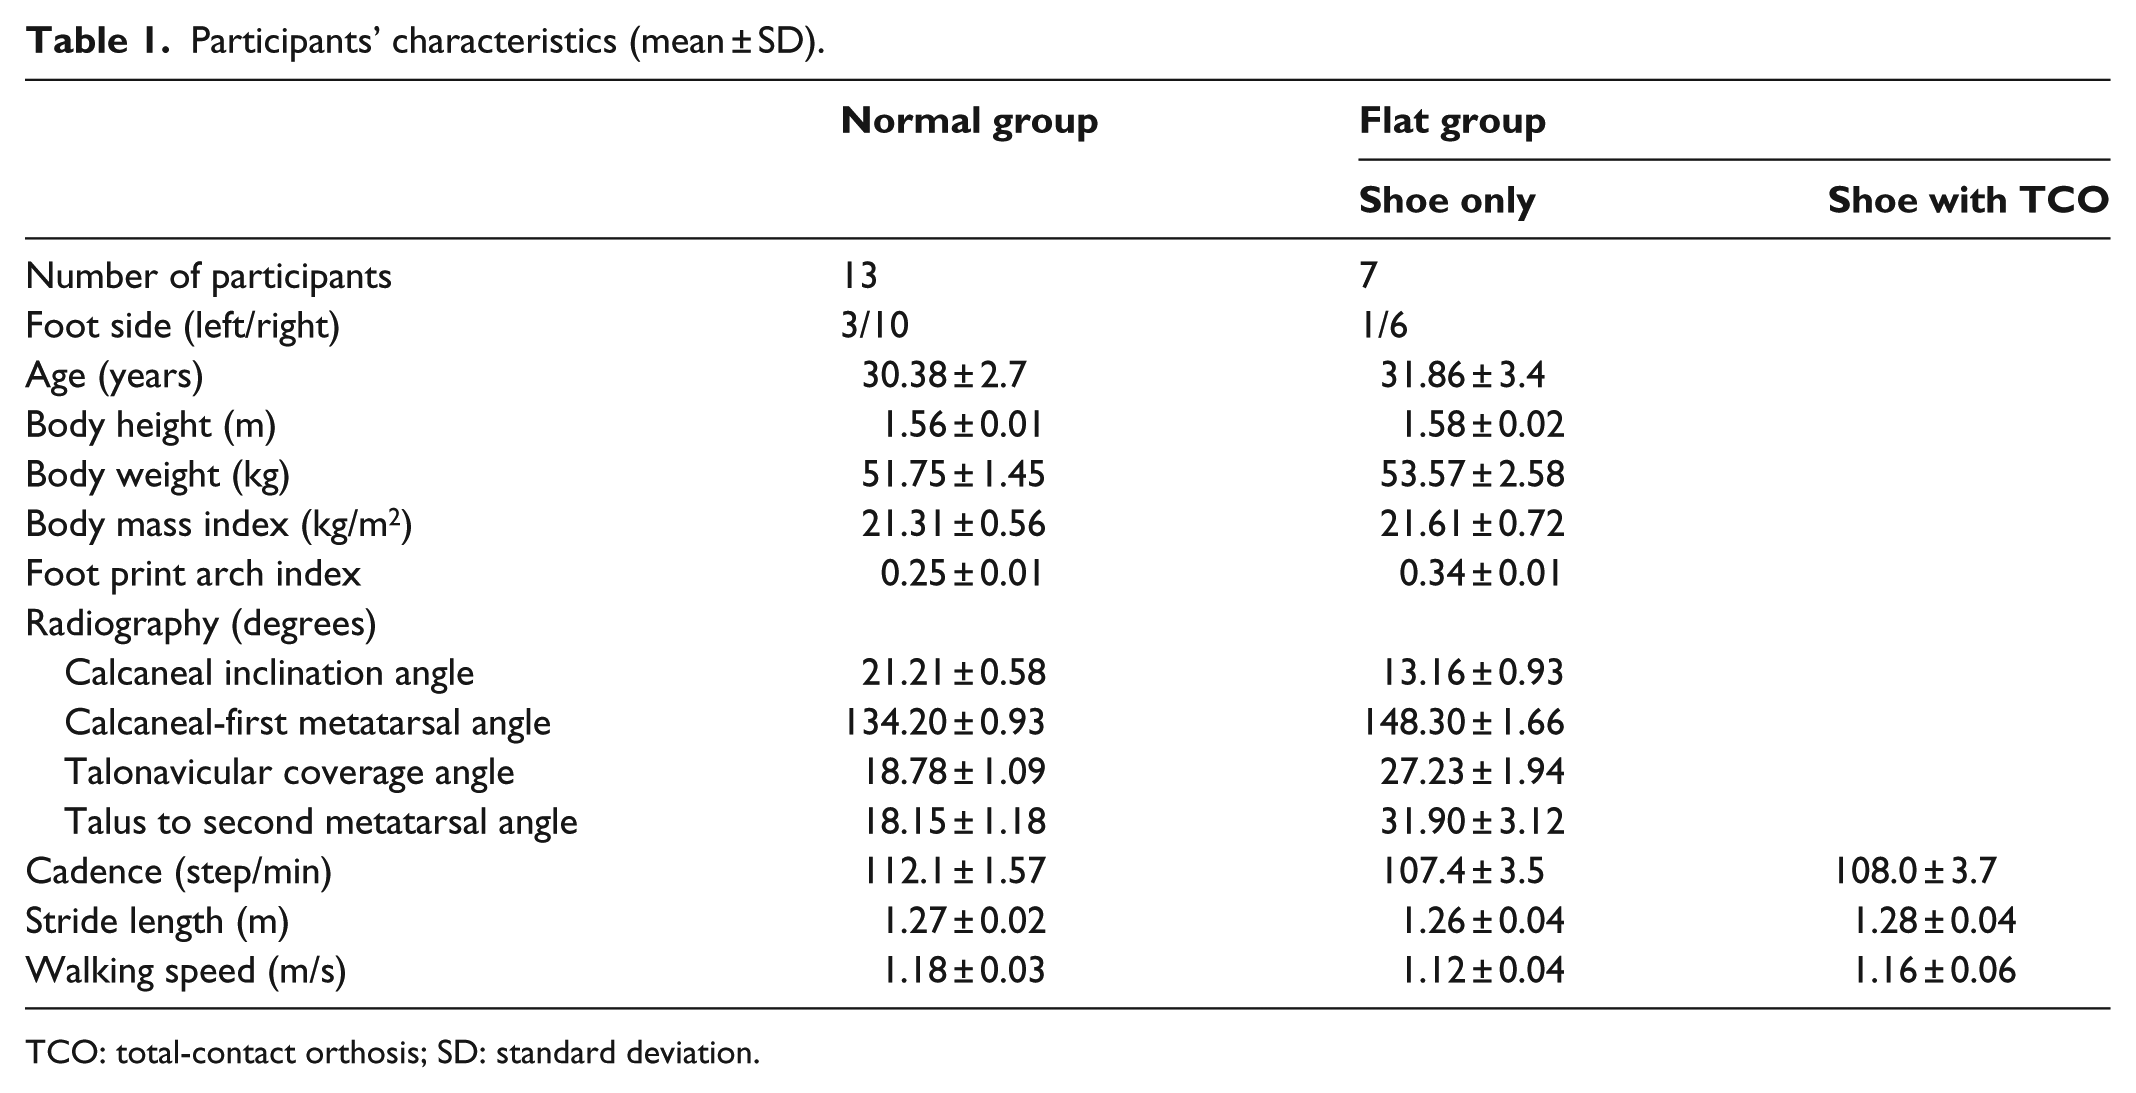
TCO: total-contact orthosis; SD: standard deviation.
Shod and barefoot walking
When the participants walked with shoes, the normal subjects had a larger peak MLA eversion moment during the mid stance (−0.535 ± 0.082 vs −0.507 ± 0.072, p = 0.001), while there was no significant difference in the flatfoot subjects (−0.557 ± 0.053 vs −0.546 ± 0.040, p = 0.608). During pre-swing, flatfoot subjects had a smaller peak MLAD angle (−6.14 ± 5.83 vs −12.28 ± 1.92 degrees, p = 0.048), while there was no significant difference in normal subjects (−3.75 ± 5.63 vs −9.00 ± 5.63 degrees, p = 0.106). The mean MLAD angle tended to show a decreased range of motion through stance after wearing a shoe.
FWOT and NF groups
The MLA eversion moment in the flatfoot group increased, but it was not significantly different from the normal group (mid stance: −0.557 ± 0.053 vs −0.535 ± 0.082 N m/kg, p = 0.523). The flatfoot group had a smaller peak MLA downward moment in the sagittal plane (loading response: 0.412 ± 0.064 vs 0.533 ± 0.132 N m/kg, p = 0.037; mid stance: −0.040 ± 0.494 vs 0.408 ± 0.245 N m/kg, p = 0.013) but had a larger peak MLA upward moment during pre-swing (−1.014 ± 0.122 vs −0.891 ± 0.112 N m/kg, p = 0.034) when compared with the NF group (Figure 4). In the frontal plane, the flatfoot group also had a larger peak ankle abduction moment during pre-swing (−0.057 ± 0.086 vs 0.046 ± 0.089 N m/kg, p = 0.022) when compared with the NF group (Figure 5).
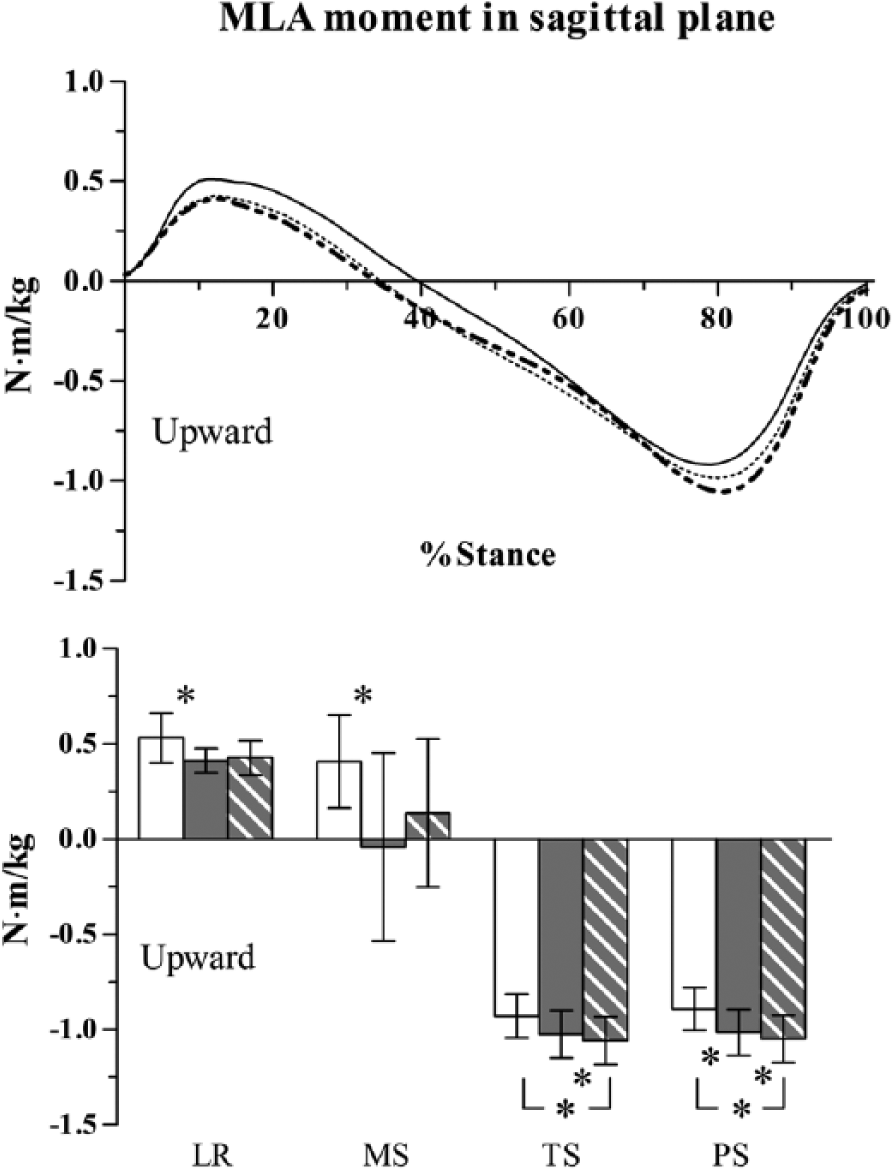
Medial longitudinal arch (MLA) moment in sagittal plane. (Above) The mean of MLA moment during stance between normal foot (solid line) and flatfoot with only shoe (dash line) and flatfoot with shoe and TCO (dash-dot-dot line) groups. (Below) Comparison of peak MLA moment in each phase of gait (normal group in white bar, flatfoot with only shoe group in gray bar, and flatfoot with shoe and TCO group in hatching bar): LR = loading response (0%–16% stance), MS = mid stance (17%–48% stance), TS = terminal stance (49%–81% stance), and PS = pre-swing (82%–100% stance).
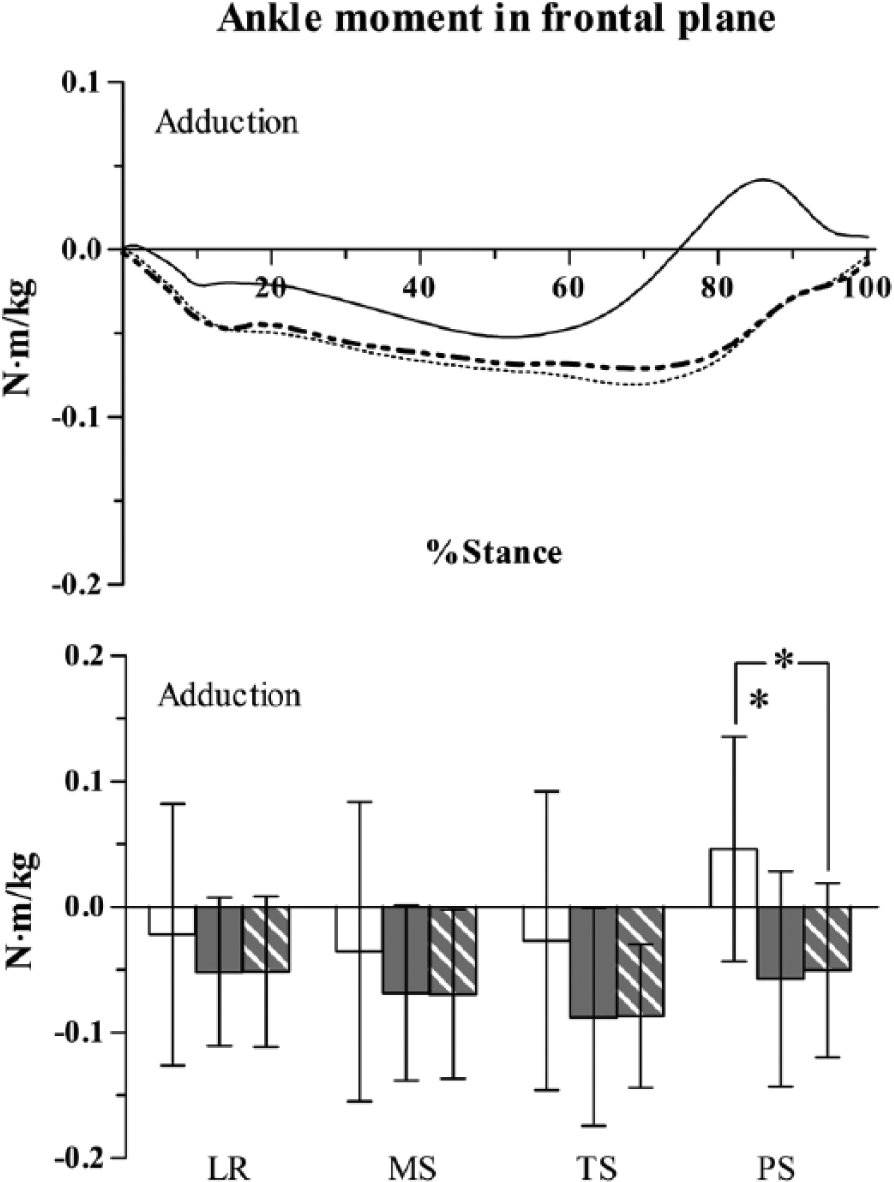
Ankle moment in frontal plane. (Above) The mean of ankle moment during stance between normal foot (solid line) and flatfoot with only shoe (dash line) and flatfoot with shoe and TCO (dash-dot-dot line) groups. (Below) Comparison of peak ankle moment in each phase of gait (normal group in white bar, flatfoot with only shoe group in gray bar, and flatfoot with shoe and TCO group in hatching bar): LR = loading response (0%–16% stance), MS = mid stance (17%–48% stance), TS = terminal stance (49%–81% stance), and PS = pre-swing (82%–100% stance).
FWT and FWOT conditions
When compared with the FWOT condition, the FWT condition had a larger peak MLAD angle during terminal stance and a smaller peak MLA eversion moment during mid stance, but there were no significant differences (MLAD angle: −4.89 ± 5.87 vs −2.22 ± 4.69 degrees, p = 0.353; MLA eversion moment: −0.565 ± 0.033 vs −0.557 ± 0.053 N m/kg, p = 0.649). The mean MLAD angle tended to show a decreased range of motion after walking with the TCO. The peak of the COP excursion and GRF in medial-lateral direction during mid stance increased after wearing the TCO with no significant differences (COP: 12.73 ± 4.19 vs 11.85 ± 3.86 mm, p = 0.653; GRF: 0.075 ± 0.014 vs 0.070 ± 0.018 of body weight, p = 0.437). However, the peak MLA moment in the sagittal plane during wearing the TCO had an increased upward moment (terminal: −1.058 ± 0.126 vs −1.024 ± 0.125 N m/kg, p = 0.018; pre-swing: −1.048 ± 0.125 vs −1.014 ± 0.122 N m/kg, p = 0.035; Figure 4). The FWT condition also had a larger peak posterior GRF (loading response: −0.204 ± 0.029 vs −0.183 ± 0.037 of body weight, p = 0.048; mid stance: −0.207 ± 0.029 vs −0.185 ± 0.033 of body weight, p = 0.036). For the ankle joint, the FWT condition had a smaller peak abduction moment during pre-swing, but the difference was not significant (−0.050 ± 0.069 vs −0.057 ± 0.089 N m/kg, p = 0.664). For the knee joint, the FWT condition had a larger knee external rotation angle during mid stance (−17.49 ± 20.97 vs −13.78 ± 19.60 degrees, p = 0.040) and a smaller knee extension moment during terminal stance (−0.263 ± 0.236 vs −0.292 ± 0.241 N m/kg, p = 0.035) when compared with the FWOT condition.
FWT and NF groups
During mid stance, the FWT group had a larger medial GRF (0.075 ± 0.014 vs 0.059 ± 0.016 of body weight, p = 0.044). However, during late stance, the FWT group had a larger MLAD angle (terminal stance: −4.89 ± 5.87 vs 0.88 ± 5.29 degrees, p = 0.038), a larger peak MLA upward moment (terminal stance: −1.058 ± 0.126 vs −0.928 ± 0.117 N m/kg, p = 0.033; pre-swing: 1.048 ± 0.125 vs −0.891 ± 0.112 N m/kg, p = 0.010; Figure 4), and a larger peak ankle abduction moment during pre-swing (−0.050 ± 0.069 vs 0.046 ± 0.089 N m/kg, p = 0.024) when compared with the NF group (Figure 5).
Correlation with TCO dimensions
The angle of the TCOs had a small to moderate significant correlation with the peak values of biomechanics in the frontal plane (MLA moment: r = −0.38, p = 0.045; ankle moment: r = −0.65, p < 0.001; ankle angle: r = −0.76, p < 0.001). Meanwhile, the peak of the COP excursion and GRF in the medial-lateral direction had a mild correlation with the angle of the TCOs which had no significance (COP: r = 0.18, p = 0.373; GRF: r = 0.20, p = 0.303). There were no significant correlations between the TCO thicknesses and lengths or the peak values of the MLAD angle and MLA moment.
Discussion
According to the results, there were significant differences among the NF, FWOT, and FWT conditions. The peak MLA eversion moment in the NF group and the peak MLAD angle in the FWOT group were influenced by the shoe. However, the TCO had significant effects on the MLA biomechanics.
Flatfoot biomechanical changes after walking with shoes
Compared with the NF group, the FWOT condition showed a significant increase in the peak MLA upward moment during stance due to the greater degree of first metatarsal dorsiflexion angle in flatfoot during stance. 20 For the frontal plane deformity, the ankle moment in the FWOT condition had a significantly larger peak abduction moment during pre-swing, which was consistent with the study by Hunt and Smith. 21
The peak MLA eversion moment and peak MLAD angle in the FWOT condition tended to have the increased values as reported in the previous study. 5 In this study, the non-significant differences of peak MLA eversion moment and MLAD angle could be the result of the shoe. Lin et al. 22 reported the windlass function limitation, as found in flatfoot subjects, through the shoe compared with the barefoot condition. The shoe limited the first metatarsal dorsiflexion especially during pre-swing. The flatfoot subjects in our study had a significant difference in the MLAD angle during pre-swing during shod walking when compared with barefoot walking. We also found the shoe caused a decrease in the magnitude of the MLAD angle, which represents a decrease in MLA flexibility. Besides that, there was a significant increase in the MLA eversion moment in the NF group during shod walking compared with the barefoot condition. This led to a non-significant comparison with the FWOT group.
The effect of customized TCO
The customized TCO in this study was categorized as a semi-functional FO. To evaluate the effect of the TCO on the MLA structure, the angle of the TCO and thickness measured in this study were the TCO parts which contact with the MLA structure. As expected, the correlation results showed that the TCO angle was related to the MLA moment and ankle motion in the frontal plane, whereas the thickness and length of the TCO had no significant correlation. In order to do a quantitative TCO modification, the angle of the TCO could be an adjustable parameter. Concepts of quantitative FO geometric modification were proposed in previous studies.11,12,23 Most of the previous studies determined mainly the effects on hindfoot motion. Hurd et al. 12 showed that a 4-degree forefoot posting of a prefabricated FO reduced the hindfoot eversion moment even though it did not correct the hindfoot of the flatfoot secondary to subjects with forefoot varus. They suspected it was the result of the COP and GRF alteration but there was no report of the COP and GRF relationship with FO in their study. In order to control the subtalar joint motion in subtalar abnormal pronation subjects, Johanson et al. 11 set the forefoot and hindfoot posting as the proportion of height and angle. They found that the hindfoot posting was only able to reduce significantly the two-dimensional maximum calcaneus motion relative to calf in the frontal plane during walking. Unlike this study, the device did not have the exact geometry of hindfoot or forefoot postings. Telfer et al. 23 evaluated the effect of hindfoot posting angle variation on the hindfoot motion. They found that a greater medial angle of the posting led to more reductions of hindfoot and ankle eversion motion. But they did not find the optimal posting angle to control the foot and ankle motion to be normal.
In this study, an increase in the MLAD angle and a decrease in the mean MLA angle in the FWT condition suggested that the customized TCO was able to increase MLA flexibility 24 but it reduced the windlass effect. 22 This was related to an increase in the MLA upward moment. Sheykhi-Dolagh et al. 16 found a greater reduction of AHI after use of a more rigid FO. In contrast with this study, their AHI was only a static measurement.
In this study, the COP excursion and GRF in the medial-lateral direction, the part of MLA eversion moment calculation, did not increase significantly in the flatfoot subjects after walking with the TCO. Despite that, the COP and pathological force are related to the flatfoot biomechanical correction mechanism of FOs. 20 The pathological pronation force about the subtalar joint axis can be converted to a supination force by shifting the COP. The effects of COP and GRF in flatfoot subjects in Sloss’ study 25 were evaluated during walking after wearing an orthotic shell with a Kirby skive. He found a lateral displacement of the COP and a smaller magnitude of the vertical GRF during early stance, while there was medial COP displacement and a larger magnitude of vertical GRF during late stance. He also reported the high variation of COP that may have caused a non-significant correlation result with the TCO in this study.
Moreover, the TCO also prevented slipping during weight acceptance by increasing the breaking force or a posterior GRF and assisted in ankle motion control as the ankle abduction moment was reduced. 12 For a knee joint, the knee external rotation angle increased during mid stance as the TCO controlled tibial rotation. 26 The TCO also might promote body progression during late stance by decreasing the knee extension moment during terminal stance. 2
TCO effectiveness
Our results showed that the TCO did not successfully correct the biomechanical parameters into a range of NF values. However, there were some significant differences from the normal group in peak values of MLAD angle, MLA upward moment, medial GRF, and ankle eversion moment during specific subphases of stance.
Limitations and suggestions
In this study, the sample size of flatfoot subjects was small. To confirm the results of this study, the number of subjects should be increased in both foot type groups. Since this study pointed out the effects of the shoe, a biomechanical evaluation of the MLA should be related to the shoe characteristics. Furthermore, the variation of COP should be studied to evaluate the effect of a TCO in a future study.
Conclusion
Flatfoot subjects had different MLA biomechanics from NF subjects. The customized TCO influenced some of the MLA biomechanical changes, but they were not equal to the normal MLA biomechanics. Despite the MLA biomechanical effect, this study showed that the TCO had the potential to adjust the ankle and knee biomechanics. The amount of corrective angle of the TCO can be considered as an important adjustable parameter for the MLA biomechanical correction in flatfoot subjects during walking.
Footnotes
Author contribution
All authors contributed equally in the preparation of this manuscript.
Declaration of conflicting interests
The author(s) declared no potential conflicts of interest with respect to the research, authorship, and/or publication of this article.
Funding
The author(s) disclosed receipt of the following financial support for the research, authorship, and/or publication of this article: This work was supported by Prince of Songkla University, Faculty of Medicine (Grant Number: 57-226-25-1).