
Abstract
Background:
The L Test is a reliable/valid clinical evaluation of mobility that measures walking speed in seconds. It can be used with individuals with lower limb amputation. Responsiveness of the L Test is not yet determined.
Objectives:
The purpose of this pilot study was to determine how well the L Test identified individuals with a lower limb amputation who have/have not undergone a minimal clinically important difference.
Study design:
Prospective follow-up study.
Methods:
In total, 33 individuals with lower limb amputation, deemed to require a major intervention, were recruited consecutively from a follow-up clinic. Participants completed the L Test at baseline and follow-up. A Global Rating Change scale was also completed at follow-up.
Results:
The participants had a mean age ± standard deviation of 60 ± 13.0 years, and 81.8% had a transtibial amputation. The mean ± standard deviation for the L Test change scores was 6.0 ± 13.9. The area under the curve was 0.67, and the minimal clinically important difference was 4.5 s.
Conclusions:
The L Test identified individuals as having an important clinical change. Results must be interpreted with caution, as the accuracy, based on the Global Rating Change scale, is low. Further inquiry into the L Test is encouraged.
Clinical relevance
The L Test can guide the clinical management of individuals with lower limb amputation. Results from this pilot study indicate that individuals with a lower limb amputation who improve by at least 4.5 s on the L Test after an intervention have likely undergone an important change. This result must be interpreted with caution given that the ability of the L Test to correctly identify individuals, who have and have not undergone an important change, using the Global Rating Change scale as the gold standard, is limited because this is a pilot study. It is plausible that the precision of the cut-point threshold could increase or decrease given a larger sample or when using a different method of identifying important clinical change.
Background
Lower limb amputation (LLA) is a common chronic health condition ranging from 3.6 to 68.4 per 100,000 in the total population worldwide. 1 LLA can result in a variety of physical 2 and psychological deficits, 3 and maximizing function is a primary rehabilitation goal. Central to improving function is the measurement and interpretation of functional changes that guide clinical management.
There is a lack of consensus regarding what outcome indicates successful lower limb rehabilitation and what measure should be used to assess the selected outcome.4,5 However, mobility has been identified as the most frequently represented International Classification of Functioning, Disability, and Health (ICF) concept in the published literature on outcome measures for the management of LLA. 6 Condie et al. 4 recommended that a timed walking test is appropriate for individuals with LLA. Deathe et al. 7 suggested that the L Test is a suitable measure of ambulation for the older vascular amputee population to assess change following intervention.
The L Test is a clinical evaluation of basic mobility that measures walking speed in seconds. 8 Walking ability, as measured by the L Test, has been found to be a significant predictor of social activity 3 months post prosthetic inpatient rehabilitation. 9 It is not yet known whether the L Test is a responsive measure. 7
Responsiveness is the ability of an outcome measure to accurately detect change when it has occurred. 10 One type of responsiveness is the minimal clinically important difference (MCID). Jaeschke et al. 11 defined the MCID as the smallest difference in score perceived as beneficial by the patient that would constitute a change in clinical management. More recently, MCID has been defined as the smallest difference in score considered to be important. 12 Quantifying a change in functional status after a rehabilitation intervention in relation to a MCID is important for clinically interpreting the outcome measure. 13 Furthermore, determining the MCID using a patient, anchor-based method provides an estimate based on changes that are considered clinically meaningful to the patient.
The purpose of this pilot study was to determine how well the L Test correctly identified individuals with a LLA who have and have not undergone a MCID after intervention. Our specific objectives were the following: (1) to compare L Test change scores to Global Rating of Change (GRC) scores; (2) to quantify how often the L Test will correctly identify individuals with LLA who have and have not undergone an important change, from a patient perspective; and (3) to estimate the MCID or magnitude of L Test change score that best classified individuals as those who had and had not achieved an important difference, from a patient perspective. We hypothesized that (1) individuals who rated themselves as having greater GRC scores would have greater change scores on the L Test and that (2) the L Test would correctly identify individuals who have and have not undergone an important change 80% of the time.
Methods
Study design and participant recruitment
This pilot study used a prospective follow-up design. We studied 33 individuals with a unilateral LLA using consecutive sampling. Participants were recruited from the South Western Ontario Amputee Program outpatient services. Individuals identified by the physiatrist as requiring a major intervention (e.g. a new prosthesis socket or referral for additional therapy) at their yearly follow-up visit to the program were consecutively sampled. To be included, participants had to be older than 19 years of age, have a unilateral transtibial (TT), transfemoral (TF), or through-knee amputation, and be using their prosthesis safely with respect to prosthetic fit and physiologic endurance (as assessed through consensus by the amputee team). Individuals who did not wear their prosthetic limb three times a week on a regular basis and/or they were unable to speak or read English or follow verbal instructions were excluded from the study. Ethical approval was obtained by the local research ethics board. All investigations were in accordance with the protocol, followed the ethical and humane principals for research, and written informed consent from participants for participation and publication was attained.
Procedure
Participants began the pilot study directly after their clinic appointment. First, a demographic questionnaire was completed to collect socio-demographic variables (e.g. age, gender) and diagnostic-related variables (e.g. amputation level, date of amputation, prosthesis use). Prior to objective testing, prosthetic fit was assessed and corrected if necessary to ensure the fit was optimized and the participant was able to put forth his/her best effort. The L Test was completed next. For this test, participants were permitted to use a walking aid and the device was documented. Each participant was provided with a verbal description and demonstration of the L Test and allowed one practice run to familiarize him/herself with the test as per the standardized protocol. At the participant’s follow-up clinic appointment, the L Test was completed again along with a GRC scale. The interval between baseline and follow-up represented the varied length of the different interventions that participants underwent.
Outcome measures
L Test of functional mobility
The L Test is a modified version of the Timed Up & Go (TUG) Test where the time it takes an individual to rise from an armless chair, walk 3 m, perform a right-angle turn, and continue walking 7 m before turning around 180° and walking back along the same path and sitting down is recorded in seconds. Individuals cover 20 m, perform four turns and two transfers. 8 The distance covered by the L Test is three times that of the TUG and requires the individual to turn in both directions, modifications intended to overcome ceiling effects associated with the TUG. The L Test has demonstrated excellent reliability and validity in a population of individuals with LLA. 8
GRC scale
GRC was assessed using a three-step process. Participants were asked, “Since we last saw you, have you experienced any change in your ability to get up and walk with your prosthesis?” If the participant answered “no,” the GRC was complete. If the participant answered “yes,” he or she was then asked, “Has your change in ability to get up and walk with your prosthesis improved or gotten worse?” If improved, he or she was asked, “How much better are you at getting up and walking with your prosthesis?” using a 7-point Likert scale, from 0 = almost the same to 6 = a very great deal better. If participants indicated that they had gotten worse, they were asked, “How much worse are you at getting up and walking with your prosthesis?” using the same scale but from the “worse” perspective.
Data analyses
Summary statistics (means, standard deviations (SDs), and percentages) were derived. Normal distribution of the data was assessed using visual inspection of histograms and the Kolmogorov–Smirnov test.
To address hypothesis 1, that individuals who rated themselves as having greater GRC scores would have greater change scores on the L Test, we compared L Test change scores to GRC scores by generating a scatterplot of initial and follow-up L Test scores by global rating. A GRC cut-off point of ≥5 (a great deal better) was used in accordance with previous research. 14 To further explore the relationship between these variables, Spearman’s correlation coefficients were calculated between initial L Test and L Test change scores, follow-up L Test and L Test change scores, initial L Test and GRC scores, follow-up L Test and GRC scores, and L Test change with the GRC scores. As recommended by Turner et al., 15 the following criteria must be met in order to ensure that the GRC is a valid assessment of the construct measured by the L Test: the correlation of the GRC with the difference between follow-up and baseline measures should be more than 0.5 in absolute value; there should be a negative correlation between the GRC and the baseline instrument score; there should be a positive correlation between the GRC and the follow-up instrument score; and the correlation of the GRC with the difference between follow-up and baseline score should be at least 0.2 greater (in absolute terms) than the correlations with either the baseline or the follow-up test score.
To address hypothesis 2, that the L Test would correctly identify individuals who have and have not undergone an important change 80% of the time, we performed a receiver operating characteristic (ROC) curve analysis. A global rating score of ≥5 was used to define participants who improved an important amount. The ROC curve was produced by plotting sensitivity (y-axis) against 1-specificity (x-axis). In this context, sensitivity referred to the number of participants correctly identified by the L Test as having undergone an important change divided by all participants who perceived that they underwent an important change, according to the GRC. Specificity referred to the number of participants who were correctly identified by the L Test as not undergoing an important change divided by all participants who perceived that they did not undergo an important change, according to the GRC. To quantify how often the L Test correctly identified individuals who have and have not undergone an important change, the area under the curve (AUC) was calculated. Results were interpreted using the following criteria: an AUC of >0.9 = high accuracy; 0.7–0.9 = moderate accuracy; 0.5–0.7 = low accuracy; and ≤0.5 = chance result. 16
The MCID was defined as the L Test change score that best distinguished between those participants who had and had not achieved an important change, according to their own perception, using the GRC as the reference standard measure of change. The MCID was identified using the coordinate closest to the upper left hand corner of the ROC curve and its corresponding sensitivity and specificity values. All analyses were conducted using SPSS 16.0.
Results
The participants’ socio-demographic and diagnostic-related characteristics are presented in Table 1. The sample of 33 individuals was mostly male (84.8%), had a mean age ± SD of 60 ± 13.0 years and a mean time since amputation of 5.5 ± 8.7 years. The level of amputation was TT for the majority of the sample (81.8%) and the cause of amputation was vascular in 57.6% of the cases. Most of the sample used either one cane or crutch or no mobility aid (75.8%). The most commonly identified problem was a poor prosthetic fit (33.3%), and the most common intervention was provision of a new socket or new prosthesis (63.6%).
Participant socio-demographic and diagnostic-related characteristics (n = 33).
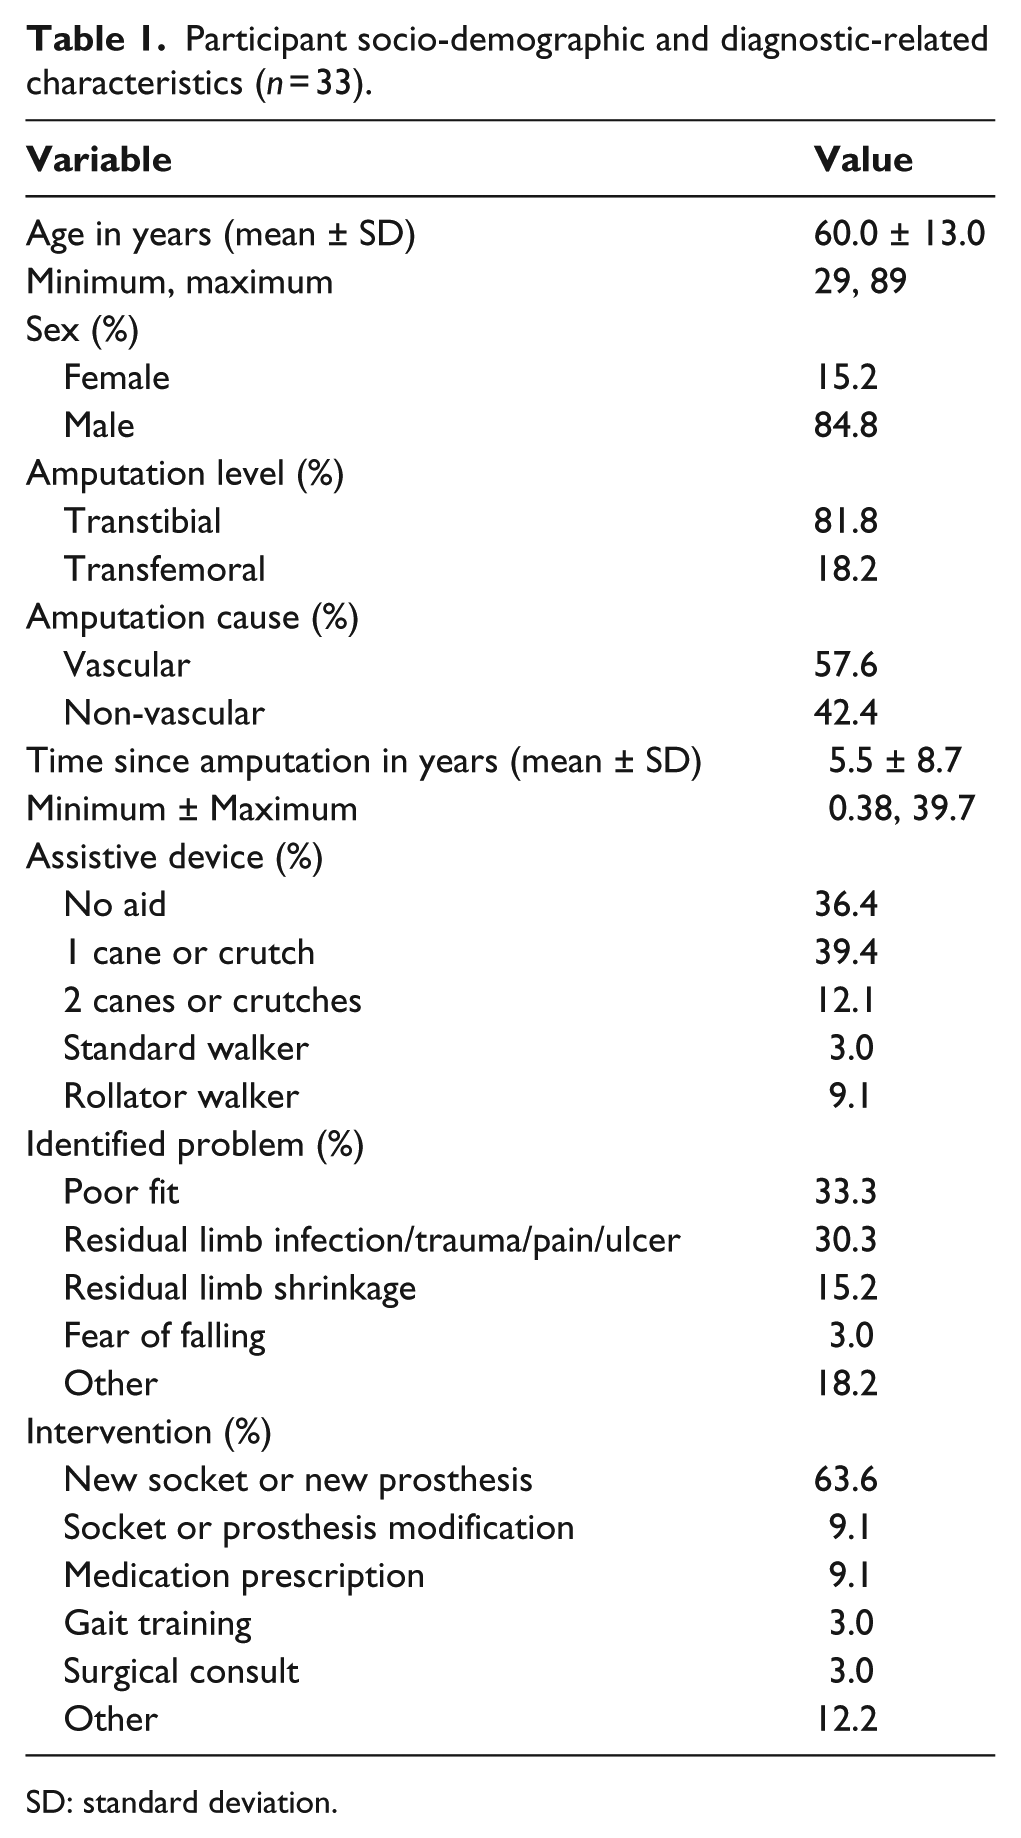
SD: standard deviation.
L Test scores compared to GRC (hypothesis 1)
The time frame between initial and follow-up clinic appointments ranged from 1.5 to 11.5 months. L Test baseline and L Test follow-up scores demonstrated positively skewed distributions, which were confirmed by Kolmogorov–Smirnov tests (p < 0.05). The mean ± SD and range for the L Test baseline, L Test follow-up, and L Test change scores are presented in Table 2 for the entire sample and for subgroups of participants who between baseline and follow-up reported that their ability to get up and walk with their prosthesis had deteriorated, had improved or did not change, had undergone an important change, and had not undergone an important change. Of the sample, 82% reported that a change in their ability to get up and walk with their prosthesis had occurred post intervention. Of those who changed, 85.2% improved and 14.8% deteriorated. Using a global rating cut-off point of ≥5, 24.2% of the entire sample was classified as changing an important amount. Given the small sample size of participants who deemed their change as deteriorating (n = 4), data from these individuals were eliminated from further analysis and subsequent estimates apply only to assessing no change or improvement. Figure 1 illustrates that participants who did and did not change an important amount had baseline L Test scores that were distributed from fast to slow scores. Table 3 shows Spearman’s correlations among baseline L Test scores, follow-up L Test scores, and L Test change scores, with the GRC. The correlation between the L Test change score and the GRC score was 0.27 (p = 0.163).
Descriptive statistics of the L Test for different change situations.
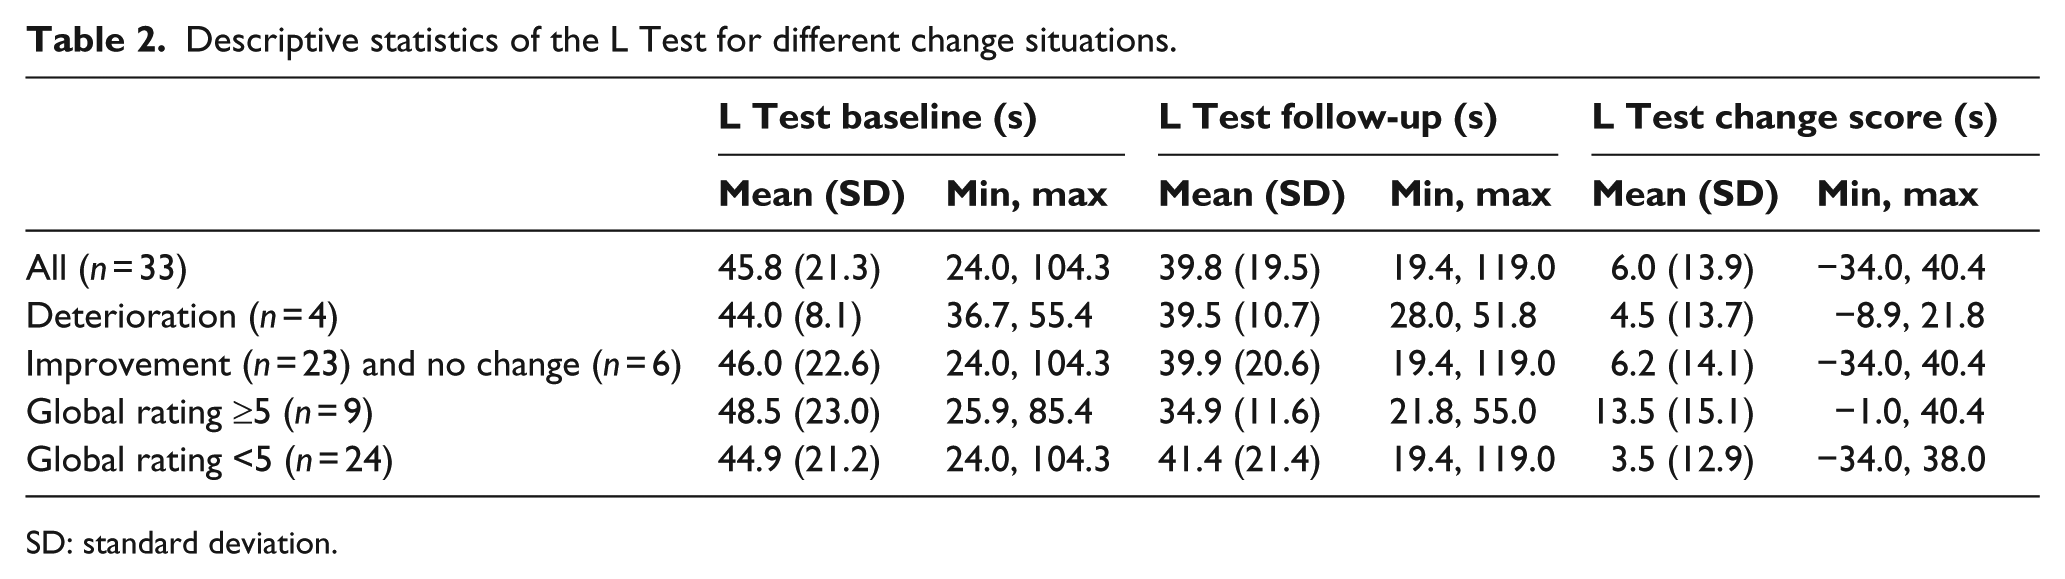
SD: standard deviation.
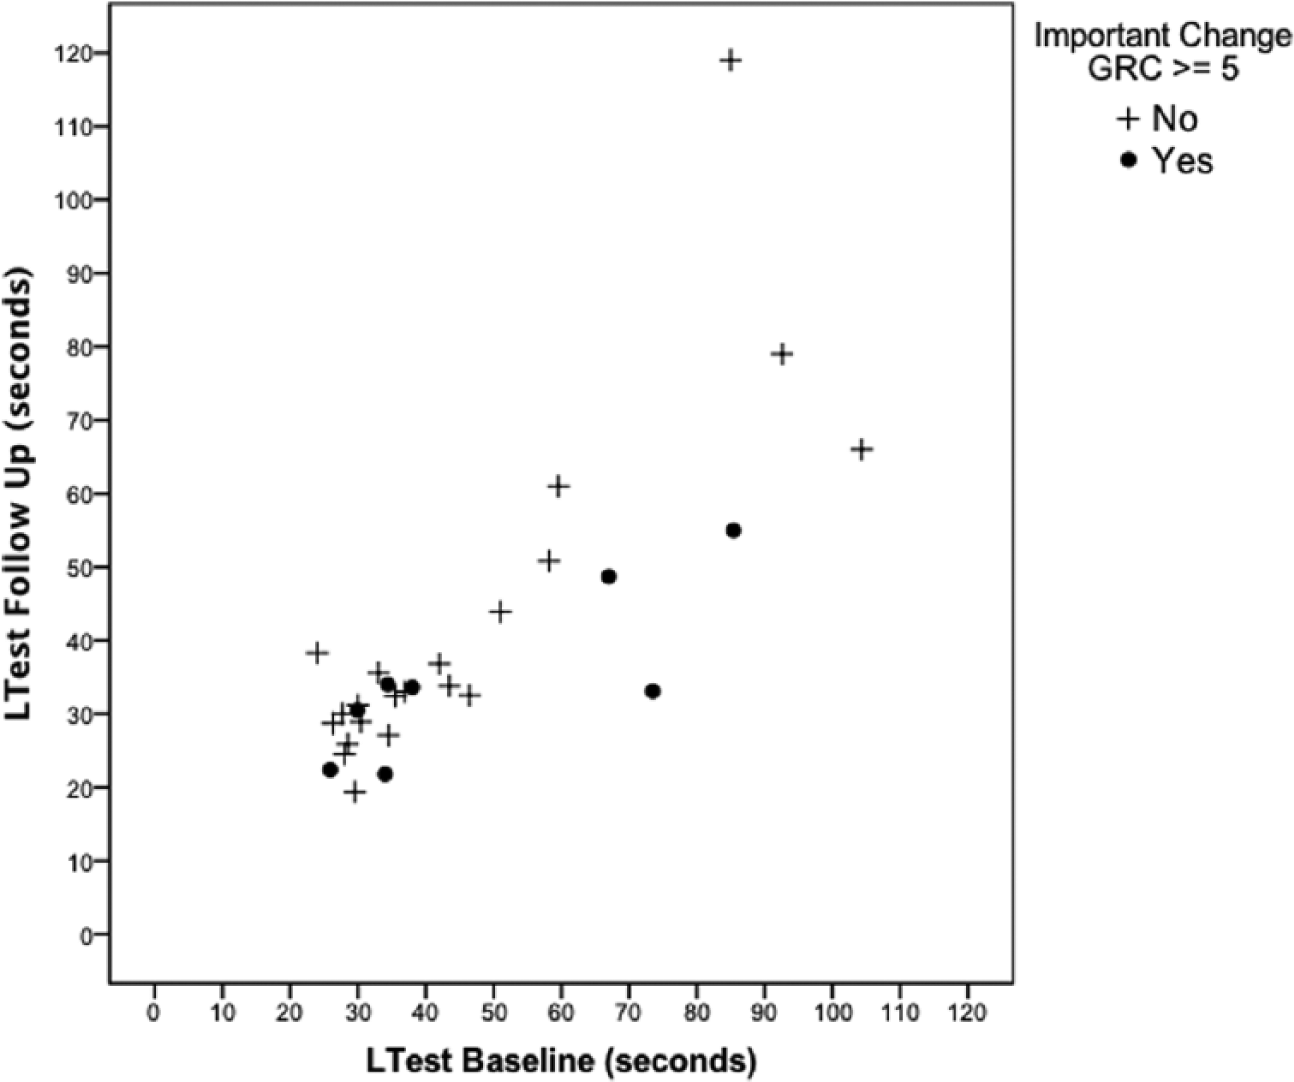
Scatterplot of the distribution of L Test baseline versus follow-up scores by important change according to global rating of perceived change (GRC) scores.
Spearman’s correlation coefficients among the L Test initial, follow-up, and change scores with the GRC (n = 29).
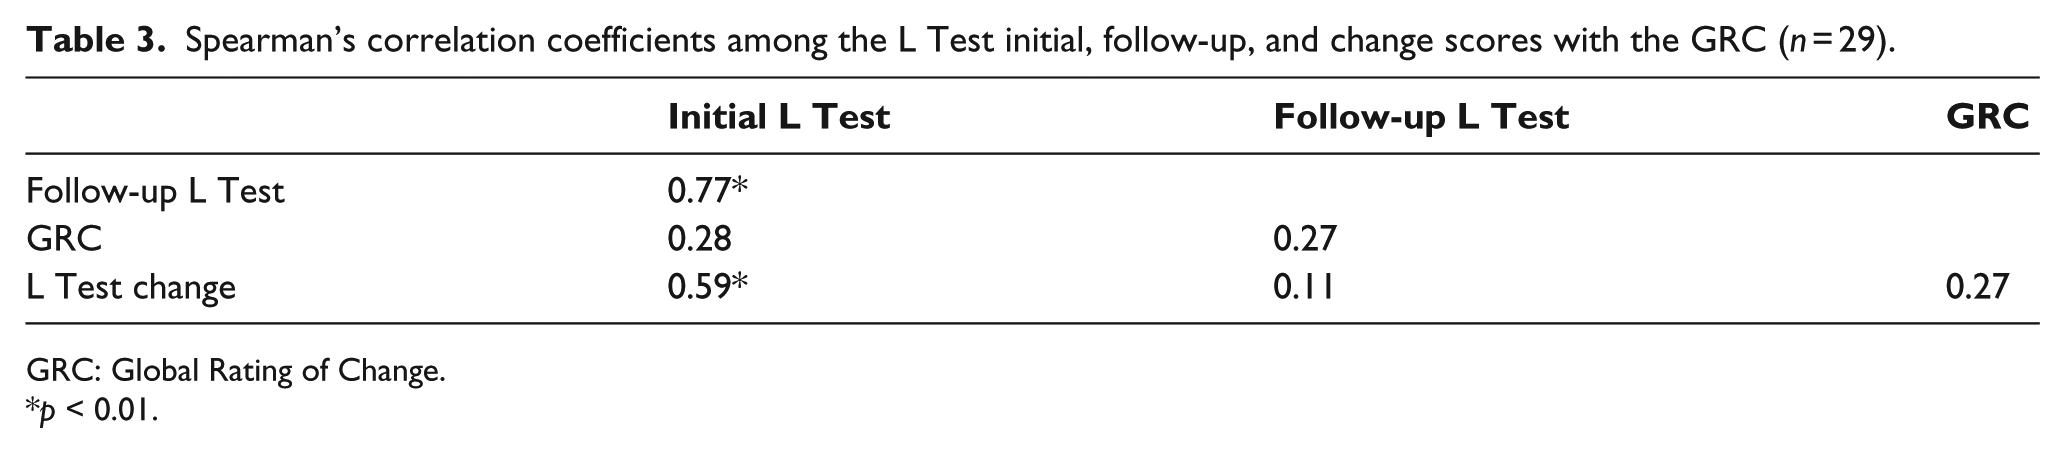
GRC: Global Rating of Change.
p < 0.01.
How often the L Test correctly identified individuals who did and did not undergo an important change (hypothesis 2)
Figure 2 shows the ROC curve. The AUC was 0.67 (95% confidence intervals 0.45–0.90). The optimal L Test change score used to discriminate between individuals who did and did not change an important amount (MCID) was 4.5 s with a sensitivity of 0.50 and 1-specificity of 0.43.
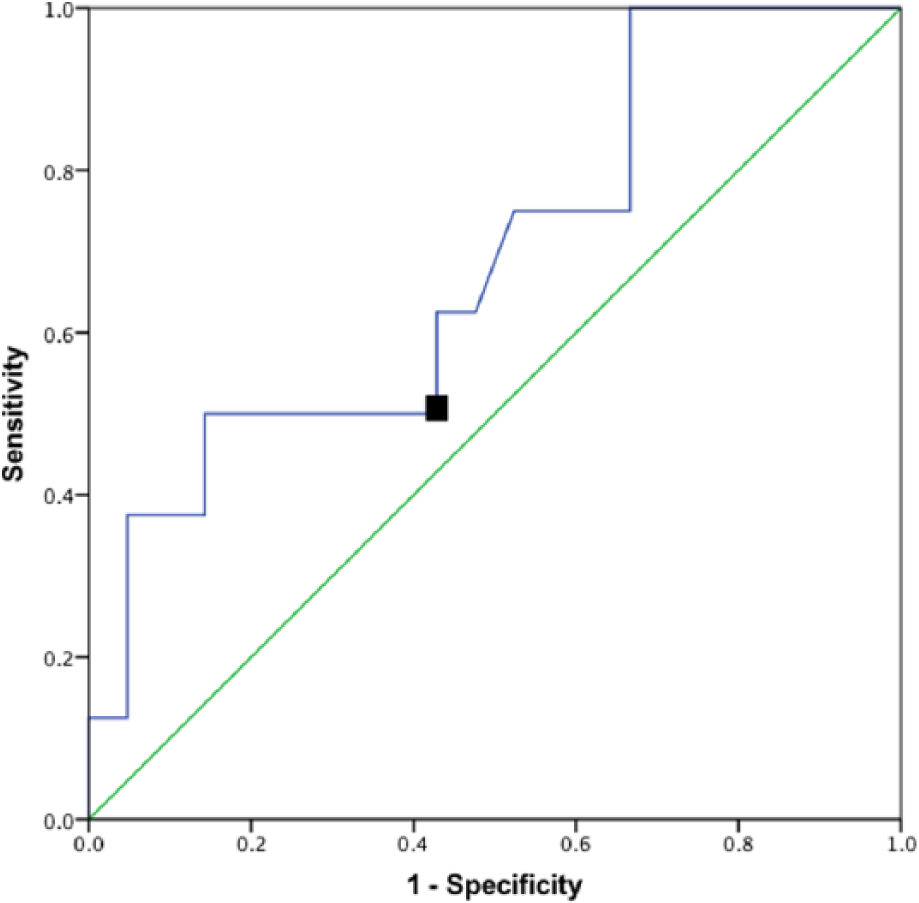
ROC curve for L Test using GRC as the reference standard criterion (n = 29).
Discussion
In this pilot study, our objective was to determine how well the L Test correctly identified individuals with a LLA who have and have not undergone an important change after intervention. Using a GRC from the patients’ perspective as the reference standard criterion, we determined that the AUC was 0.67 and the MCID was 4.5 s.
L Test scores compared to GRC (hypothesis 1)
Our hypothesis that individuals who rated themselves as having greater global ratings of change would have greater change scores on the L Test was confirmed, with L Test mean change scores greater for GRC scores of ≥5 than for GRC scores of <5 (Table 2). However, according to criteria outlined by Turner et al., 15 the correlations between the L Test scores and the GRC (Table 3) indicate that the GRC was not a valid reference standard criterion for assessing important change in the ability of an individual with a LLA to get up and walk with a prosthesis. The correlation between the GRC and the L Test change score (ρ = 0.27) did not meet the 0.5 criteria, nor was it 0.2 greater than the GRC correlations with baseline (ρ = 0.28) or follow-up (ρ = 0.27) scores. Also, the correlation between the GRC and L Test baseline score was not negative.
We chose the GRC scale because it can be adapted to suit the needs of a particular population by tailoring the questions and the scale. Specifically, we modified the question to include the phrase “get up and walk with your prosthesis.” For the scale, we evaluated perceived change using a three-step process (e.g. Have you experienced change? Better or worse? How much better or worse?), rather than a single larger 15-point Likert scale. This process was used to simplify the procedure for this population of individuals with LLA, as often individuals who experience an amputation secondary to peripheral vascular disease also suffer mild cognitive deficits. A simplification of the process was employed in an effort to yield more accurate results. Furthermore, the GRC is applicable to a wide range of patients, which is important when faced with a diverse clinical population such as individuals with amputation. Finally, the GRC has been used as an external criterion of change in other responsiveness studies where the MCID has been determined by comparing its results with those of a new instrument. 14 However, while the GRC has strengths, it also has weaknesses. Recall bias and the global nature of the GRC scale 17 are two reasons that may explain why it was not a valid reference standard criterion for assessing important change in our pilot study. The use of a GRC scale is likely influenced by recall bias, whereby intervening events or a response shift influence an individual’s ability to recall and score a previous health state. If recall is poor, the “change” score measured by the GRC may be disproportionately influenced by the individual’s status at the time of scale administration. That the GRC was not a valid reference standard criterion in this pilot study was likely due in part to poor recall given the variable interval of 1.5–11.5 months (mean 3 months) between baseline and follow-up. Furthermore, in a scale where the individual decides what is important to consider, the specific aspects that each individual takes into account are unknown. In fact, timed performance may be a restrictive measure of mobility. 18 For example, the participants may have taken into account more dimensions than simply their timed performance in this pilot study, such as the quality of their gait pattern, the ease with which they performed the transfers, the amount of pain experienced, confidence, the effort expended, and/or their general overall health when considering their ability to get up and walk with their prostheses.
How often the L Test correctly identified individuals who did and did not undergo an important change (hypothesis 2)
Our hypothesis that the L Test would correctly identify individuals who have and have not undergone an important change 80% of the time was not supported. While we anticipated higher accuracy, we are encouraged that the predictive value is better than chance alone. Recall bias and the global nature of the GRC scale, as well as the heterogeneity of our sample, may have influenced the accuracy with which the L Test was able to identify individuals who had and had not undergone an important change. Our participants presented with a variety of problems including poor fit of the prosthesis, residual limb infection, ulcer or shrinkage, and fear of falling. These problems resulted in a wide variety of interventions including new socket or prosthesis, modified socket or prosthesis, medication prescription, and gait training.
This pilot study is the first to assess the responsiveness of the L Test. Using different methodologies, previous research has examined the responsiveness of other walk tests in the population of individuals with LLA. The 2-Minute Walk Test was found to be responsive with a significant improvement in distance walked at discharge and follow-up compared with baseline, with a mean change score ± SD of 13.6 ± 19.9 and 41.2 ± 34 m, respectively. 19 The Houghton Scale of Prosthetic Use in People with Lower Extremity Amputations, a self-report that assesses prosthetic use and functional capability, found that participants’ total score increased significantly with a mean change score of 1.55 ± 2.75 from discharge to follow-up 3 months later. The effect size calculated for this change was 0.60, indicating a moderate difference. 20 Although the responsiveness of the TUG has not been assessed in a population of individuals with LLA, its internal and external responsiveness has been studied in a population of older adults in geriatric rehabilitation units and day hospitals. 18 It was deemed to have internal responsiveness with a standardized response mean and Guyatt’s responsiveness index in geriatric rehabilitation units (0.98 and 1.12) and day hospitals (0.89 and 1.85). However, its external responsiveness, measured using health professionals’ perception of change as the external criterion, was found to be non-significant in geriatric rehabilitation units.
In line with Beaton et al.’s 10 premise that the interpretation of responsiveness is enhanced by knowledge of the context of the measurement rather than the magnitude of the statistic, it is recommended that future study designed to compare MCID values of the L Test and TUG, using the patients’ perspective as the reference standard criterion, be conducted. Furthermore, in order to enhance the interpretability and comparability of other commonly used walking tests with the population of individuals with LLA, we recommend future study investigate the MCID values of the 10-Meter Walk Test, 2-Minute Walk Test, and the 6-Minute Walk Test in this population.
Limitations
There were limitations to this pilot study. There was heterogeneity in the sample with respect to amputation level, age, and years since amputation. In addition, our sample size was small, and the intervention was variable in terms of type and timeline. Furthermore, the sample consisted of a group of individuals with LLA attending outpatient services. It is not known how these estimates might generalize to other diagnostic populations. Finally, the variable interval of 1.5–11.5 months may have resulted in recall bias. However, this protocol reflects the realities of clinical practice. 21 While our pilot study findings are limited and results should be interpreted with caution, they provide critical information about the feasibility and direction for continued research. 22 Specifically, further investigation into the MCID of the L Test using a multi-site intervention trial with a larger sample size and standardized protocol (e.g. a structured timeline) is warranted. In addition, future work exploring the MCID of the L Test at a group level, from a different perspective (e.g. clinician perspective), using a different criterion, including only participants with a definitive prosthesis for at least 6 months, and accounting for baseline L Test scores would help to refine our understanding of the responsiveness of the L Test.
Conclusion
This pilot study provides the first estimate of a MCID value for the L Test (4.5 s) and is among the first measures used in the clinical area of amputee measurement to assess responsiveness. This benchmark may assist clinicians in more effectively monitoring change in individuals with LLA. However, these results must be interpreted with caution as the accuracy of the L Test in correctly identifying individuals who have and have not undergone an important change, based on use of the GRC scale, is low.
Footnotes
Acknowledgements
We thank the subjects for their time.
Author contribution
All authors contributed equally in the preparation of this manuscript.
Declaration of conflicting interests
None declared.
Funding
This pilot study was funded by the Parkwood Hospital Foundation. The Canadian Institutes of Research is acknowledged for providing salary (WCM) and scholarship support (PWR).