
Abstract
Currently, DED-Arc manufactured components are not covered by design guidelines, and design factors such as residual stress factors are not defined for such components. This hinders industrial use, especially for components with a remaining surface waviness required by industry. For the first time the stress state of a high-strength, low-alloy, large-scale DED-Arc component was characterised in the as-built state and after cutting off the component from the substrate plate. Complementary methods of residual stress analyses were applied to gain a holistic insight into the residual stress distributions of a thick-walled part. In the as-built state, direction-dependent and position-dependent tensile residual stresses were found for the component at the level of the yield strength of the part. The additive manufacturing strategy continuous spiral deposition has no significant influence on the residual stresses in bead threshold area compared to the residual stresses of the remaining component. For this case, bead threshold is no structural imperfection. By removing the part from the substrate plate, the residual stresses are significantly redistributed. Tensile residual stresses are then present at a moderate level. Compressive residual stresses were determined in the volume of the deposited material. The general consideration of “high” tensile residual stresses in such thick-walled components is rather conservative. Therefore, design guidelines should take the manufacturing condition into account.
Keywords
Introduction
Increasing efforts towards lightweight construction and the reduction of costs along the entire value chain and in the product life cycle are leading to increased interest in additive manufacturing (AM). Design freedoms that were previously barely utilised due to a lack of manufacturing techniques, the possibility of additive manufacturing components with either locally varying material combinations or using tailored deposition strategies that are more in favourite of yielding low residual stresses (RS) are key advantages that additive manufacturing can offer.
Additive Manufacturing by means of Direct Energy Deposition based on Gas Metal Arc Welding (AM-DED-Arc 1 ), also known in the former as wire arc additive manufacturing (WAAM), increases in popularity as the fundamental arc welding technology is mature and its investment costs to produce near-net-shape parts are moderate compared to other AM technologies. Welding standardisation 2 and newly developed industry-specific standards for process and product qualification3,4 already offer options for introducing AM components into market. However, there is currently still missing guidelines that helps for the structural design of the additively manufactured components. The design guidelines available in industry5,6 thus far are limited. Factors, which can have influences on the fatigue of components made using AM-DED-Arc, such as surface waviness of parts as-built (prior to final machining), the microstructure, acceptable imperfections, relationship of heat input and its corresponding toolpath design and the resulting RS distributions, have so far merely been scratching the surface in an introductory way,7–19 while the focus has been on small size lab samples. To have an overview of the state-of-art, some of these works are reviewed and summarised below.
Hensel et al. 7 have shown that the waviness of walls decreases with increasing interpass temperature when depositing the low-alloyed high-strength steel (material type S800 – 10NiMnMoCr8-7-6 20 ) using AM-DED-Arc process. They reported that the layer height and its multiples were deterministic by the toolpath design and the process, while bulges and overlapping weld metal occurred randomly. The authors recommended that the surface condition can be described using W-profiles. In their metallurgical analyses, the martensite was found in the deposited thin walls when high interlayer temperatures were applied. While upper bainite was found when high heat input and low interlayer temperatures were used for deposition. 8 They had reported that active cooling using pressurised air has limited effects on the surface waviness. As it is known that the cooling rate determines the resulting microstructure. Weber et al. 21 investigated the strength properties and surface waviness of walls and hollow structures when depositing the high strength steel filler material (EN ISO 16834-A G 79 5 M21 Mn4Ni1,5CrMo) using AM-DED-Arc process. Interpass temperatures of 150°Cand 350°C were investigated, as were the heat input and cooling conditions by choosing one or two weld beads per layer for path planning. Nearly isotropic material behaviour was observed for all parameters. The walls manufactured by two welding beads per layer exhibit a more homogeneous surface waviness with a lower standard deviation of the local thickness in the as-built condition. Müller et al. 8 reported that the different cooling media such as water, compressed air and aerosol used for active cooling can have different effects on the mechanical properties of the deposits. The water used for active cooling is the most effective method but pose practical challenges for application in the production. They also reported that the active cooling on the resulting mechanical properties at lower heat input (2.7 kJ/cm) are more effective than high heat input (4.6 kJ/cm), which were the two heat inputs investigated in their studies. Bartsch et al. 9 primarily investigated the influences of waviness and printing technology on the fatigue strength of thin AM-DED-Arc walls when they are subjected to loading in the build-up direction numerically. The influence of the measuring range of the sample and the sample thickness together with the waviness was discussed in their study. They pointed out that the reference length certainly has an influence on the surface properties, for example, roughness, and therefore plays a role for the definition of surface classes, which proper classification will need to be developed for guiding future printing using AM-DED-Arc. The influence of the printing position on the waviness and fatigue strength was also reported by Hensel et al. 10 They concluded that higher waviness resulted in reduced effective wall thickness and lowered fatigue strength. They pointed out that softening in the vicinity of the layer boundaries is a cause of the observed low fatigue strength. However, the influence of RS on fatigue of thin walls and after sample preparation was not fully discussed in their study.
Earlier RS analyses on AM-DED-Arc parts have primarily focused on small specimens and numerically studied the possible influencing variables by means of simulations. Wu et al. 11 have identified main factors contributing to the RS state of the parts deposited using AM-DED-Arc with the help of machine learning models and performed simulations on a nickel-base alloy (material number: 2.4665), stainless steel alloy (material number: 1.4401) and iron-nickel-chromium alloy (material number: 1.4958). The substrate preheat temperature was identified to be most influential factor among the investigated variables. It is also well-known in traditional welding that residual stress can be managed by preheating the substrate before welding. It was reported by Ya and Pathiraj 12 that a higher preheating temperature can result in lower cooling rates, which leads to lower RS. They also investigated the influences of the heat input, buffer layers and substrate rigidity on the RS and concluded that preheating has most effects on minimising the resulting RS. The aforementioned studies are supported by Nagallapati et al., 13 who investigated the influences of process parameters and process conditions on the resulting RS with two thermal management approaches named as passive and active. The passive approach is performed by varying the selected process parameters to study their effect on RS and distortion. The active approach was implemented by insulating the substrate with and without adaptive current and heating the substrate. The significance of heat input and interlayer temperature focused on in their study showed that lower cooling rates generally lower the magnitude of the RS. The heat input is the most influential parameter from the deposition process point of view. High interlayer temperatures preventing material from cooling down quickly, resulting in a more homogeneous temperature distribution and therefore a more homogeneous stress distribution within the material. It was also reported by Wandtke et al. 14 that a lower interlayer temperature /can lead to the final stress built-up of the last layers deposited resulting in a higher RS gradient between top layer and substrate.
Sun et al. 15 have shown experimentally and numerically that compressive RS are generated from a certain layer height (about 20 mm reported in their case) in the longitudinal direction of thin aluminium alloy walls deposited using AM-DED-Arc. They reported that the substrate restrain condition had little influence on transversal RS within the wall, while the magnitude of the longitudinal RS was reduced with increased wall height. The authors found no significant influence of the clamping device and the thickness of the substrate plate (SP) on the magnitude of transverse RS formed in the wall, while the level of longitudinal stresses was increased by the clamping and the thickness of the SP. This is however different from the thin wall with rectangular hollow sections deposited using AM-DED-Arc with high strength steel which was investigated by Schroepfer et al., 16 who reported that high RS in the transversal direction can be found in the very top layer of deposited components. Wandtke et al. 14 reported that apart from the dimensions of length and width of a hollow structure, it is the height of the deposited structure that primarily determines the magnitude and gradient of the maximum tensile RS in longitudinal direction. The SP thickness has effects on the level of RS. SP thickness and build height influence the resulting bending moments and thus the maximum RS. It has to be taken into account during design and manufacturing that any mechanical arrangement of a structure deposited using AM-DED-Arc, such as a simple SP removal, will not only result in a stress release but also introduce a RS redistribution. 17
Jimenez et al. 18 have taken into account phase transformations when modelling the RS of the deposited creep-resisting alloy ISO 21952-A G CrMo91 22 using AM-DED-Arc. Their modelling was validated using thermocouple data and X-ray diffraction (XRD) data. Their results show that phase transformations have a major effect in the final stress state of the part, especially in the areas close to the deposit. Ding et al. 19 also investigated the influence of printing strategy (toolpath design) on the RS and deformation of small samples using AM-DED-Arc simulation. They reported that inhomogeneous RS can be introduced when using zigzag toolpath design with alternating deposition. They also reported that minimal deformation of the SP can be obtained after printing by means of weaving motion transverse to the travel direction. As pointed out by Srivastava et al. 23 that most of the research had been focussing on the wall structure and small size modelling. Much efforts will be still needed for process-scale modelling, more geometrical complex modelling and optimisation in controlling of the distortion. As proposed by Lu et al., 24 although distortion and RS can be minimised by controlling the maximum temperature gradient, it is unavoidable to accumulate RS within the SP, which should be addressed by lowering the mechanical restraints.
As reviewed in literature, most of research works are focused on the RS modelling and the validation experiments are mostly focused on the small sized wall structure samples. As also pointed out from literature, further research on larger scale modelling and more complex structures is required. They are motivating to carry out current research including a comprehensive experimental RS analysis on a large AM-DED-Arc cylindrical demonstrator to analyse the RS in the as-built state and after removal from the SP. Based on this study, we also aim to develop the methodology that helps analysing the large-scale 3D printed component using AM-DED-Arc. In addition, the obtained results can help for future process scale up modelling development.
Experimental details
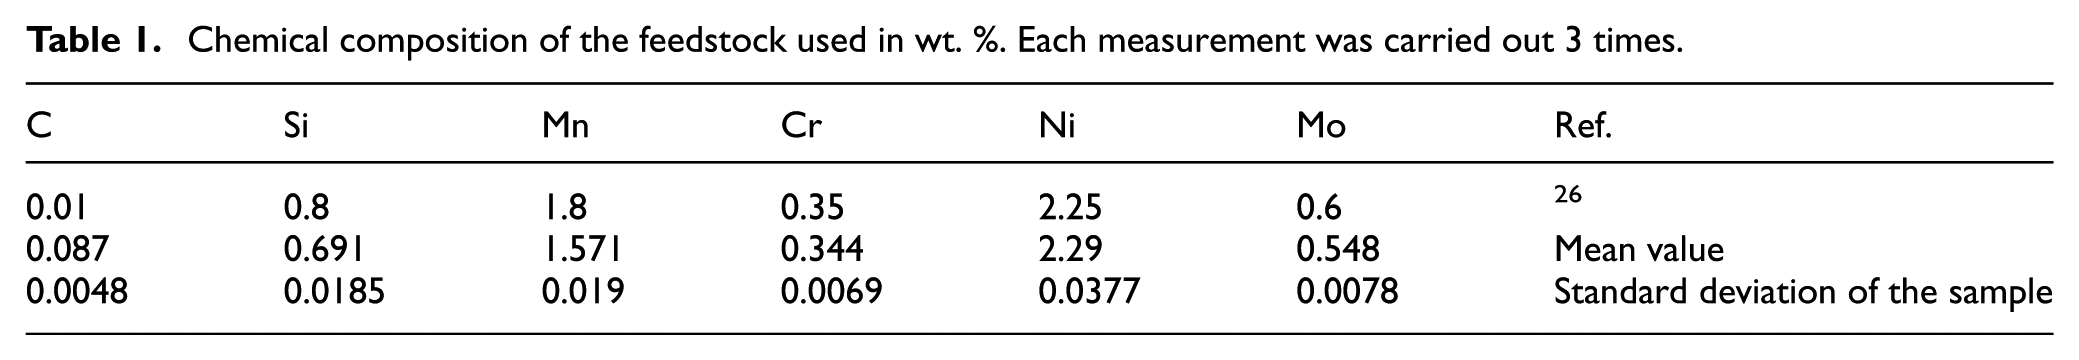
In this study, hollow cylinders were deposited using a high strength weld filler material (EN ISO 16834-A G89 6 Mn4Ni2CrMo (X90),25,26 Böhler welding, 1.2 mm solid wire) on EN 10025-2-S355J2+N 27 SP with 30 mm of thickness. Process optimisation with active water cooling was performed on the smaller SP (300 mm × 200 mm × 30 mm), then the obtained process conditions were used for depositing larger hollow cylinder on a larger SP (400 mm × 400 mm × 30 mm). As water circulating adjustable, similar cooling can be reached for both large and small SP. The sample was deposited using a Panasonic TM2000 WGIII TAWERS welding system for which the process parameters were monitored and controlled using MaxQ.00 system at RAMLAB BV. The Interlayer temperature was maintained less than 150°C. The smaller sample was deposited for extracting samples for mechanical testing. The larger sample was deposited for RS analyses. The chemical composition of the deposits was measured by optical emission spectrometry as listed in Table 1.
Chemical composition of the feedstock used in wt. %. Each measurement was carried out 3 times.
RS analyses were carried out using different complementary measurement techniques, including XRD, incremental hole drilling (IHD) and the contour method (CM). The measurement locations were selected points on the top and on the side surfaces. Subsequent to the XRD measurements, the same locations were then analysed using the IHD method to determine the RS distribution within the deposited material (1 mm in depth). The analyses were carried out both in the as-built condition and after the hollow cylinder was cut from the SP. This is to evaluate the RS redistribution effects that can be caused by the post machining such as cutting. After the hollow cylinder was cut from the SP, the RS analyses were carried out using the contour method to determine the circumferential component RS distribution over the entire hollow cylinder cross-section. The hollow cylinder cross sections were then prepared for metallographic analyses and microhardness testing.
Fabrication of hollow cylinders using AM-DED-Arc
Figures 1 and 2 show the two types of the deposited hollow cylinders mentioned earlier. The smaller hollow cylinder (Figure 2) was printed to obtain the optimal process parameters and deposition conditions. Then the large hollow cylinder (Figure 1) was deposited for RS evaluations detailed in the following sections.
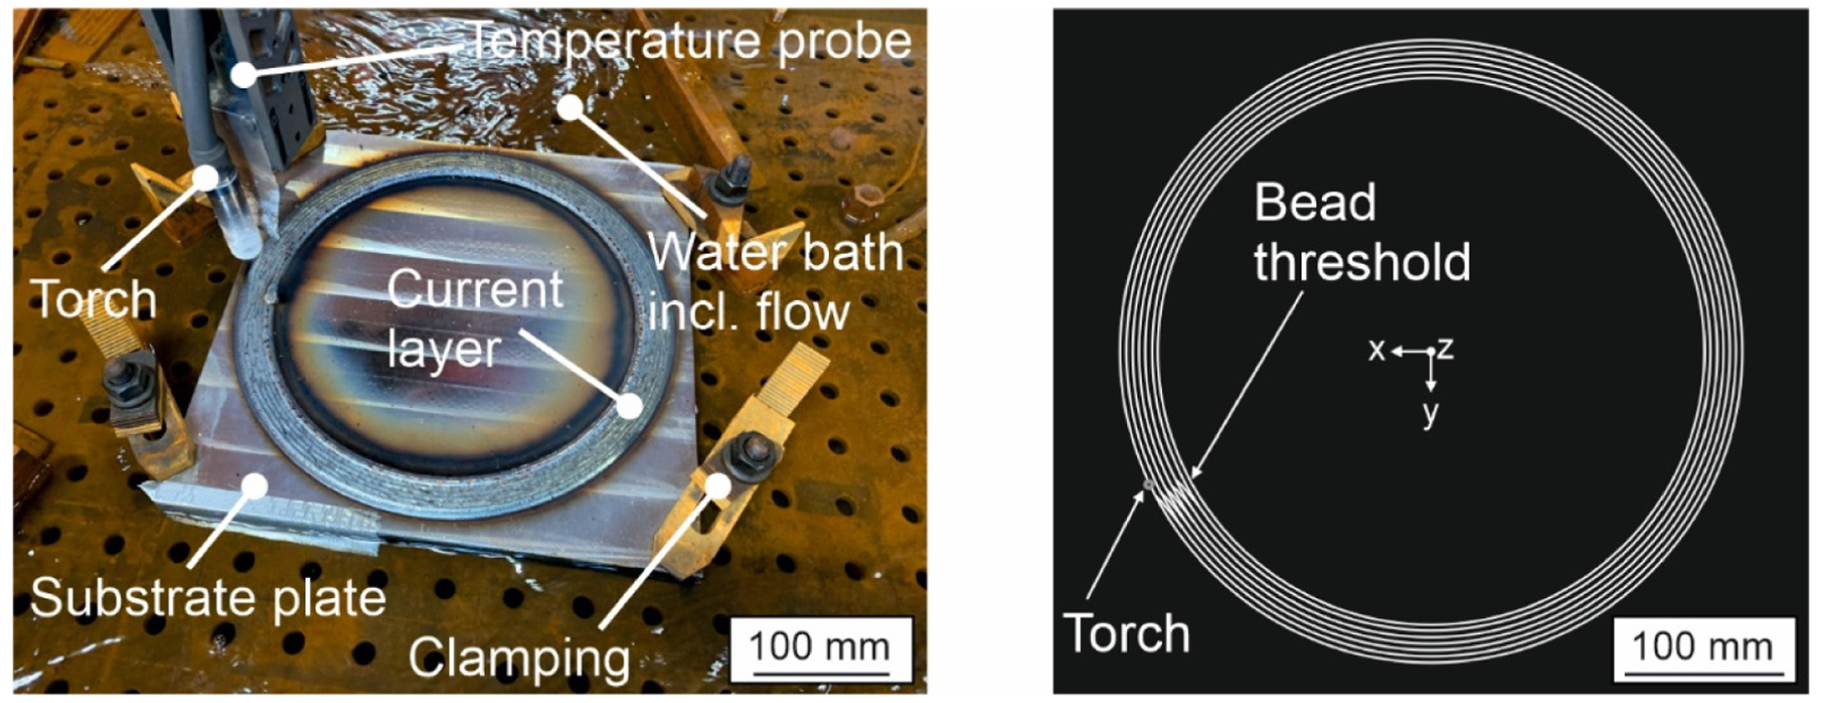
Experimental setup of the AM-DED-Arc demonstrator during printing on top of the SP within the bath tub (left) and theoretical layer design programmed using the software Powermill 2018 (Autodesk Inc.; right).
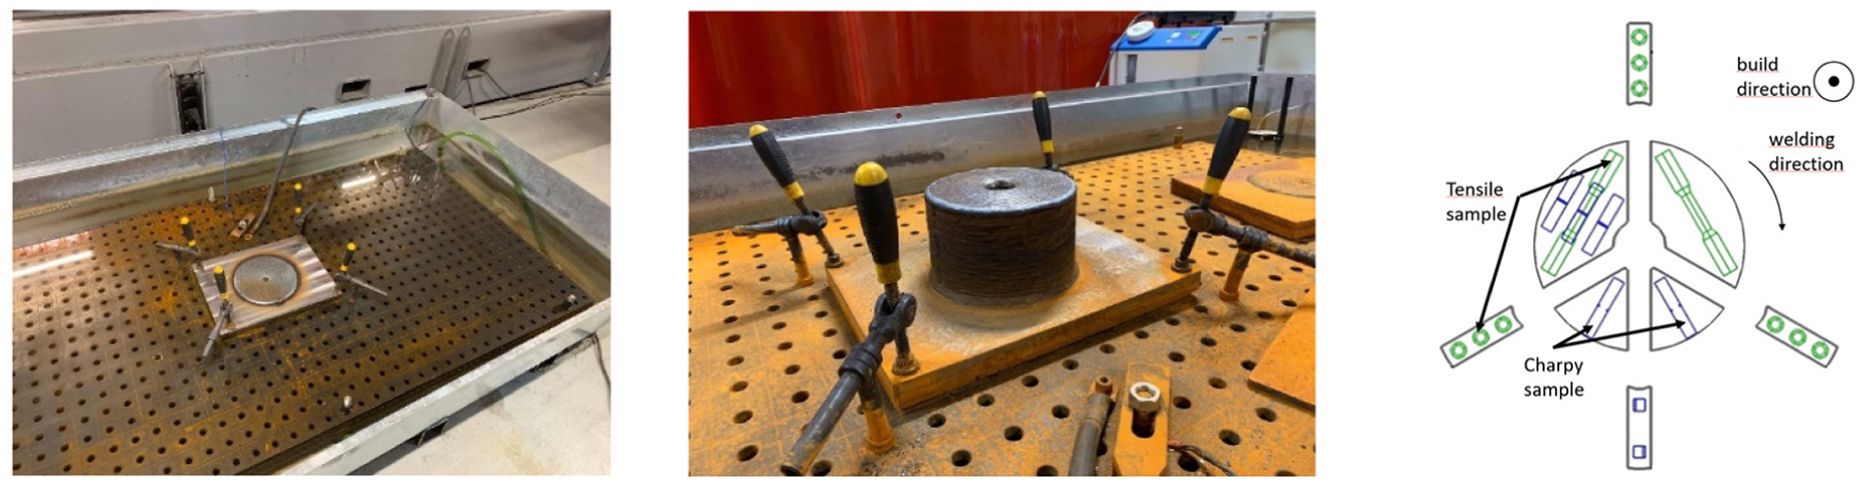
Illustration of the small hollow cylinder AM arrangement (left), after fabrication (centre) and visualisation of the sample position in the demonstrator for determining mechanical properties (right).
Figure 1 shows the larger hollow cylinder (AM-DED-Arc demonstrator) deposition arrangement. The SP was positioned and clamped in water on a clamping table. Water constantly flowed around the SP to dissipate the process heat. The deposition was monitored and controlled by a thermal sensor mounted on the torch. The process parameters applied are listed in Table 2, which were optimised from the smaller hollow cylinder (Figure 2) that was deposited for material tests. The AM-DED-Arc demonstrator has an outer diameter of 390 mm, a nominal wall thickness of 36 mm and a built height of 63 mm. The hollow cylinder consists of 25 layers with 7–10 beads overlapped per layer. The hollow cylinder has an overhang towards the centre of the hollow cylinder with an angle of 20°away from build direction. The overhang starts at ∼30 mm of the build height. To minimise the number of arc start/stop positions, a transition area (S-shape) was defined within the layers, so that all beads were joined as a single spiral bead. This allowed the wall thickness of the component to be produced seamlessly (continuous spiral deposition) and the arc start/stop positions can be placed at outside of the hollow cylinder which can be machined during the post process. The layer structure and the additive manufacturing direction were alternated to ensure a symmetrical heat balance during the process.
Parameters used for fabrication of AM-DED-Arc demonstrator.
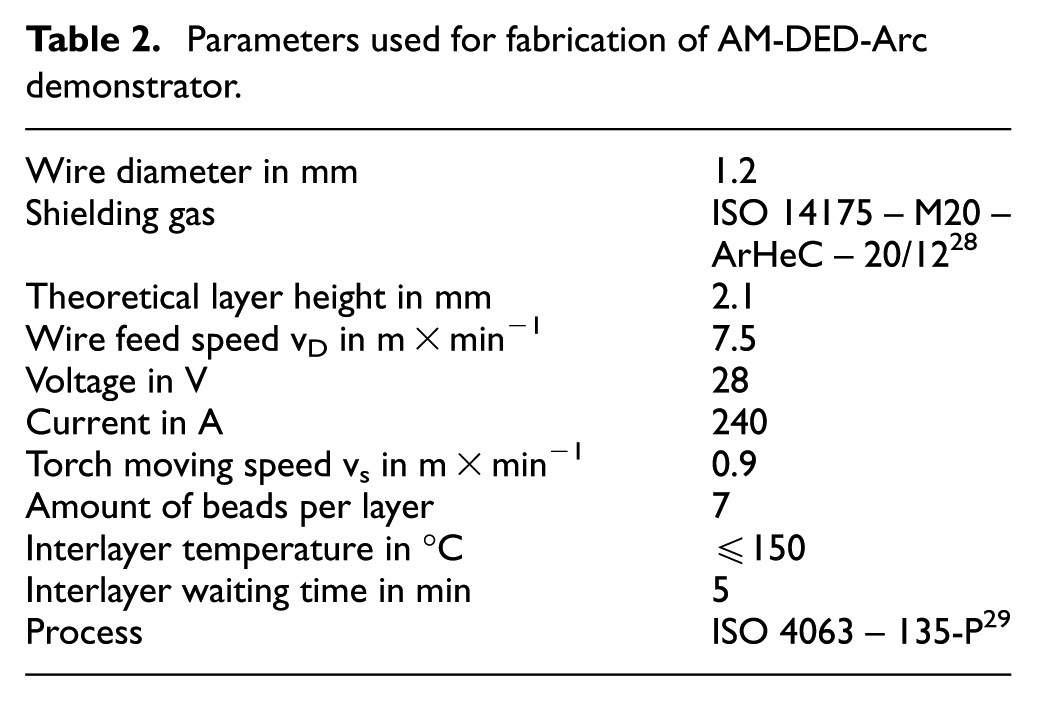
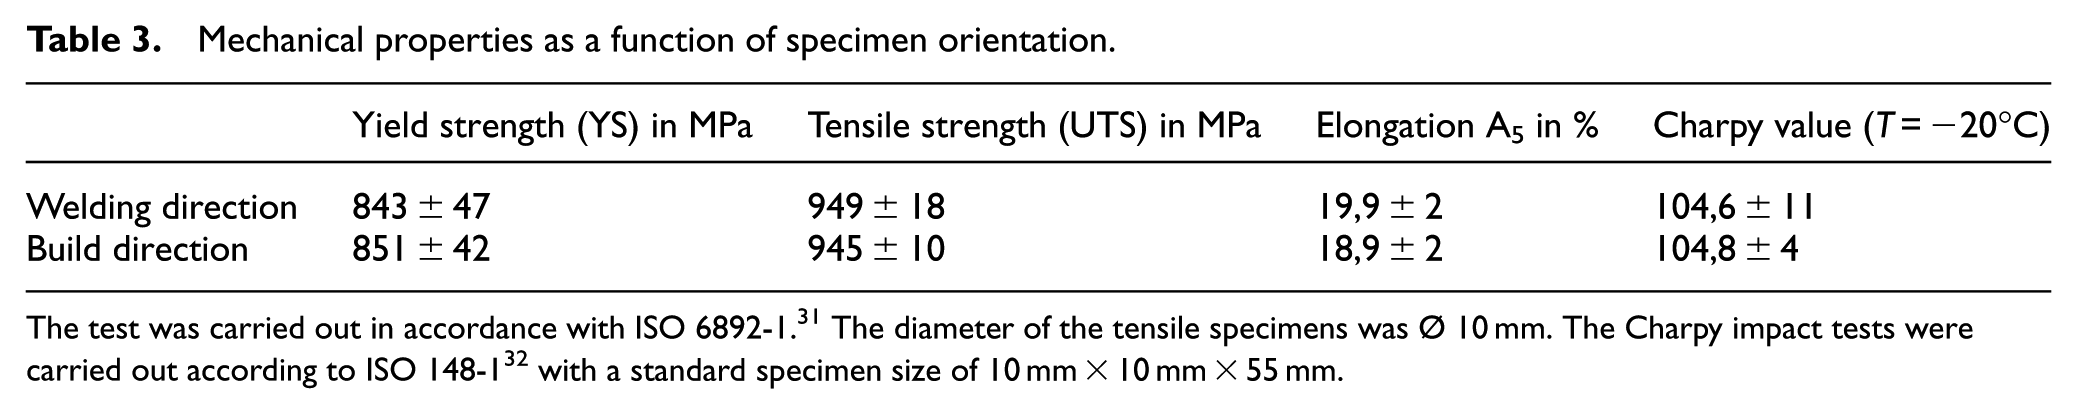
Figure 2 also shows a schematic of sample extraction for mechanical tests. The smaller hollow cylinder was deposited on the smaller base plate with a smaller outer diameter of 188 mm and inner diameter of 20 mm. Table 3 summarises the mechanical test results. Apart from the slight average lower yield strength (YS) comparing to datasheet, 26 the ultimate tensile agrees well with the wire specification and superior impact and elongation were obtained. As process optimisation is not the focus of this work, so it will not be detailed here. However, the process parameters listed in Table 2 were developed based on methodology presented in our publication. 30
Mechanical properties as a function of specimen orientation.
Metallographic analysis and microhardness measurements
After sectioning of the larger hollow cylinder, a cross-section area was extracted, embedded, ground and finally polished with a diamond suspension of 1 μm. The prepared cross section was etched using Nital (concentration 2 Vol.% HNO3) for a period of 10–15 s. The cross section was examined and recorded with the optical macrographs. Microhardness was also measured on the metallographically prepared cross section with the ultrasonic contact impedance method (UCI) according to the standard DIN 50159-1 33 using a hardness scanner UT-200 (BAQ, Germany). A loading force of 4.903 N (HV 0.5) was applied for 0.5 s. The indentations were set with a distance of 0.2 mm away from each other.
Residual stress analysis of the large hollow cylinder deposited
X-ray residual stress analysis
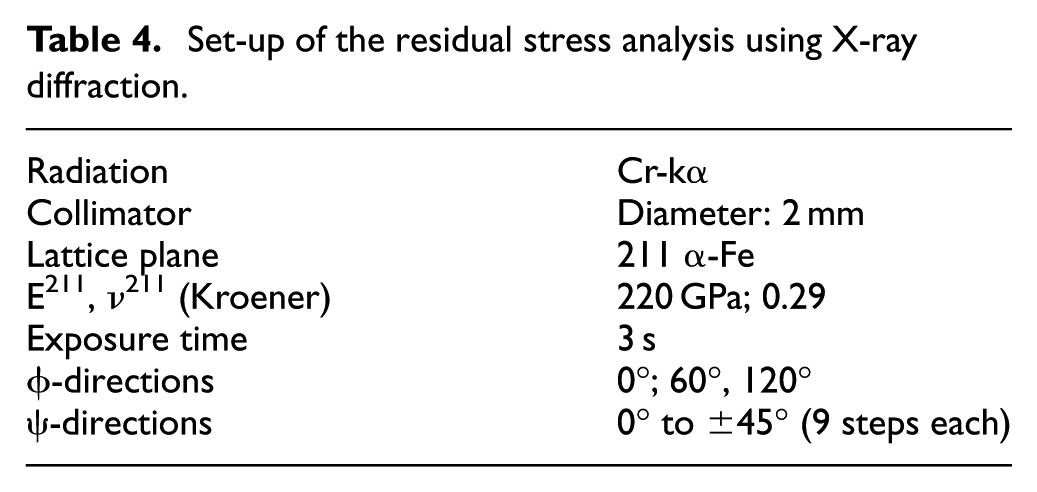
The XRD measurements were performed with a six-axis robot diffractometer (Stresstech, Finland). The system operates in the modified chi-mode according to standard DIN EN 15305 34 using two linear detectors calibrated by an α-Fe-powder sample. The main measurement parameters are given in Table 4. Data analysis was performed with the software Xtronic 1.13.2 (April 3, 2019, Stresstech Oy, Finland) using a Pearson-VII-function to fit the diffraction data and to calculate the d-values. The RS were then determined using regression analysis, that is, generalised least squares method of the sin2ψ equation as described in.35,36 This allows the stress tensor to be calculated assuming that the stress component normal to the surface (σ33) is 0. In Figures 3 and 4 the individual measuring paths are indicated along the build height at the outside surface of the hollow cylinder, respectively on the top surface before cutting off the SP. The individual positions were selected according to the centre of each deposited bead. Considering its symmetric shape, the defined measuring paths A, B, C and D for X-ray measurements should be sufficiently representative of the residual stress distribution of the deposited material. The measuring paths E1, E2 and E3 where particularly interested as its the locations where the material deposited different from lines A, B, C and D. There were arc starts/stops within this location together with the S-shape overlapped parallel beads. It was suspected that material can be in a different RS state after the deposition was completed.
Set-up of the residual stress analysis using X-ray diffraction.
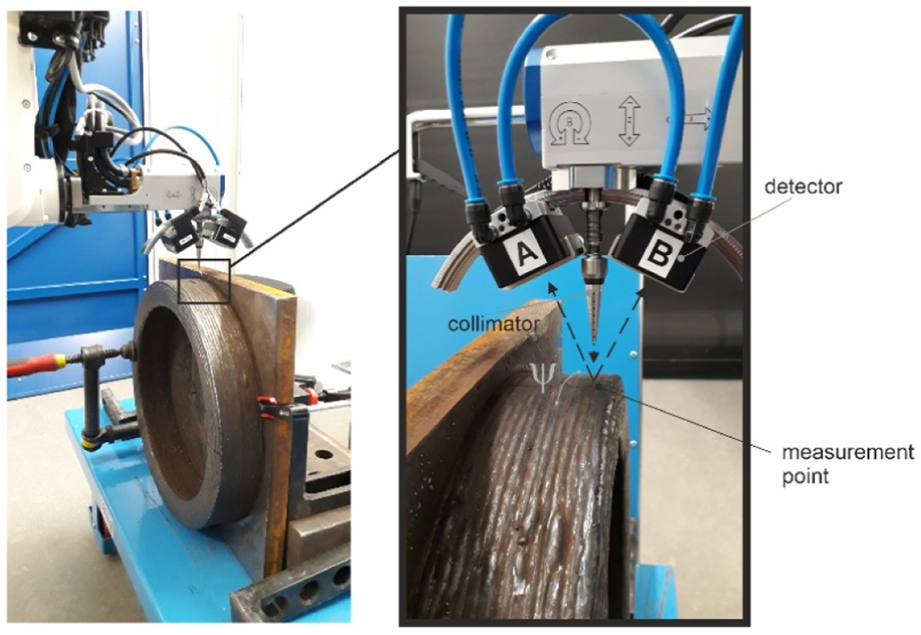
Experimental setup of the X-ray residual stress analysis on the surface of the AM-DED-Arc demonstrator (left) as well as a detailed explanation of the X-ray beam path using the sin2ψ method (right).
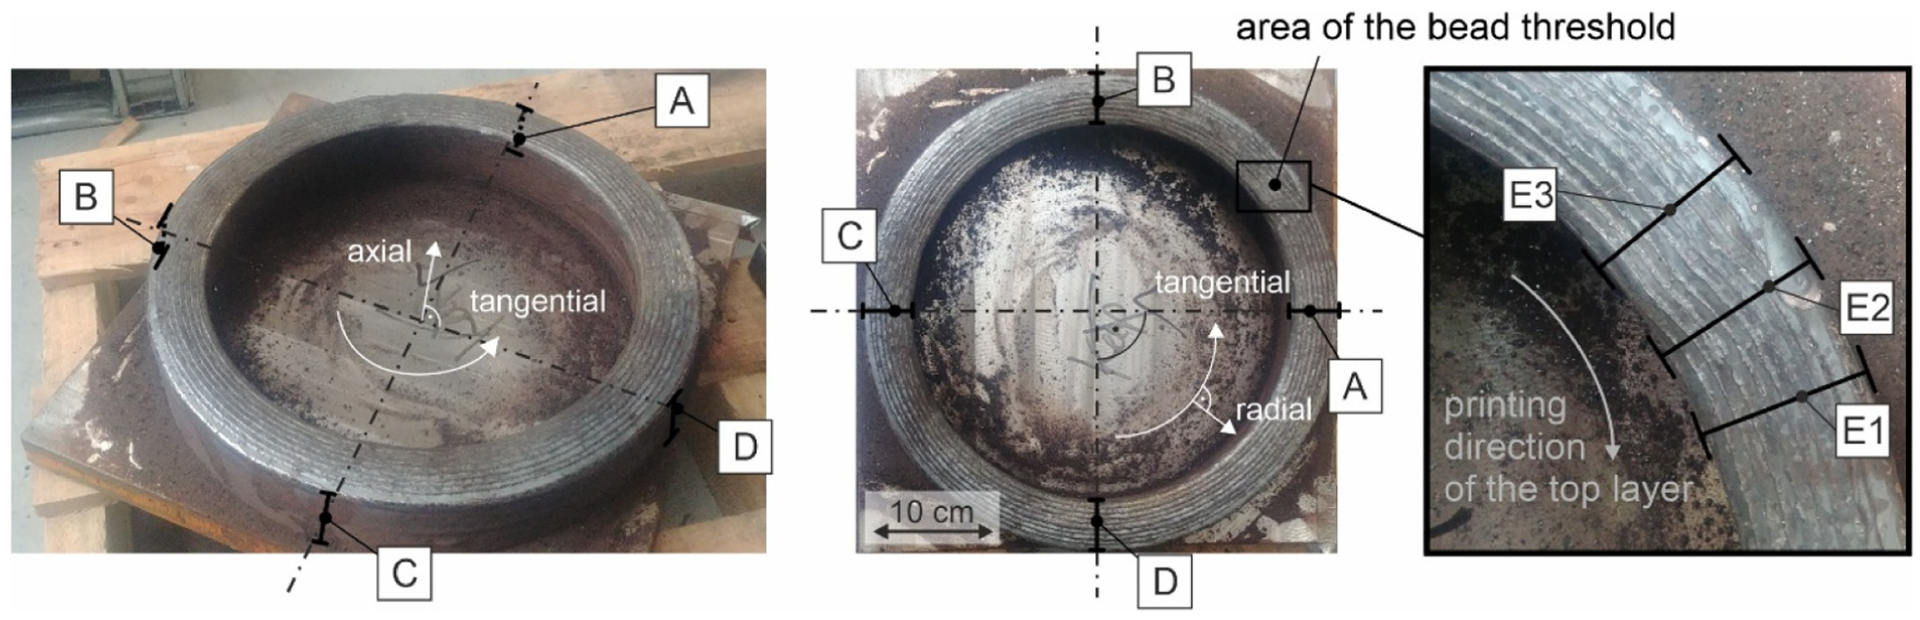
Location of the residual stress analyses lines (A–D) on the outside surface (left), top surface (middle) and location ofthe surface residual stress analyses lines (E1–E3) in the area of the bead threshold of the top layer (right) using X-ray diffraction. Component-related residual stress directions are shown in white. The measurement paths (A–D) were each arranged offset at an angle of 90°.
Incremental hole drilling
The local depth distributions of the macro-RS were analysed by means of incremental hole drilling (IHD) using a drilling device of type RS200, Micro-Measurements, Raleigh (US). For drilling a TiN coated end mill with a nominal diameter of ø 1.6 mm was applied. The strain relaxations during stepwise drilling the blind hole were recorded by strain gauge rosettes of type CEA-06-062UM-120 (Micro-Measurements, Raleigh (US)), which were interconnected in a Wheatestone half bridge with temperature compensation. A carrier frequency amplifier of type PICAS 4K from Peekel Instruments GmbH, Bochum (GER) was applied in this case. Stress calculation was carried out using the differential approach.
37
Prior to the application of the strain gauge rosettes the measurement location must be flattened by careful grinding due to the rather rough surface of the deposited hollow cylinder. Hereby, careful attention was paid to ensuring that as little heat as possible was introduced during preparation into the area of the measuring point (as shown in Figure 5) to avoid relaxation of the process induced RS. The RS were calculated using the differential approach assuming linear elastic and isotropic material using the macroscopic elastic constants E = 210 GPa and Poisson’s ratio ν = 0.3 for steel. The measured strain relaxations were slightly smoothened using cubic spline functions. When using incremental hole drilling (IHD) for residual stress analysis, it is important to note that inserting a blind hole creates a notch effect. This means that if very high residual stresses (>
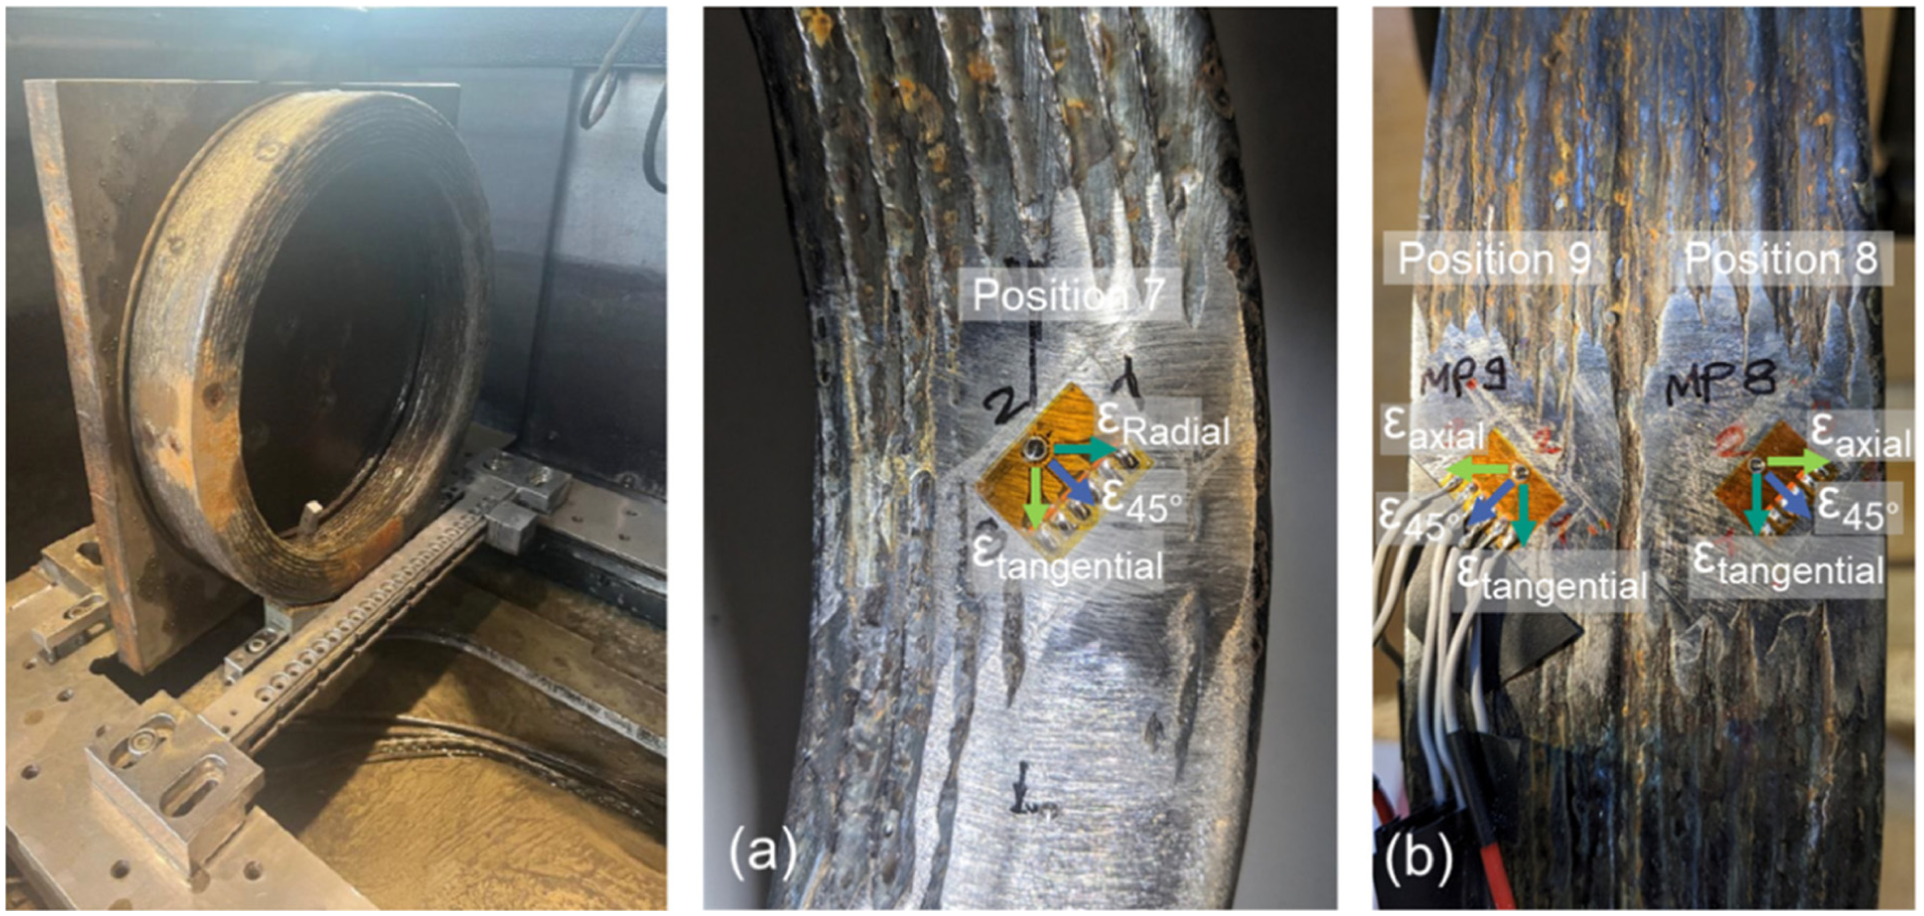
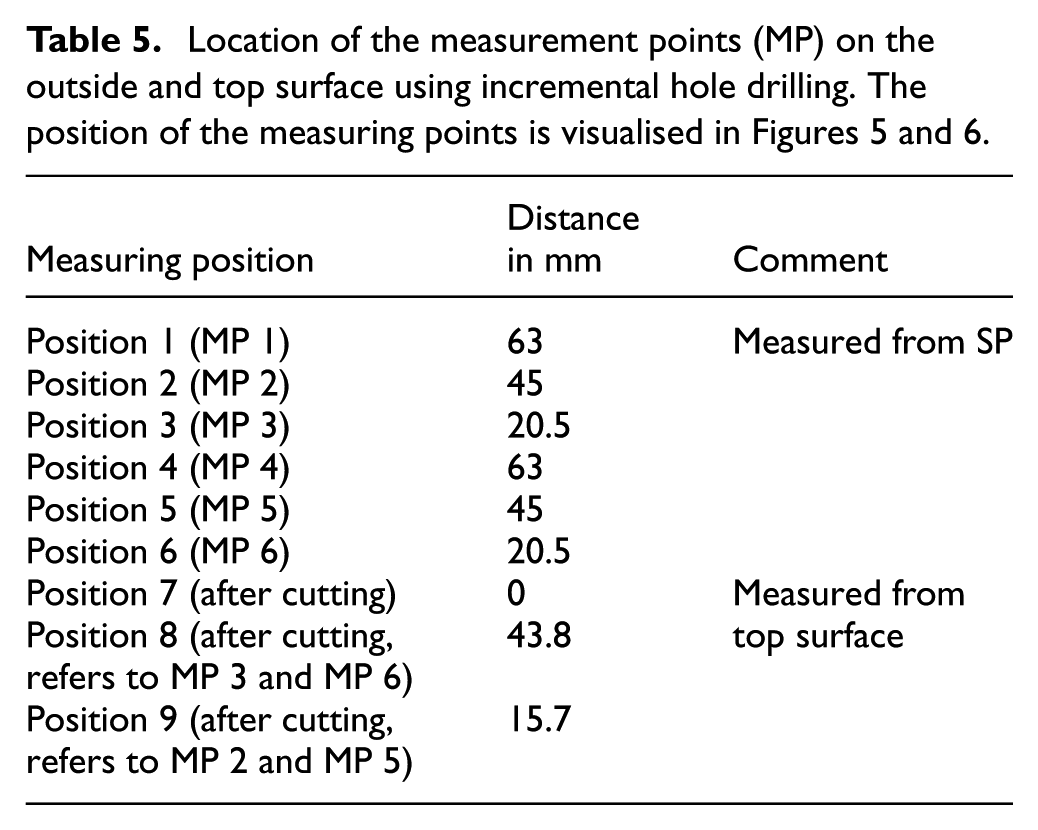
Image of the hollow cylinder being separated from its SP by means of EDM (left) and images presenting the measurement locations applied for incremental hole drilling on the top surface of the component (a) and on the outside surface (b). Furthermore, the measuring directions are indicated.
Figure 6 introduces the measurement locations and Table 5 shows the measuring positions. In an initial series of measurements, residual stress analysis was performed on the hollow cylinder before separation from the SP. The measuring points were located within the measuring paths C and D of the X-ray measurements. Three locations were chosen, that is, on the top surface in the centre of the wall thickness (measuring points MP1 and MP4). Further measurements were carried out on the outside surface of the component, that is, measuring points MP5 and MP6 for line C and MP2 and MP3 for line D, respectively.
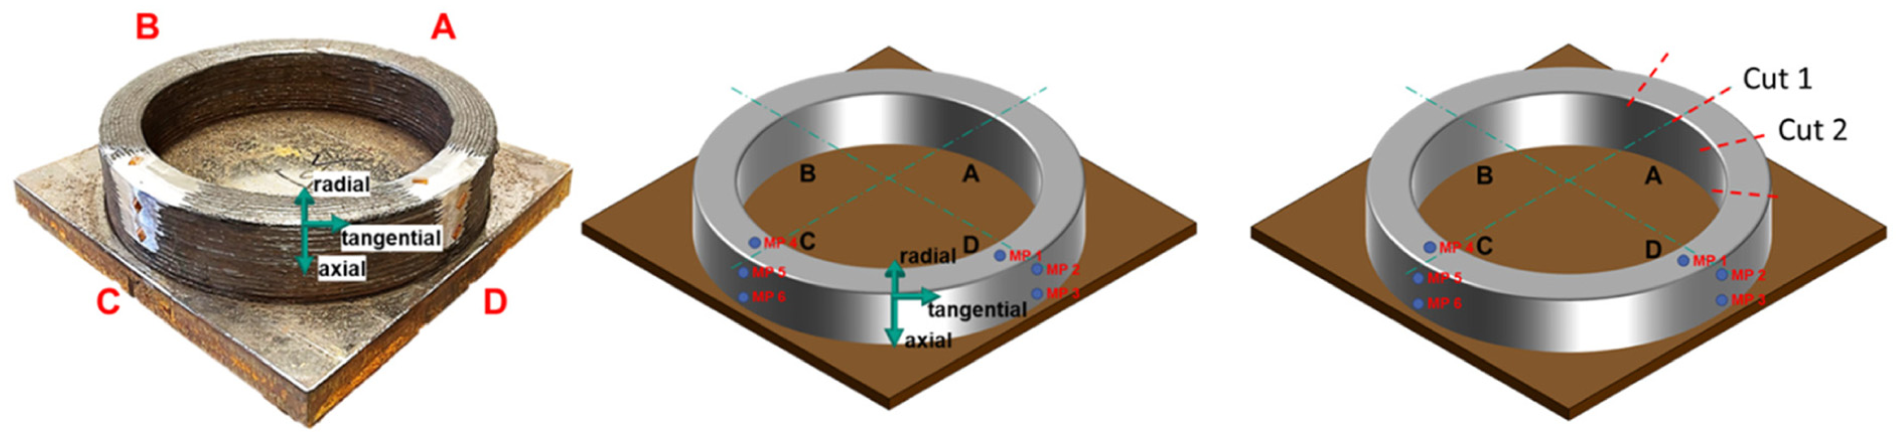
Image (left) and schematic view (centre) of the measurement locations considered for incremental hole drilling in the as-built state – with indication of the measuring directions. Schematic view of the cut locations (right) considered for the contour method (for the sake of simplicity Figure 6 with SP was modified respectively – although that the cuts were done after separation of the SP).
Then, the hollow cylinder was cut from its SP using electrical discharge machining (EDM). A clear bending of the SP was observed. To evaluate a possible strain redistribution due to stress release after cutting off the SP, further RS analyses using the incremental hole drilling method were carried out at the positions comparable to the measurements performed before the SP cut off.
Contour method
Complementary RS analyses to resolve the tangential RS component were carried out by means of the contour method (CM) as first proposed by Prime in 2001. 40 After the hollow cylinder was separated from the SP, three sections of about 100 mm length were cut from section A (as shown in Figure 6). This is to obtain two cuts (Cut 1 and Cut 2) where both cutting faces are accessible and to receive a better statistic over the circumference of the deposited hollow cylinder.
The sectioning was carried out by means of EDM using a machine of type Mitsubishi-BA24 (Mitsubishi Electric Corp., Japan) with a single “skim” cut using a 0.25 mm wire at a cutting speed of 6 mm/h. These parameters were used to achieve a skim cut finish without wire failure. To monitoring the stress relaxation during the first cut, two strain gauges applied on the inner surface of the ring and two strain gauges applied to the outside surface, all oriented in circumferential direction. The stress relaxations were reflected in the strain gauge measurements with the recorded maximum values about 117 µm/m at the outside surface and about 105 µm/m at the inside surface. This indicated that no significant bending moment was released through cutting the hollow cylinder and hence there was almost no distortion of the cut surface to be observed (as shown in Figure 7).
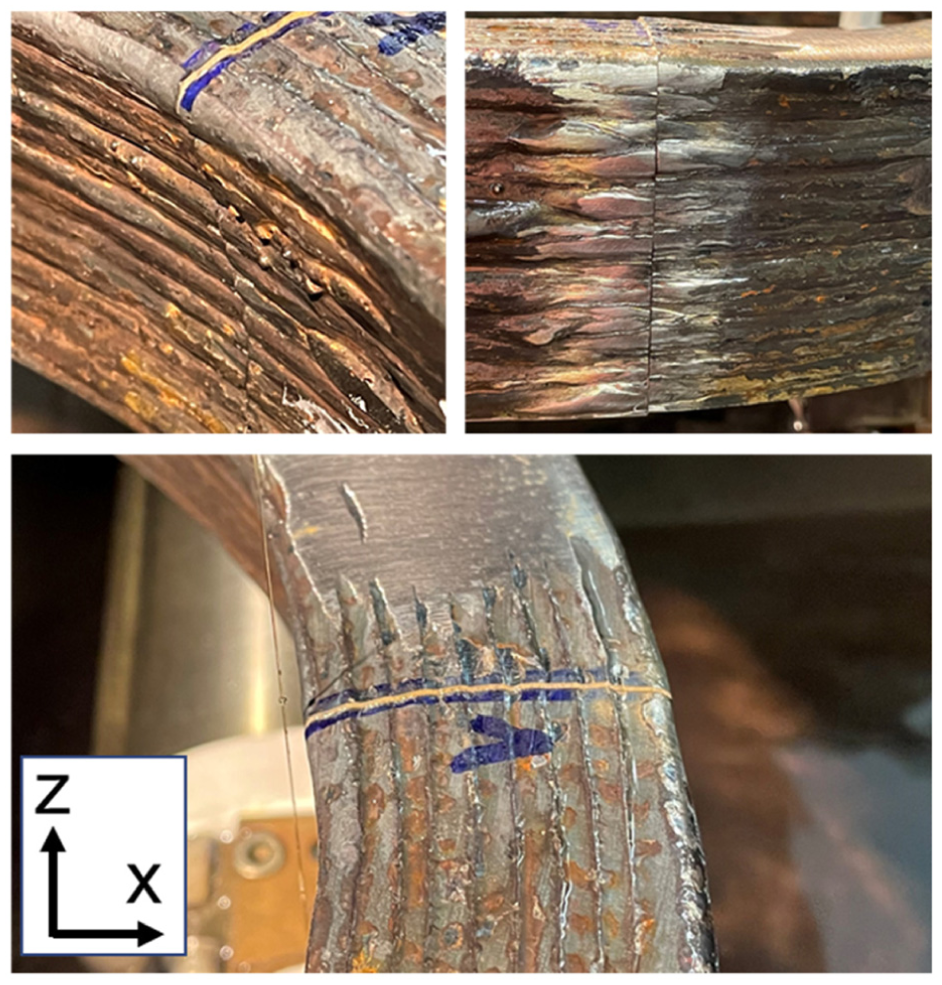
Images of the hollow cylinder being opened through the first EDM cut – no significant distortion could be observed which was confirmed by strain gauge reading carried out during EDM.
For the accurate profile measurement of the cut surface, a 3D coordinate measurement machine, ZEISS PRISMO VAST (Carl Zeiss AG) and a 1 mm diameter synthetic ruby sphere used as probe, was employed. The measuring paths on the cut surface were optimised with respect to measuring time and optimal resolution (measurement grid in x: 0.01 mm and in y: 0.5 mm). Both Cut 1 and Cut 2 cutting faces were measured and the data was smoothed using a Fourier series of sixth order function. Subsequently, the fitted functions of both cut faces were averaged to remove any “anti-symmetric” deviations, while “symmetric” effects originated from the stress relief, are enhanced.
Finally, the RS were calculated using a 3D finite element model (FEM) and the software package ABAQUS standard (Dassault Systèmes Simulia Corp., Rhode Island. (US)) was employed for computing. The cut was modelled based on a scan of the cutting faces with a depth of approx. 100 mm using reduced quadratic elements (C3D8R) with an element dimension of approx. 0.5 mm on the cutting face. For all element nodes on the cutting face, the displacements, as determined from the fitted and averaged function, were applied as a boundary condition. The RS distribution on the cut surface was calculated assuming linear elastic and isotropic material using the macroscopic elastic constants E = 210 GPa and Poisson’s ratio ν = 0.28 for steel.
Results and discussion
Microstructure and microhardness mapping
The microstructure of the large hollow cylinder cross section is shown in Figure 8. The deposited material is fairly dense and no cracking was observed. Tempered martensite was observed from the microstructure and the measured hardness is around 350 HV0.5. This hardness level is comparable to the conventional welded joints stated in this material class. 41 Individual hardness peaks (approx. 400 HV0.5) associated with the path planning are clearly visible as mapped in Figure 8 left. Both, the edge and the last layer have the highest hardness values. The last layer on the top exhibit fresh formed martensite after its deposition which is different from the layer already deposited, which the formed martensite had been tempered by the heat introduced during the subsequent layer’s deposition. The edge side of the material has continued convection with ambient, which will be less heat treated during the subsequent layer’s deposition. Overall, these areas do not experience any strong tempering effect due to their positions, hence higher hardness values were observed on the top after the last layer’s deposition. Isolated softening zones between the printed beads might be the reason that is causing slightly lower YS observed in the mechanical tests. Similar observations were also discussed and reported by Müller et al. 8 The slightly lower YS can be recovered from the designed post heat treatment, which is not the focus of the current study, hence, it will not be discussed here.
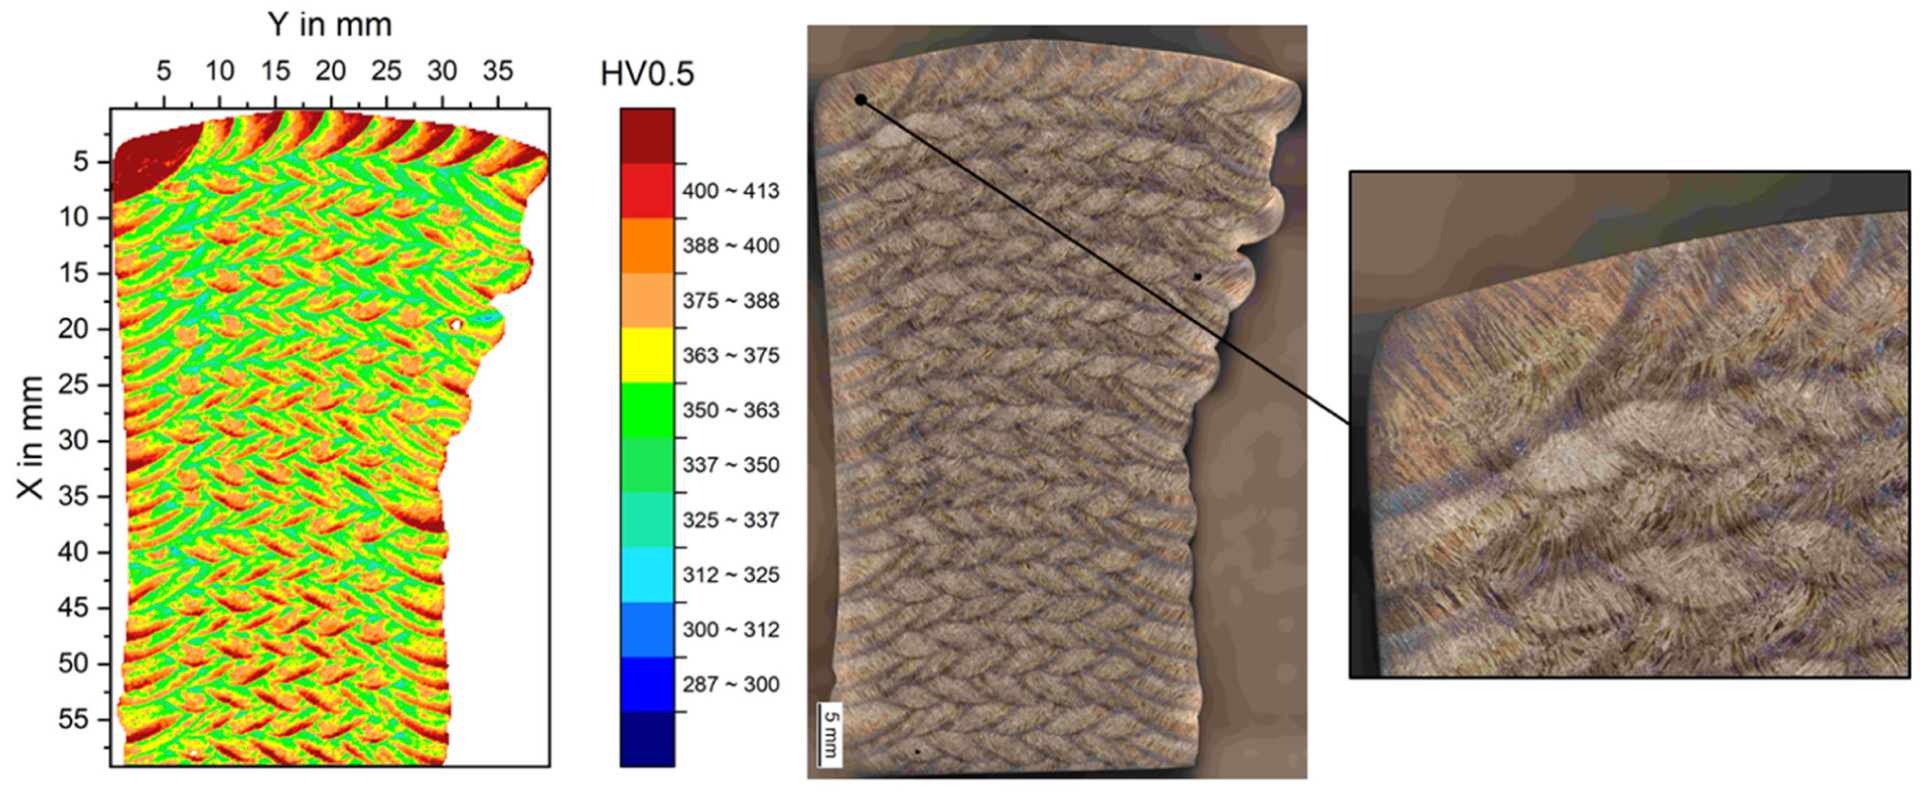
Cross section (2% Nital, 25×) and Vickers microhardness map across the cross section.
Residual stresses evaluation on the deposited hollow cylinder
Near surface residuals stresses (XRD) before cutting off substrate
All details from XRD stress analyses carried out on lines A, B, C and D and lines E1, E2 and E3 are shown in Figure 4, including the measurement locations and directions). The plotted curves in the following figures were smoothed with a moving average in the period k = 5. This technique was used to better visualise the trend of the analysed RS, which can have large scattered due to the rough surface and the inhomogeneous microstructure. The largest measurement error determined per measuring point was 62 MPa, with almost all measuring points being less than 30 MPa. These errors appear so minor that an error analysis is not necessary. Figure 9 reveals that the tangential RS at the top surface are in average about 300 MPa. Individual values can reach almost 500 MPa whereas all values are in the tensile range. While there is a pronounced RS gradient in radial direction observed, with the highest values around 700 MPa reaching approx. 80% of the material’s nominal YS. This stress peak is only concentrated in the last bead on the outside of the hollow cylinder. Adjacent to this, the values drop rapidly, even into the compression range. From there, a slight increase in the distribution can be observed towards the inside of the hollow cylinder. An average of 300 MPa can be found here, although the values of the individual measurement lines vary greatly. The three measurement lines in the area where the arc stop was placed, E1 to E3 (as shown in Figure 10), basically show the same characteristics in both measurement directions as the measurement of lines A to D. The absolute values are somewhat lower compared to positions A to D. This may be attributed to the S-shape beads which increase the weld length, hence higher heat accumulated in this area could reduce the thermal gradient that helps reduce the level of the RS build up compared to the remaining section of the hollow cylinder.
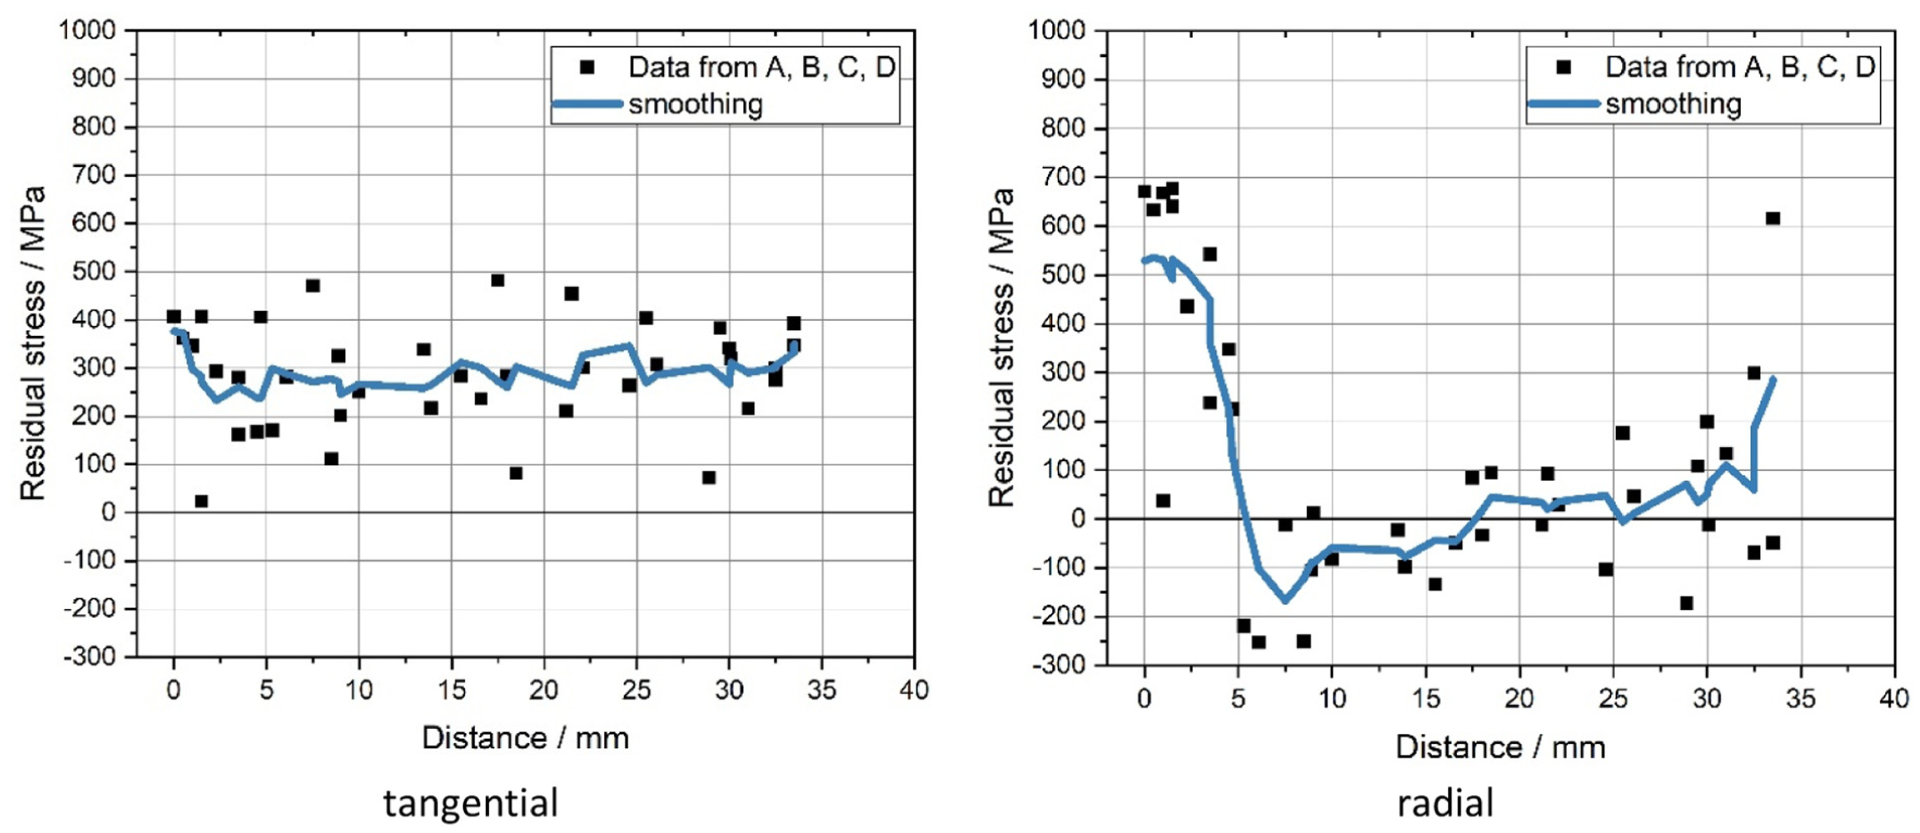
Top surface residual stress distribution in tangential direction (left) and in radial direction (right) starting from the centre of the last deposited bead including data from measurement lines A to D and smoothed curve.
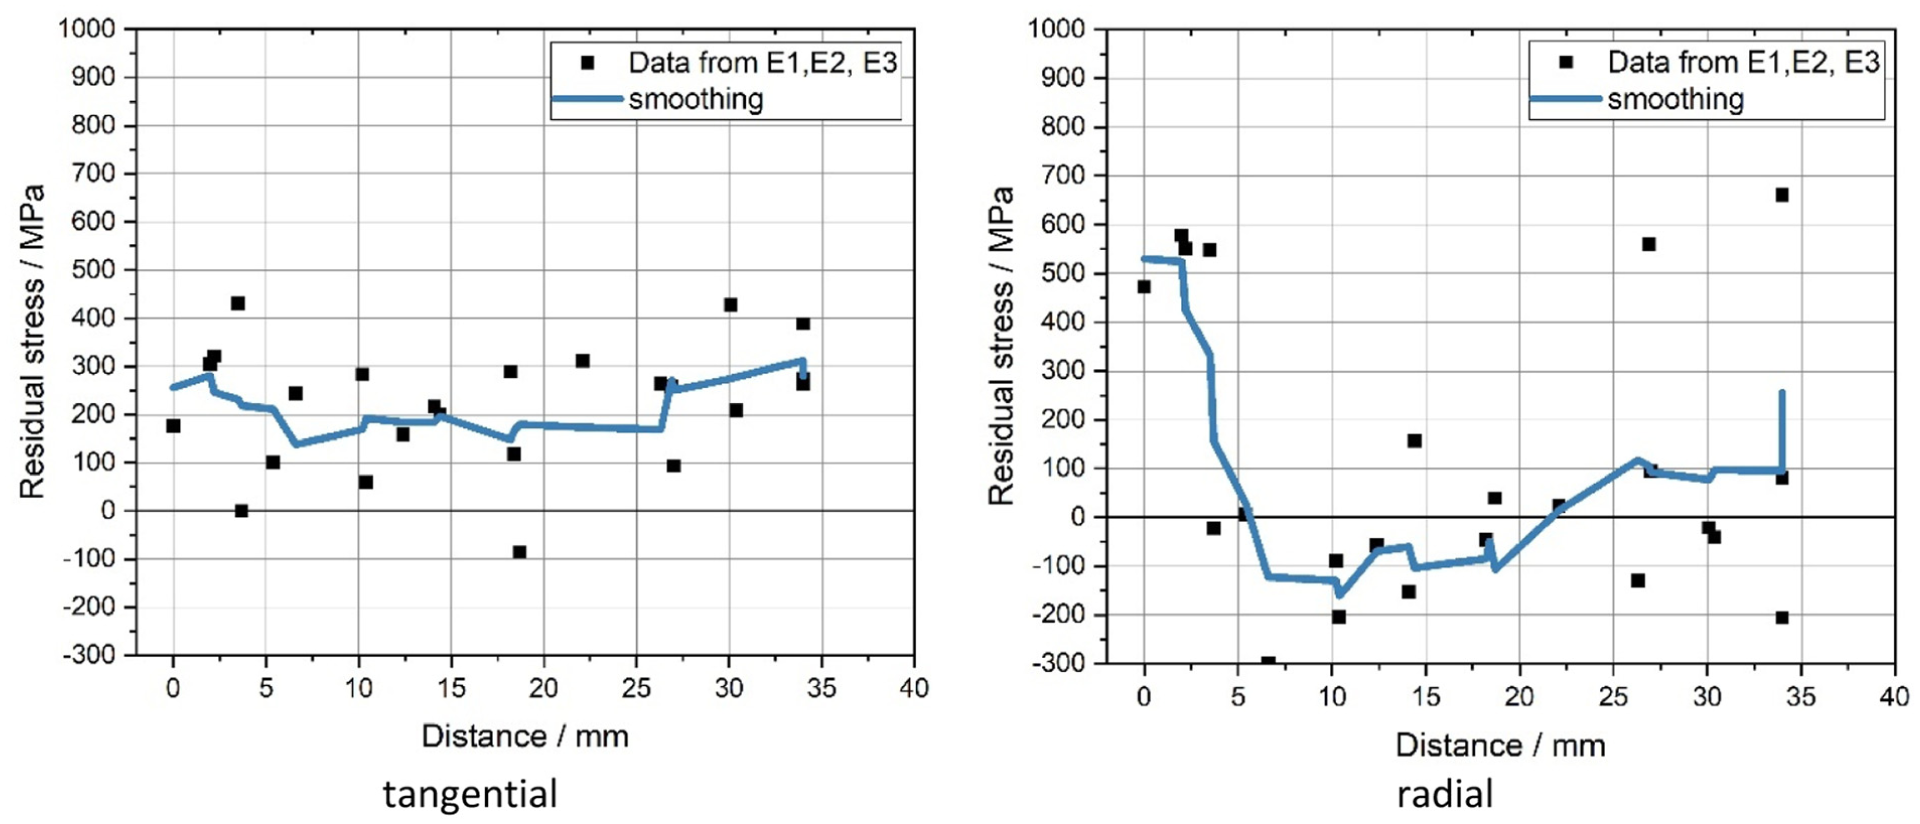
Top surface residual stress distribution in tangential direction (left) and in radial direction (right) starting from the centre of the last deposited bead including data from measurement lines E1 to E3 and smoothed curve.
The RS on the outside surface of the hollow cylinder shows similar trends as shown in Figure 11, with the tangential RS around 300 MPa which corresponds to the level already reached on the top surface in tangential direction. Towards the SP, the RS decrease to around 100 MPa. What is also worth noting is that the RS distribution on the outside surface in the axial direction has similar characteristics to the RS in the radial direction on the top surface. In both cases, the last bead shows the highest tensile RS level up to around 80% of the material nominal YS. In addition, the sharp gradient to compressive RS were also observed. Thereafter, the RS increase more sharply towards the SP and it again shows significant increase as tensile RS.
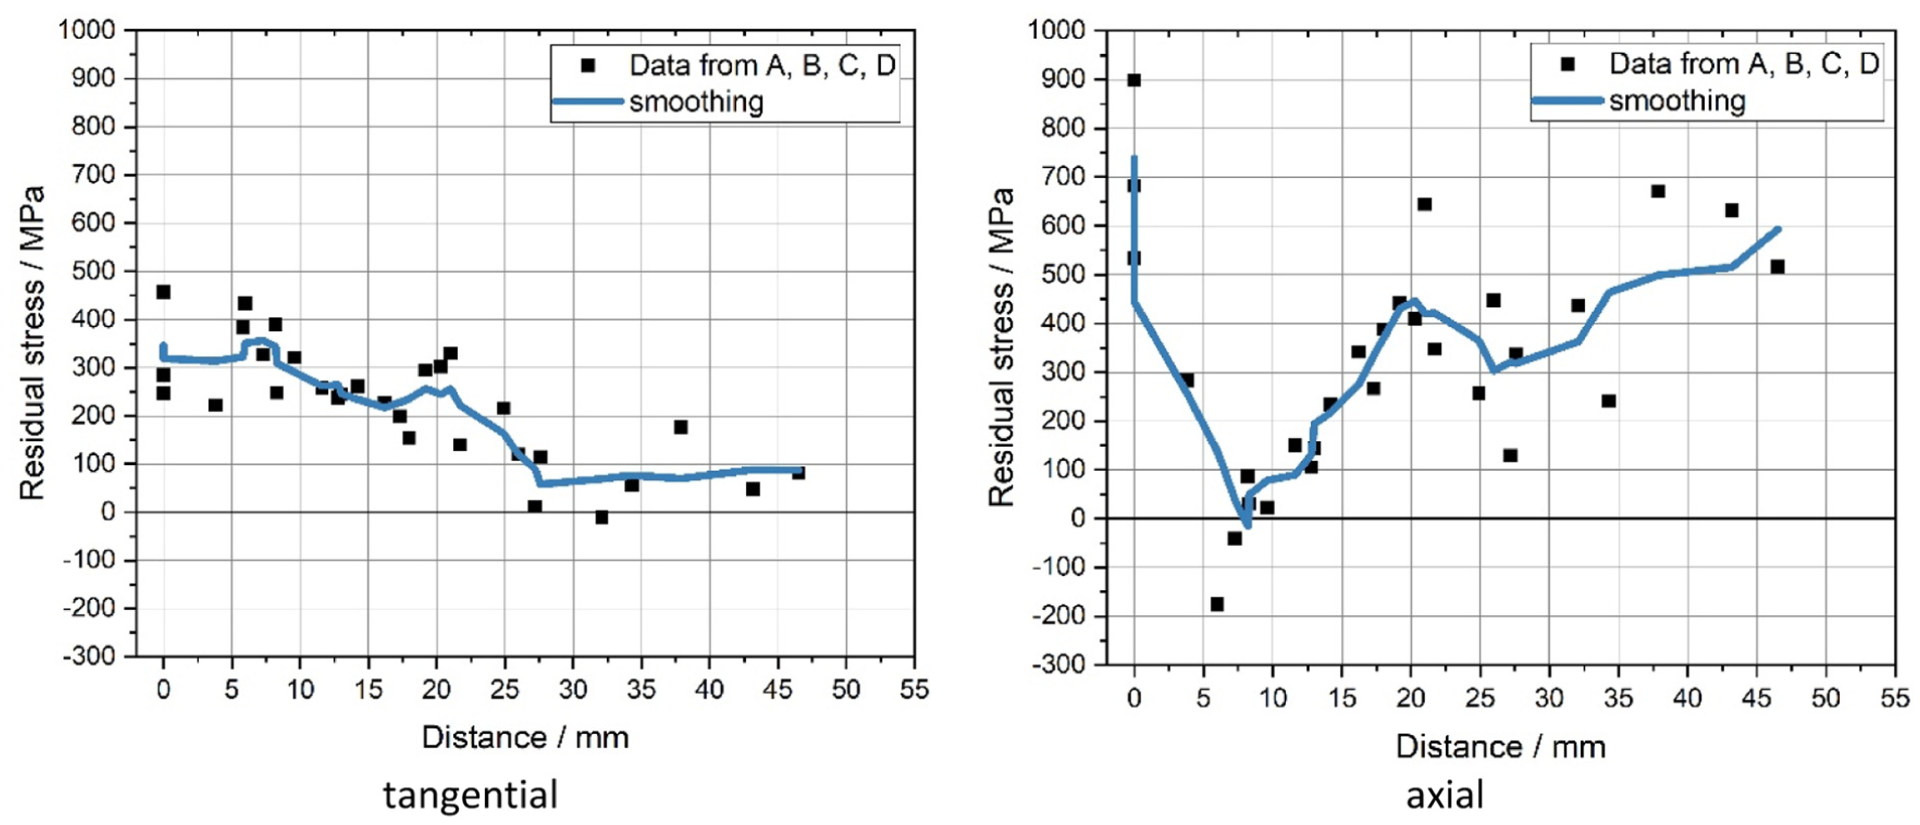
Residual stress distribution on the outside surface starting from the top layer in tangential direction (left) and in axial direction (right) including data from measurement lines A to D and smoothed curve.
While the tensile residual stresses in tangential direction on the top and outside surface are expected due to the restraint of the shrinkage during cooling, the high tensile RS maxima concentrated on the last bead of the hollow cylinder in radial direction are rather surprising, as there is comparatively little restraint on shrinkage here. Therefore, the cause of the tensile RS peak suggests the influence of so-called transformation stresses. This phenomenon, also known in welding42,43 of low-alloyed high strength steels, and is based on two effects. Firstly, compressive stresses form during the phase transformation from austenite to martensite and/or bainite due to the associated volume expansion. This could be the case as the low-alloyed high-strength weld metal applied here. This is also supported with the microhardness map as shown in Figure 8. The last bead shows the highest hardness corresponding to the non-tempered martensite of the microstructure. Secondly, the temperature differences between the surface and centre of a weld bead led to a temporal offset of the stress-generating mechanisms of restrained shrinkage and phase transformation. As a result, the volume expansion that initially takes place on the more rapidly cooling surface is hardly hindered by plastic deformation of the still warmer centre. Further cooling of the surface therefore results in shrinkage-related tensile RS, which are further increased by the compressive stresses resulting from the phase transformation in the centre. Finally, the centre bears the compressive RS, and a small surface area shows tensile RS for self-balancing the material’s internal stress states. Reheating or tempering such zones can eliminate this stress gradient which explains that the high stress only can be observed in the area of the last bead. This will be further discussed in the later section together with the results obtained from the contour method.
Intermediate zone: incremental hole drilling (before cutting off from substrate)
Figures 12 and 13 shows the results from incremental hole drilling performed before cutting off the SP, which the measurements were performed at position D and C (as shown in Figures 4 -6), respectively. The results indicate that close to the surface at the top position (position 1 and position 4, as shown in Figure 6) in the mid of the deposited hollow cylinder, compressive RS levels about −140 and −180 MPa are determined in radial direction. For both locations the RS along the depth distributions shows a gradient towards tension along the drilling depths, reaching a value of about 120 MPa (pos. D) and 220 MPa (pos. C) with a zero crossing in a depth of about 0.85 and 0.5 mm, respectively. For the tangential direction, the differences between the two measurement positions C and D are larger. Here, at the top surface tensile RS are observed, but the stress level for position D is much lower than that at position C. The tensile RS close to the surface is about 360 MPa and in a depth around 1 mm is slightly above 500 MPa, as shown in Figure 13, Pos. 4C (Top).
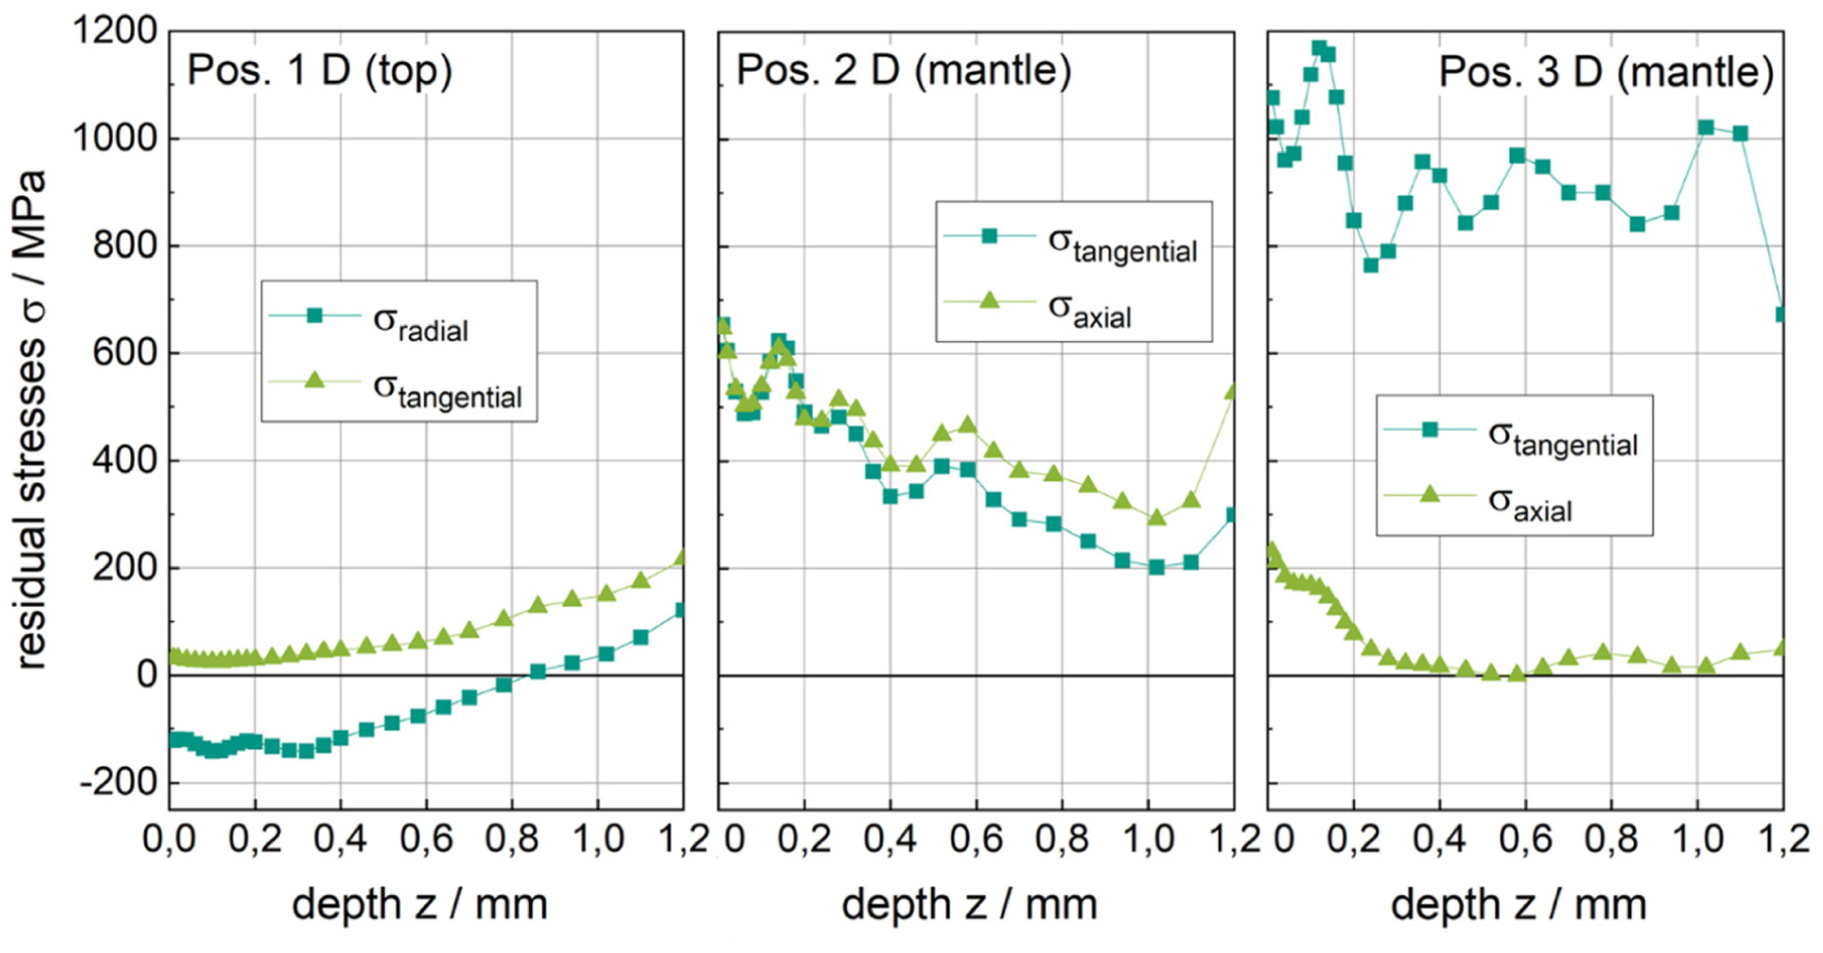
Residual stress depth distributions of the measurement positions 1, 2 and 3 (cf. Figures 5 and 7) from direction D determined by means of incremental hole drilling for the state before cutting off from the SP. Measured from the surface of the SP, the distance of measuring point 2 to it is 45 mm and the distance of measuring point 3 to it is 20.5 mm.
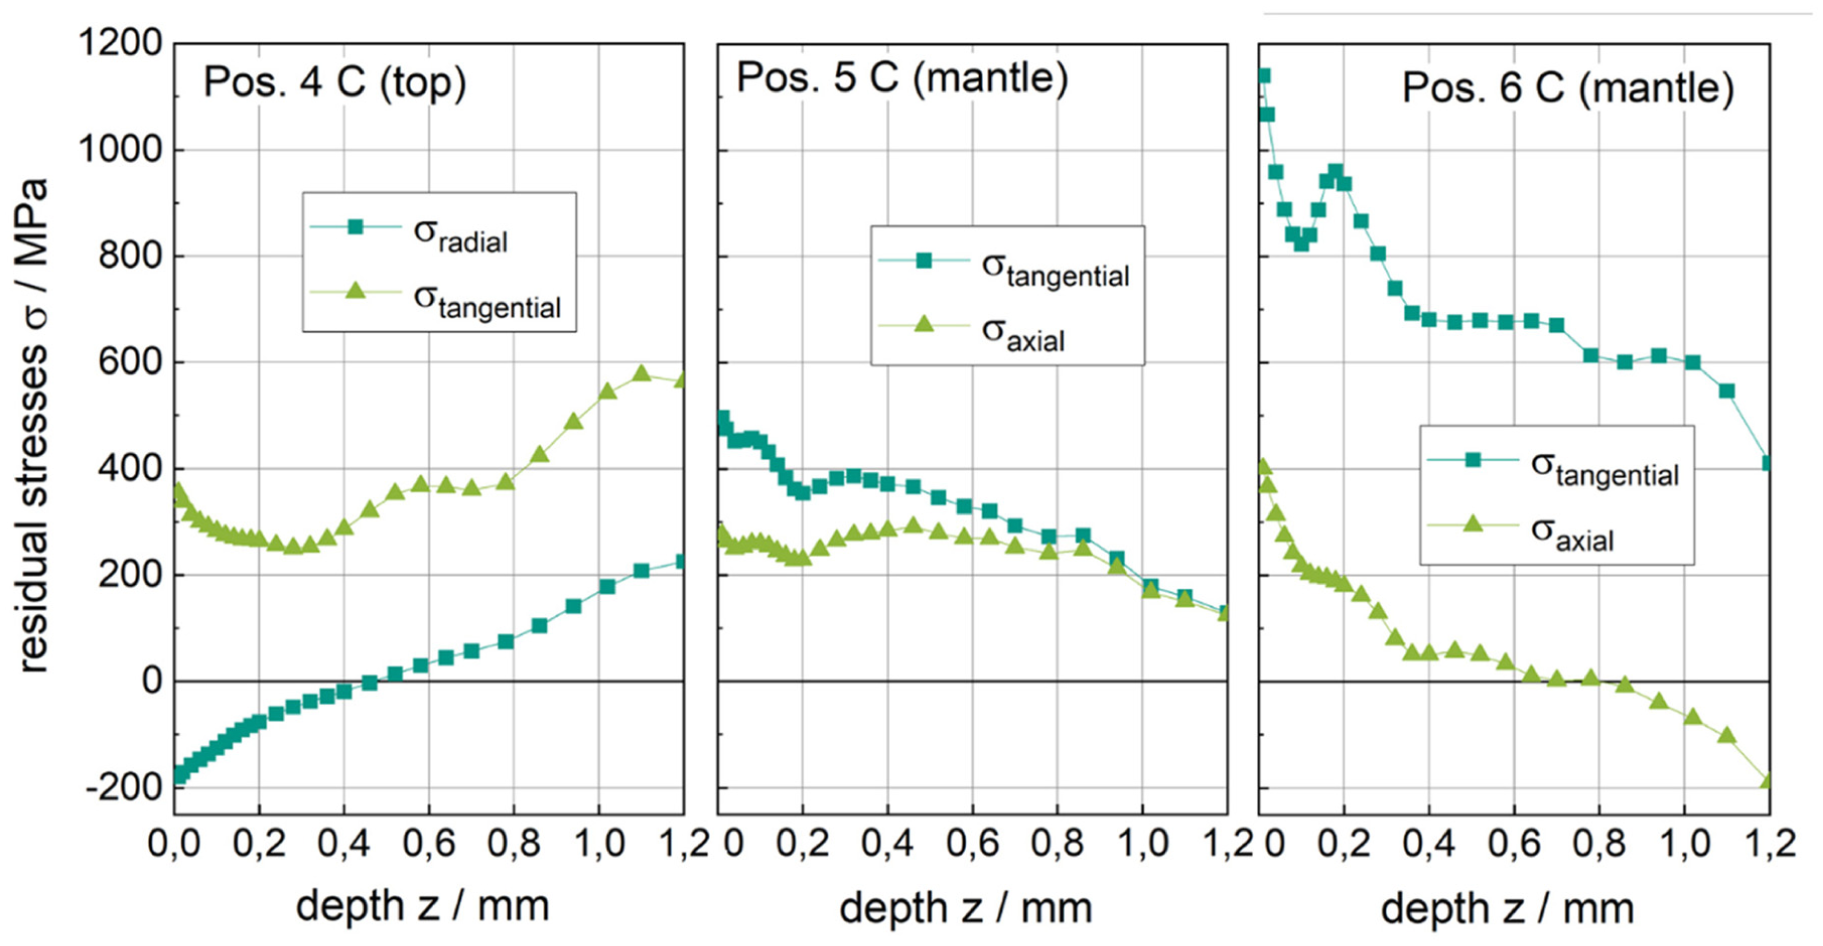
Residual stress depth distributions of the measurement positions 4, 5 and 6 (cf. Figures 5 and 6) from direction C determined by means of incremental hole drilling for the state before cutting off from the SP. Measured from the surface of the SP, the distance of measuring point 5 to it is 45mm and the distance of measuring point 6 to it is 20.5 mm.
At the outside surface the depth distribution at measuring positions D and C are in good agreement for the measuring points 2 (D) and 5 (C; as shown in Figures 4-6) closer to the top surface and points 3 (D) and 6 (C) being closer to the SP. At positions 2 and 5 the RS in both direction tangential and axial are in rather high tension close to the surface with the higher values for position 2 (D) reaching values slightly above 600 MPa. The RS distribution show a decrease with increased drilling depth around 1 mm, and the observed RS levels are in the range between about 200–300 MPa. Considering the spatial resolution and process limits of both measurement methods (XRD, IHD) as well as inhomogeneous microstructure, the results, as shown in Figures 11-13, are in good agreement.
Also, at the positions closer to the SP (Pos. 3 (D) and Pos. 6 (C)) the RS along the depth distribution in both measurement directions show a good agreement. In axial direction, the tensile RS with a peak value close to the surface is about 410 MPa (Pos. 6 (C)) and 220 MPa (Pos. 3 (D)). The distribution for the axial component shows a decreasing with increased drilling depth towards zero at Pos. 3 (D) and even into the compressive region to about −90 MPa around 1 mm at Pos. 6 (C). In tangential direction rather high tensile RS are determined for both measurement locations. At location Pos. 3 (D) strong fluctuating tensile RS between about 775–1180 MPa are observed over the entire depth analysed. At measurement Pos. 6 (C), it is also observed that the high tensile RS with a peak value reaches about 1150 MPa near the surface. At this location, a decreased trend of the tensile RS along the drilling depth was observed, which the values drop to 600 MPa around drilling depth of 1 mm.
Intermediate zone: incremental hole drilling (after cutting off from substrate)
After cutting off the SP, incremental hole drilling measurements were performed at Pos. 7, Pos. 8 and Pos. 9 (as shown in Figure 5) which are corresponding to the Pos. 1, Pos. 3 and Pos. 2, respectively. The computed RS are plotted in Figure 14. It shows that the cutting off the SP can have a big influence on the RS distribution within the deposited material. This was indicated on the macro level by the observations made when the SP exhibits large distortion after the EDM cut.
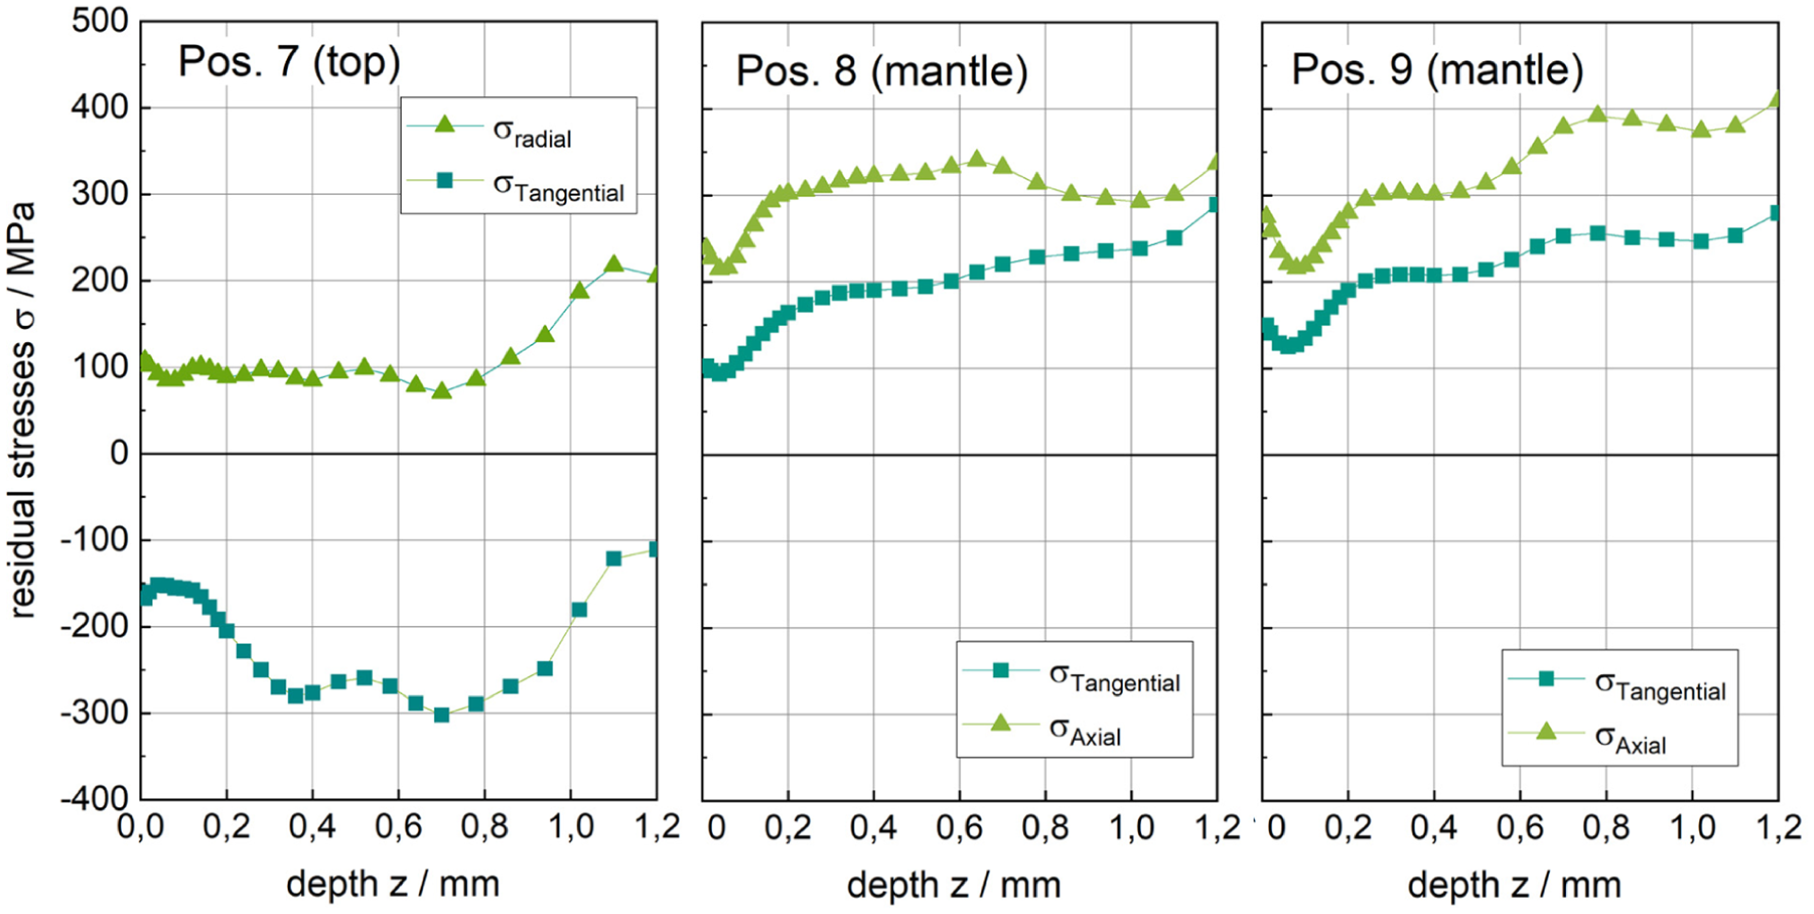
Residual stress depth distribution of the measurement positions 7, 8 and 9 (cf. Figure 5) determined by means of incremental hole drilling for the state after cutting off from the SP. Measured from the surface of the SP, the distance of measuring point 8 to it is 19.2 mm and the distance of measuring point 9 to it is 47.3 mm.
The results indicate that close to the surface, that is, at the top surface (Pos. 7 (top), as shown in Figures 5 and 14) in the mid of the deposited hollow cylinder, compressive RS are determined about −170 MPa in tangential direction. The RS depth distributions (in the range between 0.35 and 0.8 mm) show a trend towards compression along the drilling depths reaching a value between −260 and −300 MPa. With measurement depth (in the range between 0.8 and 1.2 mm) further increased, the residual stress trending towards lower compressive stress (∼-100 MPa).
For the radial direction of the RS at the top surface in the mid of the deposited hollow cylinder, a nearly constant level of about 100 MPa in tension is determined up to a depth of about 0.8 mm as shown in Figure 14, Pos. 7 (top). With measurement depth further increased, the tensile residual stress increase to around 200 MPa at the depth around 1 mm. Comparing Figure 12 (Pos. 1 (D)), Figure 13 (Pos. 4 (C)) and Figure 14, Pos. 7 (top), for both radial and tangential directions, the residual stress levels and distribution were rearranged after cutting of the SP.
After cutting off the SP, the two measurement positions (Pos. 8 (mantle) and Pos. 9 (mantle) as shown in Figure 14) at the outside surface of the hollow cylinder show a big difference comparing to the RS as shown in Figures 12 and 13 for Pos. (3, 6) and Pos. (2, 5), respectively. After the SP cut off, the residual stress measurements at Pos. 8 (mantle) and Pos. 9 (mantle) shows similar trend, with the tensile RS in tangential direction being determined between 95 and 145 MPa. Tensile RS increase with increased drilling depth to values of around 250 MPa at 1 mm drilling depth. The tensile RS determined in axial direction show the same trend as in tangential direction with slightly higher values, where the RS determined closed to the surface were between 250 and 280 MPa. With further drilling depth increase, the RS further increased between 300 MPa as shown both in Figure 14, Pos. 8 (mantle)) and 380 MPa as shown in Figure 14, Pos. 9 (mantle)).
As shown in Figure 14 Pos. 9 (mantle), the pronounced effect of RS redistribution was observed. Comparing the near-surface tangential RS shown in Figure 14 Pos. 9 (mantle) with the tangentialnear-surface RS shown in Figure 12 Pos. 2 (D) and Figure 13 Pos. 5 (C), the tangential near-surface tensile RS were reduced by ∼450 MPa after SP was cut off. In a drilling depth of 1 mm, RS were increased by ∼50 MPa. In axial direction similar findings were observed at a lower level.
Figure 14. Pos. 8 (mantle) shown the strong effect of RS redistribution as well. Comparing with Figure 12 Pos. 3 (D) and Figure 13 Pos. 6 (C), an overall stress level reduction can be observed. The tangential tensile RS near the surface reduced around 1000 MPa in average and the RS level at the drilling depth of 1 mm reduced around 850 MPa and around 350 MPa, respectively. In axial direction the redistribution effect is comparably less as the stress level and trend change due to the cutting off the SP plate is much smaller. Comparing Pos. 8 (mantle) with Pos. 3 (D) and Pos 6 (C) the near-surface RS kept nearly constant or increased slightly around 140 MPa, respectively. In a drilling depth of 1 mm RS close zero or slightly in compression have been found. Worth noting here is that the small redistribution effect of the RS due to cutting off the SP corresponds well with the distortion of the cut surface during the EDM cut in axial direction as shown in Figure 7.
Bulk: contour method (hollow cylinder after cutting off from substrate)
Figure 15 shows the 2D plots of the tangential RS determined using the contour method. The small partial images on the left of the Figure 15 represent the RS distributions over the cross sections of the individual cuts, Cut 1 and Cut 2 as shown in Figure 6. Since both measurements show a rather similar distribution, an average was calculated and shown as a big image at the centre in Figure 15. All corners show tensile RS reaching values of about 300–350 MPa. These tensile RS are balanced with compressive RS (around −350 MPa) at the centre of the deposited material. Some details are worth noting, that is, large localised compressive RS spot observed at the upper corner where very high compressive stress reaches about −800 MPa. About 25 mm below this compressive area a tensile RS area (max. 376 MPa) was also observed. As explained in the earlier section on the surface RS, the compressive stress developed due to the effect of time-delayed phase transformation.42,43 It is also noteworthy that the RS on the surface in the tangential direction are locally less influenced by this than in radial or axial direction. Similar phenomena are known from welding,42–44 where compressive longitudinal RS in the core often lead to unexpected high tensile transverse RS in a narrow surface layer. This kind of results are not often presented as it involves the different measurements from X-ray and neutron diffraction or the contour method and analysed through numerical simulations. Apart from this, it is often observed in additive manufacturing 45 that compressive RS are predominantly present at the centre of the deposited material, which are in equilibrium with the tensile RS at the outside of the structure. This is often described, but not all cases are quantitively investigated. Case-by-case investigations on the localised RS distribution such as presented in this work may be needed.
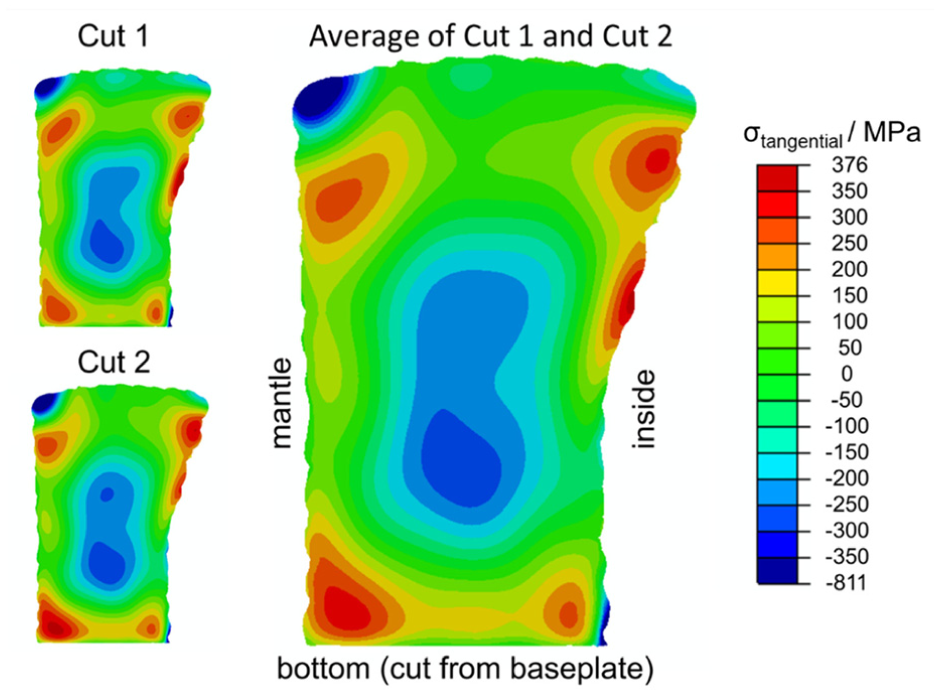
Representative 2D contour plot presenting the tangential residual stress component over the hollow cylinder cross section for Cut 1, Cut 2 and the Average of both cuts – results of the residual stress analysis by means of the contour method.
Evaluation of residual stress for design of AM-DED-arc components
There is consensus that in most cases tensile RS decreases fatigue strength, while compressive RS causes an increase of fatigue strength.46,47 For fatigue assessment, long range RS (equilibrium in the entire component) on a macroscopic scale are treated as load mean stresses.48–50 In fatigue assessment of welded components, the current design guidelines consider the effect of RS5,6 together with low mean stresses (stress ratio R < 0.5). The International Institute of Welding (IIW) recommendation 6 allows the application of an enhancement factor f (R,RS) for RS that can be categorised as “low,”“moderate” or “high” by multiplying with the original fatigue class (FAT). The design guideline of the “Forschungskuratorium Maschinenbau e.V.” (FKM, in German) 5 introduced the RS factor KE,σ(RS). KE,σ is multiplied with the mean stress factor KAK⊥(Mσ(RS)) by taking the mean stress sensitivity (Mσ) into account. In both design guidelines, a factorial distinction is made between “low,”“moderate” and “high” RS. The definitions of the classifications are more of a qualitative nature and are handled differently in the guidelines for classification of “moderate” and “high” RS.
Although the production of the AM-DED-Arc component is categorised as primary forming, it is currently not defined how such components are designed and where verification points on the AM-DED-Arc component are to be set (transition to the SP, layer-wise). Provided that AM-DED-Arc components are allowed to be treated as welded components, the results of the RS analysis performed in our work are assessed according to the aforementioned classifications (Table 6).
Overview of the determined maximum near-surface residual stresses on the AM-DED-Arc component as a function of possible load cases and classification of the residual stresses in the fatigue assessment at low medium stresses (R < 0.5) according to current guidelines.
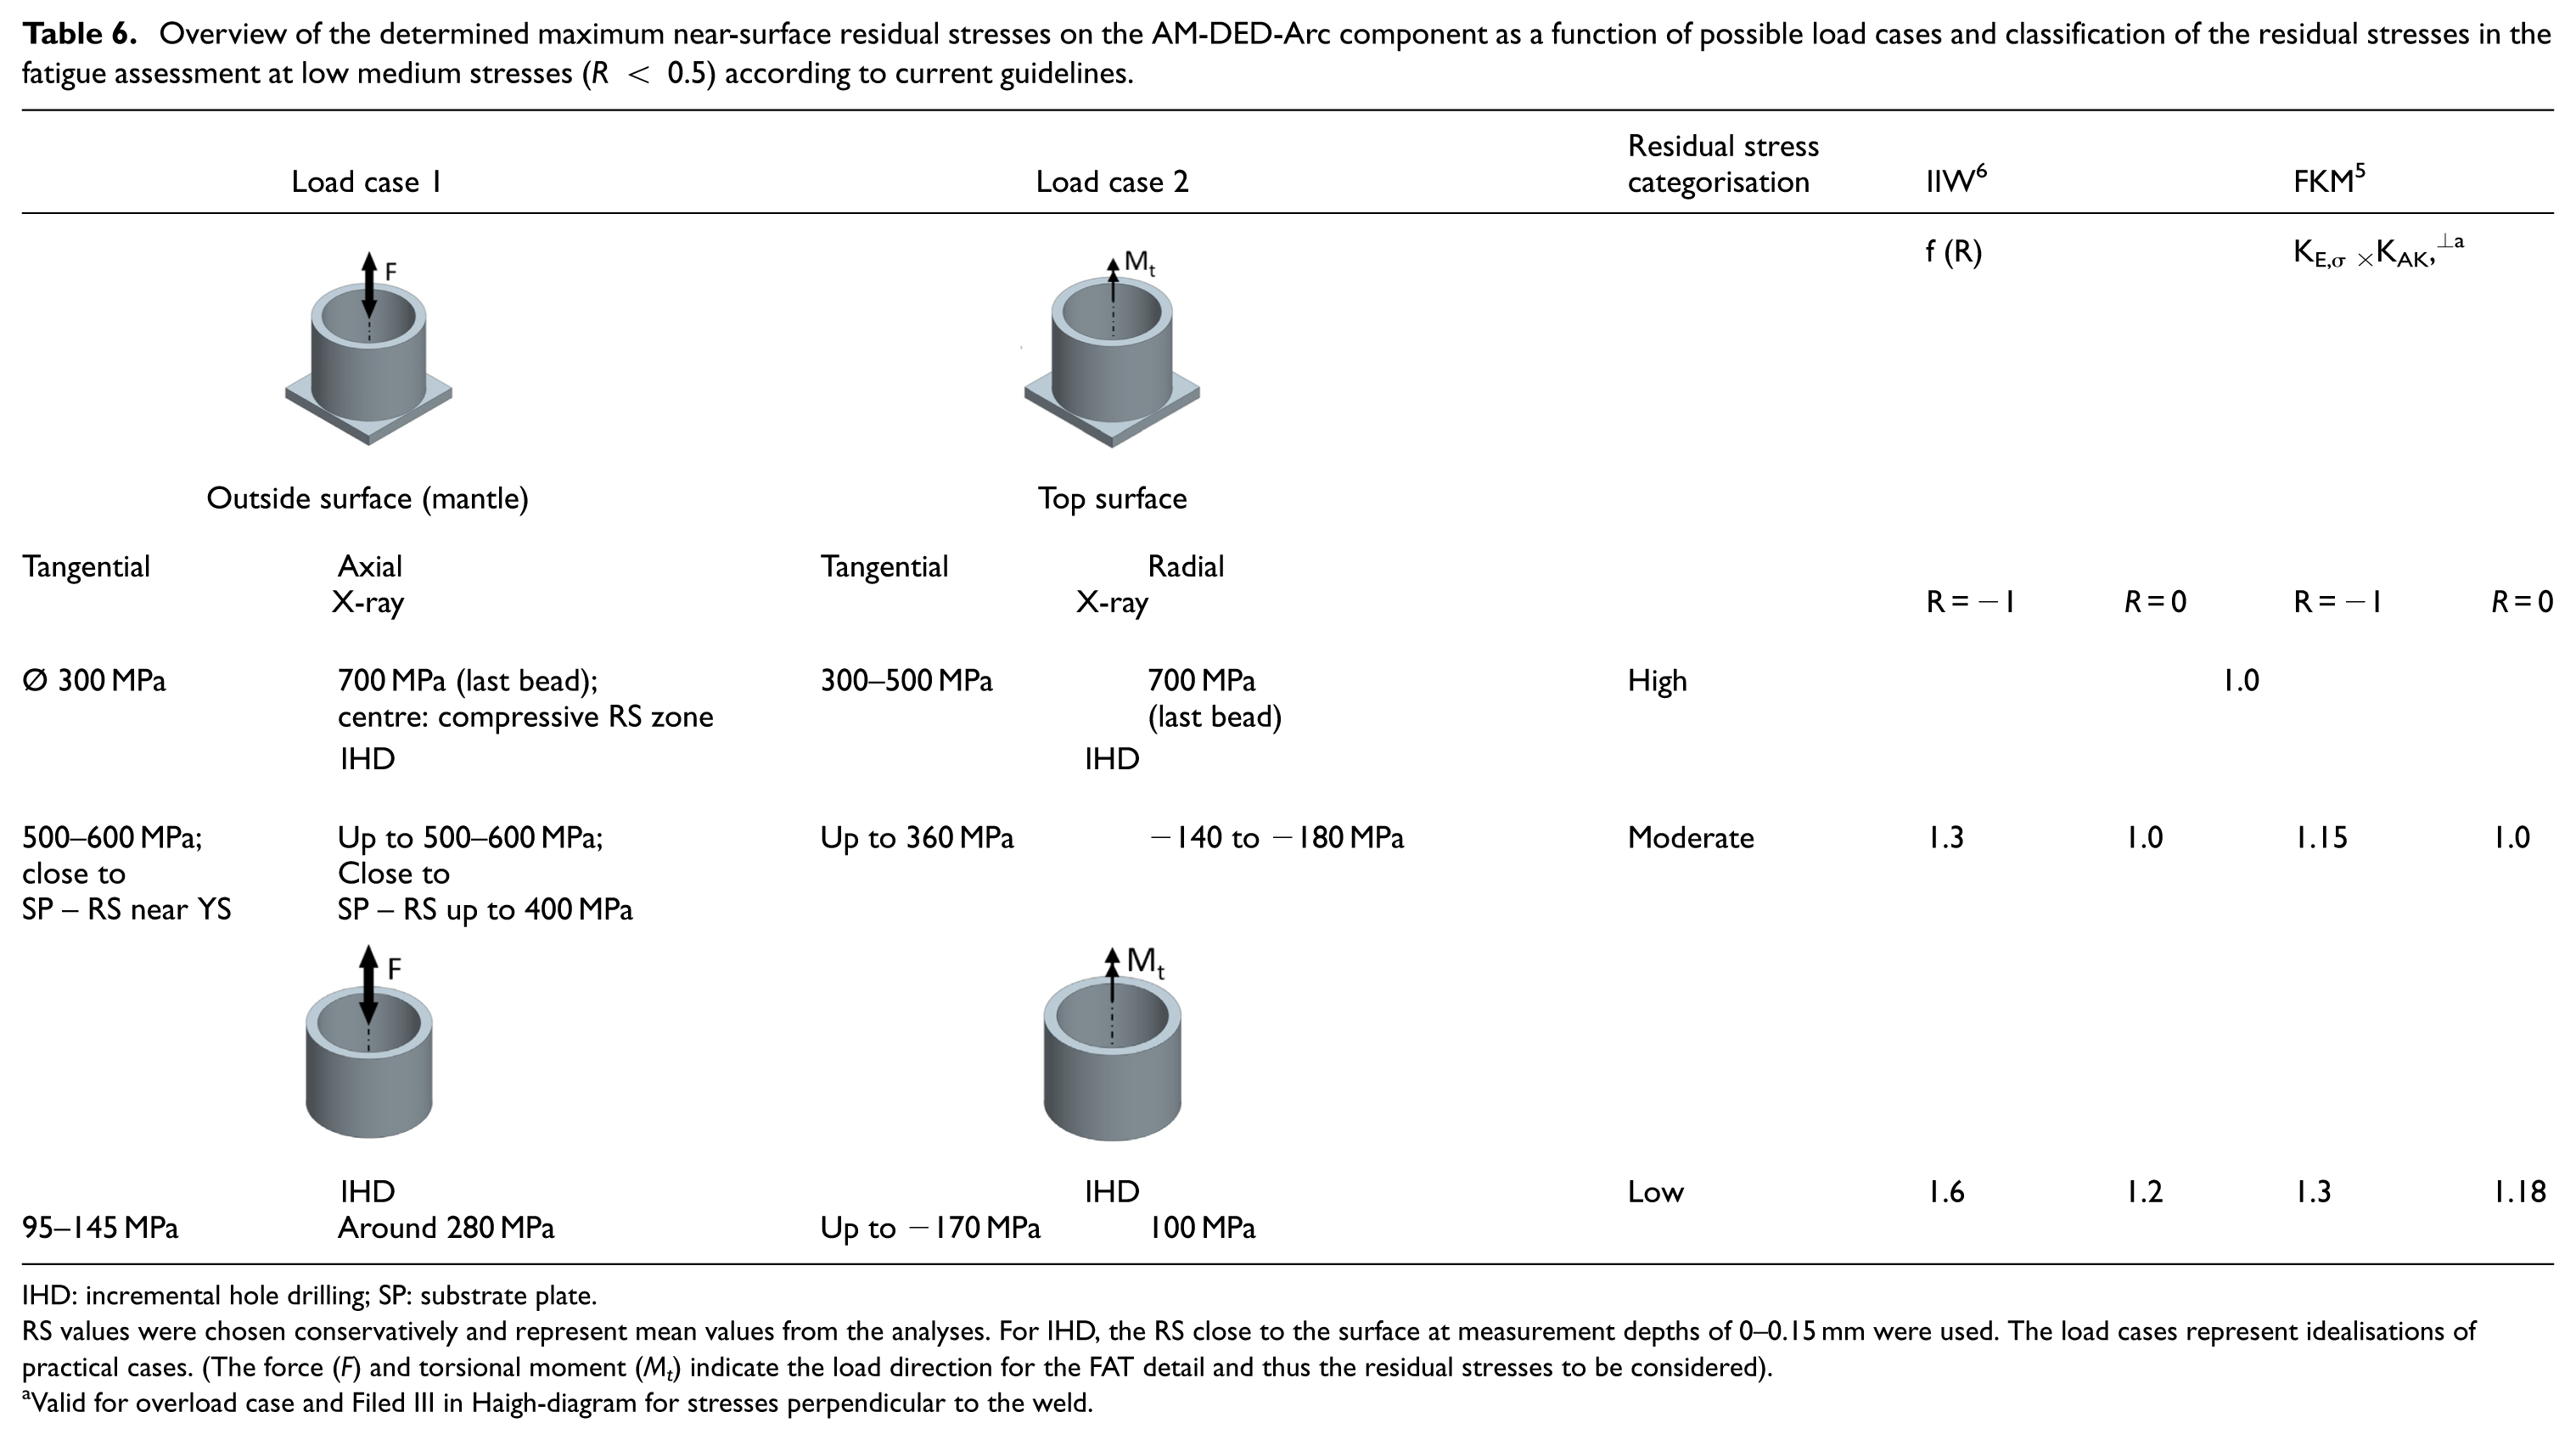
IHD: incremental hole drilling; SP: substrate plate.
RS values were chosen conservatively and represent mean values from the analyses. For IHD, the RS close to the surface at measurement depths of 0–0.15 mm were used. The load cases represent idealisations of practical cases. (The force (F) and torsional moment (M t ) indicate the load direction for the FAT detail and thus the residual stresses to be considered).
Valid for overload case and Filed III in Haigh-diagram for stresses perpendicular to the weld.
Both design guidelines limit low RS at 20% of the YS of the material used. Based on the measured yield strength (∼850 MPa) of the deposit as listed in Table 3, the maximum RS determined in our work exceed this limit in the as-built state in which the SP is attached. No direct quantitative measure is given to distinguish between “moderate” and “high” RS within the above-mentioned classifications. However, both guidelines consistently define “high” RS as conditions in thick wall structures without defining the wall thickness. In our current work, we assume our deposit as thick-walled structure (potentially high tensile residual stresses), an enhancement factor of 1.0 must be used regardless of the manufacturing condition of the AM-DED-Arc component and load case as shown in Table 6. Meanwhile, the definition of moderate RS level as well as the direction-dependent interaction of RS in interaction with the present load case is not sufficiently addressed in the design codes.5,6 This could lead to the selection of more favourable RS factors. However, after cutting off the hollow cylinder from the SP the highest measured tensile RS are less than 50% of YS of the deposited material as shown in Figures 14 or 15. This stress level is not to be considered as “high.” Rather “moderate” RS are present. Assuming the loading of the investigated AM-DED-Arc-component is fully reversed (R = −1), this would mean an enhancement factor of 1.30 and 1.15, according to the IIW recommendation 6 and FKM guideline 5 may be valid, respectively. After SP was cut off, the RS measured in our work are mostly below 20% YS of the deposited material. Depending on the measuring direction, RS reach to maximum 33% of YS of the deposited material (Table 6). If the RS in both measurement directions are considered in the design via an equivalent stress as well as the fact that high compressive RS in the volume could affect the RS factor KE, it is conceivable to apply “low” RS for a AM-DED-Arc component in the design after cutting off SP.
In the case of the remaining SP, design verification is conceivable at several points on the DED-Arc component. For example, the transition between the AM-DED-Arc structure and the SP exhibits high tensile RS, while the individual weld seams of the actual AM-DED-Arc structure are also exposed to different levels of RS. With reference to the RS state, future investigations should focus on the cyclic RS stability and further quantitatively categorise the RS in the design.
Summary and conclusion
The aim of the study was to experimentally determine the RS state on a thick-walled AM-DED-Arc (GMAW-based) demonstrator and to evaluate the influence of the cutting off process of the component from the SP. Complementary methods of RS analyses were applied to gain a holistic insight into the RS distributions introduced during deposition using AM-DED-Arc. The obtained results are expected to be helpful for AM-DED-Arc components’ design, where the RS level and distribution can be considered during design stage. In addition, the findings are also used for testing the load cases and classification of the RS in the fatigue assessment. RS on the hollow cylinder top surface and outside surface were measured using XRD and using IHD. The latter method was used to evaluate the RS before and after cutting off SP. The contour method served to evaluate RS (tangential component) within the deposited material after cutting off the SP. The current design guidelines together with the determined RS were discussed and evaluated.
Based on the results obtained within our current work, the following conclusions can be drawn:
The RS state for the AM-DED-Arc demonstrator examined here is asymmetrical. Only by utilising the advantages of the various measurement methods, the actual residual stress state of such components can be analysed, thereby promoting the design of such components.
Deposition strategy (the continuous spiral toolpath) has minimum impact on the RS distribution. Bead threshold of this deposition strategy seems to be no structural imperfection of the component in terms of RS.
Tangential direction: Tensile RS are formed due to shrinkage-constraint on the top surface and outside surface of the component.
In radial direction of the component exhibiting less shrinkage-constraint, high tensile RS are generated assumably by time-shifted phase transformation between the corner and the volume of the component in the last bead of the top layer. These tensile RS are offset by compressive RS in the volume.
With decreasing distance to the SP, high tensile RS at yield point level could be determined on the outside surface of the hollow cylinder, which suggests the transition to the SP to be considered when design AM-DED-Arc component.
With reference to the determined RS prior to removal of the SP, the RS must be set to “high” for this production state of the component following current design guidelines.
Based on the RS analyses, the RS distribution is non-symmetrical, critical locations of AM-DED-Arc components are recommended to be measured and verified.
After cutting off the AM-DED-Arc hollow cylinder from the SP, tensile RS of <50% of the material yield strength are achieved by a significant redistribution of the RS; at some design-relevant locations, values below 20% of the material yield strength are even determined. Such low RS can justify the use of associated enhancement factors in the fatigue assessment according to Table 6.
Although 3D printed component using AM-DED-Arc experienced complex thermal history and surface waviness leading to complex RS distribution, it still can be characterised as-built by using existing RS analysis techniques. This work employed these techniques and obtained results were complementary with each other, which was able to provide us a rather completed overview of the RS distributions. The obtained results can contribute and be helpful for future RS investigations, either experimentally or numerically, on the 3D printed components by AM-DED-Arc.
The current study shows the significant effect of the redistribution of RS in big scale AM-DED-Arc structures after the component is released from the SP. A high degree of RS relaxation was determined in this work, which shows that the general consideration of “high” or “close to the yield point” tensile RS in such thick-walled components is rather over-conservative. Therefore, current general definition of RS of thick-walled components in the design guidelines should take the manufacturing condition into account. The consideration of several RS analysis directions and the interaction with the RS in the volume of deposited material appears valuable in this context.
Footnotes
Acknowledgements
The authors would like to thank the RAMLAB B.V. team for the 3D printing and for making the component available for scientific purposes.
Funding
The authors disclosed receipt of the following financial support for the research, authorship, and/or publication of this article: The results obtained in this study were partly funded by the IGF 21162 BG and IGF 22.585 N projects by the German Federal Ministry of Economic Affairs and Energy.
Declaration of conflicting interests
The authors declared no potential conflicts of interest with respect to the research, authorship, and/or publication of this article.
Data availability statement
The data that support the findings of this study are available from the corresponding author, Jonny Dixneit, upon reasonable request.