
Abstract
Space instruments are designed to be highly optimised, mass efficient hardware required to operate in extreme environments. Building and testing is extremely costly, and damage that appears to have no impact on performance at normal ambient conditions can have disastrous implications when in operation. The Mid-Infrared Instrument is one of four instruments to be used on the James Webb Space Telescope which is due for launch in 2018. This telescope will be successor to the Hubble Space Telescope and is the largest space-based astronomy project ever to be conceived. Critical to operation of the Mid-Infrared Instrument is its primary structure, which provides both a stable platform and thermal isolation for the scientific instruments. The primary structure contains strain-absorbing flexures and this article summarises how these have been instrumented with a novel strain gauge system designed to protect the structure from damage. Compatible with space flight requirements, the gauges have been used in both ambient and cryogenic environments and were successfully used to support various tasks including integration to the spacecraft. The article also discusses limitations to using the strain gauge instrumentation and other implications that should be considered if such a system is to be used for similar applications in future.
Introduction
The James Webb Space Telescope (JWST 1 ) is an observatory-class spacecraft intended to serve the worldwide astronomy community following the example of the Hubble Space Telescope, whose scientific output has revolutionised space-based optical astronomy since it was launched in 1990. JWST is currently scheduled for launch in 2018, and its four science instruments have been delivered to NASA for integration onto the spacecraft. Each science instrument is designed to operate in the near- and mid-infrared or short-wave visible regions of the spectrum. The instruments are accommodated in a thermal environment at 40 K, but the Mid-Infrared Instrument (MIRI1–3) is additionally cooled to ∼6 K. In order to minimise the load on the cooling system, the mounting arrangements must provide for a high degree of thermal isolation.
Largely thermal considerations have led the JWST MIRI European Consortium to specify a carbon fibre–reinforced polymer (CFRP) hexapod with rigidised invar end fittings and brackets to form part of the ‘primary structure’ of the instrument. 4 Each bracket incorporates a pair of orthogonal flexures to provide quasi-kinematic mounting to JWST.
In order to provide continuous measurement of the response of the primary structure hexapod to integration, g release and thermoelastic loads, we have installed a strain gauge array on the flexures.
This article summarises how the strain gauge instrumentation was designed, qualified and used during the project, including during integration of MIRI onto the spacecraft. We present the key measurements and a comparison with finite element (FE) model predictions, demonstrating the importance of the device in mitigating risk of structural distortion and misalignment of the instrument.
MIRI and primary structure description
The MIRI consists of a mid-infrared spectrometer and imager mounted on a supporting primary structure. The primary structure is made up of two principal elements, the hexapod and the deck. These are shown in Figure 1.
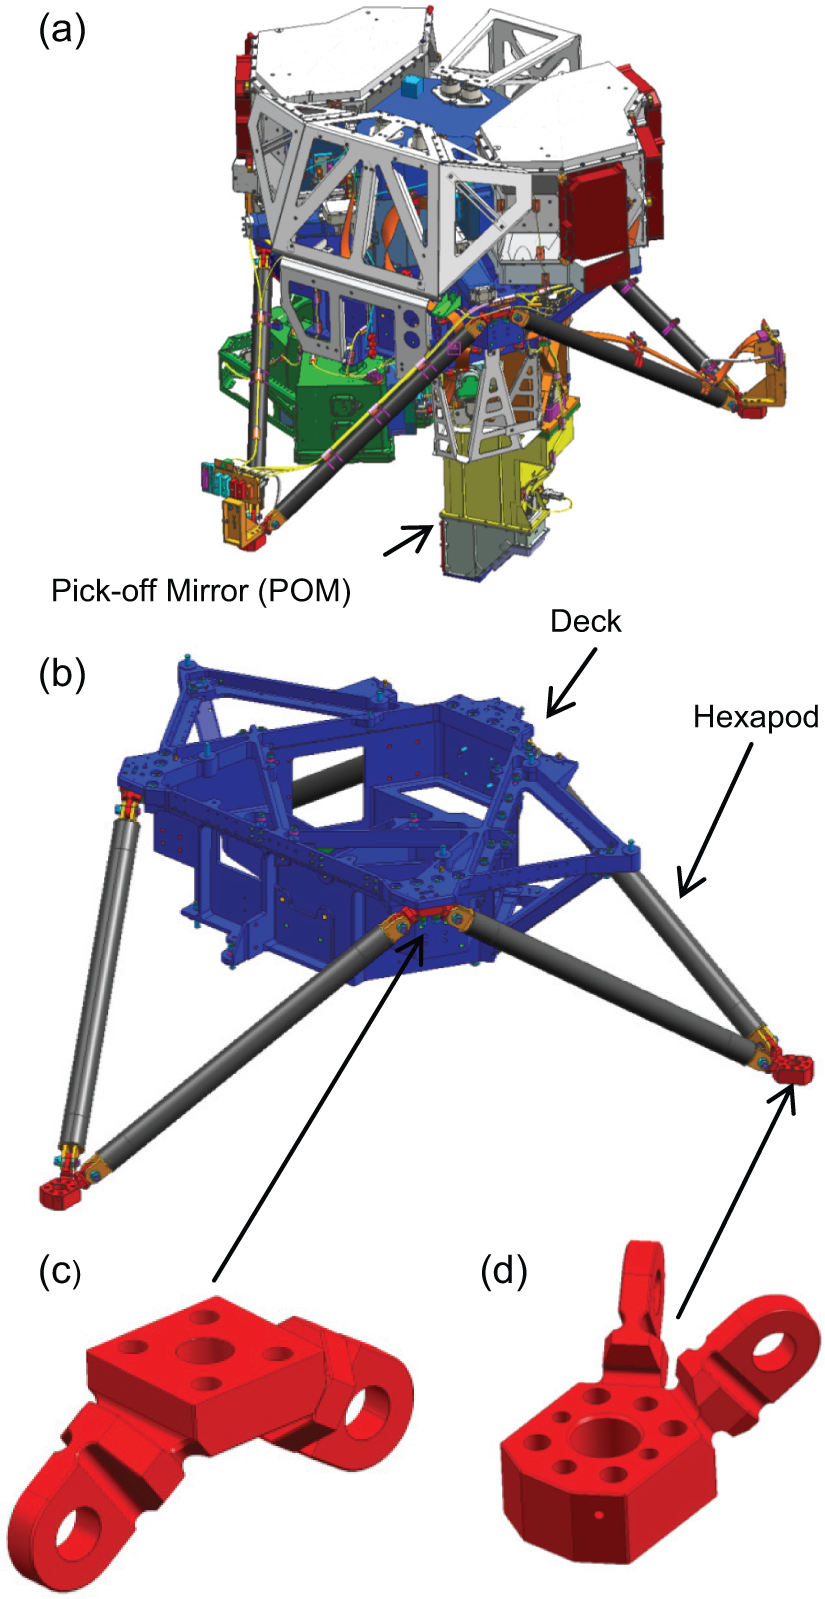
MIRI: (a) instrument CAD model, (b) instrument primary structure, (c) upper hexapod to deck invar bracket and (d) lower hexapod to spacecraft invar bracket (images created using Siemens NX).
Light from the spacecraft is directed to the instrument by a pick-off mirror (POM) mounted to a periscope structure below the instrument feet (Figure 1(a)). Maintaining alignment of the POM in relation to the telescope is a primary requirement for the instrument to function correctly in orbit. The POM can translate up to 1 mm and rotate up to 2.2 × 10⁻⁴ rad in all directions before performance is degraded to an unacceptable limit. The instrument optical bench assembly is of isothermal construction in aluminium alloy in order to maintain internal alignment as the instrument cools from ambient to 6 K. The instrument is contained within the Integrated Science Instrument Module (ISIM) of the spacecraft, which is kept at ∼40 K. To minimise loads on the MIRI cryocooler, the MIRI primary structure must provide thermal isolation. This is achieved by a carbon fibre hexapod, 4 supplied by Technical University of Denmark, with invar end fittings and brackets that connect to an aluminium optical bench, called the deck (Figure 1(b)), supplied by the University of Leicester. At each apex of each hexapod bipod, the CFRP struts connect to invar brackets via invar end fittings. Invar was specified for thermoelastic compatibility with the CFRP and was gold plated for surface passivation. At the base of the hexapod, the brackets provide interface to the spacecraft and at the top they connect to the deck. This requires two different bracket designs to be adopted (Figure 1(c) and (d)).
In order to meet thermoelastic and dynamic requirements, each bracket is equipped with flexures, such that the entire arrangement provides quasi-kinematic mounting. Each bracket has four flexures and this compliant characteristic gives rise to the need to ensure that variable and asymmetric strains are not built into the system during assembly.
The MIRI was built, tested and aligned to a fixture reference in Europe, in the absence of the JWST spacecraft to which it was to be installed. On the spacecraft, the instrument was installed onto ISIM, with the plane of the hexapod feet vertical. In this orientation, gravity effects on an unbraced hexapod are at their most complex. It was this integration step that was the greatest cause for concern regarding the introduction of damaging strains
While integration processes were created and performed with the intention to minimise the distortions, without measurement it would not have been clear if processes were causing damage or misalignment. Therefore, active strain monitoring was considered to be a necessary integration tool for the instrument. The general principle adopted by the project team was that if the strains generated when installing MIRI onto the spacecraft were similar to those generated when installed onto test fixtures in Europe, then the installation could be assumed to be successful.
Technology selection
Two technologies were investigated for measuring strain on the flexures: fibre Bragg gratings (FBG) and conventional foil gauges. An FBG is constructed in a short segment of optical fibre by creating a periodic variation in the refractive index of the fibre core, which reflects a specific wavelength. This wavelength changes with strain and is compatible for use in cryogenic conditions due to use of vacuum compatible materials, small size and very low heat load exhibited along the 0.125-mm-diameter fibre. However, integration of the fibres proved to be extremely difficult as they had to be held in a preloaded state to measure both tensile and compressive strains. Different schemes to mount the fibres were considered, but a high number of sensors were damaged during integration and the technology was abandoned in preference to foil gauges. An important lesson learnt was that if FBGs are to be used, their implementation needs to be considered in the hardware design from the outset as they are extremely difficult to retrofit to existing hardware.
Foil gauge configuration and installation
Tokyo Sokki Kenkyujo epoxy cryogenic gauges (part ID CFLA-1-350-11) were selected as they were the smallest low temperature, low outgassing gauge found. The gauges are epoxy backed and qualified to operate from −196 °C to +80 °C and provided by the UK company, Techni Measure. 5 Temperature limits for cryogenic equipment are normally attributed to the strain gauge manufacturer’s test limitations, and therefore, the decision was taken to use them while the MIRI was in operation at 6 K, during ground testing.
The strain gauges were installed only onto the MIRI feet brackets, which provide the mechanical interface to the spacecraft. Each of these brackets was given a letter identifier, A, B and C. The invar brackets at the interface to the deck were not instrumented with gauges as the gauge cables would be routed along the struts. This would create a thermal conductive path that would reduce the thermal isolation performance of the struts.
The strain gauges were installed in a Wheatstone bridge, with two ‘reference’ gauges located at the data logger and the other two gauges at the bracket.
All four feet flexures were instrumented with strain gauges. The two strain gauges on the active side of the half-bridge were at the same position on opposite sides of the flexure. This arrangement resulted in tensile strains being removed from the measurement and only bending strain in the active direction of the flexure being measured.
The gauge arrangement, flexure locations and naming convention are shown in Figure 2.
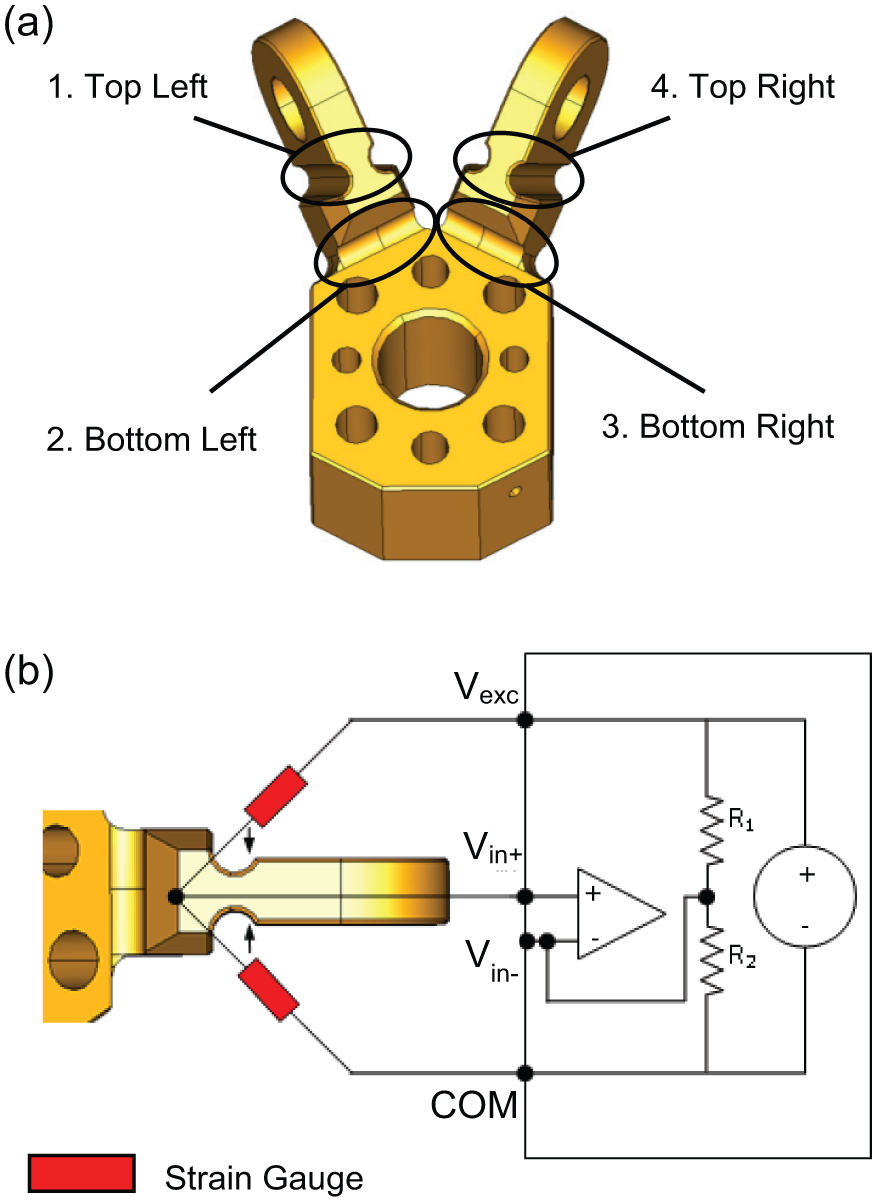
Bracket gauge configuration: (a) flexure locations and naming convention and (b) gauge setup at each flexure.
The strain output from the gauge pair is determined using equation (1) 6
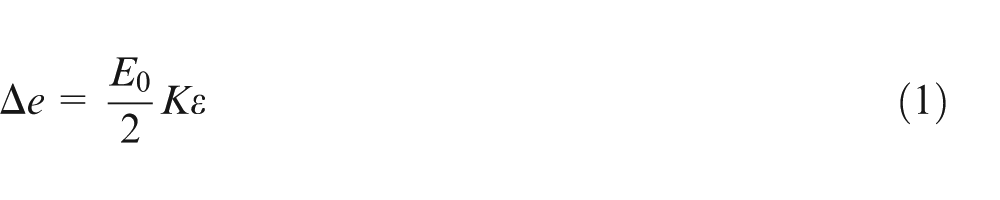
where Δe is the output voltage due to strain, E0 is the supply voltage, K is the gauge factor and ε is the strain value on the flexure at the strain gauge location.
The gauges were bonded onto the surface using adhesive. The adhesives used must be space compliant in terms of being able to survive all test and operational environments and have low outgassing rates. Outgassing is the release of gases from materials when exposed to a vacuum environment and these can cause damage to the spacecraft and scientific instruments. Outgassing tests on the recommended adhesive (see Appendix 1) found it not to be suitable for space applications, and therefore it was decided to use an approved space-compliant adhesive.
It was decided that the best adhesive to use from a space compatibility perspective was Stycast 2850-FT with catalyst 23LV. This was because the majority of adhesive bonding on JWST MIRI used this adhesive due to its excellent space heritage, good performance across instrument operating temperatures and high thermal conductivity.
To install the gauges onto the bracket, a custom tool was designed to clamp the gauges against the flexure. Prior to installation, the local area where the gauge was to be installed was very lightly abraded with a fibre tip pen to prepare the surface for adhesion. The gauges were then coated with adhesive and clamped to the surface using the tool.
Trial installations were performed with the gauges installed and cured at room temperature (18 °C–22 °C), as recommended by the adhesive supplier. However, ambient steady-state testing of the array found that the strain measurement had a tendency to wander under no load. In addition, high hysteresis was measured when loads were applied and then removed. This problem with the installation was attributed to high creep and ductility in the adhesive.
To reduce the adhesive ductility, the curing process was altered by curing the adhesive at 60 °C for 3 h and then allowing it to cool in air. This process was subsequently repeated at least two more times. When this was completed, gauge performance was found to be stable and exhibited very low hysteresis.
Figure 3 shows the overall configuration of the gauge installation on the bracket.
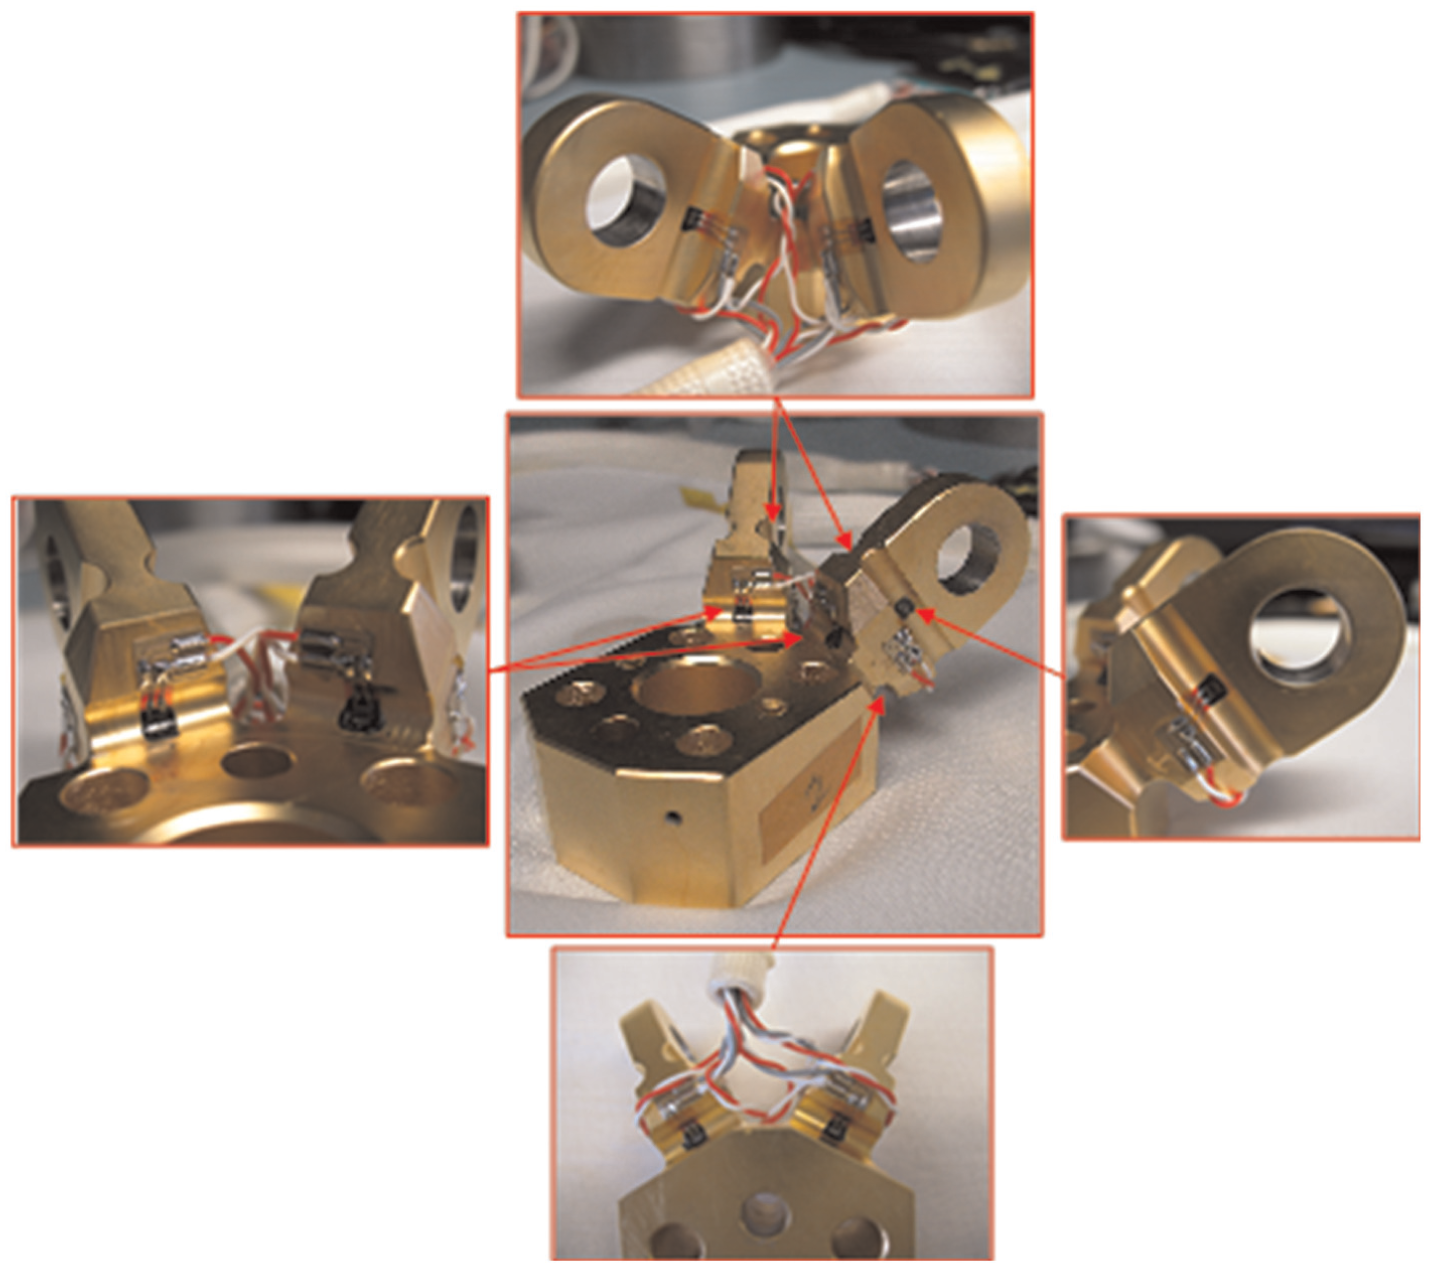
Strain gauge configuration on an MIRI foot.
The harness of the strain gauge instrumentation was not designed for flight use so the bracket and harness would be removed prior to launch. This would be performed by cutting the harness as close to the gauges as possible to prevent the wires creating a high-level signal noise should they become charged and act as antennas when in space.
The gauges were monitored with a National Instruments FieldPoint data logger installed inside a custom-made chassis suitable for clean-room use. The custom software used to read the gauges was written in LabVIEW. Data from each foot were displayed graphically and logged to file, typically at 1 reading per second during critical operations. The system was also designed to sound an alarm and turn a status bar red when strains exceed 1000 µε (microstrain) (1 × 10⁻³ ε(strain)), representing approximately 30% of yield.
FE modelling techniques
FE modelling using the Siemens I-DEAS software package was used to understand the impact of strain on instrument structural and alignment performance, with three different analysis models constructed.
There are many possible causes of flexure strains measured during integration, test or any other instrument activities. These causes include factors such as internal part tolerances, external interface tolerances or incorrect mating of components during assembly. In order to analyse directly the effect on alignment of a particular set of measured strains, it would be necessary to infer a deflected shape. It is not likely that this can be done without significant uncertainty. It is also impractical to analyse for all possible outcomes. Maximum allowable strains were therefore used as input boundary conditions in the model in order to compare the effect of maximum internal structural distortions with the instrument alignment budget. Applying a strain directly in the model as an externally applied local translation or rotation at yield level is likely to be conservative as in practice most trapped strains will be internally reacted within the structure and distributed. The extent of this is somewhat dependent on the cause of the strain and the deflected shape.
To verify that the strain gauge instrumentation measurements were correct and to also relate measured strain to instrument alignment, a detailed finite model of the MIRI foot was constructed. This model is shown in Figure 4. Displacements are applied through the bracket lug at the centre of the interface to the strut (defined as the origin of the coordinate system in Figure 4(a)), with the base of the foot fixed. By altering the position of the lug through this location, linear relationships between flexure strain and displacement could be determined in all orthogonal and rotational axes. The strains generated in the FE model flexures were related to the strain gauge instrumentation output by taking average measurements in the locations where strain gauges were mounted and calculating the resulting bending strain by equation (1).
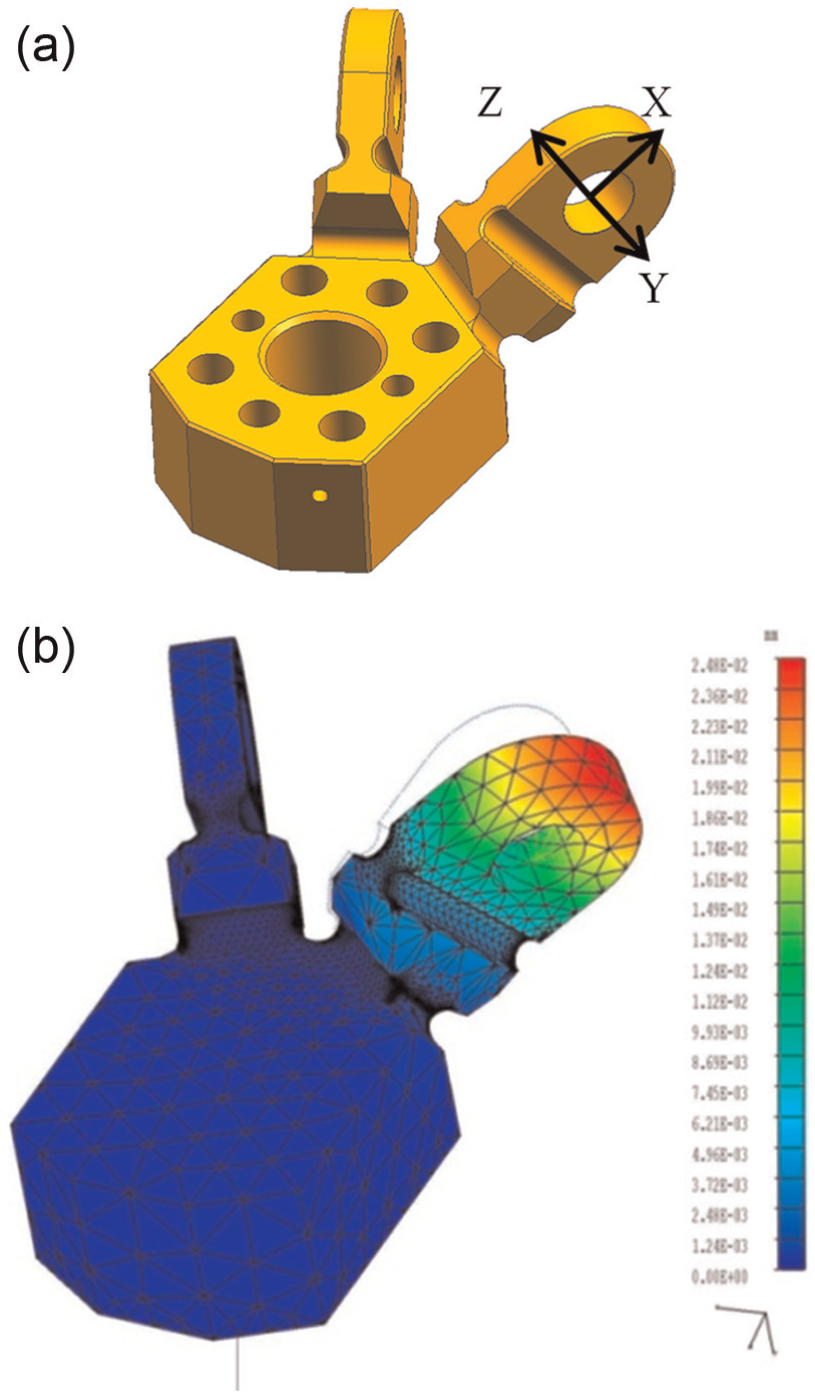
Detailed finite element model of MIRI foot: (a) location and orientation of model coordinate system where displacements are applied and (b) typical finite element model results.
Table 1 below shows the resulting equations for bracket displacement.
Flexure displacement strain relationships.
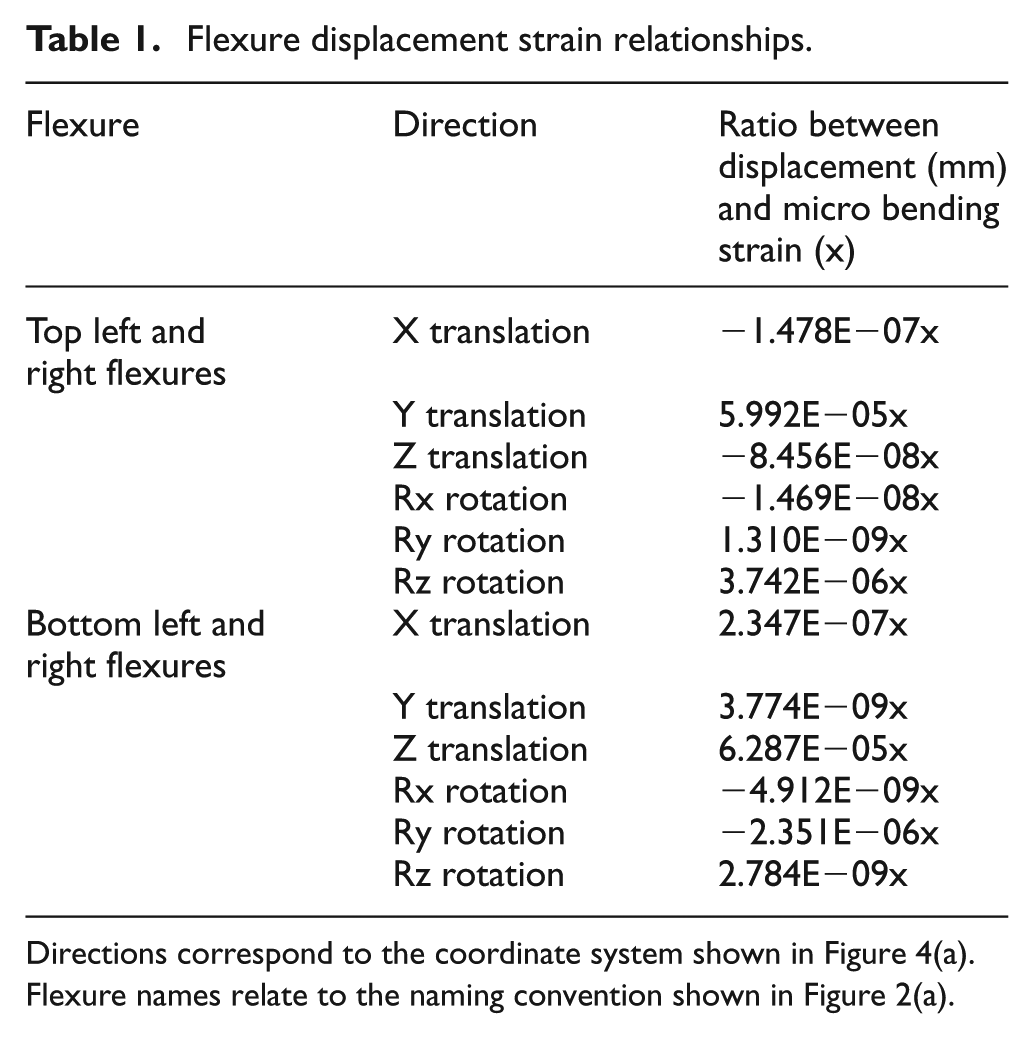
Directions correspond to the coordinate system shown in Figure 4(a). Flexure names relate to the naming convention shown in Figure 2(a).
The relationships developed at bracket-level analysis were input to two MIRI-level models. These were modified versions of the instrument models used for instrument performance verification. For one model, the detailed bracket models were incorporated into the system model and used to predict the strains for thermal and gravity events.
The other model had the feet replaced by a single node with rigid beam elements connecting it to the strut interface. The same node coordinate systems used to develop the strain displacement relationships shown in Figure 8 were applied to this node. This enabled flexure strains to be input into this model as node displacements and for the impact of flexure strains on POM positions to be investigated. This model is shown in Figure 5.
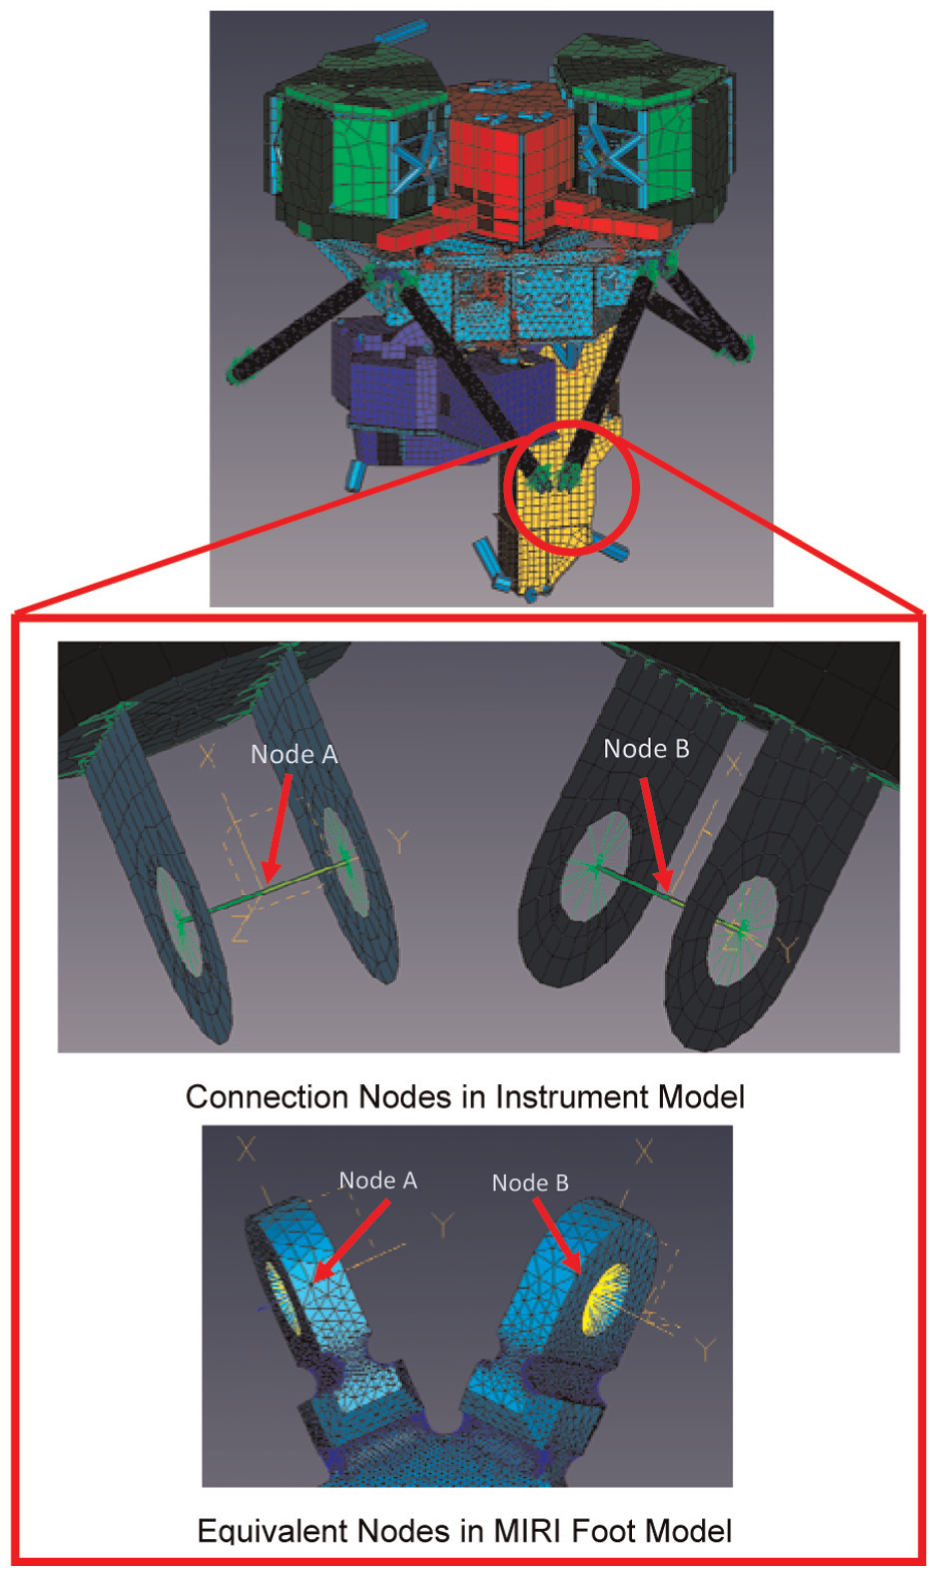
POM displacement analysis FE model.
The node was moved to the positions representative of flexure yield positions and the impact on POM position was calculated. The impact of these displacements on the alignment budget for the POM was then calculated and is summarised in Table 2.
Impact of extreme strains on POM position.
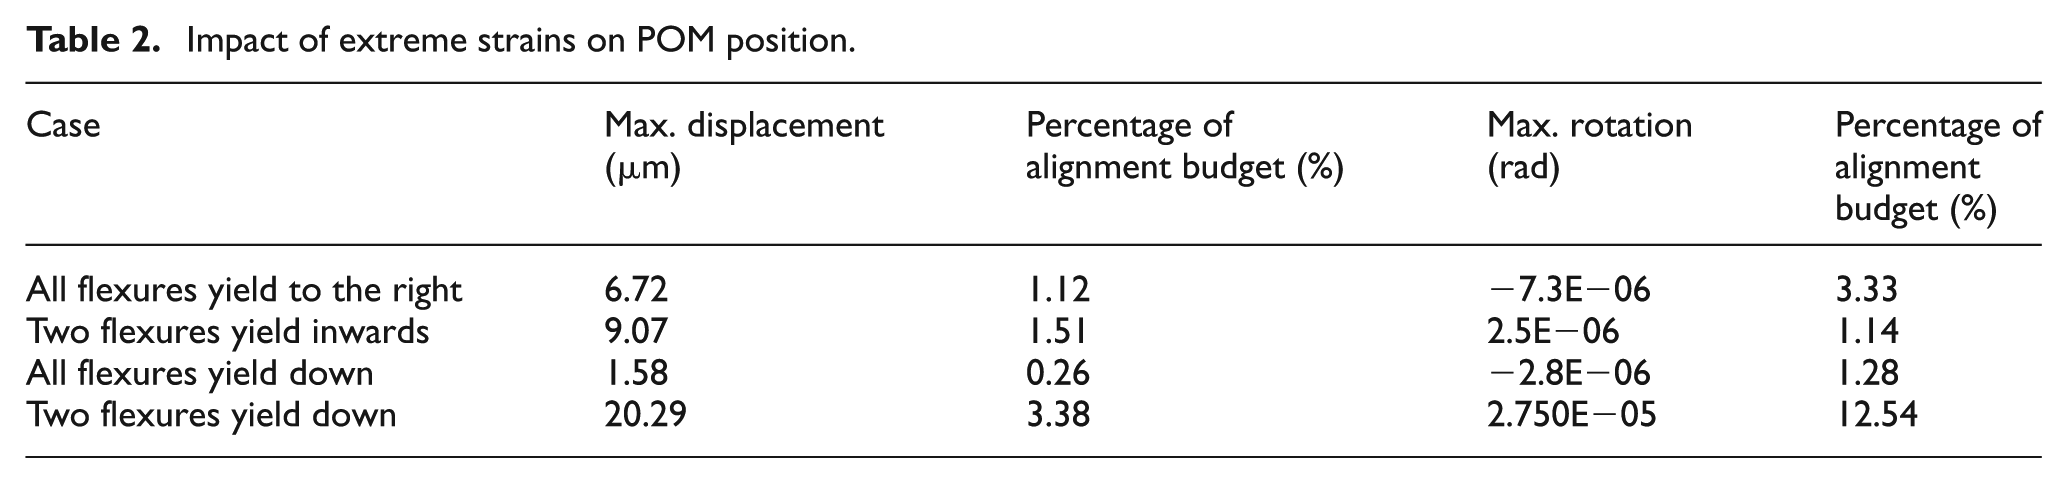
The results show that in all yield cases analysed, the yield positions correspond to a relatively small portion of the POM alignment budget. The worse-case result for alignment is where two flexures are pulled downwards in the yield direction.
Strain gauge functional testing
After the strain gauges were installed, each bracket underwent independent gauge testing to ensure that they were working as expected and could survive the harsh space environment. To check that the strain gauge output was as expected, a 4.42-kg mass (chosen because it was sufficiently heavy to create a strong response but without risk of damage) was suspended from the bracket lugs in directions orthogonal to the spacecraft mounting interface in order to measure a strain. The strain reading was compared to the FE model result and in all cases the bending strain measured was within 10% of the expected value. This error level was considered acceptable due to the simple manner in which load was applied and approximations in the FE model. Tests were repeated at least three times with no evidence of significant hysteresis effects. The results are summarised in Table 3.
Strain readings before, during and after loading for all flexures (also given are the values predicted by the FE model).
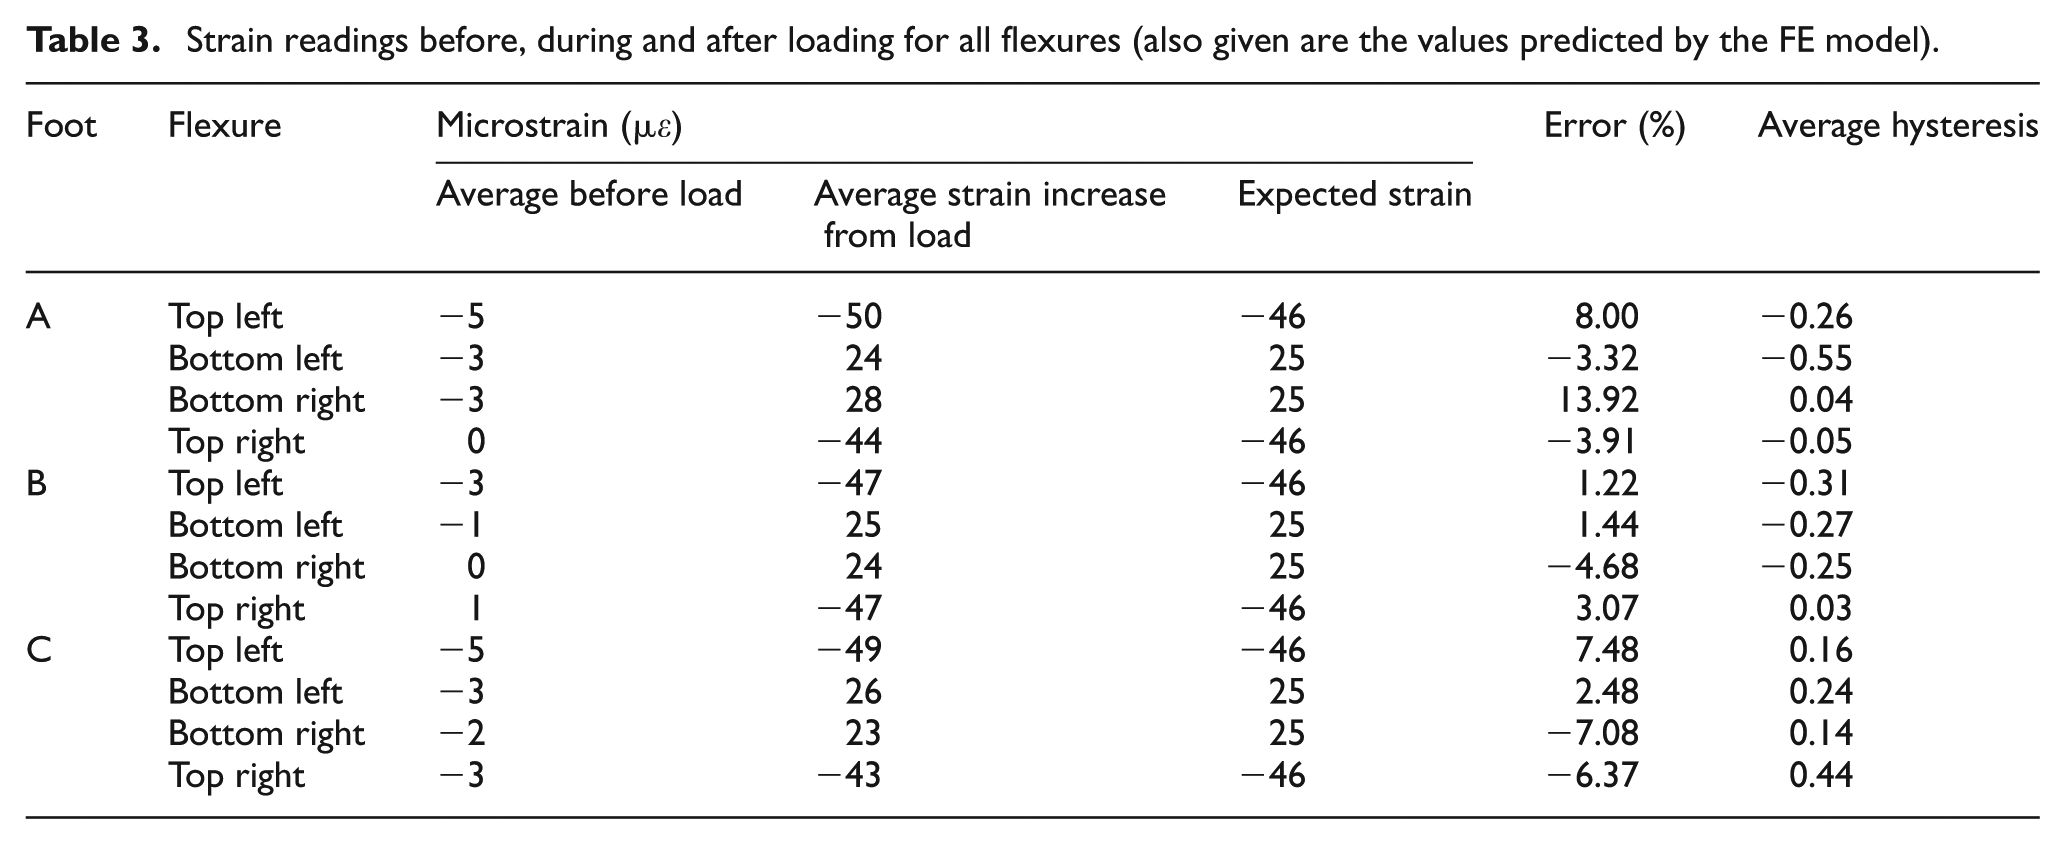
Brackets were also left for a period of days in an unstrained configuration to see whether any drift effects could be noted. Strain measurements remained constant within 1–2 µε which is not significant and is attributable to a combination of signal noise and temperature effects.
To verify that the gauges would stay adhered to the bracket surface during the instrument testing and when in space, a sample bracket with flight representative gauge installations completed was subjected to 10 cycles of submerging in liquid nitrogen (77 K) and warming to room temperature in a nitrogen atmosphere. The same bracket was then subject to a launch-load vibration test to 20 g in sine and 22.62 g in random.
After each test, the gauge installation was inspected and the gauge response measured. In all tests, the gauge installation survived without any noticeable change in response.
Prior to integration onto the instrument, each bracket was also subjected to a controlled cool-down to liquid nitrogen temperatures and warm-up, to characterise the thermal response under no load. This was repeated three times to measure any hysteresis effects. Figure 6 shows the results of the test and clearly indicates that the response for each gauge pair is very different. Possible reasons for this include differences in gauge resistance (±1 Ω), gauge factor (±1%) and small differences in gauge installation method (glue-line thickness and position on flexure). Therefore, individual gauge calibration was required to achieve accurate measurements. From the temperature strain plots, equations relating strain to temperature were derived and used to subtract the temperature response from strain results. The results show some hysteresis is present, though for all gauges this was less than 5 µε.
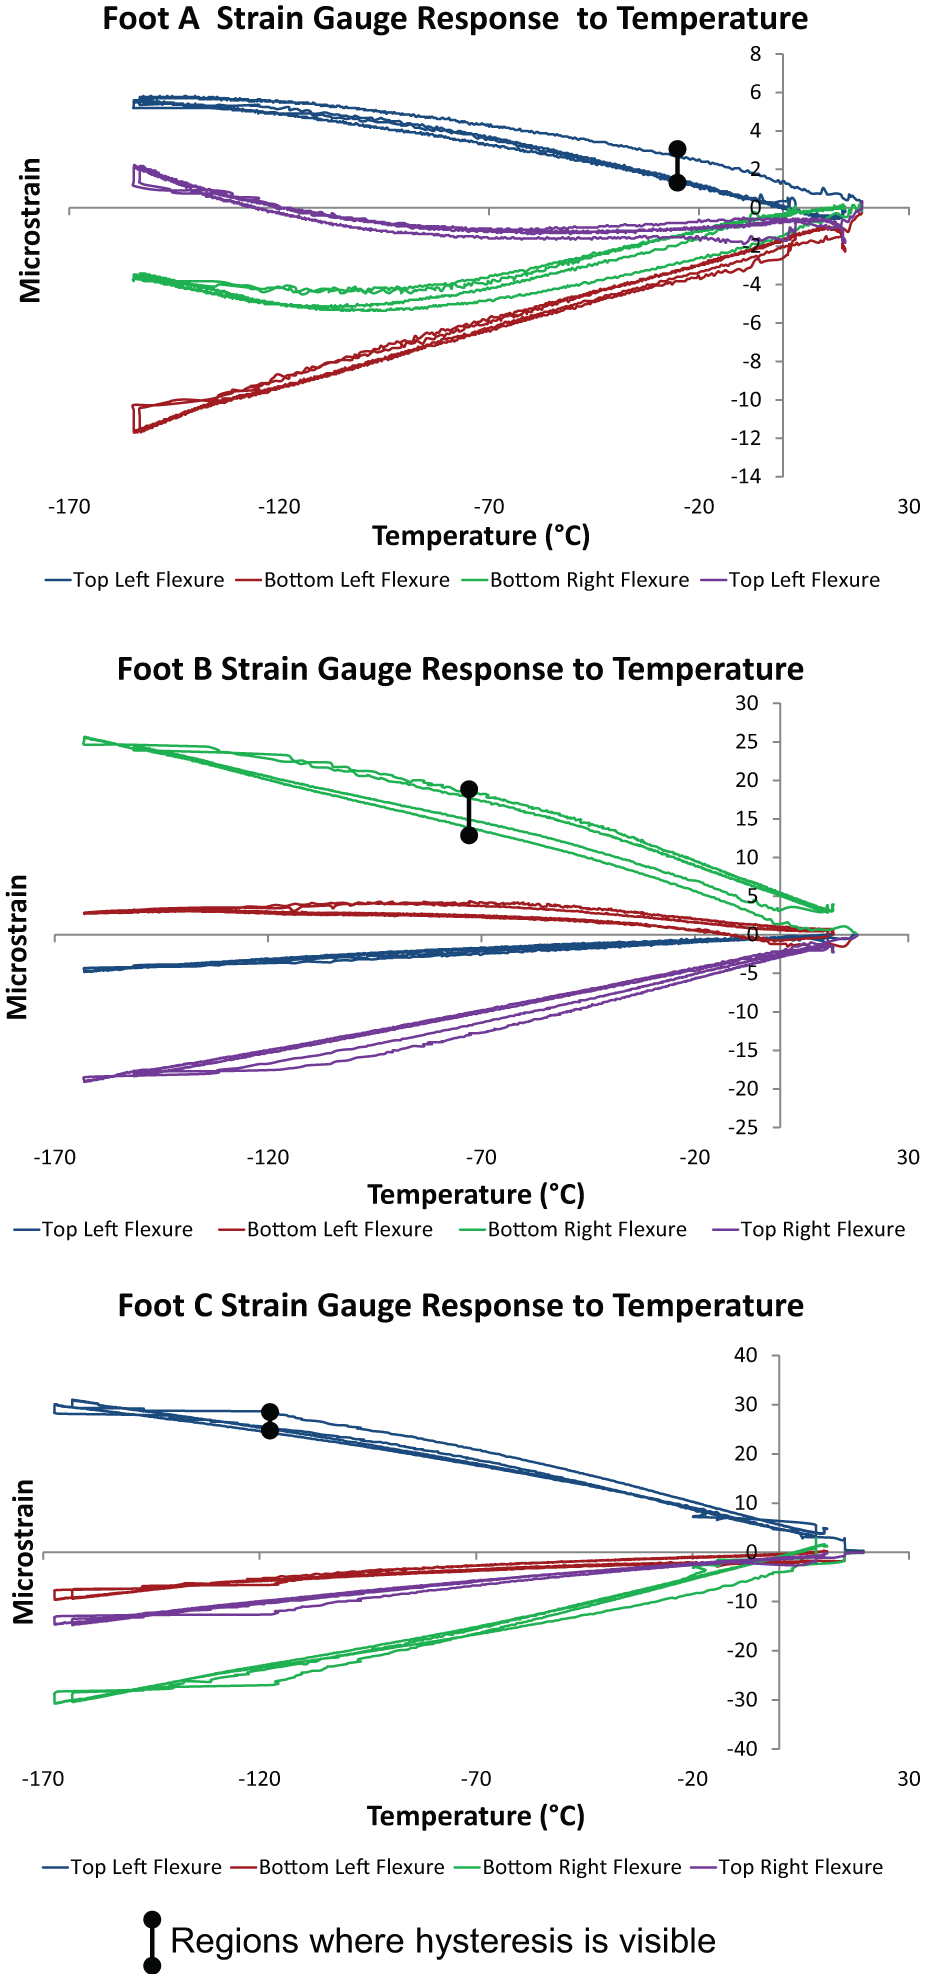
Strain response to temperature (in unloaded condition). Repeated measurements overlay each plot.
Assembly strains and energy redistribution during the project
In the development of the MIRI, prototype versions of the instrument were constructed and tested before building the final flight instrument. While spare components exist, only one full flight instrument was constructed and tested. Therefore, careful handling of the instrument needed to be of the utmost importance.
All versions of the instrument contained a flight representative hexapod which was instrumented with strain gauge instrumentation. These were monitored during all activities which had the potential to create high strains, including hexapod assembly, hexapod integration to the instrument and subsequent test and verification processes. Testing included thermal and vibration testing that required installing the instrument onto different test fixtures. These processes were found to generate the highest strains.
During prototype assembly and testing, a good understanding of acceptable strain levels was generated. It was found that all handling and test activities could occur without strains exceeding shifts of 300 µε and this was used as an upper limit when building the flight instrument.
For the flight instrument, the changes in strain readings from after hexapod assembly to after the final vibration test are shown in Table 4.
Changes in flight instrument strains.
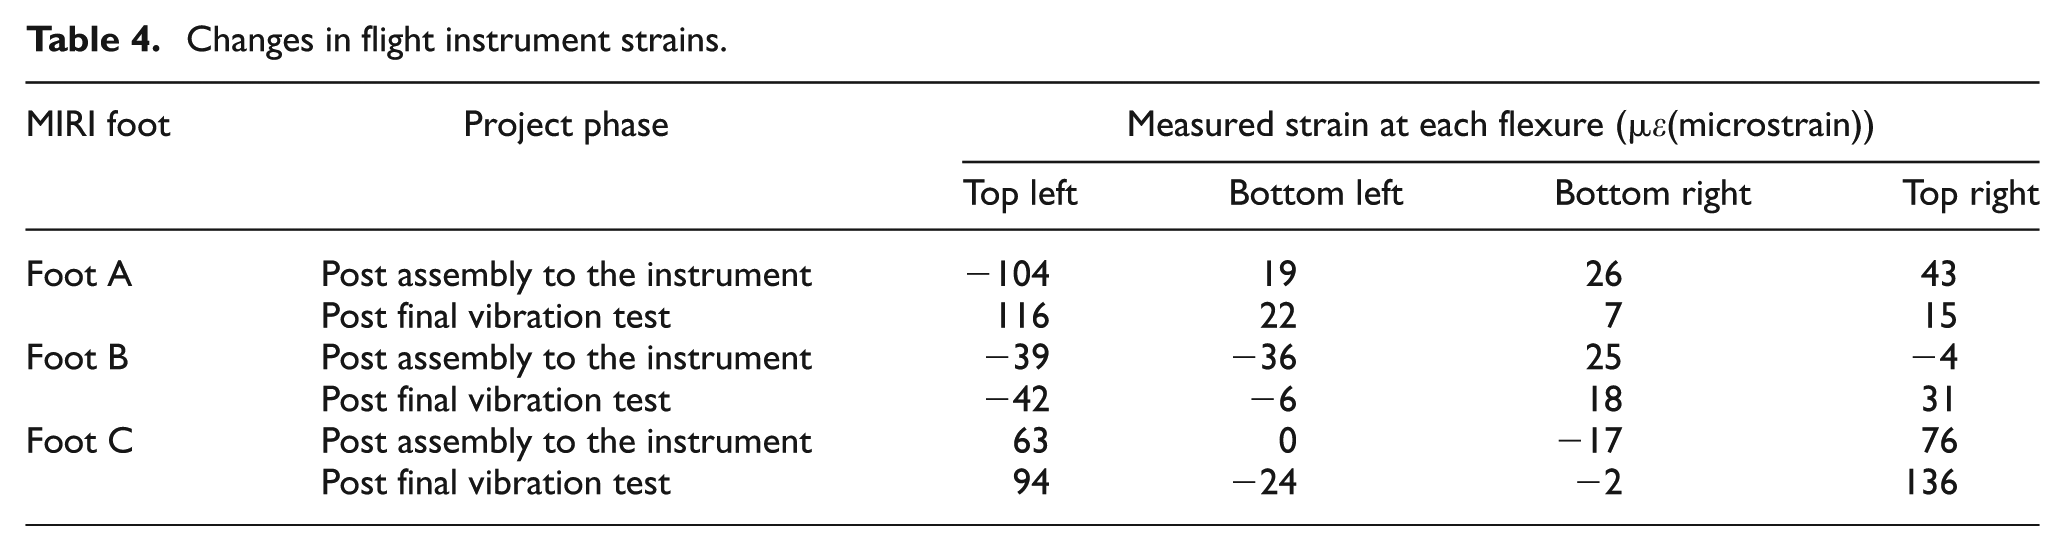
In general, the redistribution of strain energy during the campaign was random and most probably was dependent on the assembly order and build tolerances. This was at a level difficult to analyse or predict. However, the levels of strain observed were acceptable.
In summary, all the flight instrument (FM) strain measurements were well within the specified upper threshold of 300 µε.
Use of the strain gauge instrumentation to aid instrument installation
It was found that integration of the MIRI onto interfaces and the reverse process of removal were the operations that posed the highest risk of generating high strains in the flexures. The feet had integrated dowel pins to aid alignment; however, during lifting operations, the pins could become bound into interfaces. An overhead crane was used to lift the instrument and this made it difficult to ensure that the feet remain aligned to allow smooth installation and removal. To provide protection for the hexapod during lifting operations, the feet were mechanically connected together using interconnecting rods. The rods had jacking posts around the feet to allow the dowel pins to be disengaged by mechanically lifting the feet from the mounting fixture.
Figure 7 shows an example of where the strain gauge instrumentation prevented damage occurring when installing the instrument onto a test fixture. The event occurred when using a prototype version of the instrument, where high strains were generated due to a jacking post not being fully retracted when the instrument was installed onto a test fixture. This prevented the foot at this location from mating to the fixture when the fasteners were installed. The issue was observed on the strain monitoring equipment in real-time as ∼900 µε (45% yield) generated at the flexure. Detection of the issue allowed the problem to be discovered and quickly resolved before any damage occurred.
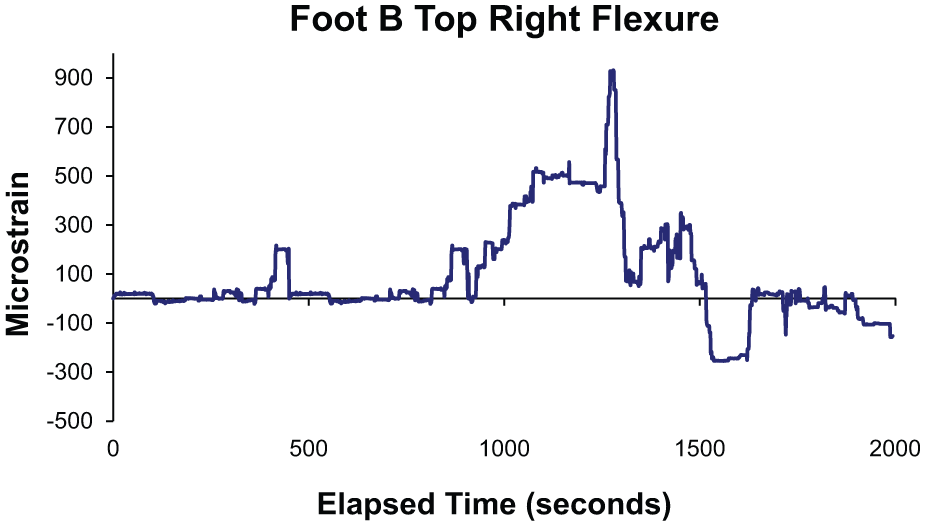
High strains measured during MIRI prototype fixture integration.
The high strain resulted in installation procedures being optimised and subsequently no such incidents occurred.
MIRI verification model gravity release test
As part of functional verification, a prototype version of MIRI was subject to 360° rotation on a purpose-built facility at the Rutherford Appleton Laboratory. The strain gauge instrumentation was monitored during this process and the strain measurements compared to the results from the instrument FE model.
Figure 8 shows the correlation between test and prediction for Foot A strain gauges, which represents the typical correlation achieved. The inbuilt strains are removed from the analysis such that there is no starting strain. The figure also shows a histogram showing the frequency distribution of deviations between measurements and predictions for each gauge. The histogram does not consider the initial zero strain determined prior to rotation where inbuilt strains are removed.
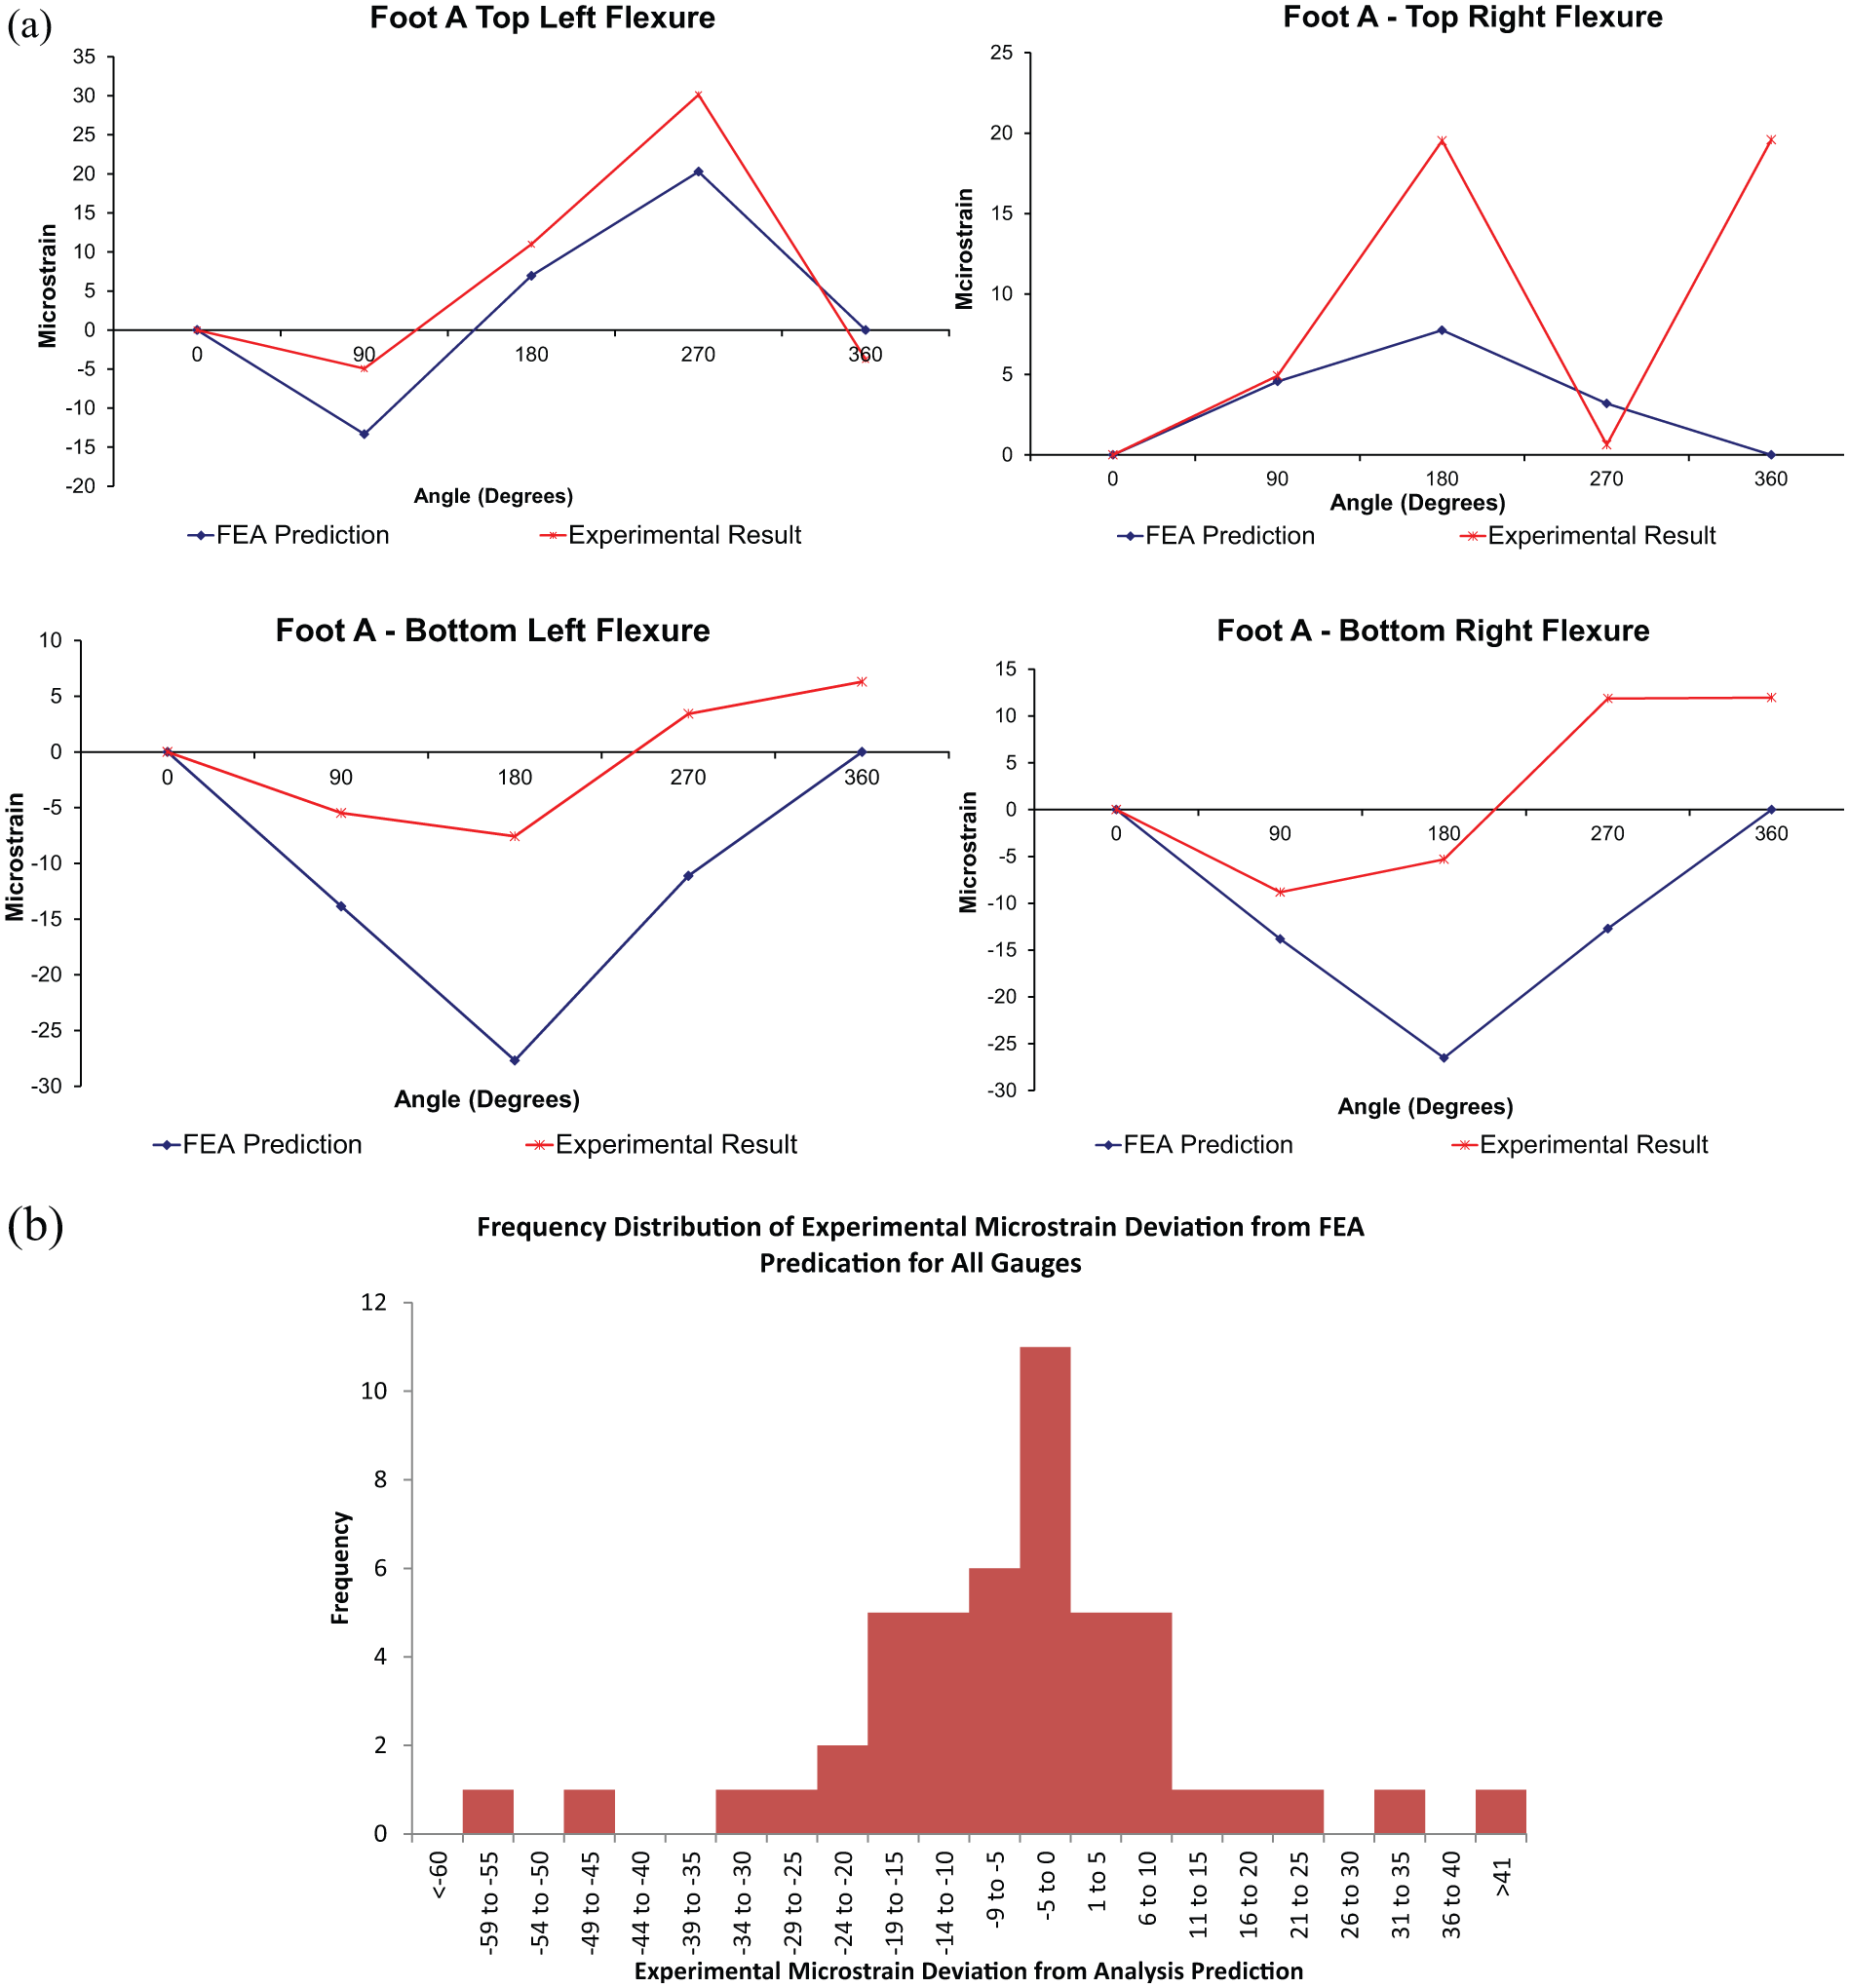
Comparison of measured flexure strains with predictions for the MIRI gravity release test: (a) Foot A strain gauge instrumentation measurement results showing typical level of correlation between prediction and measurement and (b) frequency distribution of deviations between measurement and prediction. Initial no strain position not considered in this analysis.
With some clear exceptions, the test measurements show reasonable correlation to the predicted profiles, giving confidence in both the FE model and the gauge measurement. This is supported by the histogram which shows that the majority of measurements were within 5 µε of predictions, with the FE model having a slight bias to overpredict strains.
The range of measured and predicted strains for each location was generally <∼30 µε (with 2 out of 12 locations at ∼80 µε). These strains are at the same magnitude to the strains created during hexapod assembly and subsequent installation to the instrument, thereby having a strong contribution to deviations from the idealised analytical case. This would explain some of the large deviations between measurement and prediction, which for certain gauges exceeded 50 µε. However, the level of correlation achieved did show that even with inbuilt strains present, the primary structure still had a bias to behave according to the idealised case.
Cryo-test results
The strain gauge instrumentation was used during an MIRI prototype cryo-test which involved cooling the instrument from ambient temperature to operational temperatures in vacuum, completing functional tests and then warming the instrument back up to ambient temperature. The process for doing this is extremely expensive with the entire test process taking approximately 2 months to complete.
Attempts to compare predicted and measured strains showed a very poor correlation. This may be attributed to the gauges being calibrated only to liquid nitrogen temperature (∼77 K) and the effect of inbuilt strains.
When at operational temperatures, the alignment of the instrument was verified during tests using optical methods and showed no anomalies in position
Plots of the strain gauge instrumentation measurement during the cryogenic test are shown in Figure 9.
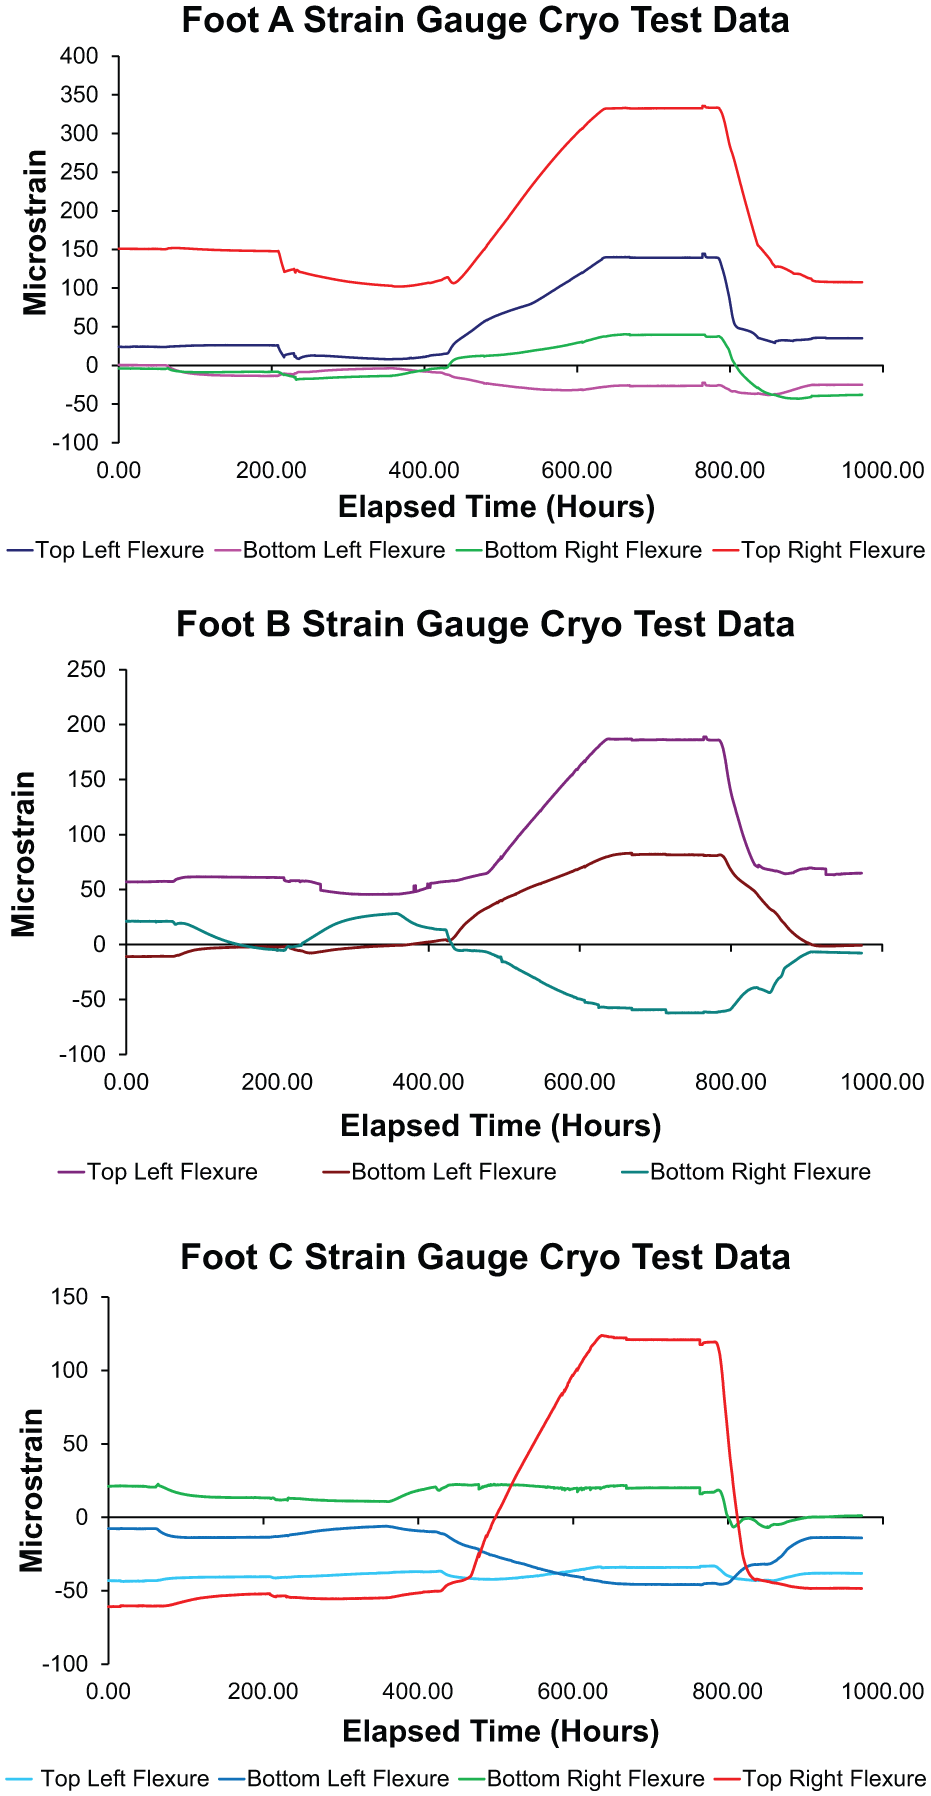
Strain gauge instrumentation measurements during cryogenic testing. Periods of interest: initial cool-down from ambient temperatures to 40 K occurs after approximately 400 h, steady state at operational temperatures occurs from 600 to 800 h and warm-up to ambient temperature occurs from approximately 800 to 850 h. For Foot B, the top right strain gauge was broken and not plotted.
The results show that the dominating strains during cool-down were in the top flexures. This agrees with analysis predictions which show the deck contracting under cool-down towards its centre, leading to a dominant impact on the top flexures of the hexapod brackets.
Flight instrument integration onto the spacecraft
Prototype and flight versions of the MIRI with integrated strain gauge instrumentation were delivered to the NASA Goddard Space Flight Center (GSFC) using a commercial airline and ground transportation. Throughout this process, the instrument was stored within a transport container with shock isolators mounted between the instrument and the container. The trip involved numerous handling operations where damage could occur and these could be difficult to detect post delivery. If damage had occurred, then knowing this prior to handling the instrument would be highly beneficial as applying normal handling procedures could lead to further damage occurring.
Launch load testing of the instrument showed that significant vibration loads would cause the strain energies in the hexapod to be redistributed in an unpredictable manner. Therefore, if significant loads were applied during transport, then a similar response would be expected to be observed.
When arriving at GSFC, one of the methods used to assess instrument condition was to compare the strain gauge instrumentation values from pre- and post delivery. The other method was to read the data from transport data loggers measuring both short- and long-duration load events applied to the instrument. For both shipments, the measurements of pre- and post delivery strain measurements were found to be very similar, indicating that no damage had occurred. This result was supported by readings from the data logger and subsequent functional testing of the instrument.
On the JWST spacecraft, the ISIM is a carbon fibre truss structure that holds MIRI and the three other science instruments. 1 The MIRI was installed onto one of the open sides of the structure using an overhead gantry crane in a process that required extremely careful handling to prevent damage to both the ISIM and the instrument.
For the flight instrument, installation process was completed successfully with only one significant event recorded by the strain gauge instrumentation when the instrument was partially engaged to ISIM. This was a 150-µε shift that required additional mass offloading from ISIM to instrument. While this shift is within the allowed 300 µε limit, it was part of a more slowly occurring 270 µ shift. Failure to respond to this change could have resulted in the development of strains outside the normal operating limits, and thus have led to abnormal operation which might have been detected in testing or at worst after launch. Figure 10 shows the integration activity and the record of the event referred to.
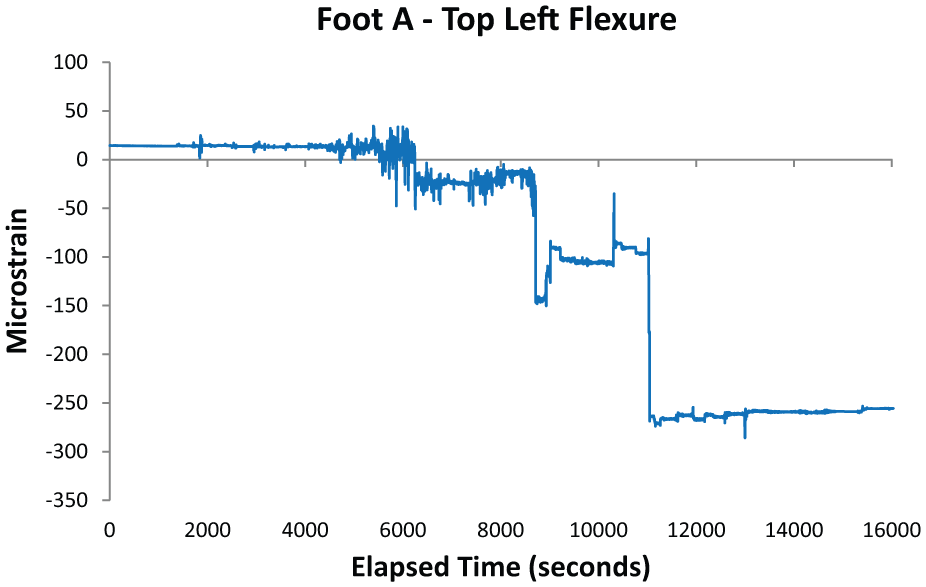
High strain event detected and controlled during MIRI integration onto ISIM.
After integration, optical alignment and functional verification of the MIRI showed that the instrument was successfully installed onto the ISIM structure within the required tolerances.
Conclusion
The main outcomes from this work are as follows.
To demonstrate the use of a novel space-compatible strain gauge instrumentation to successfully aid activities including handling, integration and verifying the mechanical integrity of space flight hardware.
To show the difficulty in relating strain measurements to higher level system parameters, in this case relating flexure strain measurements to MIRI alignment.
Footnotes
Appendix 1
Acknowledgements
The authors acknowledge and thank the MIRI European Consortium Team, European Space Agency (ESA) and NASA in their support in using and developing the strain gauge instrumentation during the JWST MIRI project.
Declaration of conflicting interests
The authors declare that there is no conflict of interest.
Funding
JWST MIRI is funded in the United Kingdom by the Science and Technology Funding Council and UK Space Agency (UKSA).