
Abstract
PhenoCam networks are useful for unattended monitoring of ecological dynamics at daily time-steps. Despite extensive networks of PhenoCams in many regions of the world, especially in North America and Europe, there are none in High Mountain Asia (HMA). Standard PhenoCams also require power and internet infrastructures that are not readily available in remote mountain areas such as HMA. Here, we assessed for the first time, the use and effectiveness of low-cost trailcams for high altitude phenological and temperature logging within the Himalayan alpine zone (>4000 m.a.s.l.). The ethos of this approach was to work with local community members in Himalayan villages above the treeline to maintain the PhenoCam systems for year-round operation. Results from this study show variations in phenology between two dominant plant communities - Juniperus spp. and Rhododendron spp. – in two high-altitude villages Dole (4038 m.a.s.l.) and Machermo (4392 m.a.s.l.) in the Khumbu region of Nepal. Juniperus spp. was found to have a longer growing season at higher altitudes (Machermo) compared to Dole. Seasonal temperature variations were demonstrated through temperature data extracted from the trailcam images. This study fills the current gap in our understanding of seasonal variations in phenophase of dwarf plants in the Himalayan alpine zone, but more importantly provides a proof-of-concept for a low-cost, low-carbon and community-maintained methodology to obtain long-term in-situ observations in the remote mountainous regions. While some missions encountered challenges due to user errors, this study underscores the potential for implementing citizen science initiatives in high-altitude Himalayan ecosystems, and demonstrates pathways for doing so.
Introduction
Climate change has resulted in increased global surface temperatures over the past decades (IPCC AR6). With this, earlier spring onset and delayed autumn senescence have been observed in many ecosystems (Richardson et al., 2018). Any shifts in vegetation phenology could result in functional ecosystem changes, since plants play a crucial role in the seasonal carbon, water and energy cycles (Inouye and Wielgolaski, 2003; Korner, 2006; Shen et al., 2015). These shifts have particularly important implications for ecosystem services both biotically (leading to shifts in species location (migration) and community composition; Singh and Kumar (2022)) and abiotically (altering productivity and carbon cycling; Shrestha et al. (2013)), and particularly so in Himalayan ecosystems compared to elsewhere. This is because predicted temperature shifts from climate forcing are greater here, and the mountain system is more sensitive to temperature change compared with other systems (Dolezal et al., 2016; Nie et al., 2021). It is unknown how climate change will impact plant phenological dynamics in High Mountain Asia (HMA), due to the lack of in-situ measurements particularly within high-altitude regions, and this is a gap that demands urgent data.
Spaceborne sensors (e.g., Landsat, MODIS and NOAA-AVHRR) have been widely used for monitoring vegetation community dynamics in HMA (Ramachandran and Roy 2018; Ye et al., 2024), including the dynamics of the treeline (Mohapatra et al., 2019), plus land surface productivity (Ramachandran and Roy, 2018) and phenological variations (Kumari et al., 2021). The use of medium to coarse spatial resolution satellite data in mountainous areas is often challenging due to complex topography and habitat fragmentation (Julitta et al., 2014). In the Himalayan alpine zone, particularly, fine-temporal grain satellite data availability may be limited by cloud during the growing season (June–September, overlapping with summer monsoon season), plus there are added technical complexities caused by the dwarf nature of alpine plants which may sometimes be sparsely distributed (i.e., occurring at the sub-pixel scale within satellite data products that are typically used for phenological studies).
PhenoCam networks have been demonstrated as being exceptionally useful for unattended monitoring of ecological dynamics at daily time-steps, with capability to provide scale-appropriate information about ecosystem state (Richardson et al. (2018); Figure 1). Equally, PhenoCam observations can also provide essential validation for satellite-captured measurements (Thapa et al., 2021). Analysis of temporal changes in the relative brightness of red, green and blue (RGB) bands of the photographs obtained by PhenoCams allows for a more continuous tracking of canopy greenness than satellite imagery (Richardson et al., 2009; Vrieling et al., 2018). Despite extensive networks of PhenoCams in many regions of the world there is evidently a bias towards economically wealthy areas of the world (North American and European systems), with none in the entire of HMA (Figure 1). Extending the PhenoCam network into HMA is difficult, due to the absence of consistent power and WIFI in some places. This complication is exacerbated in the poorly-monitored alpine zone above 4000 m.a.s.l. where electricity supplies and internet connectivity are unreliable. Although some weather stations (e.g., Pyramid at 5035 m.a.s.l., and Base Camp at 5319 m.a.s.l.) have been established in the Himalayan alpine zone since 2016 (Perry et al., 2020), the expensive cost and difficulties in maintenance limit them supplying long-term service (Pyramid stopped service in 2019) or expanding to wider regions within the Himalayas. Current distribution (accurate February 2025) of PhenoCams globally showing a lack of sites in the Himalaya (https://phenocam.nau.edu/webcam/network/map/).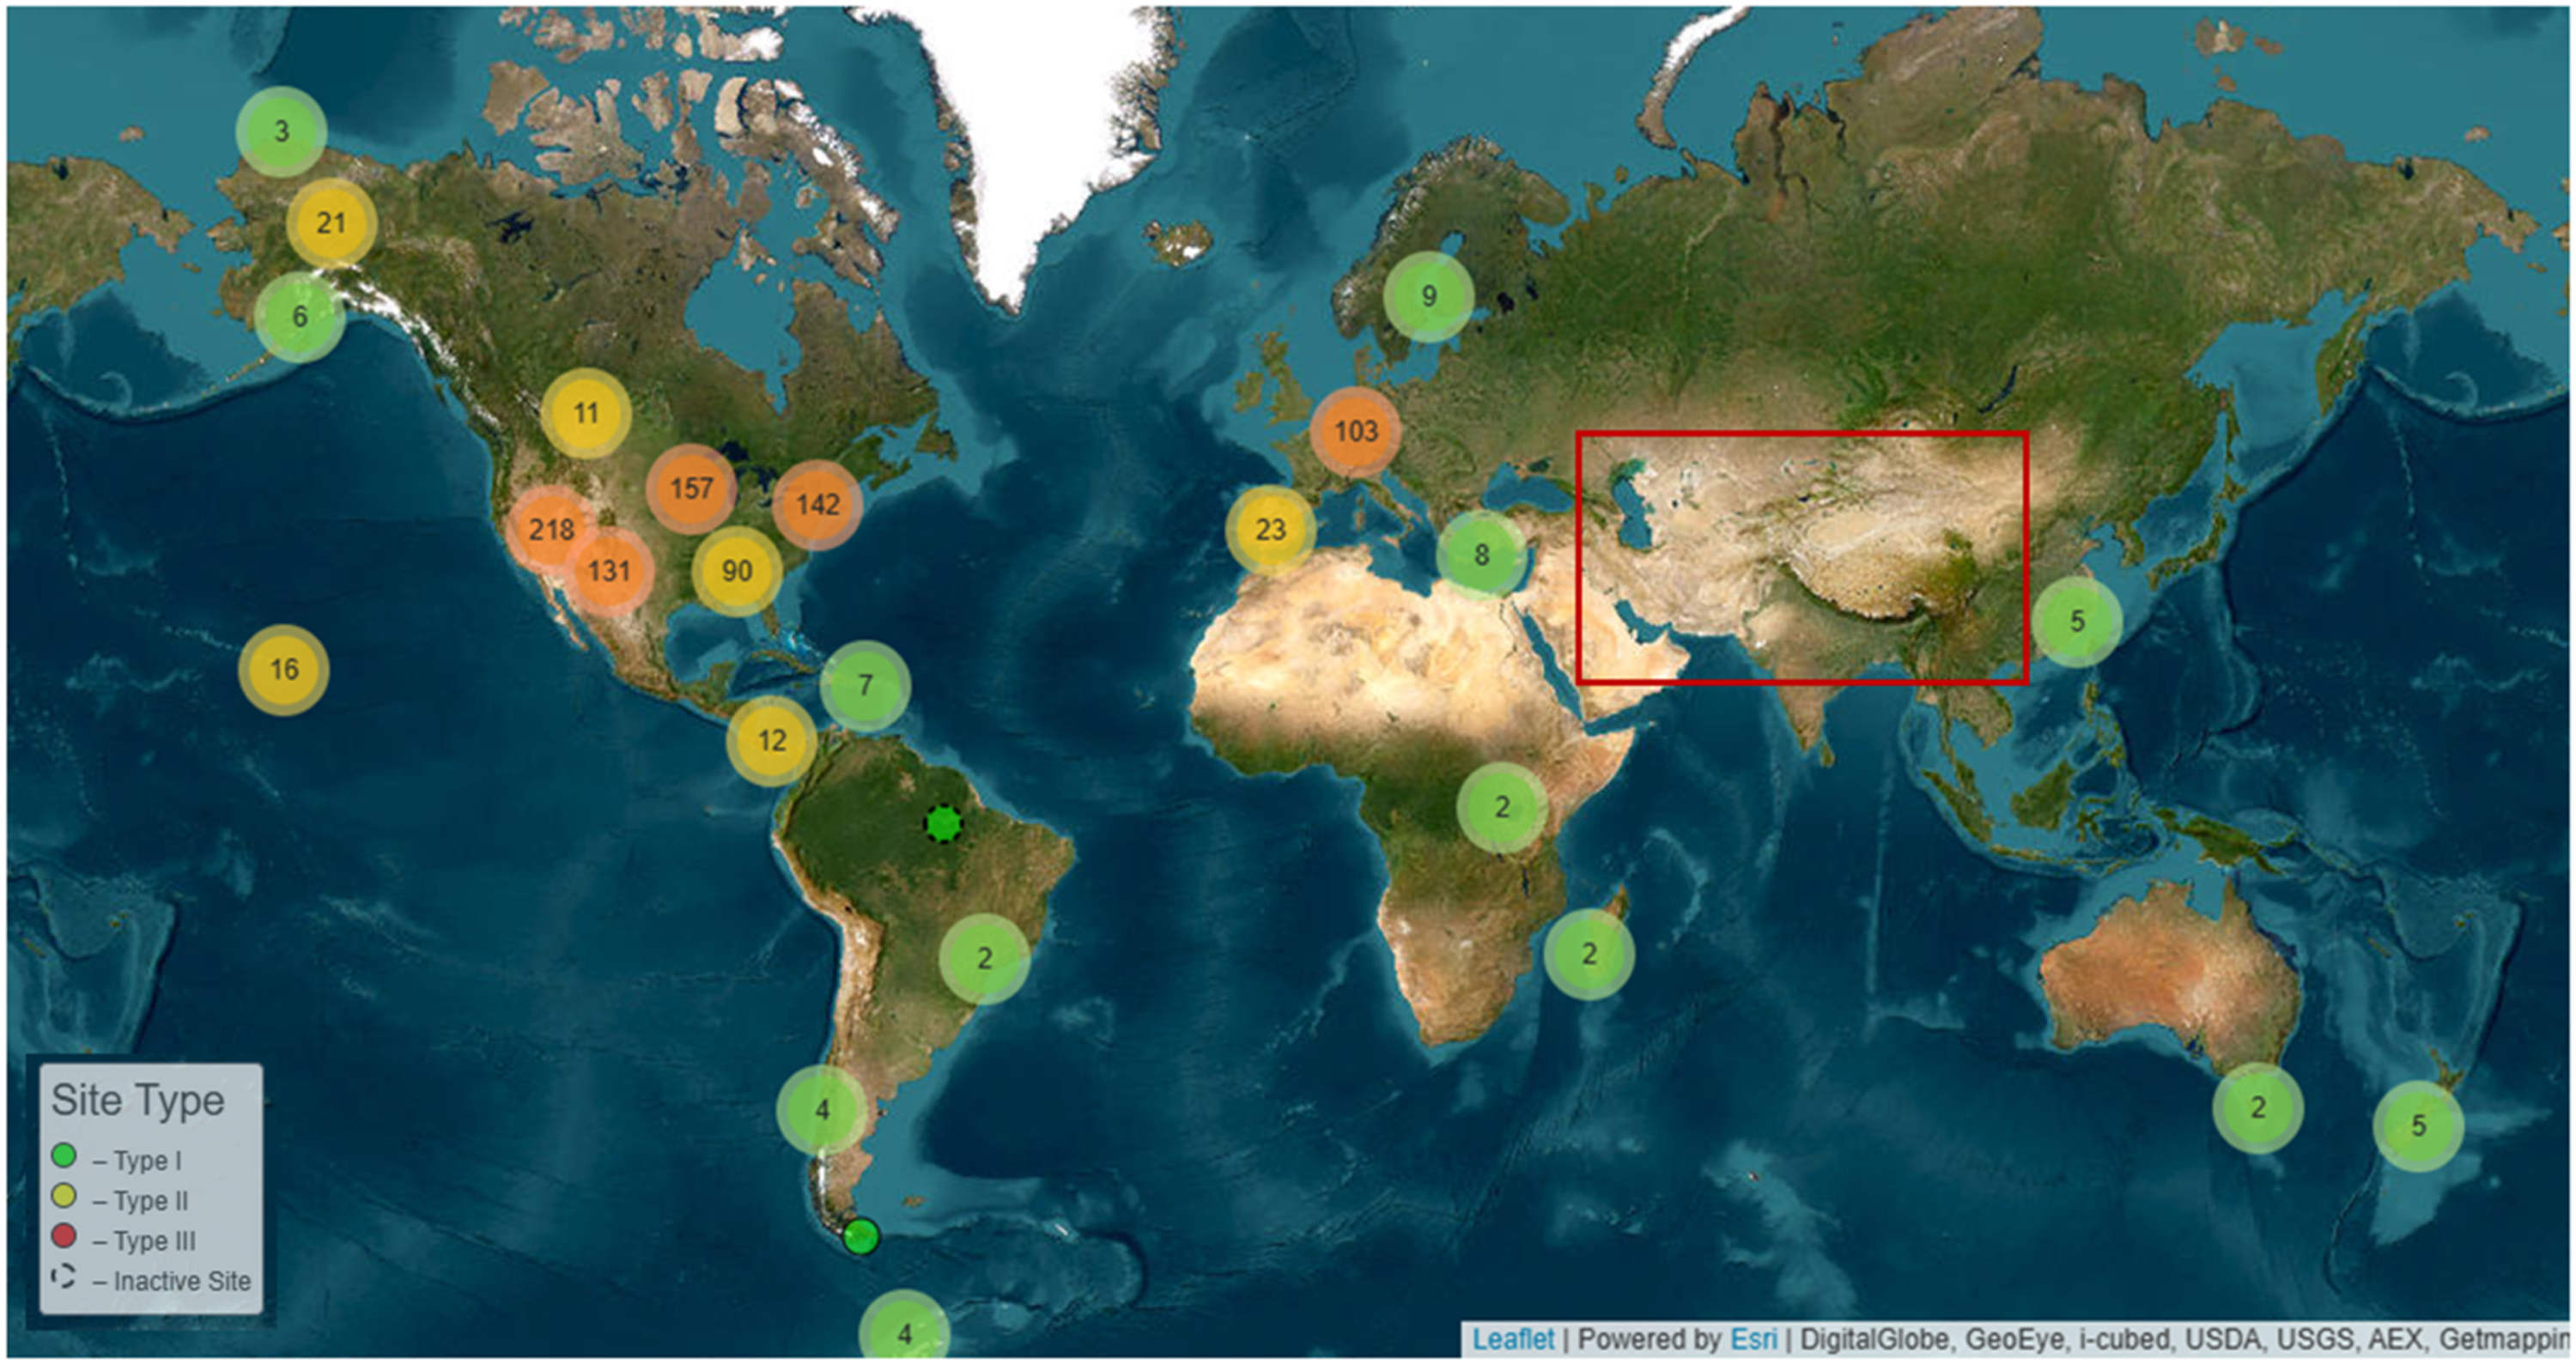
Studies showed that phenology monitoring can be achieved effectively with relatively cheap consumer grade RGB cameras (Julitta et al., 2014; Vrieling et al., 2018), even without the additional near-infrared spectral band providing complementary information similar to satellite-derived vegetation indices (Petach et al., 2014). In the past decade, greenness series from digital repeat photography have been used extensively for assessing phenology and its relationship with primary productivity and climate, in various ecosystems such as forest (Klosterman et al., 2014), alpine grasslands (Migliavacca et al., 2011), tropical savannahs (Alberton et al., 2014), and Arctic vegetation (Anderson et al., 2016).
Compared to PhenoCam systems and weather stations, simpler devices such as time-lapse cameras offer a more practical approach for monitoring the phenology of alpine plants in the Himalayas. Their simpler operation allows potentially, for greater involvement of local communities (e.g., sherpa and lodge owners) in setup and maintenance, making long-term monitoring projects more feasible in the HMA. Low-cost, community-maintained initiatives have a higher likelihood of running regularly over extended periods, ensuring sustained data collection. Although some efforts have been made for understanding the vegetation phenology in the Himalayas since 2016 (Chandra et al., 2022; Hassan et al., 2021; Yang et al., 2022), by combining historic photograph records and in-situ experiments (Hassan et al., 2021) and deploying digital cameras for tracking the phenological variations of specific tree species (Chandra et al., 2022; Yang et al., 2022). All of these studies were conducted below or around the treeline elevation (i.e., typically below 4000 m.a.s.l.), and the alpine zone above treeline has been comparatively ignored – presumably because of the challenge in working at high altitude. According to recent reports of vegetation expansion in the alpine Himalayas (Anderson et al., 2020; Bandyopadhyay et al., 2023; Lamsal et al., 2017), dwarf plants above the treeline are projected to have significant influences on the local eco-hydrological systems in a warming world (Leng et al., 2023), and the subsequent impacts to and feedback from water and snow dynamics will be a key question in this area. In the HMA, this gap must be urgently addressed for the aforementioned reasons, whilst acknowledging the practical limitations of deploying sophisticated camera systems in remote areas with poor power supplies and no WiFi. Low-cost trail-cam based phenological approaches could be considered as an ideal approach for monitoring the vegetation characteristics in these areas over a long period of time.
In this paper, the goal was to test a proof-of-concept for the utility of low-cost trailcams for high altitude phenological and temperature logging. The ethos of the approach was to work with local community members in Himalayan villages above the treeline to monitor alpine vegetation dynamics over multiple years. With basic training, a local sherpa guide (co-author Magar) would service the trail cameras, returning the data to the scientific team for analysis. The following research questions were posed: 1. Can useful phenological information be gained from consumer-grade trailcams in Himalayan alpine settings? 2. What are the phenological patterns of plant communities at two sites with different alpine ecology? 3. Can trailcams be used for monitoring air temperature reliably? 4. How well do community-led approaches to trailcam maintenance work in this setting, and what lessons can be learned for broader experimentation in remote areas?
Methods
Field set-up
Two low-cost trail cameras (GardePro A3S trail camera) were installed on village buildings located in two villages within the Dudh Kosi River valley (Khumbu Pasanglahmu Rural Municipality in Solukhumbu (Khumbu) District, Nepal (Figure 2)). Specifically, the cameras were sited on the rooftops of locally owned tea lodges. We first installed and set up the cameras during a fieldtrip, and the subsequent services (including data collection and camera maintenance) were conducted by a trained local sherpa guide (co-author Magar). At these high altitudes, villages are only accessible on foot, by track. One visit to install and retrieve images takes about 7 days and costs around $1000, which covers the sherpa’s salary, rent to the lodge owners to host the cameras, permits, travel, subsistence and download/data sharing from the retrieved memory card. (a) Locations of Dole and Machermo, in the Dudh Kosi River valley flowing from the Ngozumpa Glacier. (b) Location of Khumbu Pasanglahmu Rural Municipality (shaded grey) and Solukhumbu (Khumbu) District (blue) within Nepal. (c) and (d) Installation trail cameras on the roof of Peaceful lodge in Machermo and Riverside lodge in Dole, respectively. (e) and (f) Land cover maps of the trailcam monitoring areas in Machermo and Dole, with yellow dots indicating the trailcam sites and white squares highlighting the monitoring areas. Typical images taken by the trailcams for Machermo (g) and Dole (h). The image in (a) sourced from Imagery @2003 TerraMetrics. Photographs in (c) and (d) were taken by the authors. Land cover maps in (e) and (f) are from previous work by Leng et al. (2024).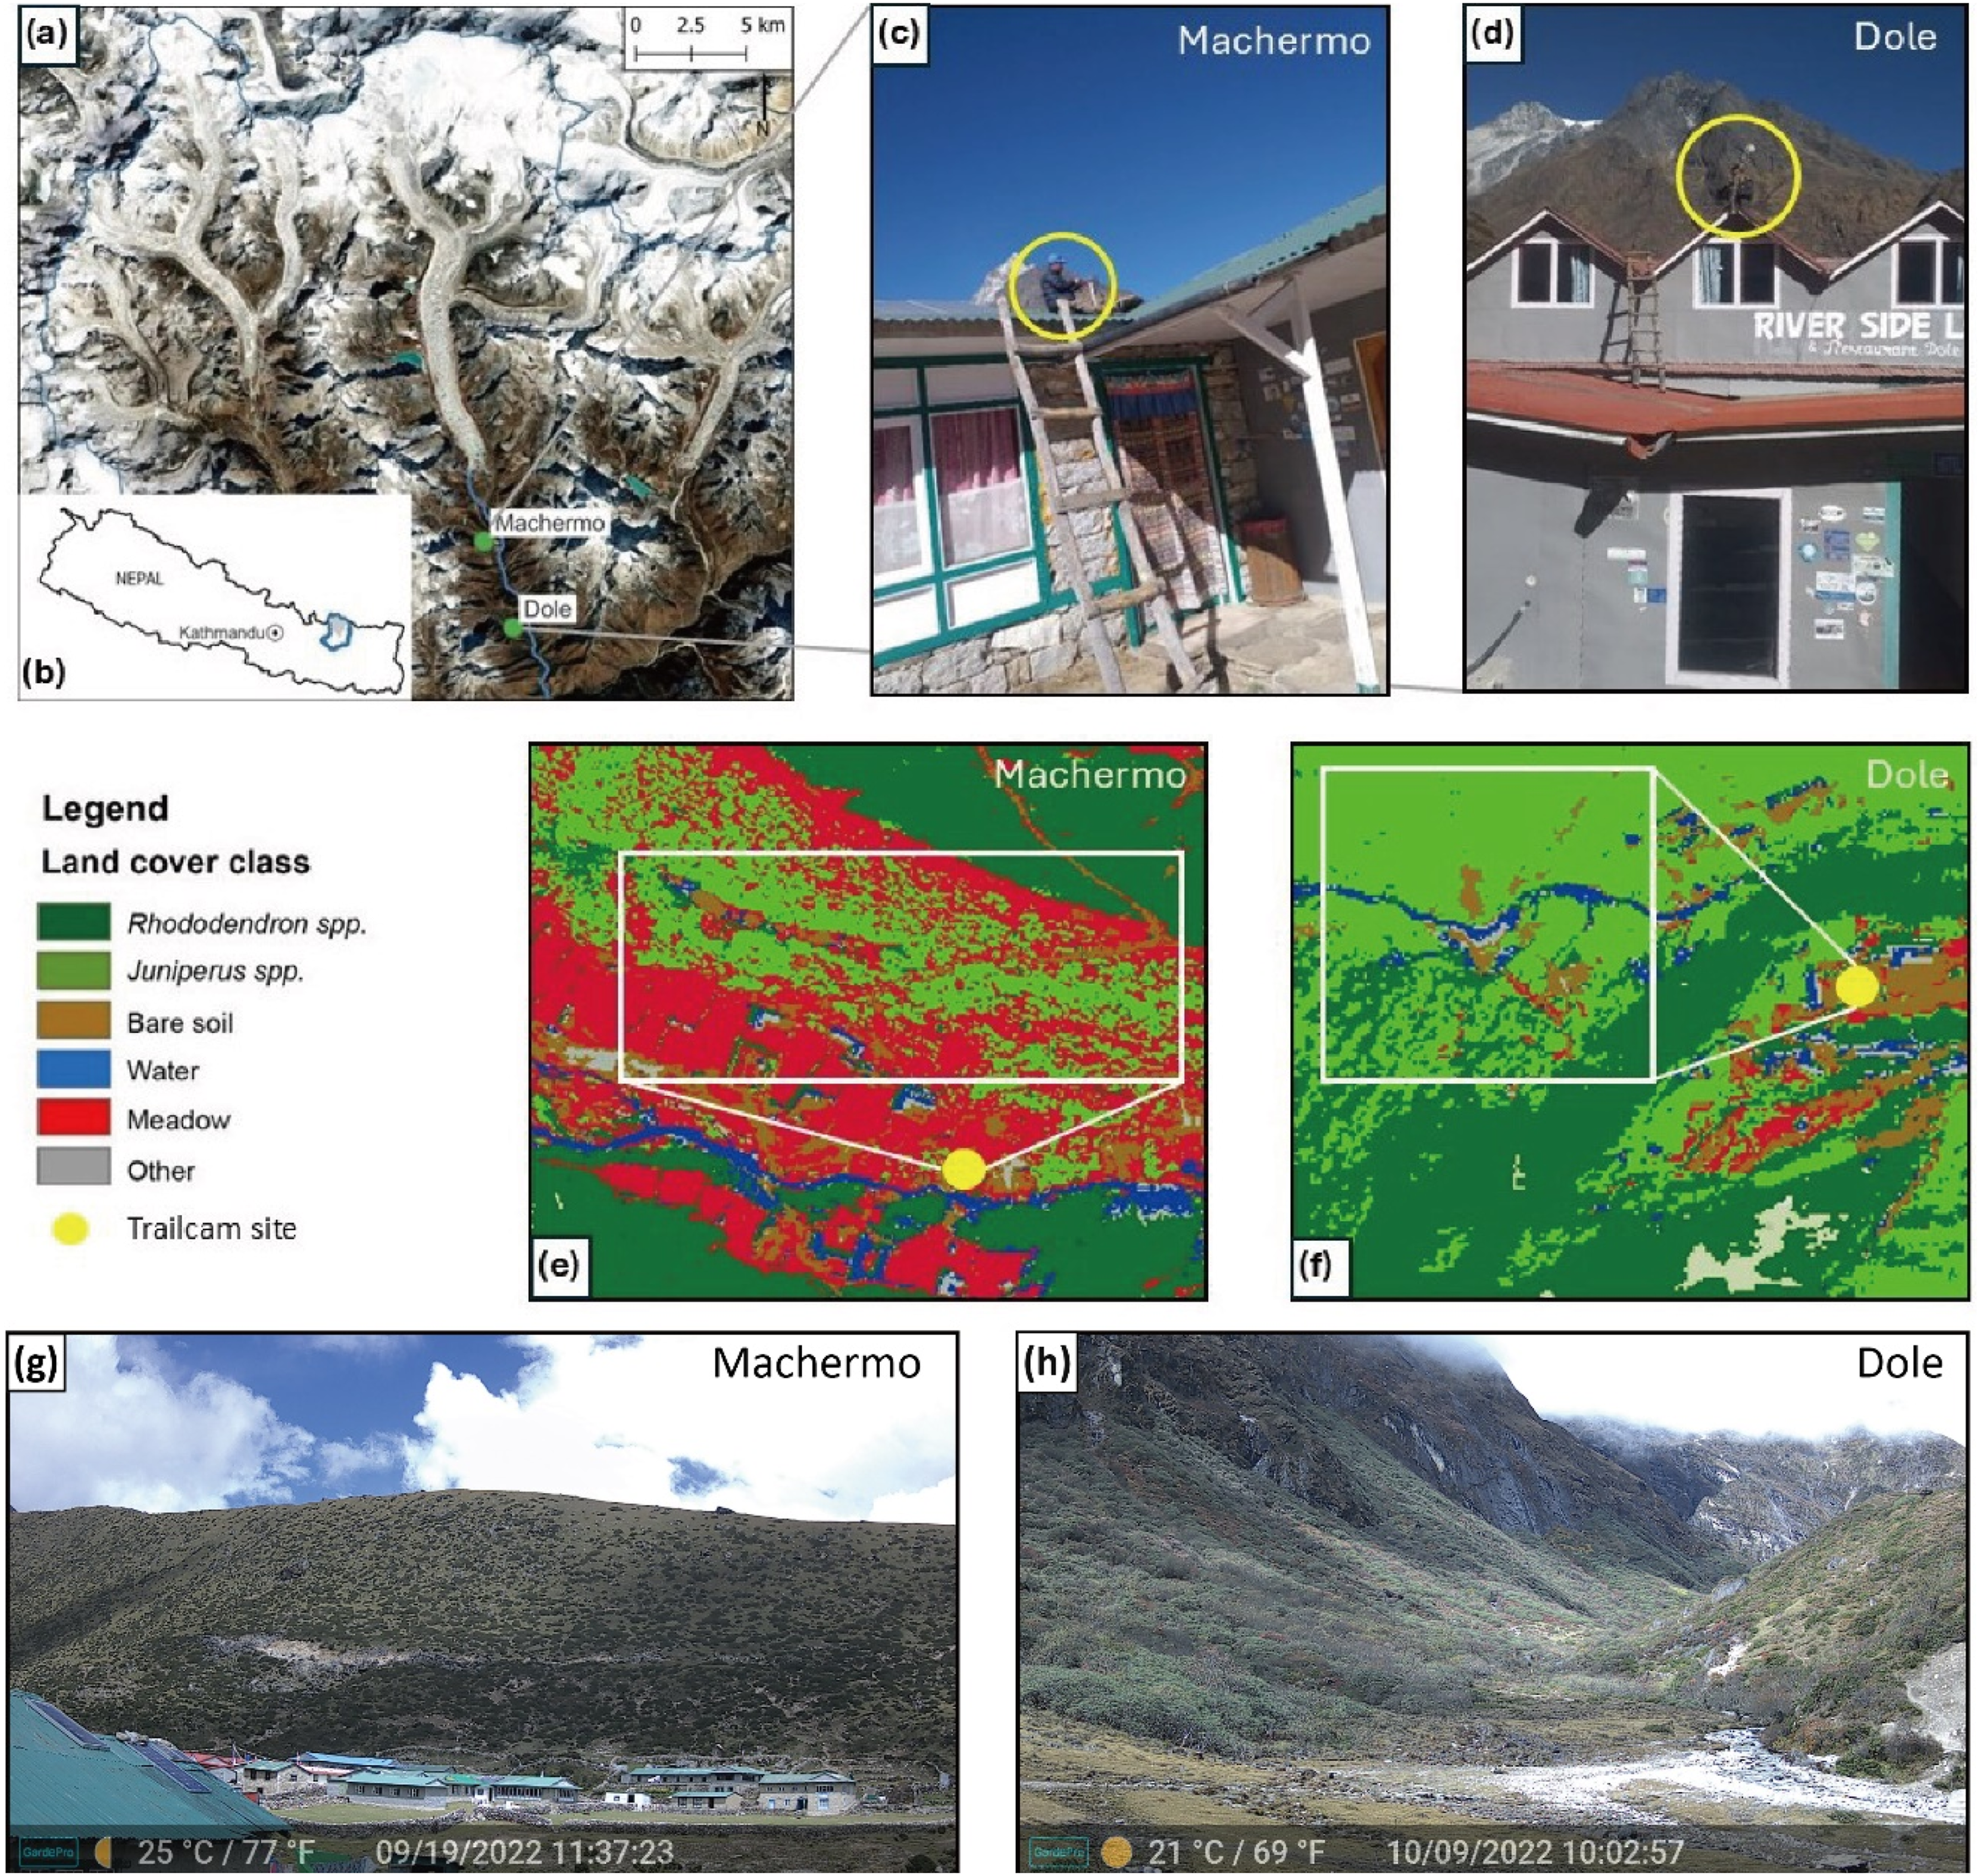
One camera was installed facing west-northwest in Dole (4038 m.a.s.l.; Figure 2), facing a valley with mixtures of Juniperus species (Juniperus indica and Juniperus recureva) and dwarf Rhododendron species (e.g., Rhododendron walichii, Rhododendron setosum, Rhododendron anthopogon); and the other higher up the valley in Machermo (4392 m.a.s.l.) facing north, capturing a south-facing slope dominantly covered by Juniperus spp. (Leng et al., 2024). Both cameras were programmed to capture a photo every 30 min between 10:00 a.m. and 14:00 p.m. NPT (i.e., in the 2-h window on either side of solar noon) to minimise the effects of cloud cover at high altitudes. Figure 2(e) and (f) show the land cover distribution within each survey site from a satellite perspective.
The location of each site and the operating time of three missions.
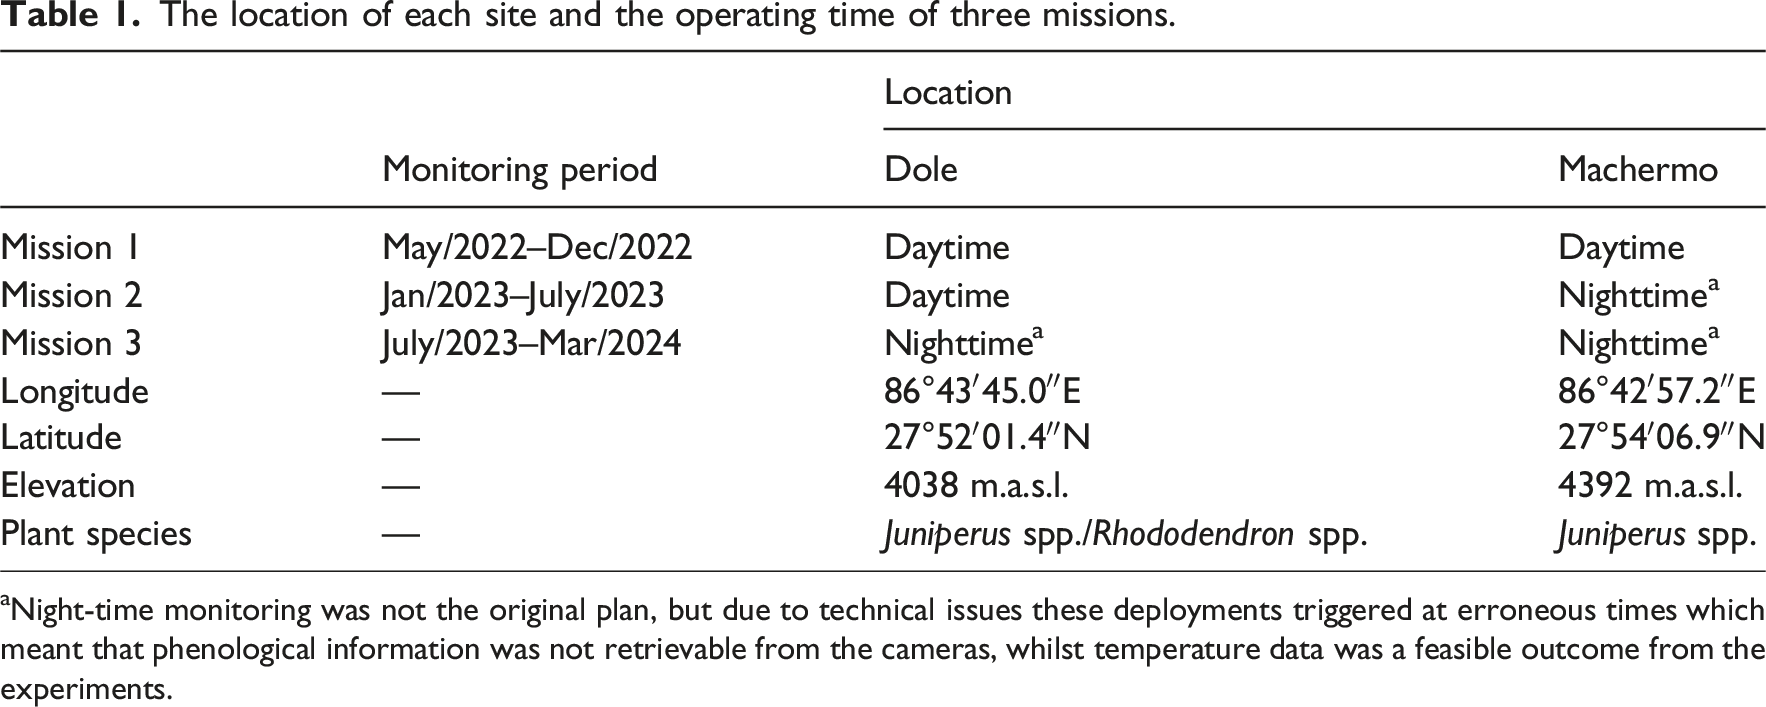
aNight-time monitoring was not the original plan, but due to technical issues these deployments triggered at erroneous times which meant that phenological information was not retrievable from the cameras, whilst temperature data was a feasible outcome from the experiments.
Data processing
All the data processing was carried out in RStudio (Team, 2020). All images and code are available on request. File names were altered to the format “Location YYYY-MM-DD-HHMM” for further processing. Before processing, images with blur, low cloud, mist, solar glare, hoar frost or deep shadows were manually removed. Due to the valley shape and orientation at Dole, shadows posed a greater challenge and led to filtering of more images compared to Machermo. Specifically, 868 out of 2003 images were removed in 2022 and 685 out of 1657 images were removed in 2023 for Dole, whereas 620 out of 1773 images were removed from Machermo in 2022.
The remaining images (1135, 972 and 1153 from Dole 2022, Dole 2023 and Machermo 2022) were processed using Phenopix (Filippa et al., 2016). Figure 3 are examples of these images highlighting the targeted plant communities in Dole and Machermo respectively. Figure 3(a) and (b) are examples of the images obtained during mission 1, of which the plant communities of Rhododendron spp. and Juniperus spp. were both captured in the images. Figure 3(c) is an example of images obtained during mission 2 in Dole. The orientation of the camera was changed slightly between the first and second data collection missions because the nature of the installation site meant that perfect repositioning was not possible on the roof of the mountain hut. Hence only Rhododendron spp. was captured in subsequent images. (a) and (b) show two areas of interest at Dole during mission 1 (from 03/05/2022 to 11/12/2022), Juniperus spp. (a) and Rhododendron spp. (b); (c) shows the area of Rhododendron spp. at Dole during mission 2 (from 12/12/2022 to 07/07/2023); and (d) shows the area of Juniperus spp. at Machermo during mission 1 (from 07/05/2022 to 12/12/2022).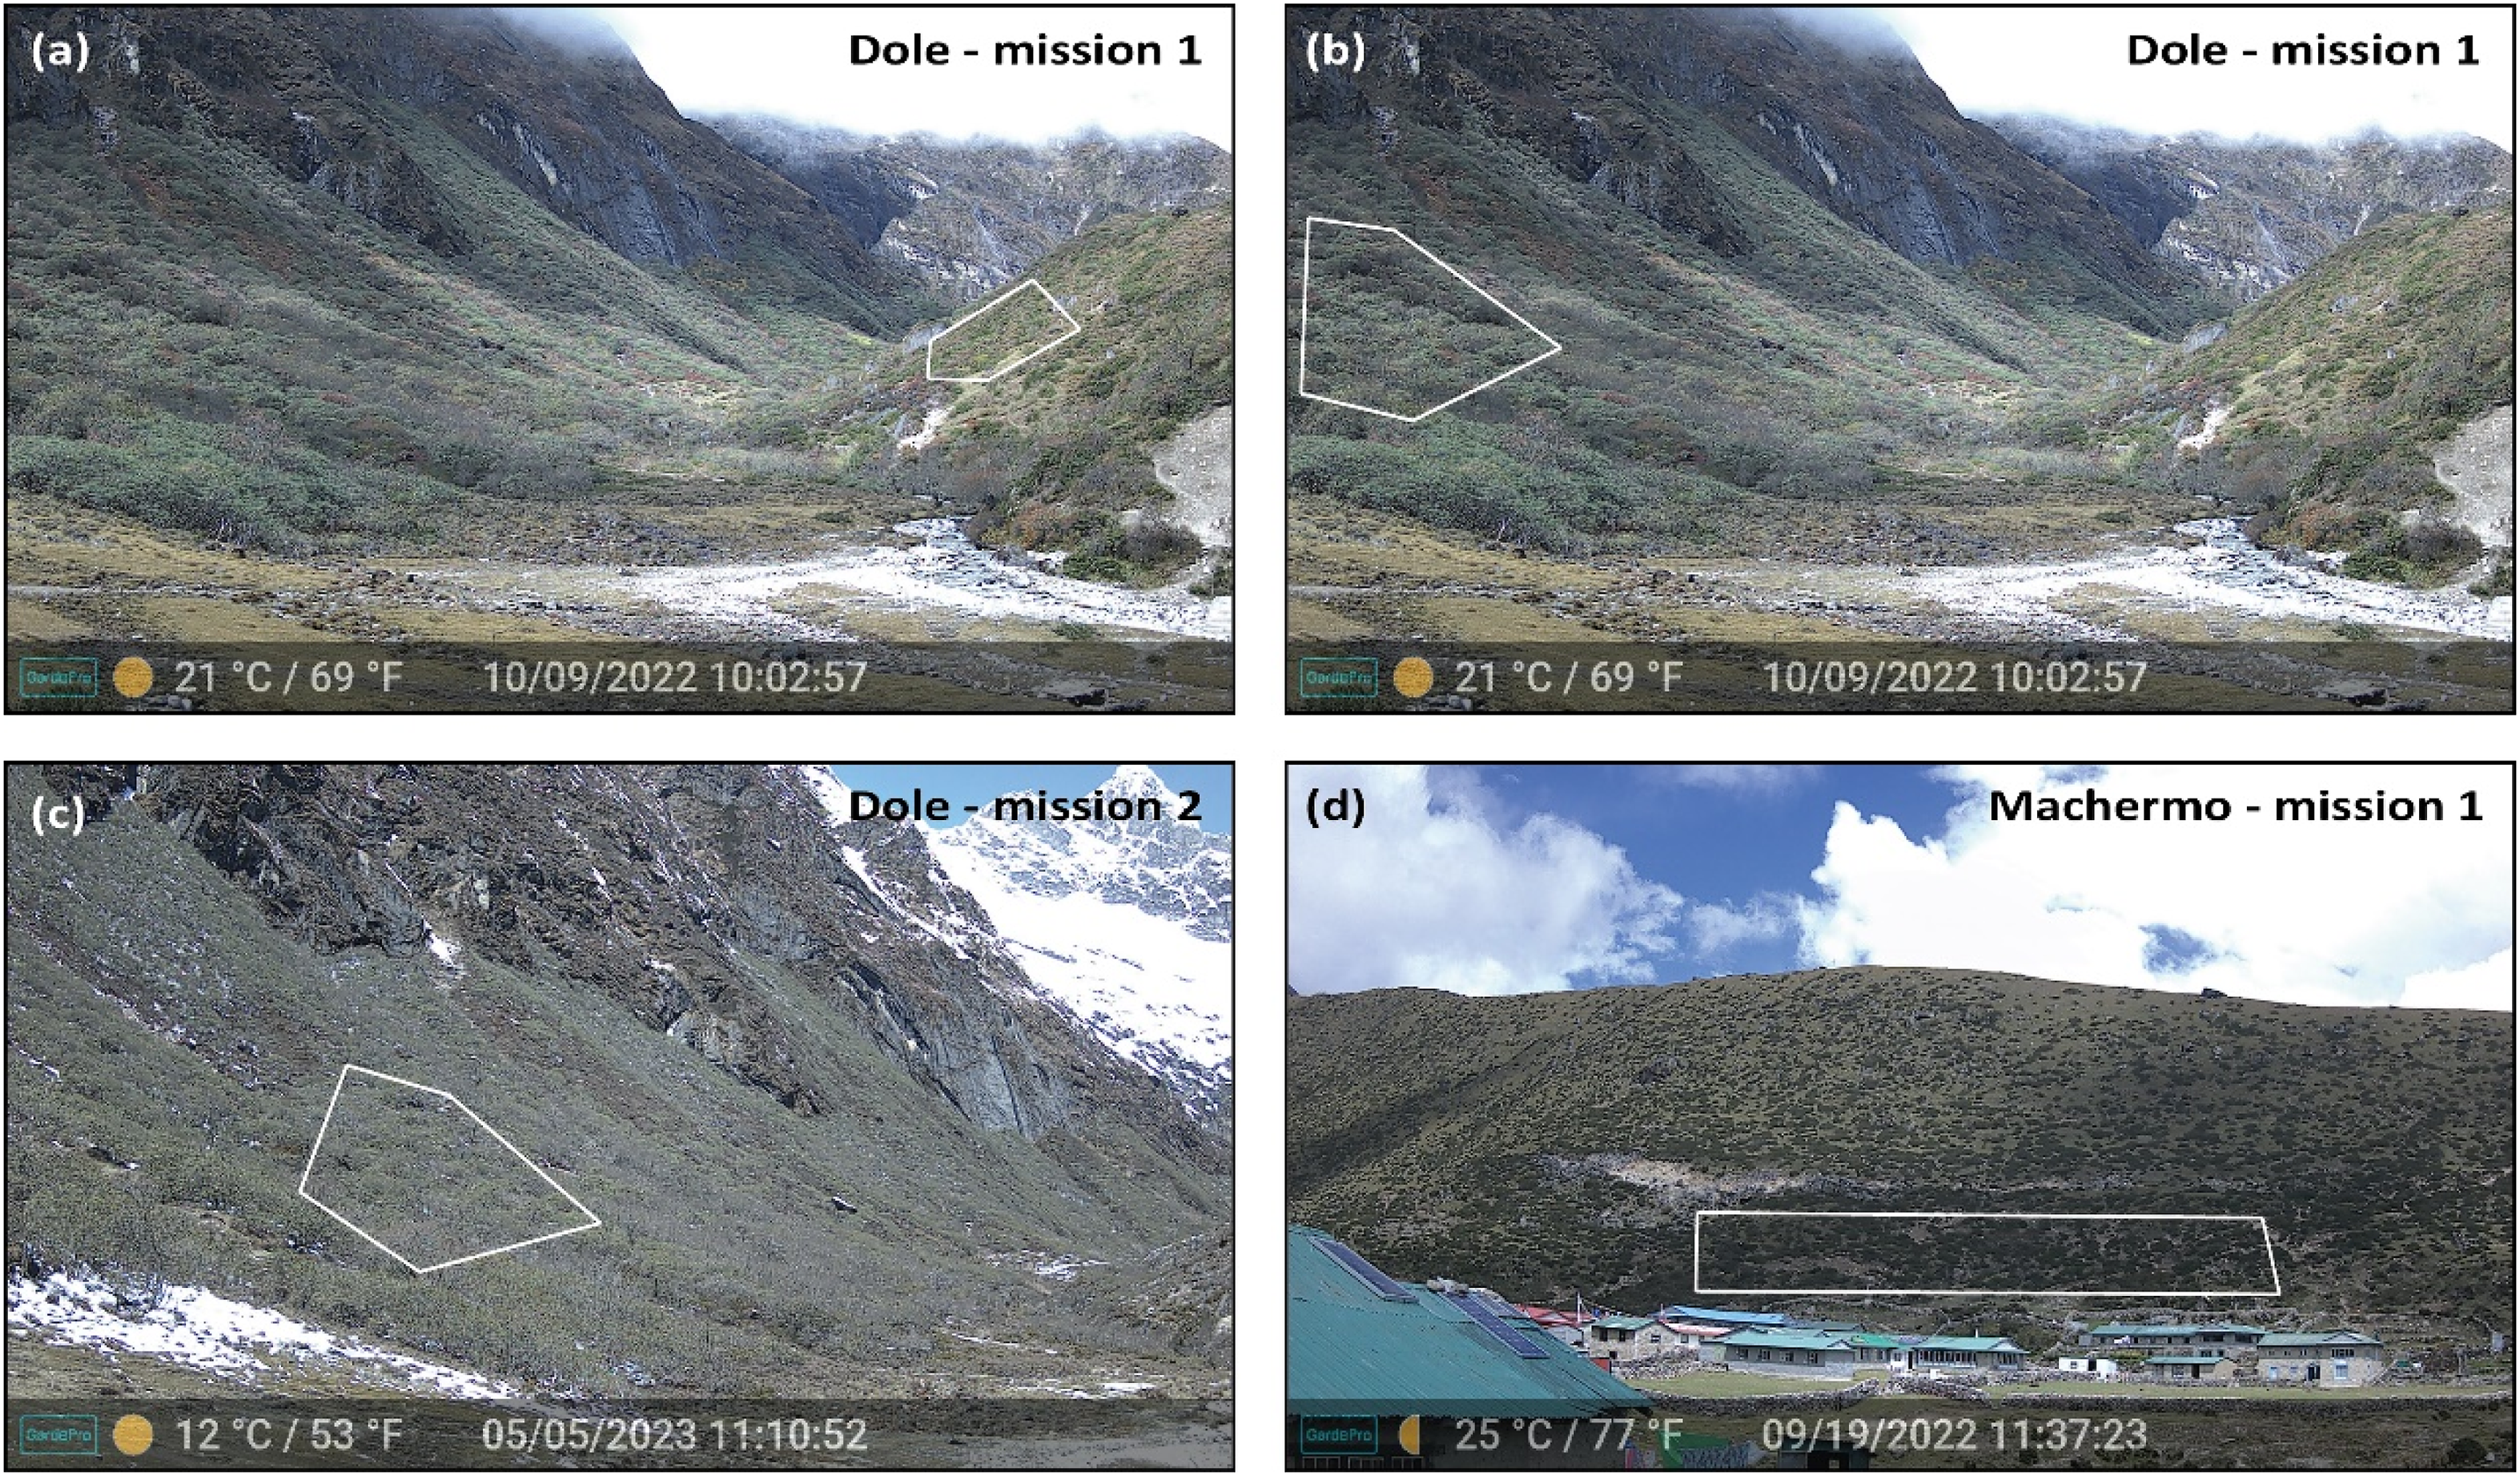
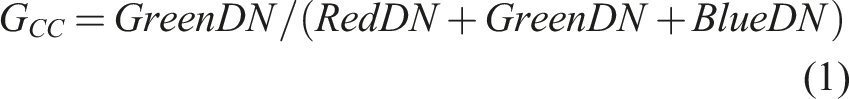
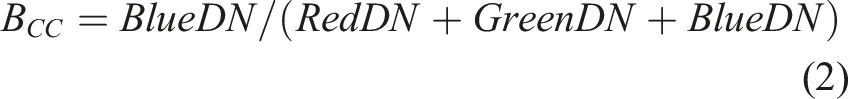
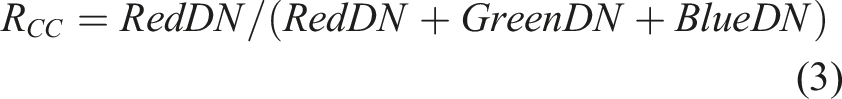
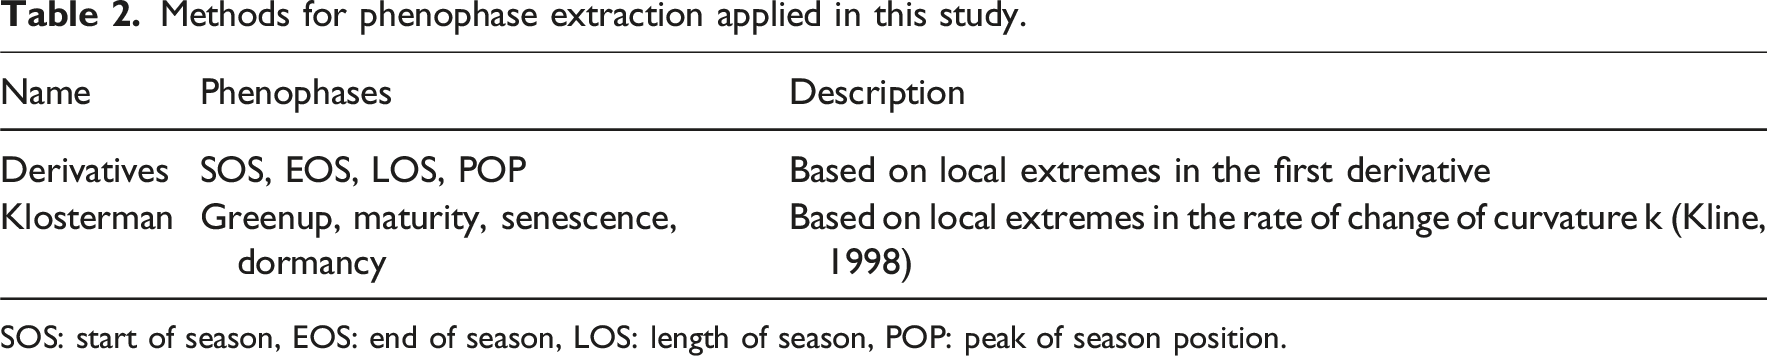
In order to extract phenophases from the images, the following 5 steps were followed: Areas of interest were selected on a single image (Figure 3) then for each image in the collection. Red, green and blue digital numbers were extracted for each pixel within the selected area of interest. Green chromatic coordinate ( Data retrieved from images often need robust methods for filtering the time series. Bad weather, low illumination and dirty or wet lenses can result in poor quality data. Following the built-in filtering framework in Phenopix (Filippa et al., 2016), four of five filters were applied to the images obtained in this study. These filters include (1) a filter called blue, based on blue chromatic coordinate ( The resulting time series were fitted to a range of seasonal curves and phenophase thresholds using the greenExplore function (Filippa et al., 2016). The extraction of phenophases was done in two steps. A curve was fitted to the After curve fitting, two out of four built-in approaches in Phenopix were applied for phenophase extraction (Filippa et al., 2016). These approaches – the derivatives method and Klosterman method – were selected because they do not require a maximum value for calculation, making them suitable given the uncertainty regarding whether peak greenness was reached in the 2023 dataset. The phenophases extracted in this study using each method are summarised in Table 2. For each phenophase threshold, the 10th and 90th percentiles were determined to account for variability and ensure robust phenophase identification. Methods for phenophase extraction applied in this study. SOS: start of season, EOS: end of season, LOS: length of season, POP: peak of season position.
Results
Phenophases of two dominant plant communities in study sites
Figure 4 displays the filtered The filtered Green Chromatic Coordinate ( Summary of Rhododendron spp. and Juniperus spp. phenophases from the two study areas. Day of year (DOY) of each phenophase stage was calculated by derivatives method and Klosterman method, while the 10th and 90th percentiles of each phenophase are given in brackets.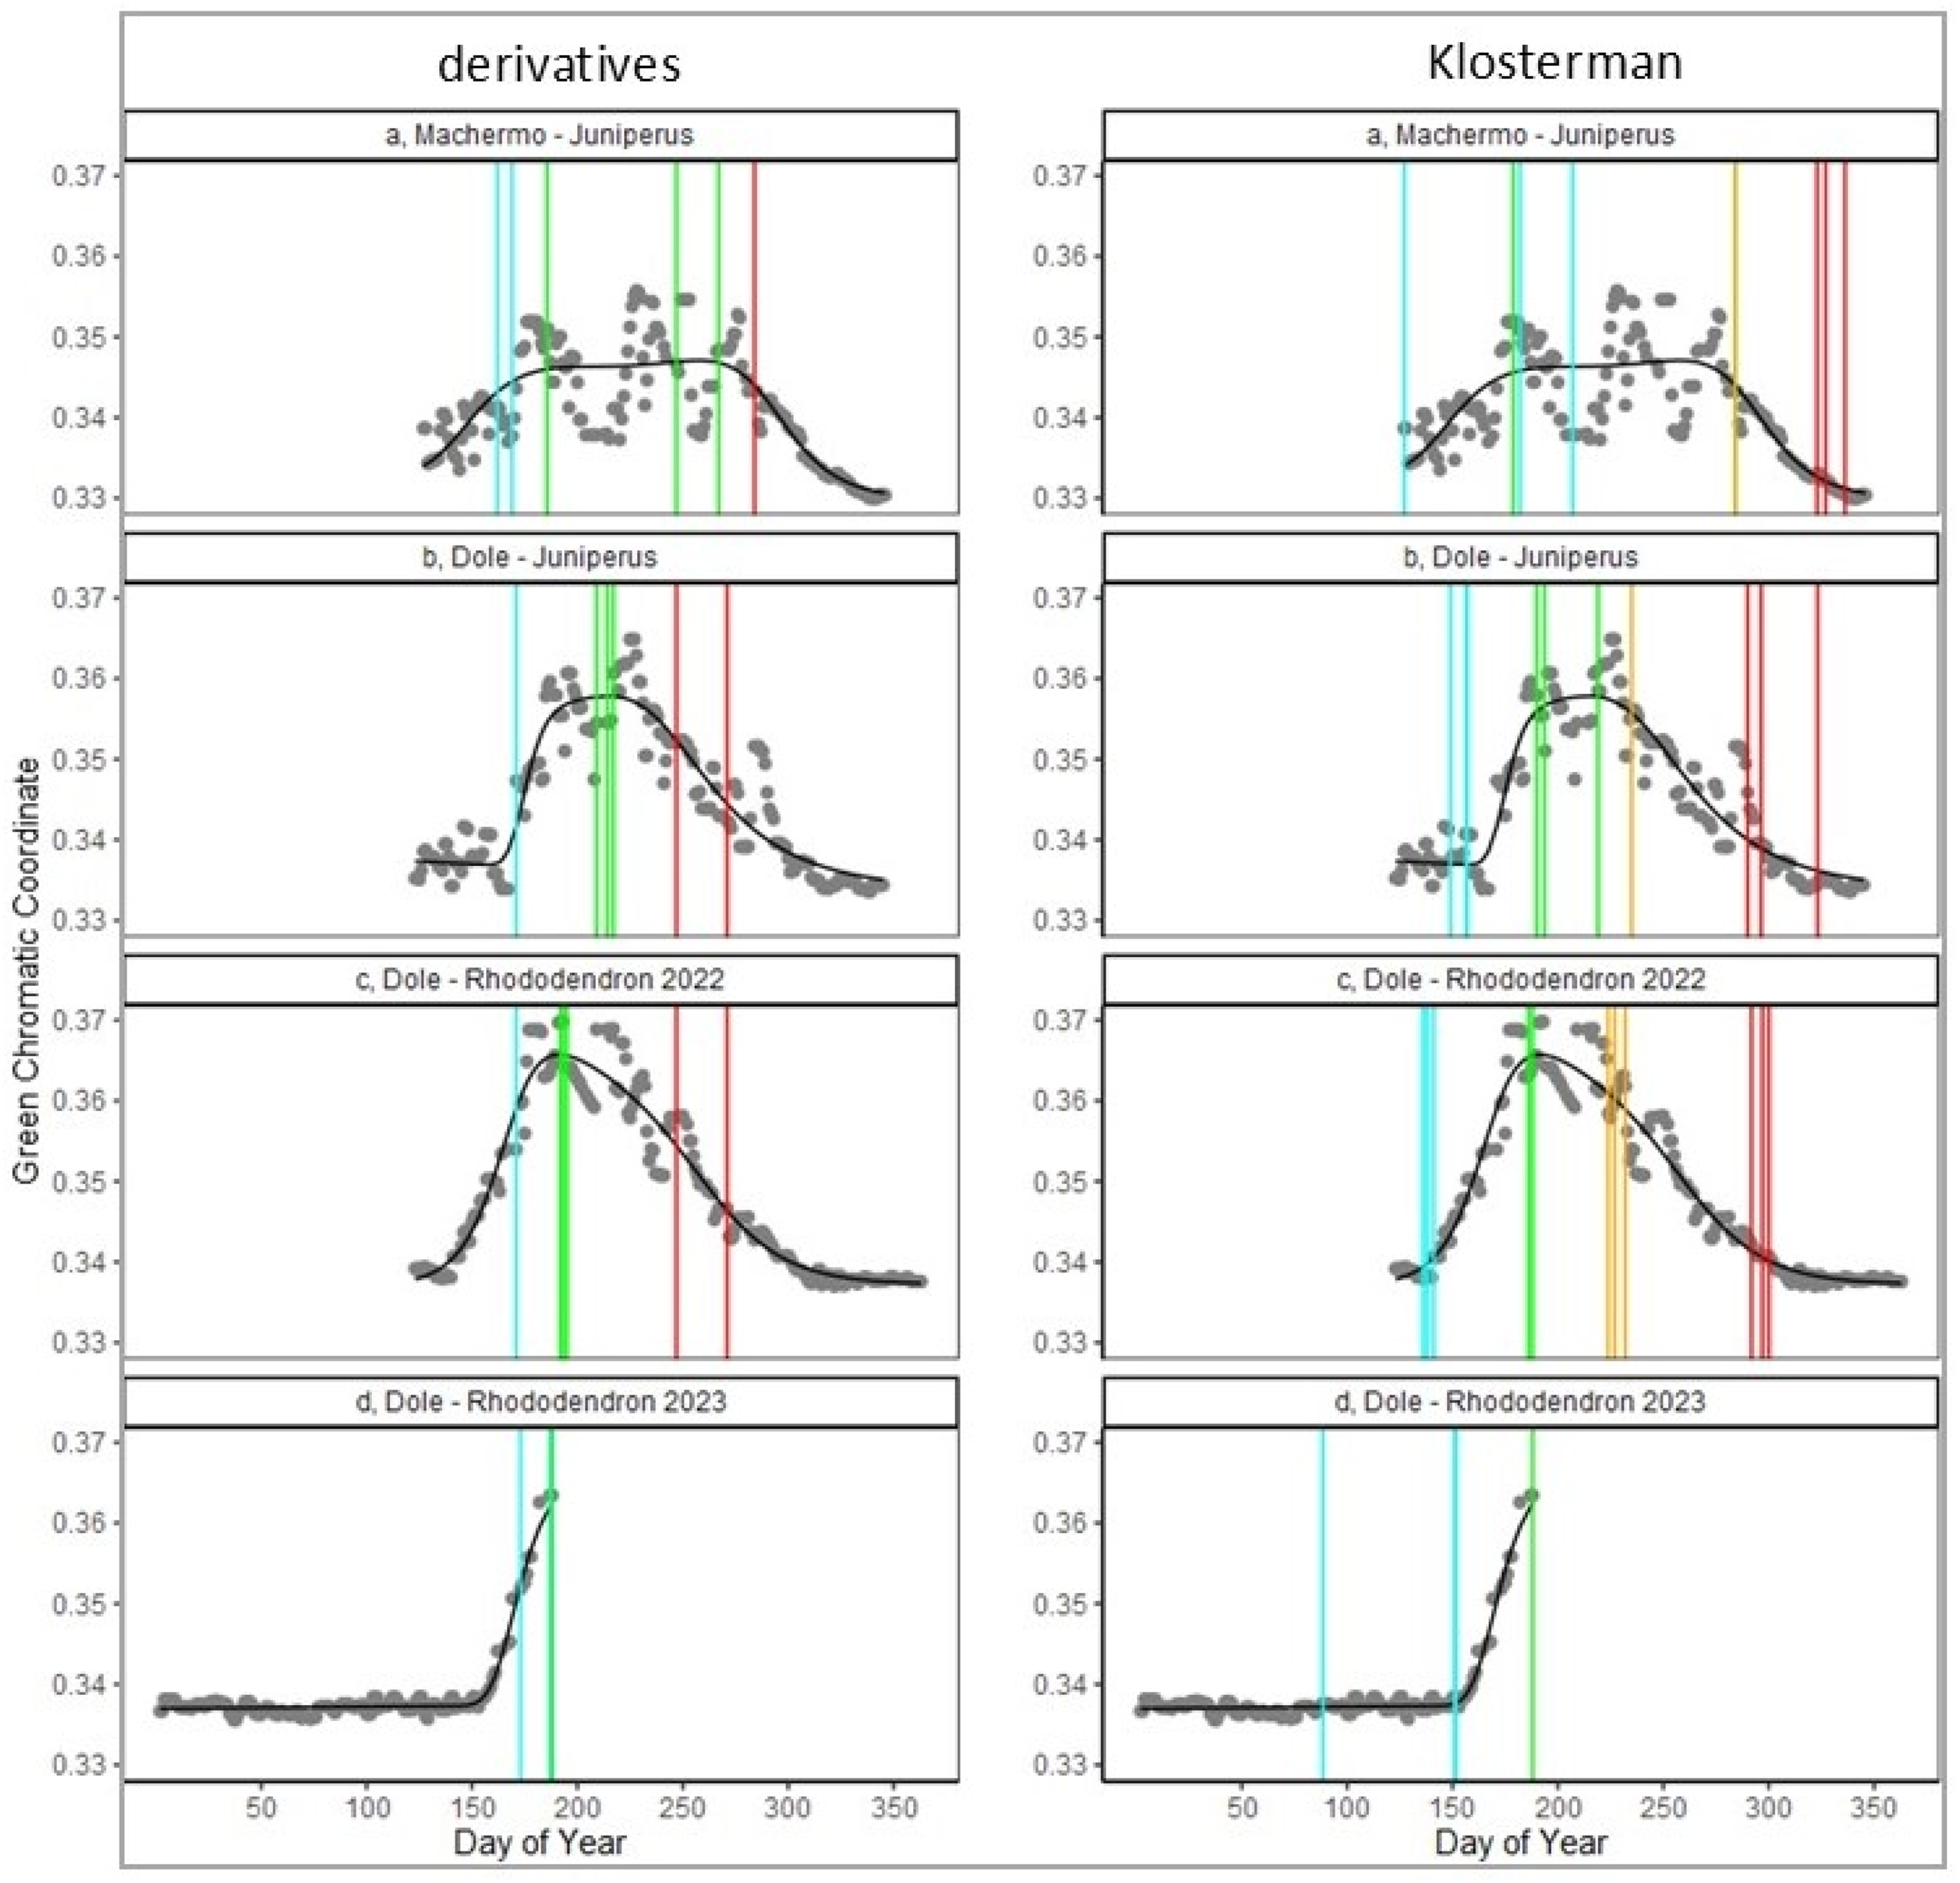
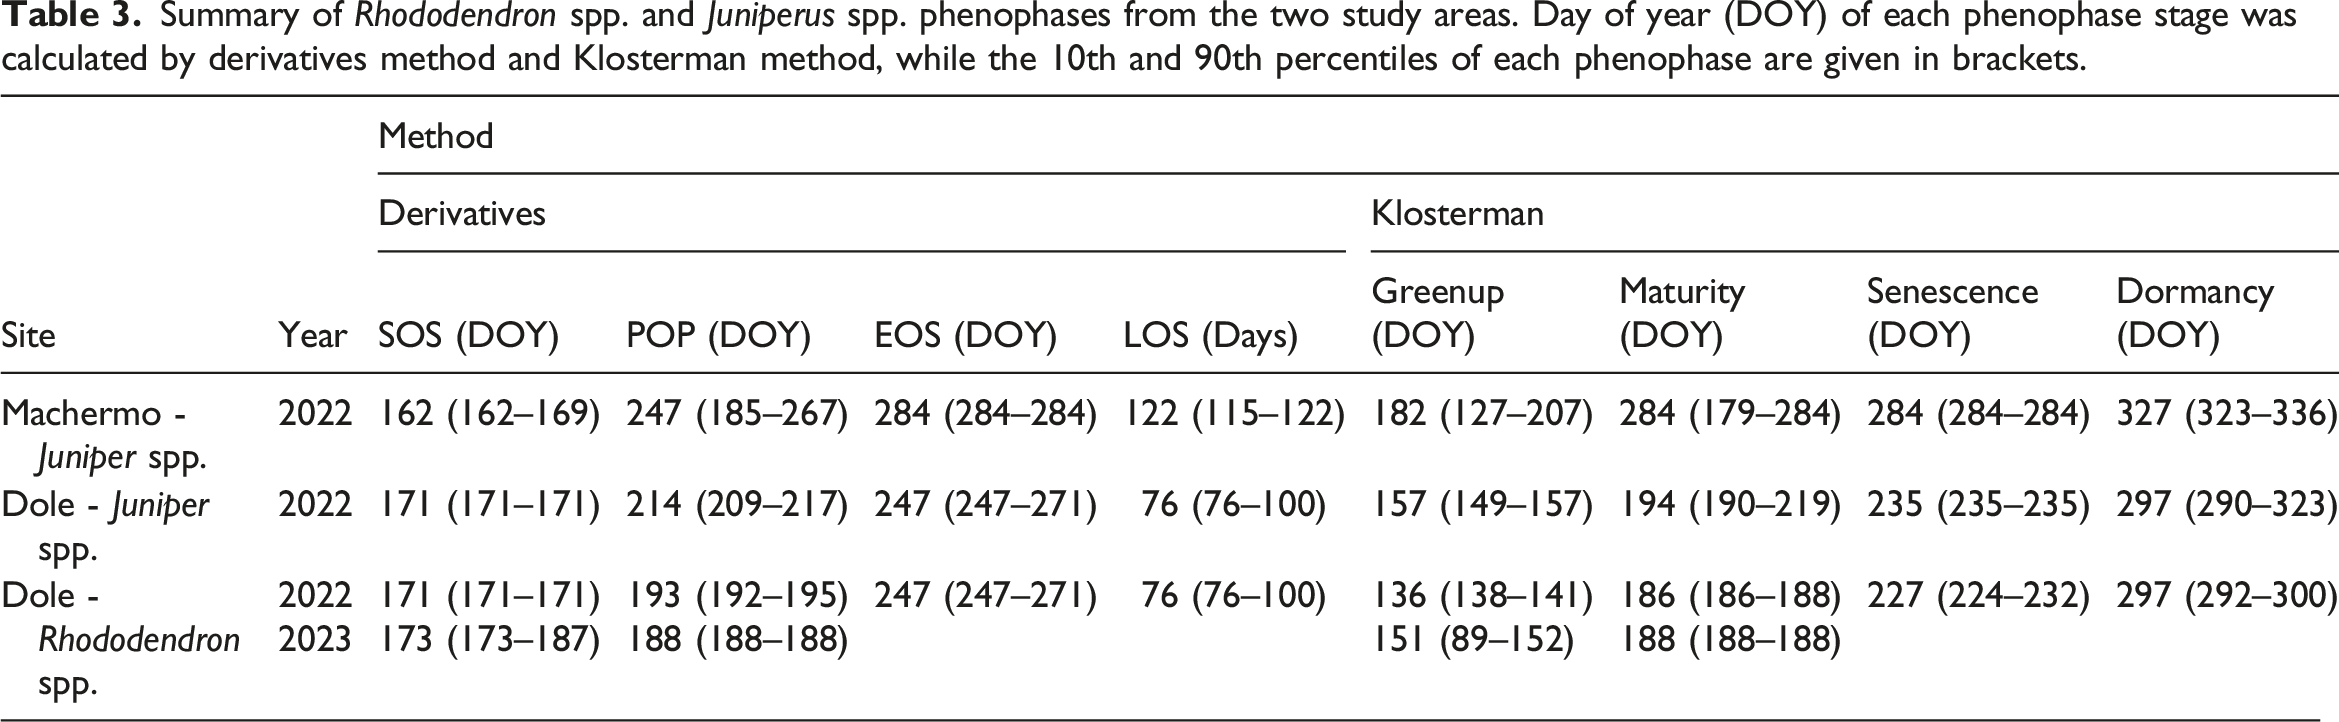
Phenophases derived using these two methods exhibited differences. Longer length of growing season for Juniperus spp. was observed in Machermo compared to Dole (122 and 76 days respectively via derivatives method), corresponding to the longer greening days in Machermo compared to Dole (105 and 45 days respectively via the klosterman method). Although similar LOS was observed in the study areas of Juniperus spp. and Rhododendron spp. (both 76 days via derivatives method) in Dole, different shapes of seasonal curves were displayed (Figure 5). The The comparison of daily average temperature extracted from images captured in Dole (dashed black line) and Machermo (solid orange line). (a) shows the temperatures extracted from daytime images (from 10:00 a.m. to 14:00 p.m.), and (b) shows the temperatures extracted from nighttime images with unknown exact time due to the operational errors with the way that the cameras had been reprogrammed.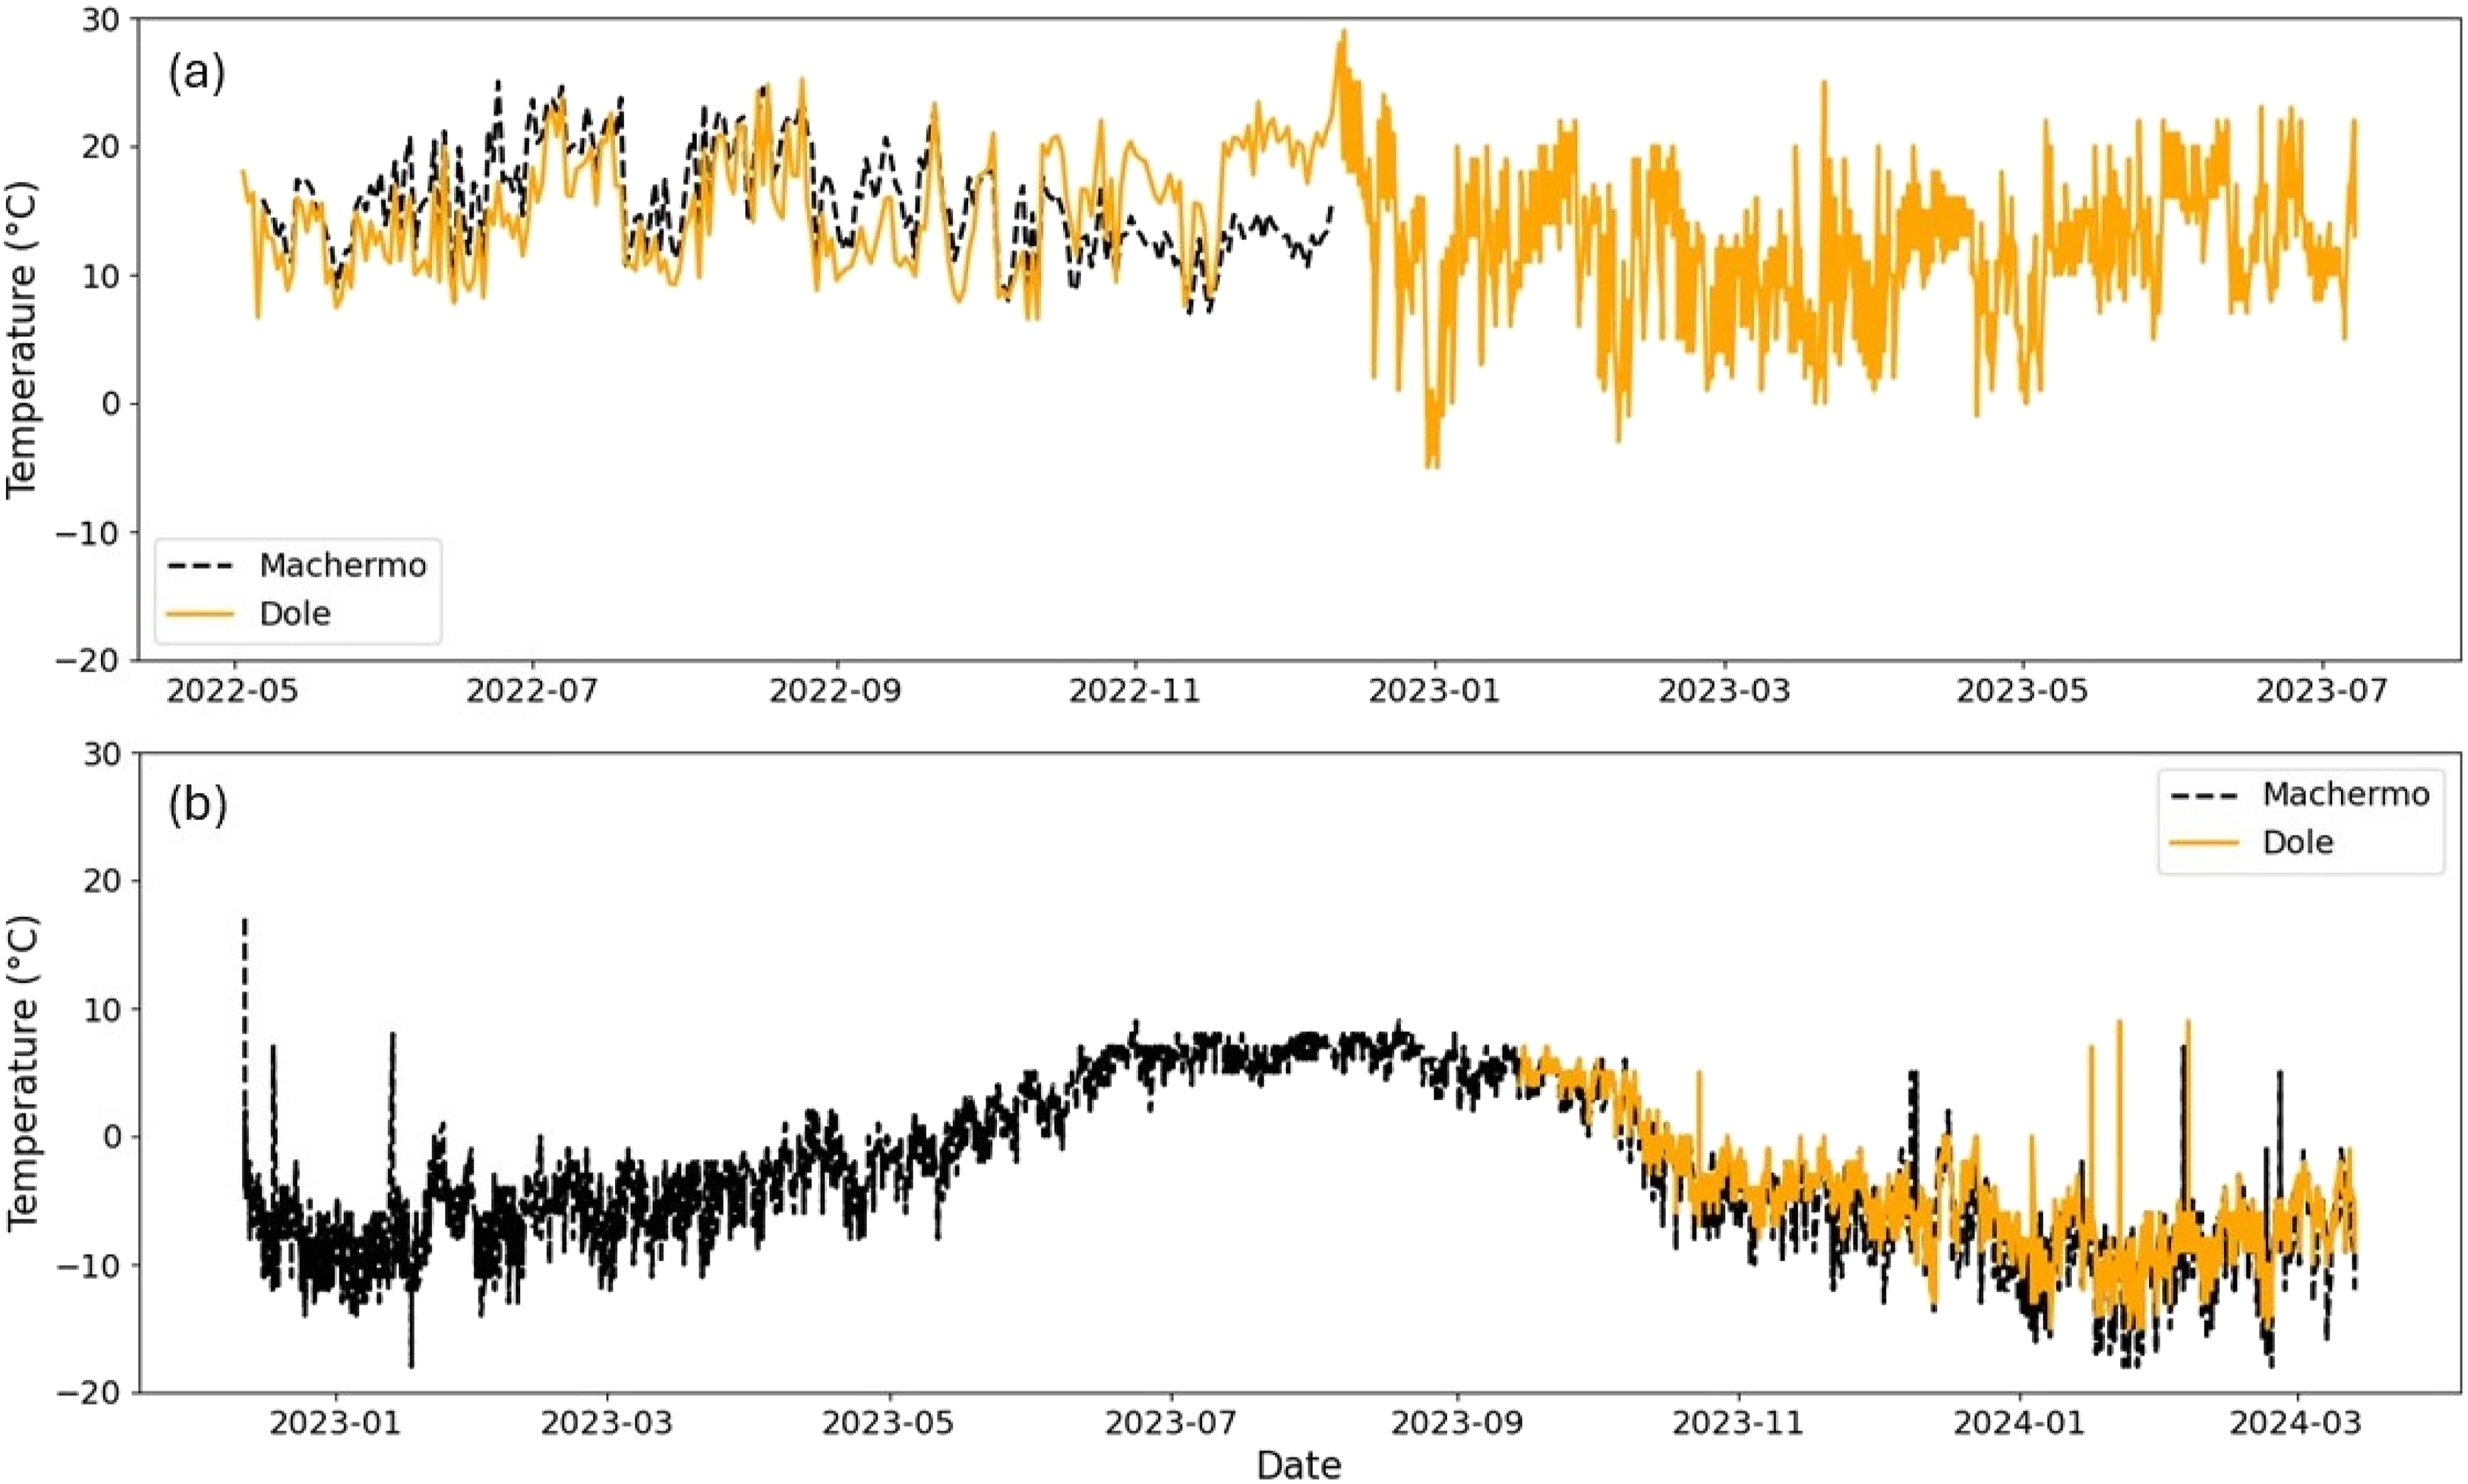
Temperature information derived from trailcam images
Figure 5 shows the comparison of daily average temperature in Dole and Machermo during the daytime and nighttime respectively. The average values of temperatures extracted from eight images were calculated to represent the daily average. The daytime temperatures in Dole and Machermo were similar across the growing season, while higher daytime temperature in Dole than Machermo was observed since November (with an average temperature difference of 10°C). The nighttime temperature in Machermo varied following a seasonal pattern - being below 0°C from January to May, an increase from May to July (being around 5°C through the growing season in July-September), a decrease from September to the next January. The lowest nighttime temperature in Machermo was found in January 2024 (−18°C).
Figure 6 displays the comparison of temperatures derived from trailcam images with logger measurements captured during a separate independent field survey over several corresponding days (Figure 6(a)) and ERA5-Land simulations (Figure 6(b)). Logger temperatures showed a negative correlation with trailcam temperatures (with R2 of 0.92) during the measuring period (10:00 a.m.–14:00 p.m., 07/05/2022). This is likely due to the different placements of the devices, with the trailcam positioned on the rooftop and the logger placed under the roof apex, closer to the ground. Temperature simulations from ERA5-Land exhibited a positive correlation with trailcam temperatures (with R2 of 0.41), while the duplication of trailcam temperatures might generate the offset between the regression model and the reference line. Comparison of temperature measurements derived from trailcam images with logger temperature (a) and ERA5-Land temperature (b). In each panel, the red line represents the linear regression model illustrating the correlation between the respective temperature datasets, with R2 indicating the variance explained by each model. In (b), the grey dashed line represents the 1:1 reference line.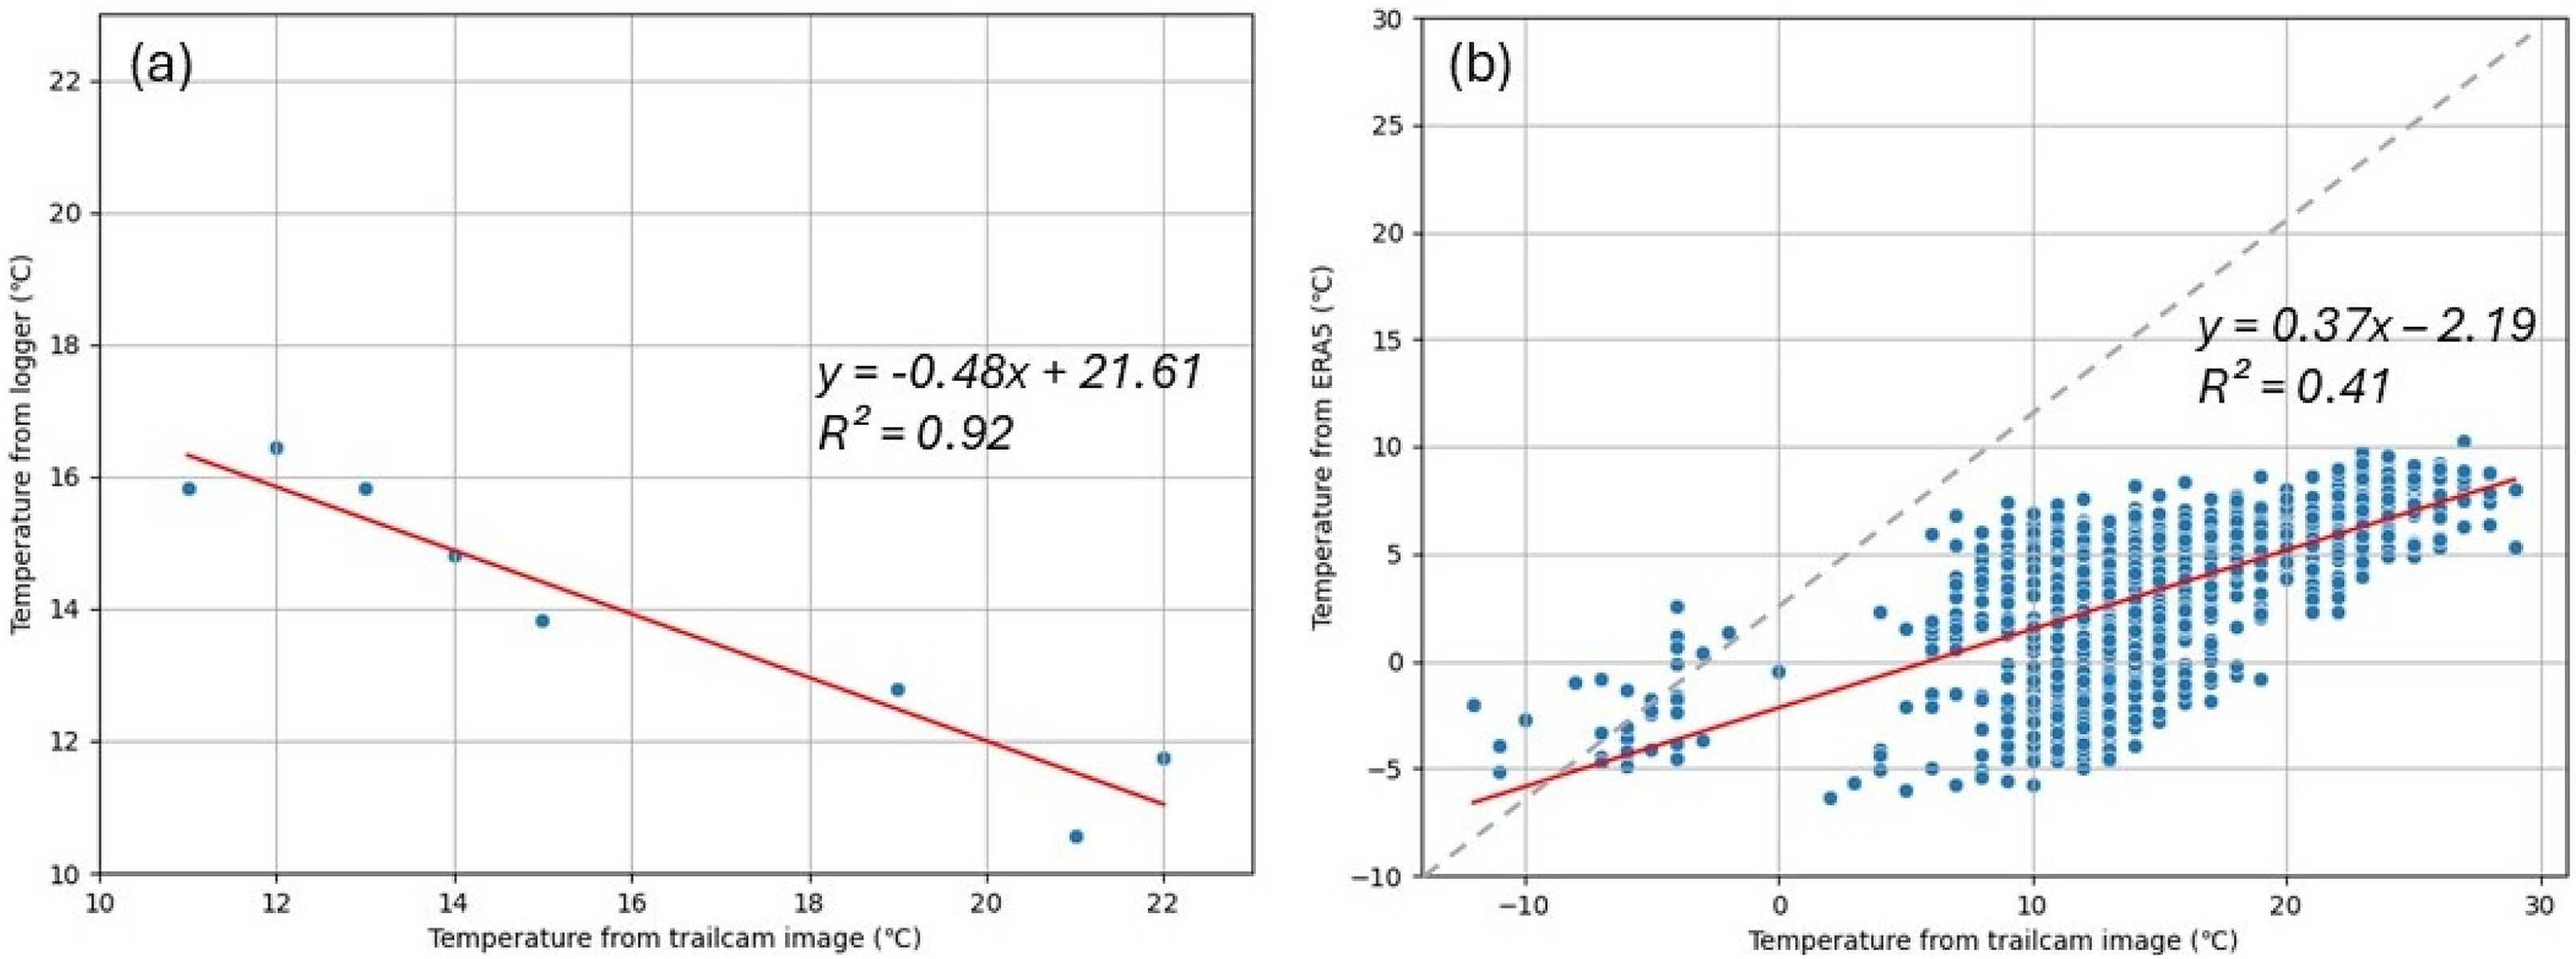
Discussion
Trailcams as PhenoCams in HMA
This work offers a proof-of--concept, testing whether trailcams have potential to be used as a simple version of PhenoCams for monitoring seasonal vegetation dynamics and air temperature in the Himalayan alpine zone. In correspondence with previous studies, this work demonstrated the capacity of using
Moreover, through the daily colour changes in these photographs, in association with daily measurements of climatic variables, a wide range of research questions might be investigated (Alberton et al., 2017). For instance, images from the trailcam could be used to explore ecological resilience, e.g., responses from plant communities to frost, drought, fire or species invasion (Alberton et al., 2023); or seasonal snow dynamics, e.g., the start/end day of snow, snow cover length (Julitta et al., 2014). Notably, as a less advanced camera compared to PhenoCams, trailcams do not provide options for white balance settings, which are essential to maintain colour consistency across images. Variations in light quality between days can lead to inconsistent white balance, potentially causing artificial increases or decreases in
In addition, the built-in sensor of trailcams provides temperature records alongside the photographs (Figure 5). Although the precision of this temperature sensor (1°C) is coarser compared to other standard field temperature loggers (typically 0.02°C for TinyTag TGP-4017), results derived from trailcam images still demonstrate the seasonal variations of daytime and nighttime temperatures in the high-altitude Himalayas. The different precision, and different set-up locations (loggers were under the roof, and trailcams were on the rooftop) might have led to the negative correlation between the temperature measurements in this study (Figure 6(a)). However, trailcams could be a potentially rich source of meteorological information in a changing climate, considering that there are hardly any weather stations in operation within the HAZ (Leng et al., 2023), and not much information available about fine-scale variations in temperature. Overall, this project demonstrates a trailcam set-up and data collection approach that could be used for other simple measuring equipment (e.g., air temperature logger, humidity logger) and in other similarly remote locations.
The phenology of alpine Rhododendron and Juniperus plants
Previous studies documented the phenology of Rhododendron spp. in the Himalayas, particularly around the treeline elevations (Badola, 2010; Paul et al., 2018; Singh et al., 2024). However, most of these studies were using records from in-situ surveys and could only describe phenophase events at monthly intervals. Data from previous studies showed that Rhododendron spp. at 2000–4000 m.a.s.l. exhibits leaf flushing between May to June, also exhibiting leaf shedding during September to November (Paul et al., 2018). These findings correspond to our results in Dole (DOY of greenup (136) and dormancy (297) of Rhododendron spp. in 2022 (Table 3)). Using remote sensing products, Mohapatra et al. (2019) documented that the LOS of Rhododendron plants at the treeline elevation (4000 m.a.s.l.) in the eastern Himalayas was 181 days, later than the LOS reported in our study (161 days using Klosterman method). This discrepancy likely arises because, compared to their study region (Arunachal Pradesh), the Khumbu region is higher in elevation and farther west, resulting in colder temperatures, lower oxygen levels, and reduced precipitation; conditions less favorable for plant growth (Feng et al., 2022). These discrepancies highlight the need for regionally-distributed observations that can capture the heterogeneity of plant phenology across the Himalayas.
Other evidence (e.g., from dendrochronology) has also demonstrated the phenological variations of alpine plants under climate change across global mountains (Arzac et al., 2016). In the Mediterranean, Juniperus plants at higher altitudes (2000 m.a.s.l.) were more negatively affected by precipitation during early spring compared to lower altitudes, indicating that longer lasting snowpacks have a negative impact on shrub growth. This contrasts to the results in this study - longer LOS and earlier DOY of greenup were found of Juniperus spp. in Machermo (4392 m.a.s.l.) compared to Dole (4038 m.a.s.l.; Figure 4; Table 3). A possible explanation for this result is that the more snow precipitation, and colder temperatures at higher altitude in the HAZ might generate longer-lasting snowpack - which has been considered beneficial for plant growth in drought-limited mountainous regions (Olano et al., 2013). Conversely, impacts of snowpack on smaller alpine plants were observed in the eastern Sierra Nevada - a prolonged snowpack, covering totally or partially prostrate plants, may potentially limit their photosynthetic activity and delay the onset of cambial activity (Franklin, 2013). Overall, snow dynamics (e.g., snow cover length, the time of snowmelt) appear to have no universal impact on high-altitude plant phenology (Inouye and Wielgolaski, 2003). These different findings from different ecosystems highlight the complex ways in which plants respond to changing climate, particularly along broad bioclimatic gradients (Sigdel et al., 2024). Hence, more attention and in-situ measurements are needed for further understanding of the ecosystem responses to climate change in the Himalayan alpine regions.
Benefits to locals
Beyond improving understanding the plant-climate feedbacks and providing key inputs for ecological and hydrological modelling, vegetation information captured by PhenoCams also benefits local residents, national park authorities, and other stakeholders. Long-term monitoring of plant community dynamics (e.g., species composition, distribution, productivity and phenology) can inform agricultural and resource management, such as reducing overgrazing by adjusting grazing locations according to plant biomass (Browning et al., 2019), improving the sustainability of forest harvesting (Kattel 2022), and supporting more efficient water use for irrigation (Yu et al., 2024). In addition, landscape information derived from PhenoCams can support the detection of disturbances and extreme events, including wildfires, snowslide, flash floods and extreme rainfall (Alberton et al., 2017), thereby contributing to the protection of human health and property, as well as informing tourism management (e.g., warnings during extreme weather events from high altitudes).
The PhenoCam system also offers educational opportunities for local communities, raising awareness of climate change, ecosystem dynamics and conservation. It can serve as a valuable teaching tool in local schools, informing lessons on alpine botany and climate change, topics that secondary school students find particularly engaging (Pandeya et al., 2021). Improved environmental management supported by such initiatives not only improves local living conditions (e.g., by reducing overgrazing, promoting waste recycling and protecting biodiversity), but also fosters potential growth in ecotourism, thereby generating additional income for mountain residents. In the long term, a PhenoCam network across the alpine Himalayas could document ecosystem changes such as glacier retreat, snow dynamics, and shifts in plant communities, contributing both to scientific understanding and to ecotourism development by allowing visitors to witness the transformation of alpine landscapes.
For this project, we obtained official approval from the national park authorities and collaborated with a local research company – Himalayan Research Limited, Kathmandu, as well as lodge owners in alpine villages. As a pilot study, the project aimed to test the feasibility and establish this low-cost methodology. Scaling it up would require strong support from local authorities, state government and village-level stakeholders. In the future, the initiative could benefit national park managers and local non-profit organizations (e.g., Sagarmatha National Park Forestry Project, SNPFP, and the World Wide Fund for Nature, WWF). Sharing data with these groups can support environmental management and encourage their active involvement. Moreover, local authorities, leaders and community champions could be key intermediaries, facilitating communication in local languages (e.g., roundtable discussions), organizing knowledge-sharing events (e.g., demonstrations of PhenoCam results), and delivering project messages. Such engagement has proven valuable for raising awareness of low-cost sensors and promoting participatory data and knowledge co-generation that directly benefit local environmental management. Looking ahead, a PhenoCam network could help transfer technical expertise to local organizations in Nepal.
Limits and potential opportunities
In this project, data were collected by local collaborators and memory cards downloaded in Kathmandu, with filesharing sites used to transfer data to UK-based researchers. This approach is “lower-carbon” because the devices require minimal electricity, and the data transfer approach avoids the substantial emissions associated with international travel that would otherwise be needed for UK-based scientists to revisit the survey sites to manage the phenocams. It also provides an additional source of income for local collaborators. In the future, an ideal PhenoCam system would transmit real-time data to cloud storage, making it accessible to both international researchers and local stakeholders. Achieving this would require internet and electrical connectivity, which are currently lacking in the HAZ. Solar panels offer a potential solution for the electricity constraint – installing them in lodges responsible for monitoring devices could provide a win-win outcome, ensuring stable and affordable power for lodge owners while safeguarding device operation and data transmission. However, this would require approval and support from local government and national park authorities, as well as financial investment from international research projects or non-governmental organizations.
Here, PhenoCams were installed on the rooftops of lodges (i.e. private properties of lodge owners), which helped protect them from damage. In the future, if additional monitoring devices are deployed at study sites, precautions will be needed to prevent accidental damage or tampering. Such installations may also raise concerns among local residents, who might fear that cameras are monitoring people rather than plants, leading to privacy issues. Furthermore, some sites may overlap with grazing lands, sacred groves, or other culturally sensitive areas. Addressing these challenges will require clear communication between researchers, local leaders, and community champions to explain purpose of the devices and highlight their benefits for local communities; as well as careful ethical frameworks governing deployment, analysis and data security.
Another limitation of this study was the potential for miscommunication arising from language differences. Although step-by-step instructions were provided to local collaborators for maintaining the devices, user errors still occurred. As a result, the trail camera at Machermo was incorrectly configured during Year 2 and 3, leading to all images being recorded in the middle of the night (Figure 7). Examples of wrong images taken at night in Machermo from Jan/2023 to Mar/2024.
Conclusion
In this study, we expanded time-lapse lower-cost PhenoCam projects into the Himalayan mountains, at sites with the highest elevations ever monitored with such approaches (to our knowledge – Dole (4038 m.a.s.l.) and Machermo (4392 m.a.s.l.)). This work has demonstrated the approach using standard consumer-grade trailcams for monitoring the phenology of dominant plant communities within the Himalayan alpine zone. Results from image analysis using colour chromatic coordinate exhibited the discrepancies of phenology between Juniperus spp. and Rhododendron spp., and the differences between phenophase events of Juniperus spp. at two altitudes. This study helps to fills the current gap in our understanding of the seasonal variations of dwarf plants in the Himalayan alpine zone. It also demonstrates a low-cost, low-carbon and communities-maintained methodology to obtain long-term in-situ observations in the remote mountainous regions. This shows the power and limitations of conducting citizen science within the high-altitude Himalayan communities.
Footnotes
Funding
This work was funded by a co-scholarship within the Chinese Scholarship Council (CSC) and University of Exeter, “The Eco-hydrological Interactions between Vegetation and Snow in the Alpine Himalayan” (202006180013); funding from a Remote Sensing and Photogrammetry Society (RSPSoc) Bill Barlow Award in 2022; and the University of Exeter Centre for Geography and Environmental Science strategic research funding supported our field trip in Nepal.
Declaration of conflicting interests
The authors declared no potential conflicts of interest with respect to the research, authorship, and/or publication of this article.