
Abstract
Peatlands play a crucial role in carbon storage and climate regulation. Traditional gravity-based and loss-on-ignition methods have been widely used to acquire bulk density and thus organic carbon estimates in peat sequences. However, these methods are time-consuming, and the measurement resolution frequently ranges from half to a few centimetres, hampering the understanding of carbon accumulation history at finer temporal resolution. Here, we explore the potential of non-destructive X-ray computed tomography (XCT), a method for analyzing 3D material structure and mass density, for obtaining proxy measurements for bulk density parameters using peat cores collected in eastern boreal Quebec, Canada. We find that the Hounsfield Unit (HU) of medical XCT scans is a robust surrogate for the bulk density of wet peat (BDwet). A universal linear model can be applied to calibrate HU values for a wide range of peat stratigraphy from different microforms: Sphagnum hummock, lichen hummock, lawn, and hollow. Moreover, HU of dry peat is indicative of both dry and organic matter bulk density (BDdry and BDom). It is possible to develop case-specific logarithmic models to calibrate HU with BDdry. In addition, the precise measurement of the peat sample volumes using XCT suggests that traditional methods can be subject to substantial uncertainties when estimating bulk density and carbon content. Medical XCT can be applied to quantify bulk density in peat soils in a more time-efficient manner, with a resolution up to 0.6 mm, approximately equivalent to the yearly accumulation rate.
Introduction
Peatlands are significant and persistent sinks in the global carbon cycle, containing around 415 ± 150 Pg carbon (C) and where a large portion is stored in the boreal biome (Hugelius et al., 2020). This is equivalent to 15–30% of global forest soil C, despite its area only accounts for 3% global land surface (Xu et al., 2018; Yu et al., 2010). Moreover, peatland C stocks in forested boreal ecosystems can be several times greater than forest aboveground biomass (Beaulne et al., 2021), highlighting the vital and potential role of boreal peatlands in mitigating future climate change. On the other hand, estimates of boreal peatland C remain uncertain due mainly to the limited availability of peat data across spatiotemporal domains (Yu, 2012). Thus, accurate and time-efficient quantification of peat C stocks is critically needed to better unravel the future role of northern peatlands as a C source or sink.
Peat biomass has traditionally been estimated using gravity-based methods that rely on weighing a sample with known volume from wet to dry or burned status (Chambers et al., 2011). While multiple metrics can be measured, dry bulk density (BDdry), that is, the ratio between the oven-dry mass and the volume of wet peat, is widely used for C stock estimation (Anshari et al., 2022; Beaulne et al., 2021; Charman et al., 2013). Another way to quantify carbon more directly in peat is to account for both bulk density and carbon content, known as organic matter bulk density (BDom) through the ‘loss on ignition’ (LOI) approach. However, data of gravity-based methods are subject to substantial uncertainty as it may be technically difficult to sample an accurate volume of highly deformable peat material. Even a small bias in bulk density values can significantly affect the estimates of carbon accumulation rates across a vast area. In addition, along the depth profile, resolution of gravity-based bulk density metrics often ranges between a half to a few centimetres to ensure samples are large enough for precise measurements (Charman et al., 2013; Turberg et al., 2014). Given an average accumulation rate of 0.5 mm year-1 (Gorham et al., 2012), these measurements indicate a time step of one to several decades. This may further hamper the understanding of the carbon accumulation history of peat at finer temporal resolutions. Further, operation of gravity-based methods can be time- and labour-intensive when a large quantity of peat cores is targeted.
X-ray computed tomography (hereafter referred to as XCT) was first developed for medical applications, but quickly gained interest in earth, environmental, and plant sciences, especially for high-resolution studies (Boespflug et al., 1995; Brunelle et al., 2016; Cnudde and Boone, 2013; Reilly et al., 2017; Zhang et al., 2023). It relies primarily on a series of X-ray radiographs taken at different angles, where the attenuation is the combination of two phenomena: Compton Scattering, dominant at higher incident energies, is strongly related to the material’s mass density (Withers et al., 2021), and the photoelectric effect, stronger at lower incident energies, is dependent on the sample atomic number (Z). Then, a mathematical algorithm processes these images to create cross-sectional ‘slices’, which combined together form a 3D model of the sample (e.g. Kalender 2011). The main advantage of XCT arises from the possibility of investigating the three-dimensional structure and the mass density of a scanned object without destruction (Reilly et al., 2017). Studies attempted to explore the porosity, hydraulic, and transport properties of peat using XCT (Kettridge and Binley, 2008; Quinton et al., 2009; Toscano et al., 2018). Only a few have focused on bulk density. Turberg et al. (2014) reported a strong linear relationship between the bulk density of wet peat (hereafter referred to as BDwet) and XCT attenuation for several types of peat. Davey et al. (2011) similarly found linearity between the XCT numbers expressed as the Hounsfield Unit (HU) and density for marsh peaty soils in the eastern United States. Yet, these studies suggest rather large residuals following linear regressions between HU and BDwet (Davey et al., 2011; Turberg et al., 2014). It is not clear whether these discrepancies came from the limited ability of XCT to accurately estimate bulk density, or from other sources of uncertainties related to LOI measurements. Furthermore, it is not well understood whether XCT is powerful to estimate BDdry and BDom that are more direct indicators of peat biomass than BDwet and hence are useful for global carbon stock estimates.
In this study, we investigate the potential of XCT scanning for quantifying (wet, dry, and organic matter) bulk density of peat sequences from the eastern Canadian boreal forest ecoregion. Our objectives are to: (1) assess the relationship between HU and BDwet measured following two approaches, the traditional LOI and a method combining the mass and XCT image-based volumetric estimate; and (2) test whether and how XCT can be applicable to estimate peat BDdry and BDom.
Materials and Methods
Study area and peat cores
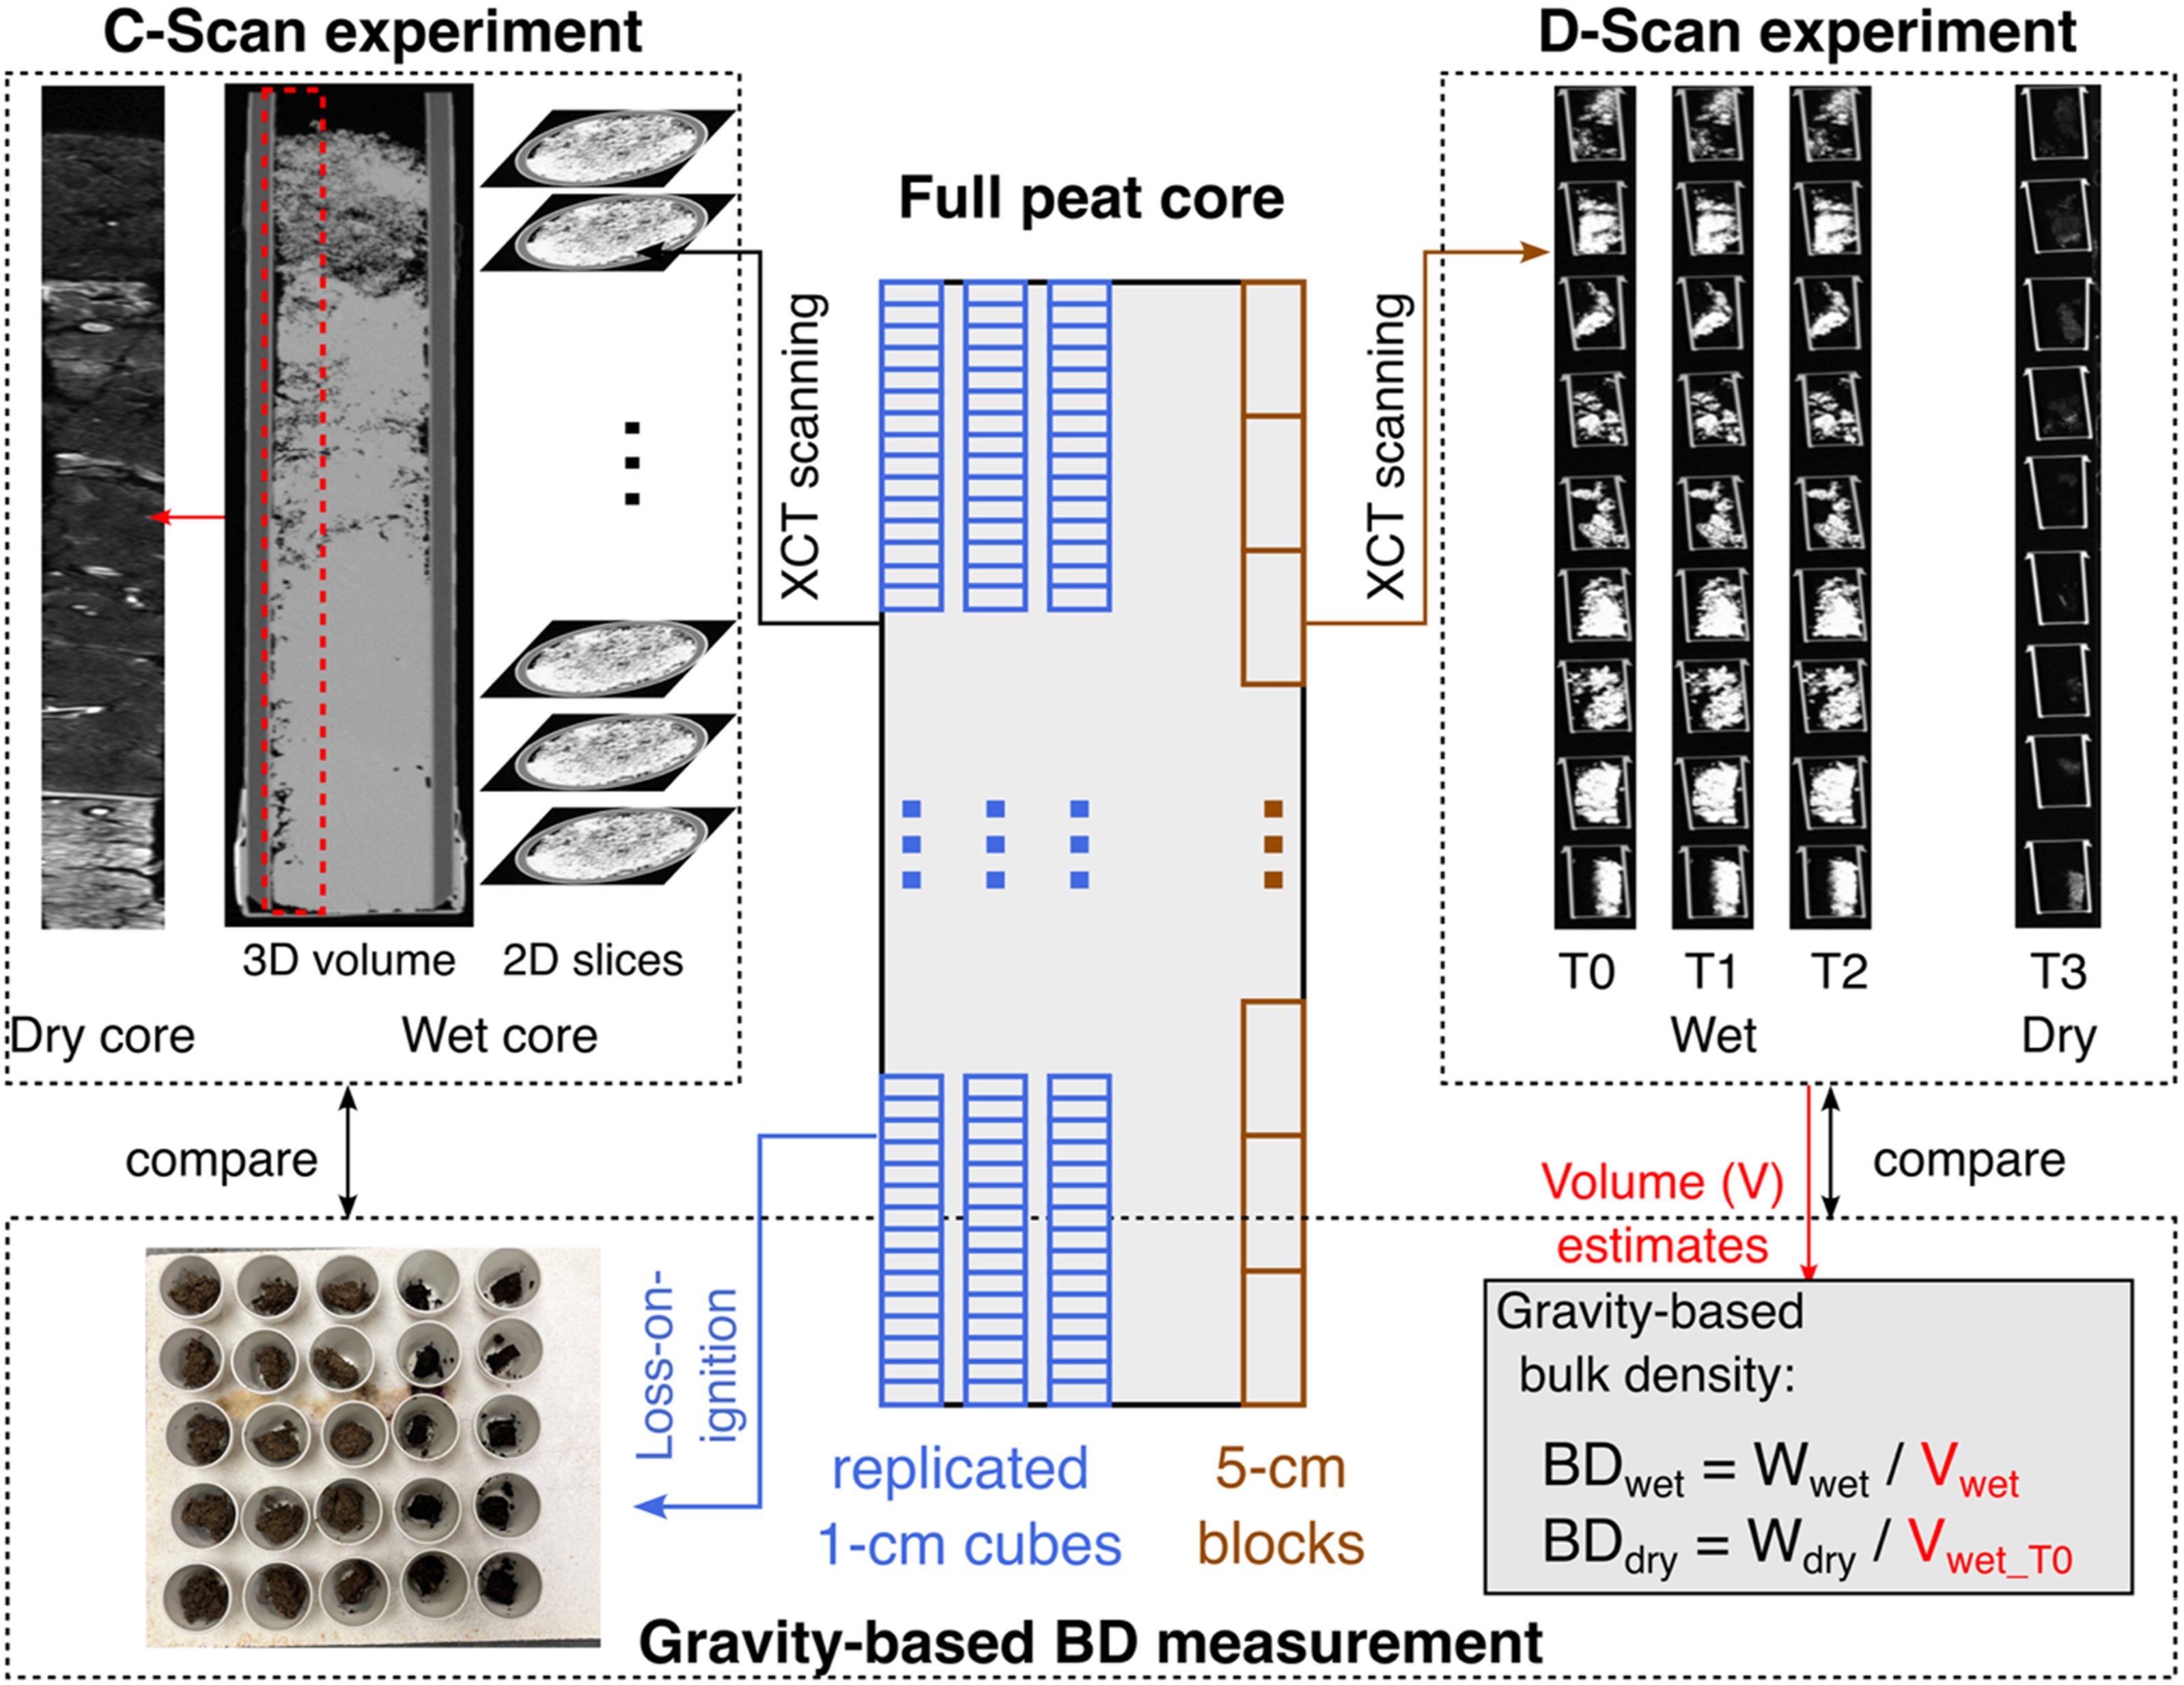
Four peat cores were sampled in October of 2020 from the Bouleau peatland (Primeau and Garneau, 2021) in the La Romaine River watershed in eastern boreal Canadian region (Figure 1(a)). Located at approximately 30 km north of the Gulf of St Lawrence the site is a slightly dome-shaped bog (∼1.51 km2) with a clear patterned surface of alternating dry hummocks, wet hollows, and elliptical pools (Primeau and Garneau, 2021). Climate is typical of subarctic conditions with a mean annual temperature of 1.2°C and a total annual precipitation of 1077.4 mm according to the 1991–2020 climate normal of the nearby Sept-Iles meteorological station (Environment and Climate Change Canada, 2024). The warmest and coldest months occur in July (15.1°C) and January (−14.5°C), respectively, while the precipitation is more abundant in July through November. In the field, cores were retrieved from each of the microforms (hollow: core A4, Sphagnum hummock: core B4, lichen hummock: core C1_2, and lawn: core C2_3; Figure 1(b)) using 50 cm long PVC tubes (diameter: 10 cm). Bottoms of the cores were cut with a serrated knife and PVC tubes were wrapped in cellophane film before transportation to the laboratory where they were stored at 4°C. The four peat cores were then processed in the laboratory according to the workflows shown in Figure 2. Location of sampling peatland (a) and overview of peat cores used in this study along with the colour scale at the bottom (b). The grey shading and red dots in (a) refer to the distribution range of the North American boreal forest (Brandt, 2009) and the sampling site, respectively. The inset photograph in (a) shows the sampling of one peat core. A4: hollow; B4: Sphagnum hummock; C1_2: lichen hummock; C2_3: lawn. XCT and bulk density (BD) measurement pathways. C-Scan refers to the continuous scan and D-Scan to the discrete scan experiment (see Materials and Methods). T0 to T3 denote series of scans performed at different times for D-Scan. 1 cm thick × 3.344 cm2 cubes were cut from three replicated stripes (in blue) sliced along the depth of each peat sequence. Larger peat blocks (in brown) were used for the discrete samples experiment.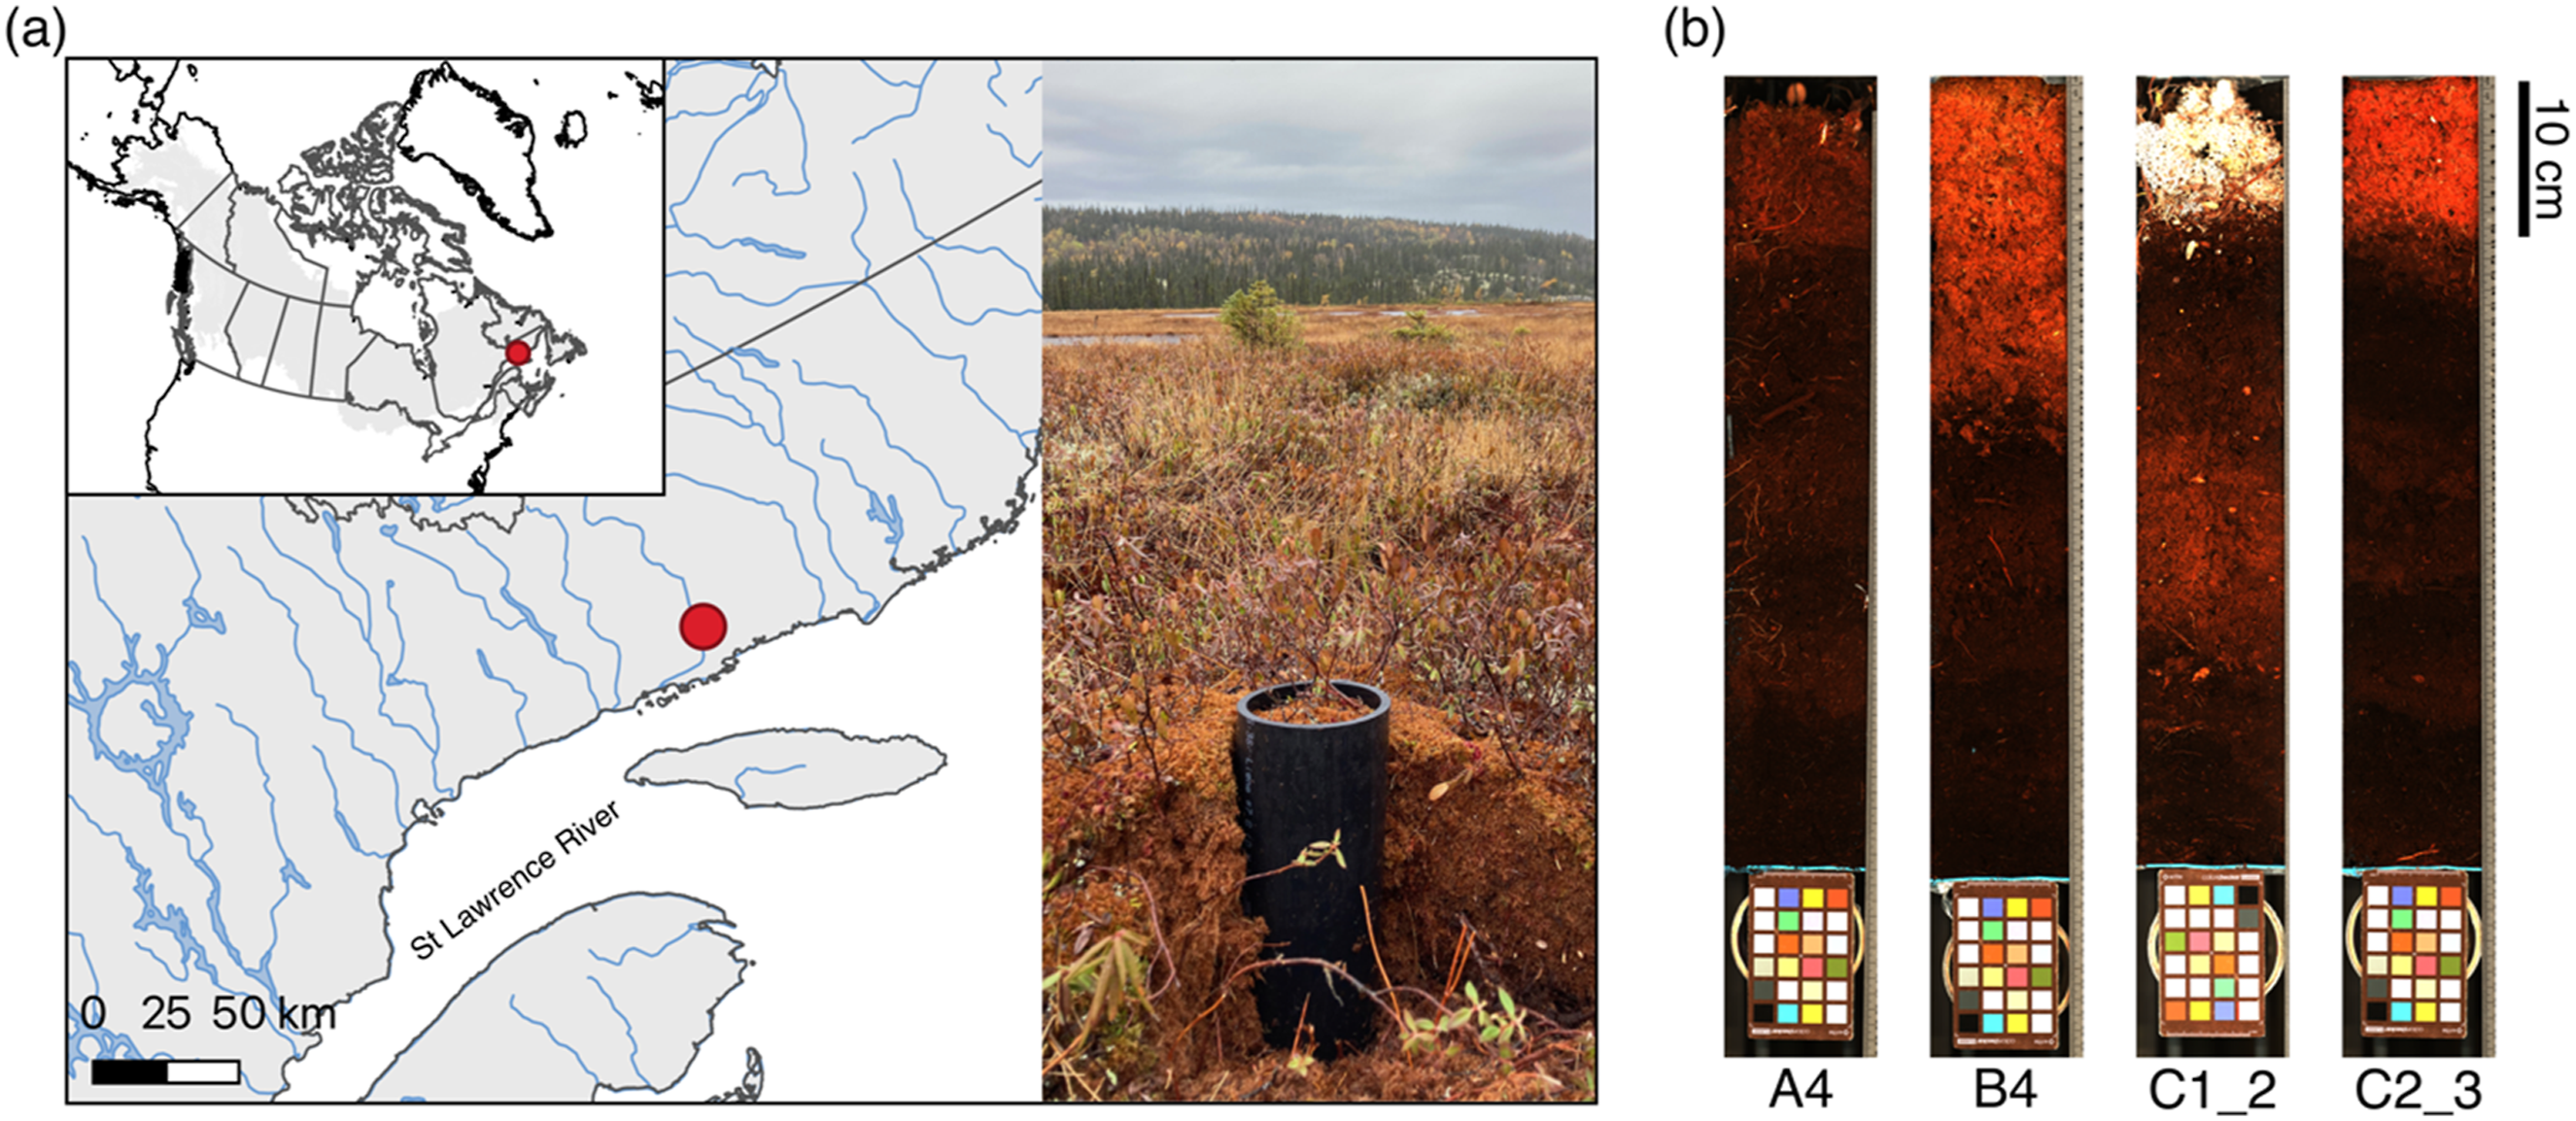
Continuous peat core XCT scanning
All samples were scanned using a Siemens medical CT scanner (Somatom Definition AS+128, Siemens Healthcare GmbH, Erlangen, Germany) at the Institut national de la recherche scientifique (INRS), Québec, Canada in 2023, with an incident energy of 70 kV, an exposure of 1000 mAs, a 1.2 mm spot size, and a pitch factor of 0.35. 2D projections were first acquired and then were processed using the Syngo CT software. SAFIRE was used to reconstruct 3D images using the D45s kernel with a voxel size of 0.234 × 0.234 × 0.6 mm (a voxel is a volumetric element for XCT images and 0.6 mm is the thickness of a slice in a 3D image stack). First, the four full wet peat cores (diameter: ∼10 cm, length: 47–50 cm) were continuously scanned along with their plastic cylinder. The image acquisition for these 50 cm long cores lasted less than 2 minutes and the image reconstruction was nearly immediate. A detailed XCT image illustrating different phases can be found in Supplemental Figure S1. After scanning, each full peat core was split lengthwise into two halves by first cutting the PVC tube and subsequently dividing the peat with a cutter knife. One working half was immediately used for subsequent LOI analysis, and the other half was sealed using clingfilm and archived in a cold room at 5°C.
After peat material was taken from each core for the discrete subsampling and LOI experiments (see below), the remaining material, about ∼2–3 × 5 cm on the transversal section (∼50 cm long), was dried in an environmental chamber (EZT-570S, CSZ Industrial, Cincinnati) at 50°C for 2 weeks to ensure that all the water had been removed. They were scanned using the same parameters as for wet cores; however, the voxel size was 0.0977 × 0.0977 × 0.6 mm to account for a smaller sample size. Hereafter, we use C-Scan to refer to XCT scanning experiments on continuous peat cores (both wet and dry; Figure 2).
Bulk density measurements
Bulk density metrics of the four peat cores were measured using a traditional gravity-based approach described by Chambers et al. (2011). We first sliced three peat stripes (three replicates; Figure 2) in each of the four wet peat cores along the 50 cm sequence and filled them in U-channels having an approximate area of 3.344 cm2 on the transversal section. From each stripe, 1 cm thick × 3.344 cm2 cubes were then continuously cut using a sharp surgical knife to minimize deformation. The cubes were then moved into previously weighed dry crucibles (the weight is Wcru) and were weighed (Wwet) immediately using an electronic balance with a precision of 0.001 g. The crucibles were subsequently placed in an oven at 60°C for at least 12 hours and weighed again (W60). A total of 195 peat cubes were sampled from the four cores. Then they were burned in a muffle furnace (Thermo Scientific™ Lindberg/Blue M™, Ashville, USA) at 550°C for 4 hours and weighed again (W550). Wet bulk density (BDwet) and dry bulk density (BDdry) were calculated based on Equations (1) and (2), respectively, where the volume (V) is 3.344 cm2 here. We also calculated BDom using Equations (3) and (4) (Chambers et al., 2011), where OMC represents organic matter content. We then averaged the three replicated LOI measurements of the same depth for each core (only two replicates per depth for core B4).


Discrete peat subsample experiment
We designed an additional experiment to investigate the causes for the previously reported discrepancies between HU and traditional measurements of bulk density for peat (Davey et al., 2011; Turberg et al., 2014). The material left over after the sampling of the stripes and their division into 1 cm thick × 3.344 cm2 cubes was split into larger blocks with an approximate size of 2.5 × 2.5 × 5 cm at every ∼5 cm. These blocks were then moved into previously weighed plastic bottles covered with caps (Supplemental Figure S2) and then weighed. The bottles containing the blocks were immediately scanned using the same protocol as used for scanning continuous peat cores at 70 kV and the voxel size was set 0.0977 × 0.0977 × 0.6 mm (hereafter referred to as D-Scan; Figure 2). The volume of the peat sample was determined using XCT images and used to calculate BDwet. As D-Scan was conducted 2–3 months after the full cores were split, it is possible that the structure may have been slightly modified even though they were stored at a temperature of 5°C, and their BDwet may have also been reduced due to potential water loss (see lower BDwet in D-Scan in Figure 3(b)). However, these changes most likely have minor impacts on the HU-BD relationship, which is determined by mass density. To obtain a wide range of water contents in those peat samples, they were then placed in the environmental chamber at 50°C, weighed, and scanned at a time interval of 6–48 hours until the samples were completely dry (2 weeks after the first scan). In total, four series of XCT scans were conducted, from the initial wet state to the dry. Relationship between HU70kV_peat+air and wet bulk density (BDwet). (a) HU70kV_peat+air versus BDwet for individual peat cores with the histogram showing the distribution of HU values. Vertical and horizontal error bars refer to the standard deviation of replicated gravity-based measurements and the 10th–90th percentile range of HU70kV_peat+air values for 100 randomly sampled ‘stripes’ (see details in Supplemental Text 1), respectively. (b) Linear regression. The green line indicates the ordinary least square regression, y1 = 0.0008x + 0.9743, r2 = 0.86. The red line is based on a linear model forced to pass through the point (−1000, 0), y2 = 0.000988x + 0.988, r2 = 0.83. The blue dashed line is the theoretical calibration line that passes points (−1000, 0) for air and (0, 1) for water. The inset shows the HU-BDwet relationships for C-Scan and D-Scan experiments (see Materials and Methods). (c) Comparison between XCT-calibrated and LOI-based BDwet along the peat cores. ‘Trad.’ indicates traditional gravity-based BDwet. XCT_y1 and XCT_y2 are conversions using the y1 and y2 models, respectively.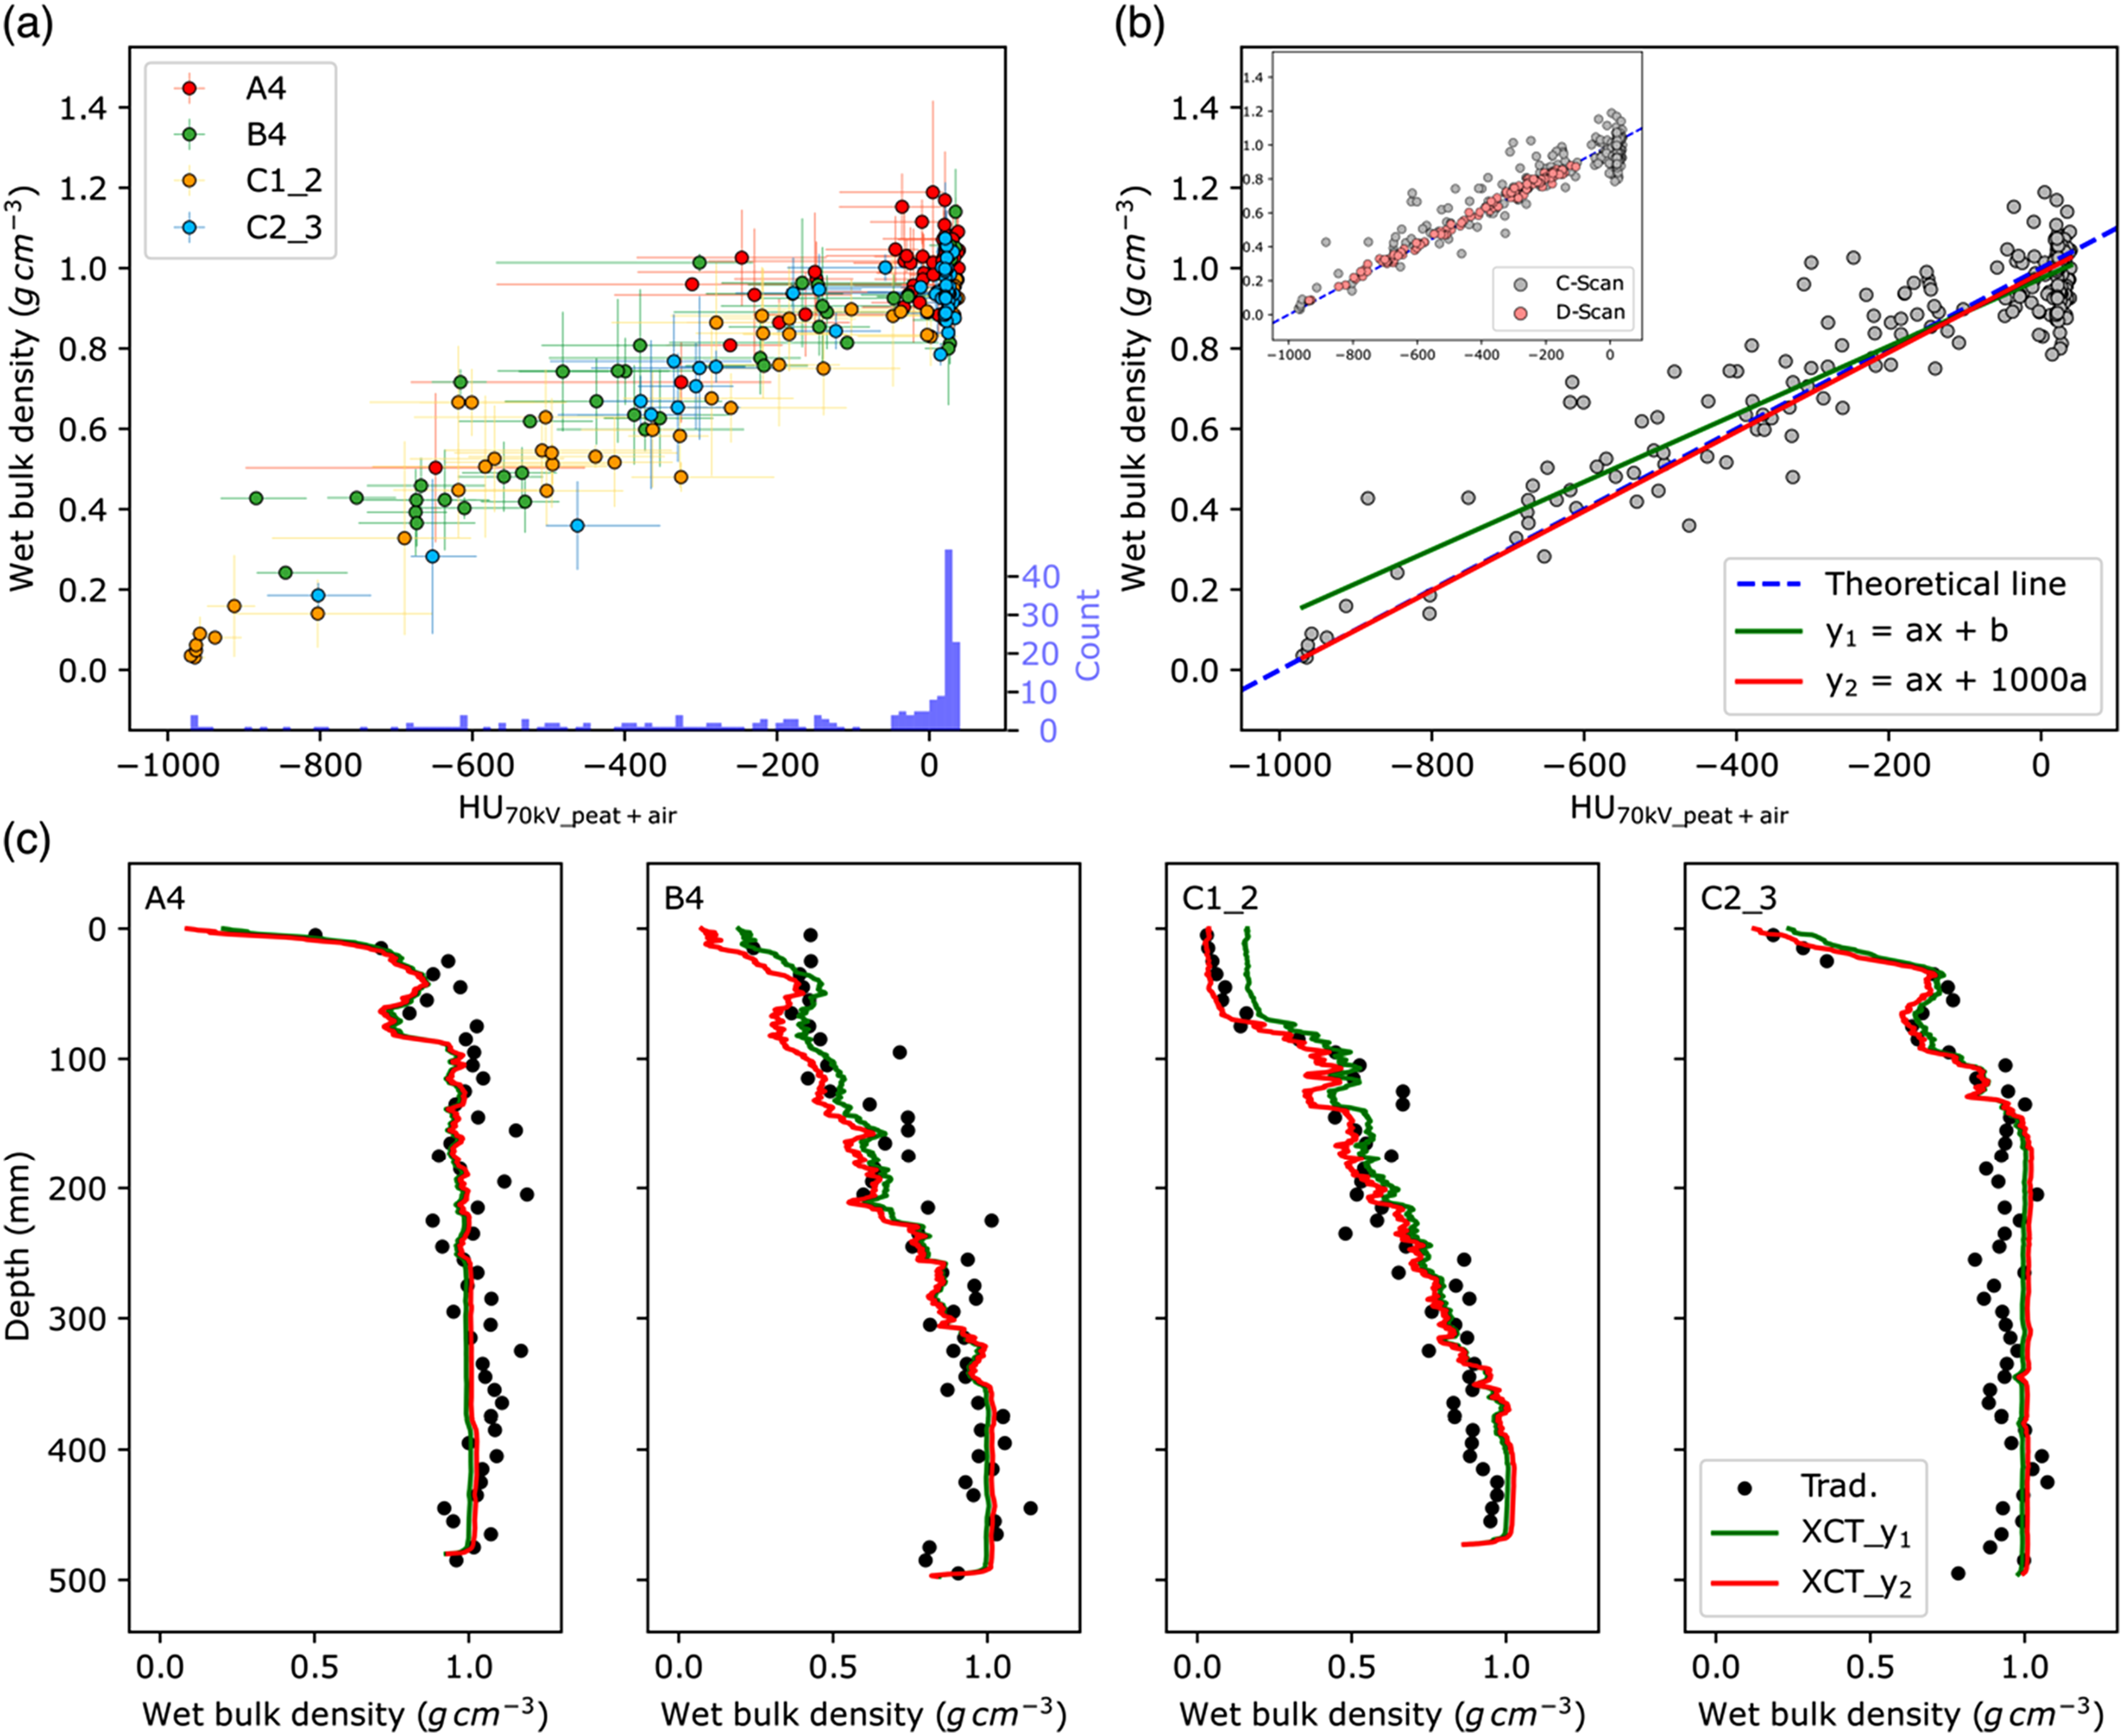
To calculate bulk density for discrete peat samples, we used the D-Scan images to measure their volume by summing their number of voxels (including the air phase inside the peat phase) that were multiplied by the voxel size (i.e. 0.0977 × 0.0977 × 0.6 mm), making the bulk density for D-Scan slightly different from that for C-Scan. Subsequently, BDwet was calculated by dividing the wet mass of each scanned peat sample and the estimated volume using Equation (1) (V is estimated based on voxels in this case). BDdry was calculated by dividing the dry mass and the volume of the corresponding wet sample using Equation (2) (Chambers et al., 2011). Because these samples were not burned, BDom was not available for the D-Scan experiment.
HU data extraction
3D XCT images in ‘.dicom’ format were processed using Python 3.10 to extract HU values from the C-Scan and D-Scan. HU is a relative scale that is dependent on the attenuation of the scanned material. In medical XCT scanners, HU values range between −1024 and +3071 (e.g. Kalender, 2011) and HU values are always scaled to −1000 and 0 for air (density is close to 0 g cm-3) and water (density is 1 g cm-3), respectively.
The HU extraction protocol includes (1) correction of volume tilting, (2) conversion of ‘.dicom’ files to a ‘.tiff stack’, (3) determination of peat volume, and (4) extraction of HU values. Specifically, the determination of peat volume refers to a procedure that leaves out the air phase outside the scanned peat. Here, we used a HU value of −960 to segment the air phase considering potential artefacts (e.g. noise and the partial volume effect, Cnudde and Boone, 2013) inherent to XCT scans. However, the air phase inside the peat volume was retained. A detailed processing procedure is described in Supplemental Text 1. The HU value was then averaged from the remaining voxels, and the volume is the sum of these voxels. HU values for the peat plus the inside air phase and their volumes were calculated from each slice of scanned peat volumes (hereafter referred to as HU70kV_peat+air and Vpeat+air, respectively; Supplemental Text 2). To assess the potential offset regarding the sampling position between XCT and traditional methods, we generated 100 pairs of HU70kV_peat+air and Vpeat+air from 100 randomly sampled ‘stripes’ volumes for the scans of wet cores in C-Scan. For other scans, that is, scans of continuous dry cores and discrete peat samples, only one pair of HU70kV_peat+air and Vpeat+air values was generated from each slice of the XCT scan.
Results
HU versus wet bulk density (BDwet)
HU70kV_peat+air values of the four peat cores in C-Scan are highly correlated with the mean BDwet averaged from replicated measurements at the same depths (Pearson’s correlation coefficient, r = 0.93), although HU70kV_peat+air values tend to cluster around the value of zero, which represents HU for water in medical XCT scanners (Figure 3(a)). This linear relationship is consistent for individual peat cores, with HU-BDwet correlations ranging between 0.76 and 0.96 (Supplemental Figure S3). Considering that the traditional BDwet measurements were based on only small parts of full peat samples, we further calculated correlations for the 100 random XCT ‘stripes’ with a similar transversal area for each core (see Section HU data extraction), to account for potential mismatches between the LOI and XCT data and find the best alignment. This approach, however, did not yield a substantial improvement in correlations between HU70kV_peat+air and BDwet (Supplemental Figure S4).
We then applied different regressions to acquire an ideal equation to convert XCT-based HU70kV_peat+air to BDwet for the C-Scan experiment. The commonly used ordinary least square linear regression on the data points (y1 = 0.0008x + 0.9743) shows robust statistics with an explained variance (r2) of 0.86, although polynomial models resulted in slightly better statistics (Supplemental Table S1). However, the y1 regression line tends to diverge from the theoretical point for air, of which the density is close to 0 and the HU value is −1000 in standard conditions for medical XCT (Figure 3(b)). The total-least square regression also suggests a similar result (not shown), even if this approach accommodates errors in both dependent and independent variables (Nievergelt, 1994).
We additionally used a second linear model (namely y2), which was forced to pass the theoretical point of air, that is, the (−1000, 0) point. The linear regression (y2 = 0.000988x + 0.988) is satisfactory and agrees largely with the theoretical line defined by the HU values for both air and water (Figure 3(b); water has a density of 1 g cm-3 and an HU of 0 for medical XCT), while the assessing statistics only slightly degraded compared to the y1 model (Supplemental Table S1). Still, the regression residuals (Supplemental Figure S5) are relatively large, in line with earlier studies (Davey et al., 2011; Turberg et al., 2014). Moreover, continuous BDwet estimates based on the y2 model better capture the density variations than the y1 model in the upper part of three out of four peat samples except B4 (Figure 3(c)). The nearly perfect alignment with LOI-based BDwet for the test cores (including C2_3, ∼80% of which has a density close to water and HU close to 0; Figure 3(c)) further suggests the ability of XCT scanning to produce high-resolution (0.6 mm) and reliable BDwet data.
In contrast, a stronger linear relationship is observed between HU70kV_peat+air and BDwet for the D-Scan experiment. With a Pearson’s r of 0.996 (vs 0.93 for C-Scan), these data points are distributed more closely to the y2 regression line as well as the theoretical line (inset in Figure 3(b)), leading to much reduced regression residuals (Supplemental Figure S5). This suggests that the y2 model, accounting for both the XCT theory and empirical data, is most likely suitable for calibrating continuous HU70kV_peat+air values of peat materials. In addition, these highly similar HU-BD relationships for C-Scan and D-Scan underscore a minor impact of different outer material (i.e. plastic bottles vs PVC tubes) on HU values.
HU versus dry bulk density (BDdry)
Although the BDdry metric, defined as the ratio between the dry mass and the volume of wet peat, differs to some extent from the mass density of dry peat, HU70kV_peat+air values obtained from dry peat cores display a good non-linear relationship with BDdry in the C-Scan experiment (Figure 4(a)). The Pearson’s r range between 0.73 and 0.87 for individual cores. Among the four cores, this relationship appears to be less robust for core C1_2, especially for the top (Figure 4(c)). This discrepancy is likely due to the fact that the density of the top part is highly heterogeneous and deformable and BDdry and HU70kV_peat+air data were measured from different parts of this core. Thus, non-linear regressions were conducted using the data of the cores A4, B4, and C2_3; and a four-parameter logarithmic model yielded a convincing correlation (Figure 4(b); y = 0.0278 × log(0.754x + 979.628) – 0.028, r2 = 0.72). However, the HU-BDdry relationship for D-Scan tends to differ from C-Scan (see Discussion for detailed explanation). Even so, the D-Scan samples can be similarly fitted by a logarithmic model with a more robust regression statistics (y = 0.0519 × log(0.267x + 1007.926) – 0.125, r 2 = 0.94; Figure 4(b)). Relationship between HU70kV_peat+air and dry bulk density (BDdry). (a) HU70kV_peat+air versus BDdry for individual peat cores in C-Scan. (b) Logarithmic regression results for C-Scan and D-Scan. The black line based on C-Scan: y = 0.0284 × log(1.147x + 970.169) – 0.04. The pink line based on D-Scan: y = 0.052 × log(0.267x + 1007.926) – 0.125. (c) and (d) Comparison between XCT-calibrated and gravity-based BDwet (Trad.) for C-Scan and D-Scan, respectively.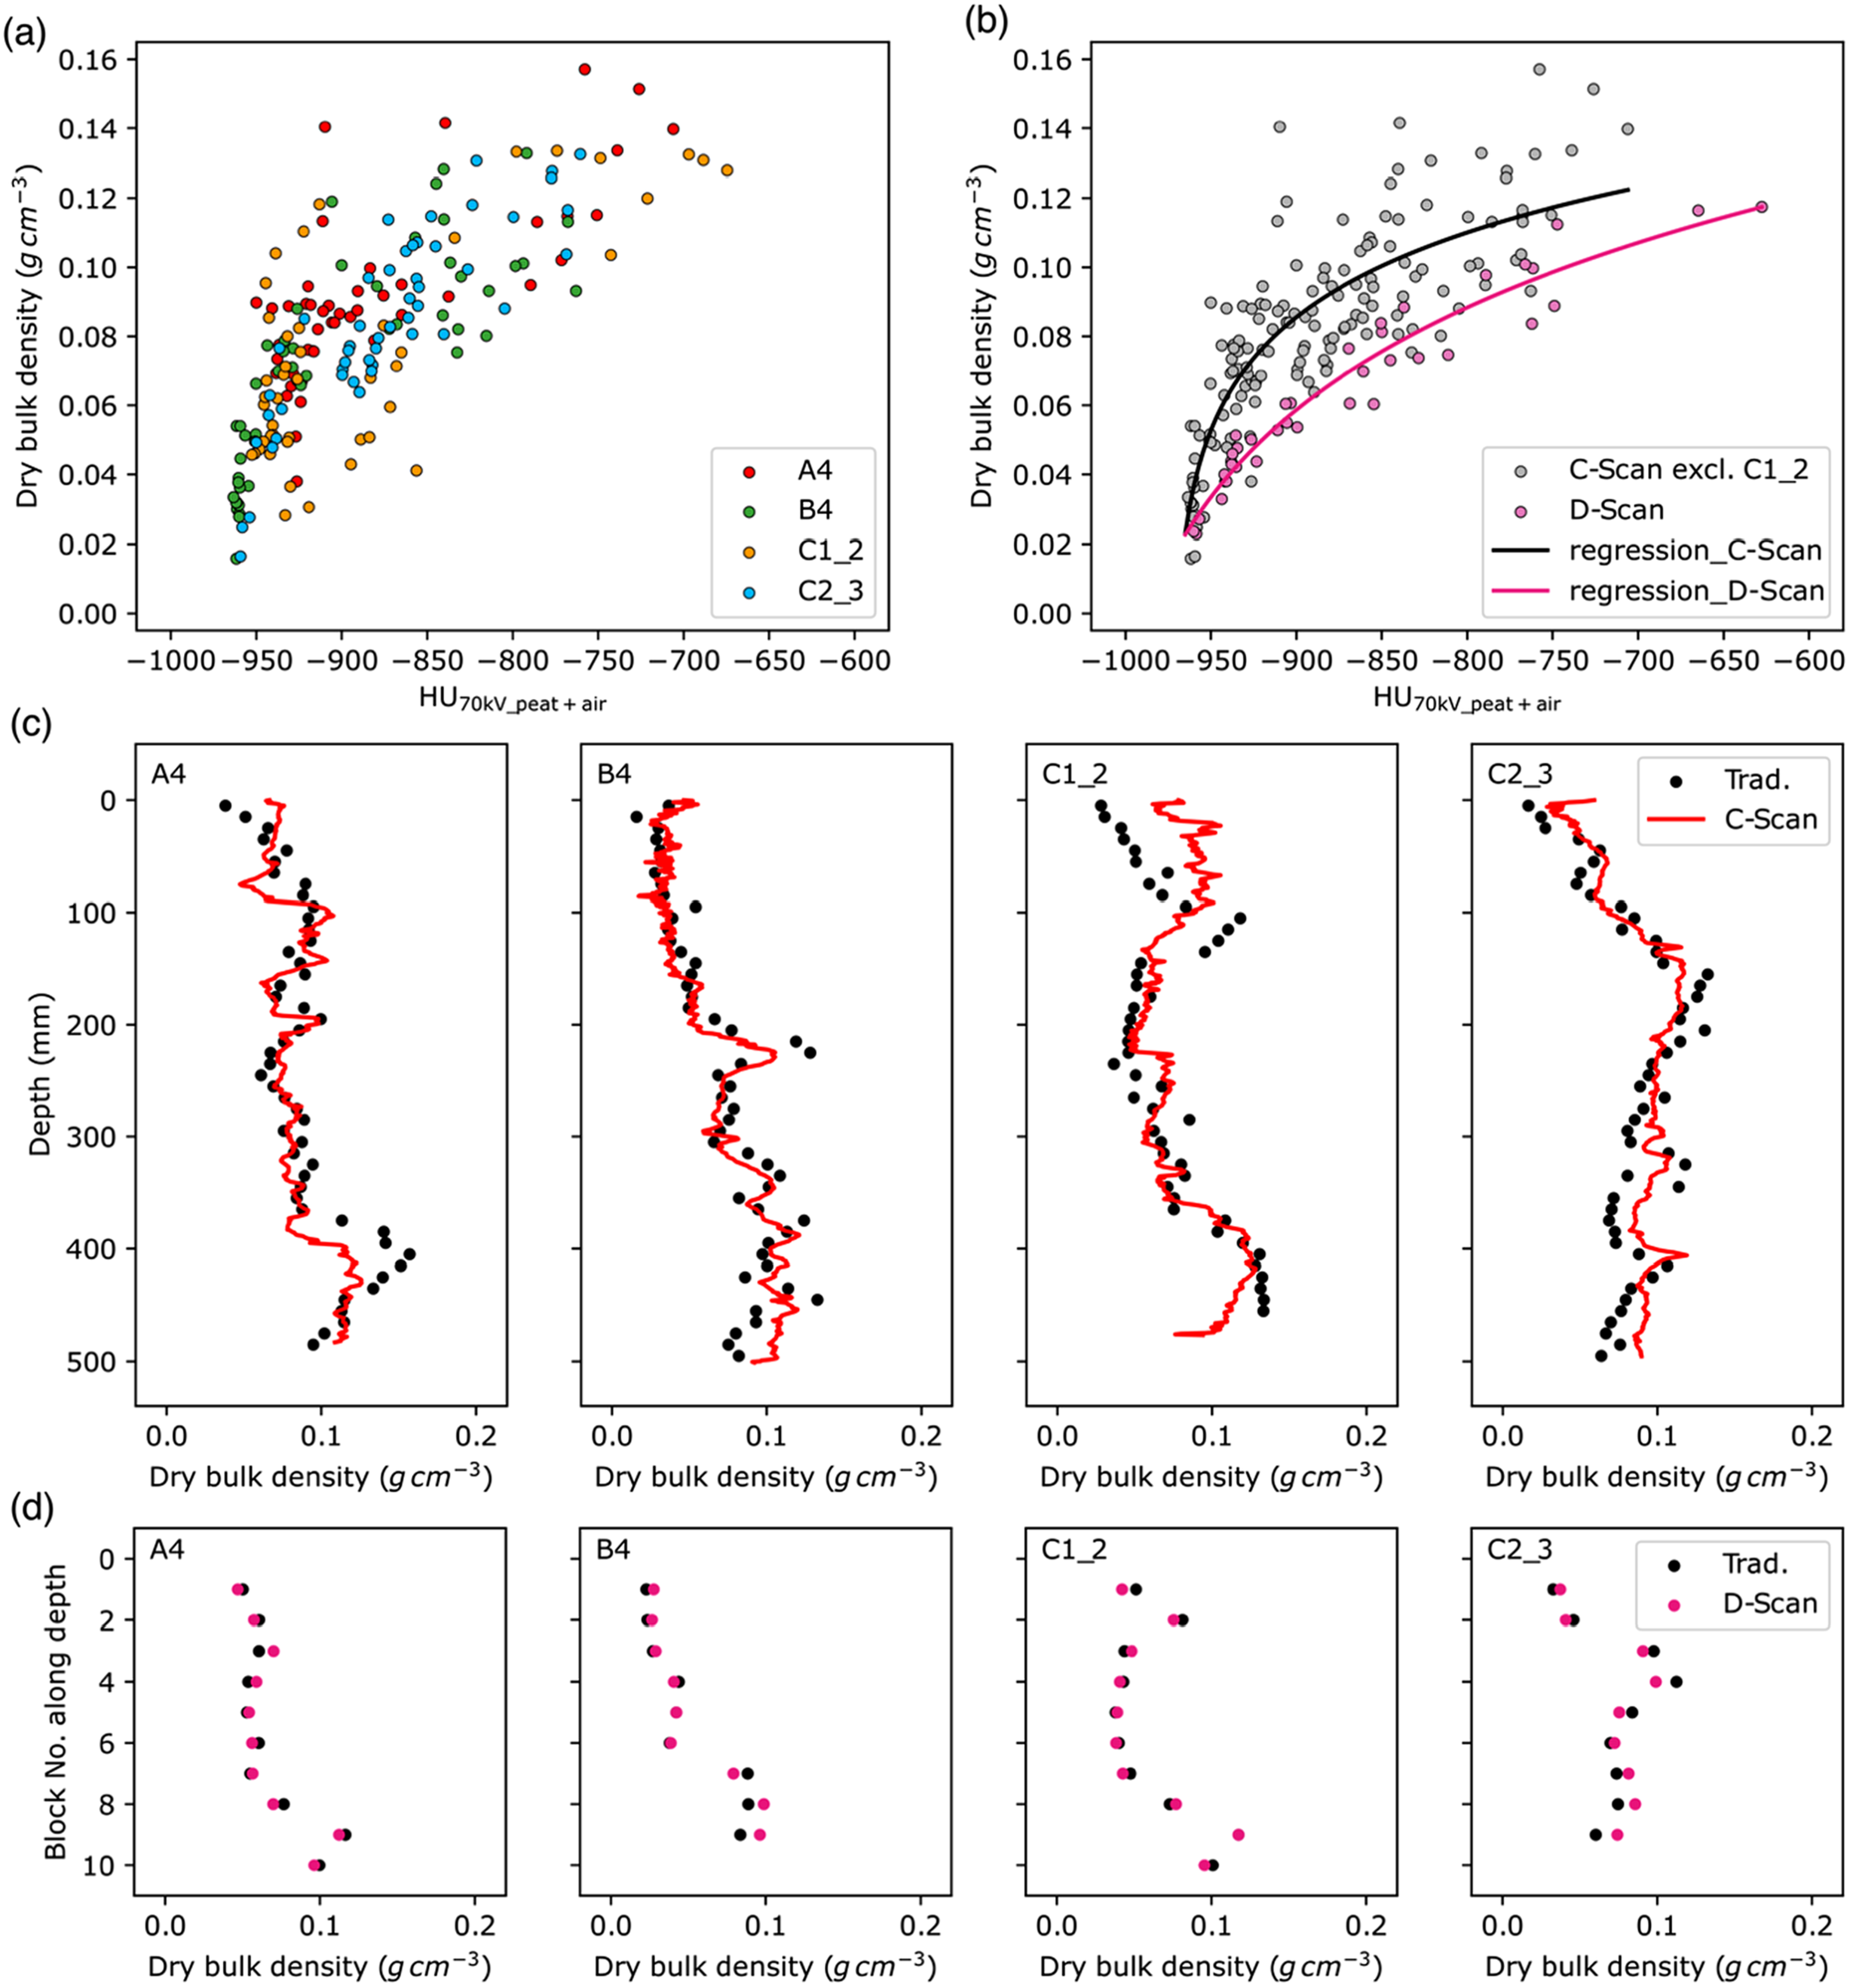
Applying the above two calibration models, both C-Scan and D-Scan measurements matched the BDdry variations along the depth of each tested core (Figure 4(c), (d)). The BDdry estimates based on HU70kV_peat+air now exhibit strong linearity with BDdry measurements obtained using the gravity-based method, especially for D-Scan (Supplemental Figure S6). The linear correlation increased from 0.77 to 0.8 for C-Scan (for the four cores merged), after the logarithmic calibration (Supplemental Table S2).
Estimates of organic matter bulk density (BDom)
According to the LOI measurements, the organic matter content in the test peat sequences on average accounts for more than 98% of the total dry mass, and it remains relatively consistent along the depth (Figure 5(a)). Thus, the LOI-based BDom highly resembles BDdry (Supplemental Figure S7). This suggests that HU70kV_peat+air of dry peat may have the potential for quantifying BDom, a parameter more relevant to carbon and biomass estimates. As expected, we obtained a similarly robust non-linear relationship between HU70kV_peat+air and BDom (Supplemental Figure S7(b); y = 0.028 × log(0.714x + 980.533) – 0.025, r2 = 0.72). The r2 statistic is the same as for the HU-BDdry regression. The BDom estimates based on HU70kV_peat+air and this regression model compare well with LOI-based BDom measurements (Figure 5(b)). Content and bulk density of organic matter (BDom) in peat samples. (a) Organic matter content along depth for individual peat cores. Blue dashed lines indicate a content of 98%. (b) XCT-calibrated versus LOI-based BDom estimates. The regression line in Supplemental Figure S7(b) was used to convert HU70kV_peat+air to XCT-calibrated BDom. Note that BDom data highly resemble BDdry due to high and stable organic matter content.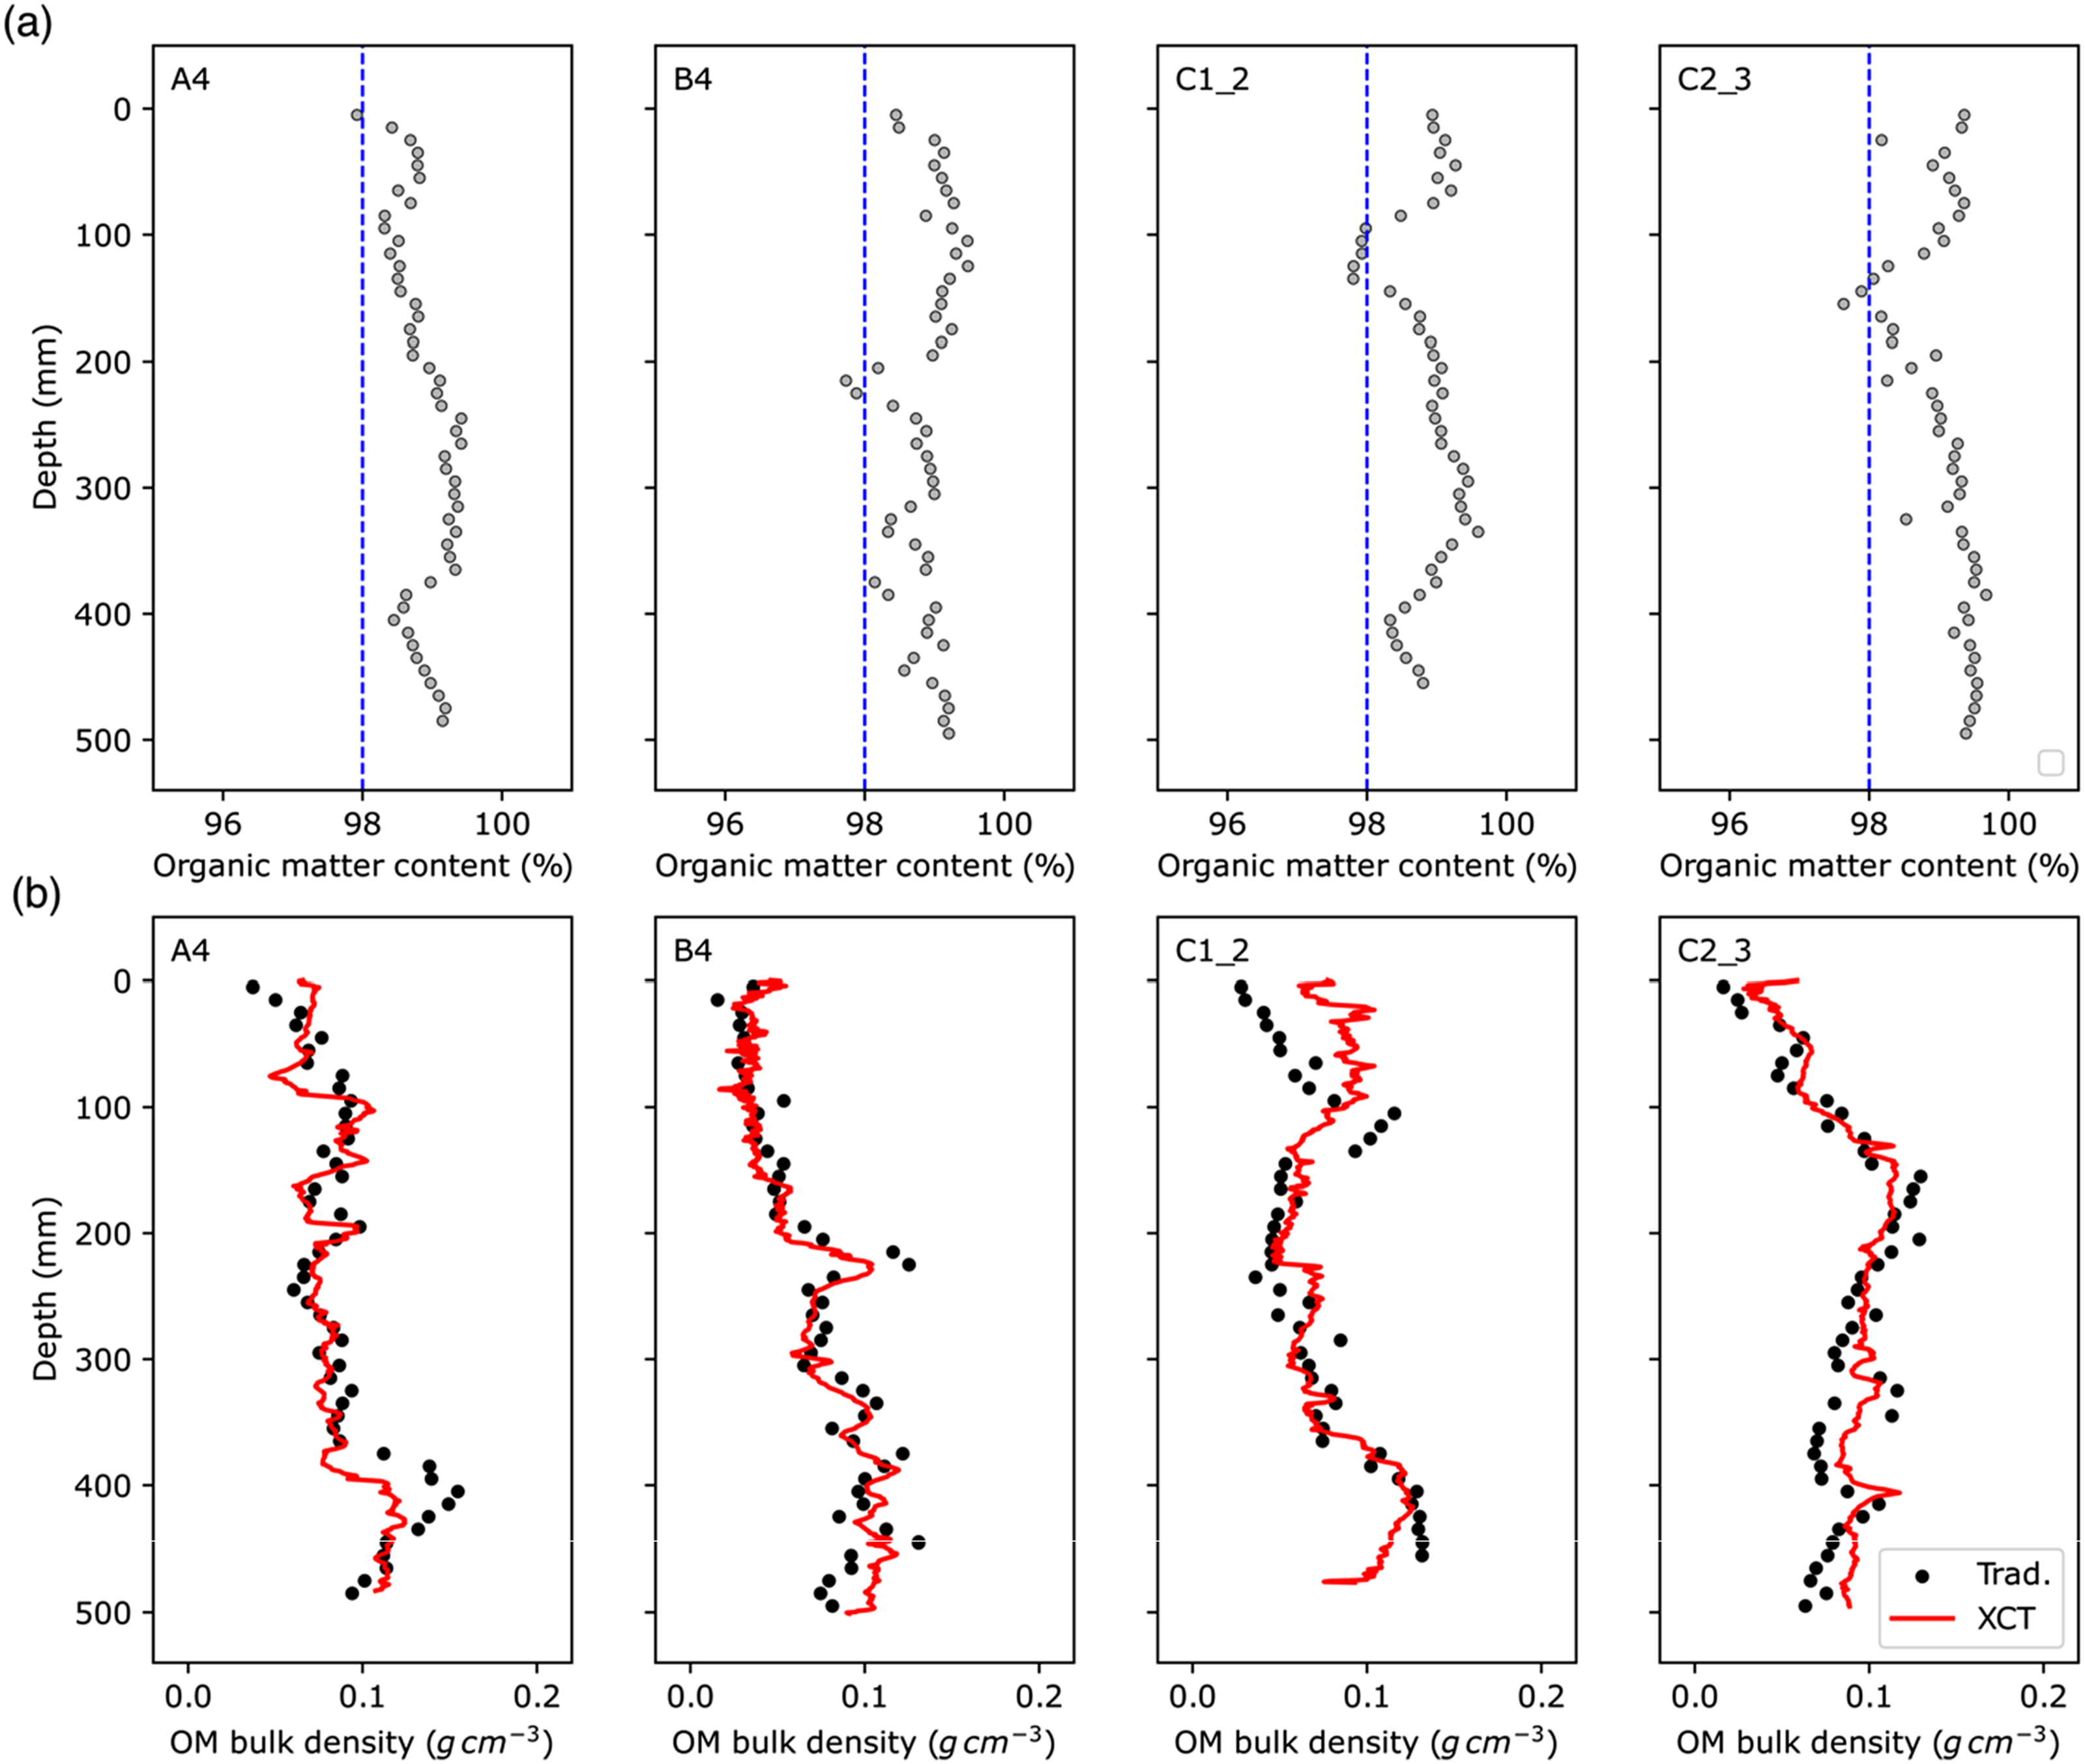
Discussion and concluding remarks
In this study, we show that medical XCT scanning, despite inherent artefacts (e.g. image noise) and relatively low resolution (compared with micro-CT scanners), can provide promising and accurate surrogates for bulk density metrics (BDwet, BDdry, and BDom) for different types of boreal peat material. The protocol was developed using a relatively low incident energy (70 kV) as it improves the contrast-to-noise ratio between low-Z materials due to the combined influence of the Photoelectric effect and Compton Scattering (Hsieh 2009). Moreover, it enhances the contrast between organic matter (low Z) and minerogenic matter (high Z) (Martini et al., 2025; Saldana-Gonzalez et al., 2012) in case minerogenic material is present in the sample and needs to be removed from the images. Finally, artefacts – such as beam hardening (Kalender 2011) – would only affect the highest end of the greyscale histograms, leaving the greylevel values of organic matter mainly unaffected.
While our results demonstrating the linear relationship between XCT numbers (HU) and BDwet agree with previous studies on peat (Davey et al., 2011; Turberg et al., 2014), we find that the gravity-based bulk density approach can be subject to substantial volumetric errors, even if a U-channel was used in C-Scan to reduce this uncertainty. Indeed, this assumption was supported by large variations between the replicated BDwet measurements at the same depth levels (Supplemental Figure S8). As a result, the ordinary least squares regression for BDwet in C-Scan was most likely biased when compared with the theoretical relationship between HU and mass density for medical XCT (Figure 3(b)). Using the model fully based on the C-Scan data could overestimate BDwet for lighter parts of the peat samples. In addition, the large variations among replicate, gravity-based bulk density measurements (Supplemental Figure S8) imply that substantial uncertainties remain in the averaged values shown in Figure 3(c). This can further contribute to mismatches with XCT-based estimates. For example, XCT profiles appear to be relatively flat at depths >100 mm for cores A4 and C2_3, compared with the gravity-based measurements. However, these discrepancies more likely reflect limitations of the traditional method rather than errors or the limitations of XCT. Previous studies showed that the linear relationship between HU and mass density is consistent for materials with densities below approximately 1.2 g cm-3 (Sjögreen et al., 2002), supporting the reliability of XCT within the density range typical of boreal peat (typically <1.2 g cm-3; Figure 3(a)) we tested in this study.
In contrast, because volumetric errors in BDwet measurements were minimized in D-Scan, the result better follows the theoretical HU-BDwet relationship and the y2 model (Figure 3(b)), although the estimated BDwet was lower than that in C-Scan most likely due to water loss after full cores were split into halves. A more robust performance of D-Scan was similarly found for the HU-BDdry relationship (Figure 4(b)). Thus, volumetric errors could be responsible for relatively large disagreements between HU and bulk density measurements mentioned in earlier studies (Davey et al., 2011; Turberg et al., 2014). Because peat is highly deformable and fibrous, freezing the material before conducting traditional BDwet measurements (Ingram et al., 2019; Van Dijk and Boekel, 1965) would apparently increase the accuracy for calibrating HU70kV_peat+air to BDwet. However, freezing implies an increase in the sample volume and modify the pore size (Van Dijk and Boekel, 1965), and hence could be another source of volumetric uncertainty.
Our analysis also indicates that future applications of the XCT method to estimate BDwet of peat may not need to develop a large calibration database because the HU-BDwet relationship is independent of sample size and types of peat. The data points for both C-Scan and D-Scan experiments (see inset of Figure 3(b)) similarly follow a straight line that generally passes through theoretical points presenting air (HU is −1000 and density is close to 0 g cm-3) and water (HU is 0 and density is close to 1 g cm-3). This suggests that the y2 calibration model that accounts for both empirical data in C-Scan and theoretical rule of medical XCT can be applied to estimate BDwet for a wide range of peat soils across peatlands in the future, as long as mass density of measured peat cores is similar to BDwet tested in this study (<∼1.2 g cm-3) and atomic number is low (consisting of hydrogen, carbon, and oxygen).
The ability of XCT scanning to estimate BDdry from dry peat is also quite promising, despite the relationship being non-linear. Similar to the HU-BDwet relationship (Figure 3(a)), the HU-BDdry relationship is consistent among different peat cores (Figure 4(a)). Given a peat sample with a known dry mass (Wdry), its mass density is defined by Wdry/Vdry, where Vdry represents the volume of the dry peat, and this metric is linearly related to HU70kV_peat+air in theory. In contrast, BDdry is defined as the ratio between Wdry and the wet volume (Vwet; see Chambers et al., 2011): Wdry/Vwet, which does not account for volume change and is different from dry mass density: Wdry/Vdry. If the Vdry/Vwet had remained a constant for different peat samples, meaning that BDdry is linearly correlated to its mass density, a linear relationship could have been observed between HU70kV_peat+air and BDdry. However, this remains invalid. The non-linearity found in this study implies that the degree of volumetric shrinkage (i.e. Vdry/Vwet) is not a constant, and this shrinkage is, to some extent, proportional to its water content (Supplemental Figure S9). In other words, a peat sample containing a smaller quantity of water tends to shrink to a lesser extent after drying.
On the other hand, different regression curves for C-Scan and D-Scan experiments (Figure 4(b)) indicate that developing a single, universal mathematical equation for calibrating HU70kV_peat+air of dry peat to BDdry (as well as BDom) is challenging. The most likely reason is that the smaller sample blocks in D-Scan tend to shrink more significantly when dried compared to the long, continuous peat sequence of the C-Scan. There was lower porosity (i.e. more shrinkage) in smaller dried peat blocks, and thus HU70kV_peat+air values were greater for D-Scan samples than C-Scan ones (Figure 4(b)). In future practices, one needs to account for these factors and use case-specific calibration curves when necessary. However, a single calibration curve could be applicable to peat samples with similar sizes and initial conditions, for example, the four cores in Figure 4(a), (c). If the only purpose is to estimate biomass based on a density metric (not necessarily BDdry as defined for the LOI method, see Chambers et al., 2011), one may alternatively consider using mass density of dry peat, which is linearly related to HU values. This relationship is highly similar to that obtained for wet samples (Supplemental Figure S10), and thus, the y2 model can be used.
In addition, as drying is a critical step for estimating XCT-based BDdry, the length shrinkage along the depth of the peat cores due to sample drying should also be carefully considered (Supplemental Table S3). The length of a dried peat core needs to be adjusted to match with its original length in wet conditions when applying the XCT approach we proposed in this study. Freeze drying offers an additional solution to mitigate the issue related to dimensional shrinkage. Yet, a considerable amount of time is needed, especially for drying large samples, compared with oven drying due to the slow process of ice sublimation.
Finally, we demonstrate that XCT scanning of dry peat samples can be potentially used to estimate BDom, a metric more tightly related to organic carbon. It is, however, noteworthy that the applicability can depend strongly upon the properties of the peat. In our case here, a relatively constant and high proportion of organic matter (>95%) is a critical factor that makes HU70kV_peat+air of dry peat a valid proxy for BDom.
In conclusion, medical XCT opens a promising avenue for estimating bulk density metrics of peat samples (see summary in Figure 6). In comparison with the traditional gravity-based approach, XCT is highly advantageous in terms of much reduced operation time and improved vertical resolution. According to our experience in this study, it took less than 2 minutes to obtain a full scan of one 50 cm-long, 10 cm-wide peat core with a vertical resolution up to 0.6 mm, which is equivalent to the annual accumulation rate of peat in the North American biome (Gorham et al., 2012). This would significantly increase the methodological efficiency and measuring accuracy in peat studies from a non-destructive perspective. Although peat cores still need to be collected from the field, destructive sampling is largely avoided when using medical XCT compared to the LOI-based method, allowing peat specimens to be preserved for future studies. This is particularly important when sampling hard-to-get-to or ecologically sensitive areas. It should be noted that the HU-BD relationships investigated in this study were developed from peat samples featuring air-water-peat phases. In case of peat containing denser phases (such as sediments or clays), the HU-BD relationships may vary according to different densities, atomic numbers, and chemical composition (Boespflug et al., 1995), and a different scanning setup might be required to obtain high-quality XCT images (e.g. higher kV). However, relatively low kV (i.e. dominant photoelectric effect) will keep a stronger contrast between the organic matter and the minerogenic material, hence allowing for an easier phase recognition (air, water-peat, and heavier components). In this way, biomass for a highly organic phase may still be quantified using simple thresholding techniques. This study, together with the pipelines for extracting HU from XCT images of full cores (Supplemental Text; Wang et al., 2025), will benefit future studies on carbon accumulation and paleo-environmental reconstructions based on high-resolution peat sequences, potentially increasing the temporal resolution to one to a few years. Summary of the calibration procedure from HU values of XCT to bulk density.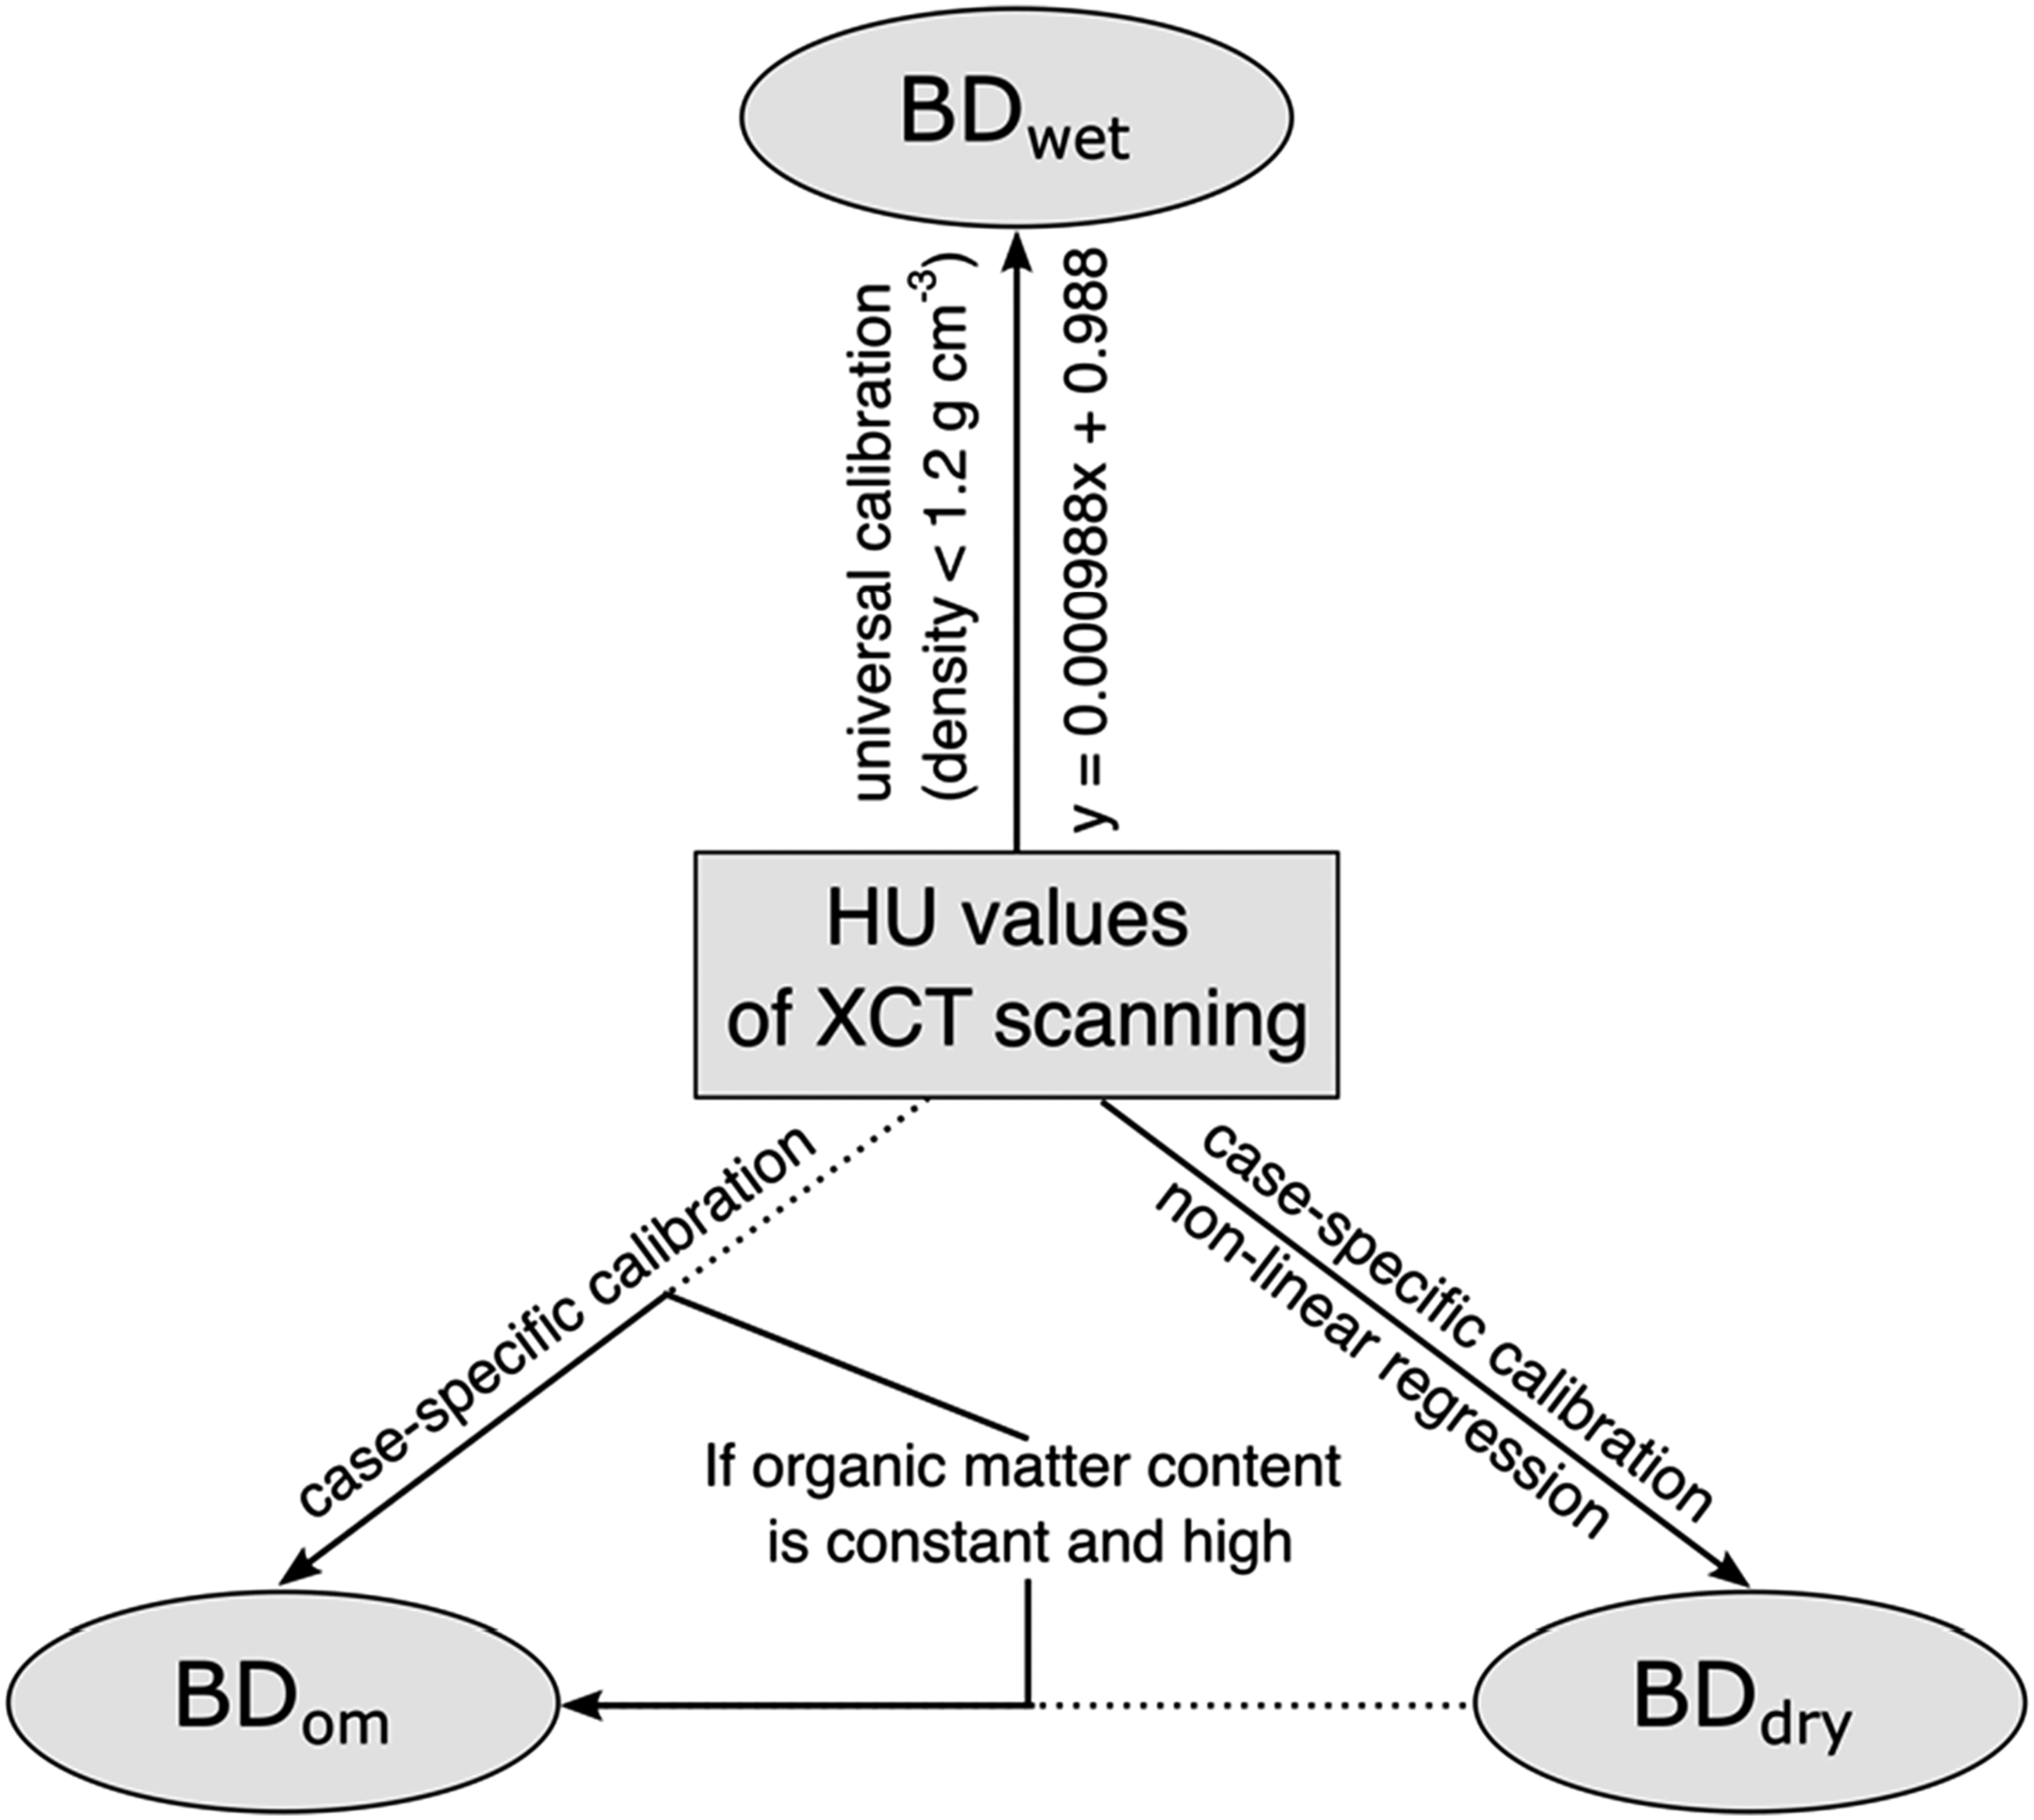
Supplemental Material
Supplemental Material - Quantifying bulk density of boreal peat using X-ray computed tomography
Supplemental Material for Quantifying bulk density of boreal peat using X-ray computed tomography by Feng Wang, Pierre Francus, Michelle Garneau, Philippe Letellier, Margherita Martini, Arnaud De Coninck, Étienne Boucher in Progress in Physical Geography: Earth and Environment
Footnotes
Acknowledgement
We would like to thank Dr Richard Ketcham and Dr Daniel Schillereff as well as two other anonymous reviewers, for their constructive comments that improved the manuscript. We also thank M. Des Roches (INRS-ETE) for his support in operating the XCT scanner.
Author contributions
FW, PF, MG, and ÉB conceptualized this study. FW, PL, MM, and ADC performed the experiments. FW, PF, PL, MG, and MM analyzed the data. FW wrote the original manuscript with inputs from all co-authors.
Funding
The authors disclosed receipt of the following financial support for the research, authorship, and/or publication of this article: This study was supported by a GEOTOP collaborative research project funded by the FQNRT (Fonds de recherche du Québec – Nature et technologies), by an NSERC Alliance grant (ALLRP 581146-22) and by the Gouvernement of Québec, Ministère de l’environnement, de la lutte contre les changements climatiques de la faune et des parcs, in the frame of PEV 2030 (plan pour une économie verte).
Declaration of conflicting interests
The authors declared no potential conflicts of interest with respect to the research, authorship, and/or publication of this article.
Data Availability Statement
XCT scans of continuous peat cores and Python scripts used to process XCT scans and extract HU values can be derived at Borealis (Wang et al., 2025, ![]() ).
).
Supplemental Material
Supplemental material for this article is available online.
References
Supplementary Material
Please find the following supplemental material available below.
For Open Access articles published under a Creative Commons License, all supplemental material carries the same license as the article it is associated with.
For non-Open Access articles published, all supplemental material carries a non-exclusive license, and permission requests for re-use of supplemental material or any part of supplemental material shall be sent directly to the copyright owner as specified in the copyright notice associated with the article.