
Abstract
The impacts of climate on forestry will influence the tree species planted for commercial use and the ability to adapt to drastic changes in the environment. These changes have promoted the use of technologies such as remote sensing, to monitor compartments, to aid management in decision-making and planning. The use of time series datasets can aid in the understanding and prediction of compartment functioning and health. This study tested the use of Landsat 8 (spectral range 435–2294 nm) level 2 surface reflectance data and climatic variables (such as solar radiation and vapour pressure deficit) to predict tree sap flow measurements over an 8-year period. Using RapidMiner studio for statistical analysis, gradient boosting trees (GBTs) proved successful in achieving an R2 of 0.97 and an RMSE of 2.39 LPD. It is noted that of all the species that were tested (i.e. Pinus radiata, P. elliotii, Ocotea bullata, Ilex mitis, Podocarpus latifolius, P. elliotii, Eucalyptus grandis x E. nitens and E. dunnii), the RMSE was greatly reduced with the exclusion of the pine tree species, to a reduced error rate of 0.78. This suggests that using satellite data, for modelling tree sap flow of pine trees has more variation. Nevertheless, this study has proved successful in forecasting sap flow and will contribute to future research in forest health monitoring, as well as to refine the use of time series information to predict sap flow velocity in forest plantation trees.
1. Introduction
Climate has a significant impact on the distribution and species used for commercial forestry (Drake et al., 2016; Kirilenko and Sedjo, 2007). Commercial forestry plantations in South Africa are confined to areas of high rainfall, to sustain long-term growth and vigour (Ferreira et al., 2023; Kaptein et al., 2023; Van der Merwe et al., 2022). The various challenges of environmental influences and competition with other industries make site-species matching a priority. However, fluctuations in climatic conditions may lead to unforeseen risks such as drought, hail and pests and diseases (Baldi and La Porta, 2020; Lehmann et al., 2015; Urban et al., 2017; Van der Merwe et al., 2022). To adapt to this, companies rely on tree breeding strategies to bolster the resilience of trees to changes in climate and the introduction of pests and diseases (Matthews et al., 2018; Solh and Van Ginkel, 2014; Warburton and Schulze 2008). Several studies have analysed the impact of climate change on compartment health (Czimber and Galos, 2016; Keskitalo et al., 2016; Schoene and Bernier, 2012). The effects of this may lead to reduced yields, stunted growth and even mortality, greatly reducing the likelihood of a return on investment from commercial tree stands (Ferreira et al., 2022; Mahlangu et al., 2018).
These impacts often result in increased frequency of extreme events such as variability in rainfall, which leads to increased intensity of droughts and floods (Van der Merwe et al., 2024). Furthermore, an increased frequency of extreme environmental conditions may have an adverse effect on the productivity of forest stands, delaying reafforestation or destroying long-term investments in the form of stunted growth and severe mortality (Engelbrecht and Monteiro, 2021; Van der Merwe et al., 2024). This delay in recovery is due to a reduction in leaf water potential and stomatal conductance, caused by environmental stress (Engelbrecht and Monteiro, 2021; Skelton and Brodribb, 2018), and can be predicted by water transport properties of trees (Skelton and Brodribb, 2018).
To improve the information gathered from forest stands, applications of remote sensing technologies are implemented, to assist in decision-making (Dragavtsev and Nartov, 2015; Ferreira et al., 2022). However, the variables selected to monitor forest health have been driven by popularity and ease of access (Ferreira et al., 2023; Xulu et al., 2019). Sap flow can provide valuable information on compartments, such as the forest water status, as monitoring is almost continuous, capturing fluctuations in gas exchange in real-time (Skelton and Brodribb, 2018). For example, a study by Børja et al. (2015), succeeded in detecting a reduction of sap flux density in stressed trees using the heat field deformations method. Furthermore, they found that this reduction was present for a short period prior to the visual appearance of stress symptoms and thus could potentially add value as part of health diagnostics tool. This information of water status and gas exchange is directly influenced by environmental variables and can be used as an indicator for stress, such as identifying the presence of adverse abiotic conditions (Mapeto et al., 2018; Skelton and Brodribb, 2018). However, the equipment is expensive and localized, and difficult to replicate across an entire forest stand. Thus, a strategic placement of sap flow measuring devices across compartments may provide valuable continuous information, to aid in decision-making that benefits forest longevity (Mapeto et al., 2018; Skelton and Brodribb, 2018).
Eco-physiological studies by Mapeto et al. (2018) and Kaptein et al. (2022), which were designed to improve our understanding of site-tree interactions, resulted in the development of significant functional relationships between environmental variables and tree water-use. Mapeto et al. (2018) used soil moisture, solar radiation and wind velocity to predict sap flow in trees with a high degree of accuracy and confidence. These relationships were in line with our understanding of plant physiological relationships (Kaptein et al., 2022; Mapeto et al., 2018).
Fundamentally, monitoring compartments is crucial to ensure long-term sustainability (Baldi and La Porta, 2020; Ferreira et al., 2023; Huang and Asner, 2009; Xulu et al., 2019). However, field surveys are tedious, as depending on the tree species and stress tolerance, it may be some time before stress symptoms become visually identifiable (Das et al., 2021; Huo et al., 2021; Pullanagari et al., 2016). Nevertheless, the use of remote sensing has provided a means to capture stress at a physiological level, through use of vegetation indices and has eased monitoring of large areas of forestry compartments (Avtar et al., 2020; Carrilo et al., 2020; Dash et al., 2017; Lechner et al., 2020; Peerbhay et al., 2022). Furthermore, the robustness of risk identification is improved with the aid of machine learning algorithms, to identify correlations between variables measured (Ferreira et al., 2023; Hamdi et al., 2019). Despite these contributions to our understanding of compartment health monitoring, few studies have attempted to use remote sensing data to predict sap flow velocity to indicate forest condition and using climatic data (Hasimoto et al., 2023; Nagler et al., 2007).
Predicting forest health is a helpful tool in decision-making, by allowing management to alter protocols and adapt to changes in forest health to improve the longevity of forest stands (McCullagh and Nieuwenhuis, 2015; Ovchynikova and Dupliak, 2021). Furthermore, this has provided a means to estimate timber yields, supplementing information for sustainable forest management (McCullagh and Nieuwenhuis, 2015), as well as acquiring valuable information on forest ecosystems. Several studies have succeeded in predicting damage occurrences in forest stands. For instance, Huang et al., 2021, provides a good framework for time series analysis, succeeding in predicting Apocheima cinerarius Erschoff infestations in Populus euphratica, using MODIS NDVI data (R2 = 0.92–0.94) to identify damage severity classes and tracking outbreak times (Huang et al., 2021). Furthermore, Hasimoto et al. (2023), succeeded in estimating canopy transpiration (R2 = 0.76–0.89), using satellite remote sensing and in situ sap flow observations, which aids in the development of models that estimate transpiration (Hasimoto et al., 2023). Through the advancement of technology, the quality of information has improved, providing access to predictions of increased severity of abiotic risks, to aid in planning (McCullagh and Nieuwenhuis, 2015; Wintle and Lindenmayer, 2008). Thus, the use of sap flow for predicting health may provide a framework for forest health monitoring.
There exists a need to monitor large forest landscapes in an efficient manner, by estimating the trends in health change over time. This aids in the prediction of forest health, which improves decision-making and management practices. The primary research questions are as follows: (1) To what extent does sap flow rates differ between indigenous species and exotic species? (2) How efficient is Landsat 8 data at predicting sap flow rates with added climate data? (3) What are the most important sensor and environmental variables for predicting sap flow in commercial and indigenous forest stands?
2. Material and methods
2.1. Study area
Data from two sets of sap flow velocity (SV) experiments were selected, which were spread across South Africa (Figure 1). Firstly, a plantation in George (33°56′35″S, 22°30′41″E), Western Cape and secondly, plantations in the Zululand area of KwaZulu-Natal (28°36′06″S, 32°11′22″E). The sites in the George area were aged 13 years, with species Pinus radiata, P. elliotii, Ocotea bullata, Ilex mitis and Podocarpus latifolius (Mapeto et al., 2018). The site in the KwaZulu-Natal province and was aged 8–20 years, with species of P. elliotii, Eucalyptus grandis x E. nitens and E. dunnii (Kaptein et al., 2022). Map of HPV study areas of several compartments located in the KwaZulu-Natal region and Western Cape region of South Africa, where George compartments are represented by the red diamond, the Zululand compartments by orange circle and compartment forestry.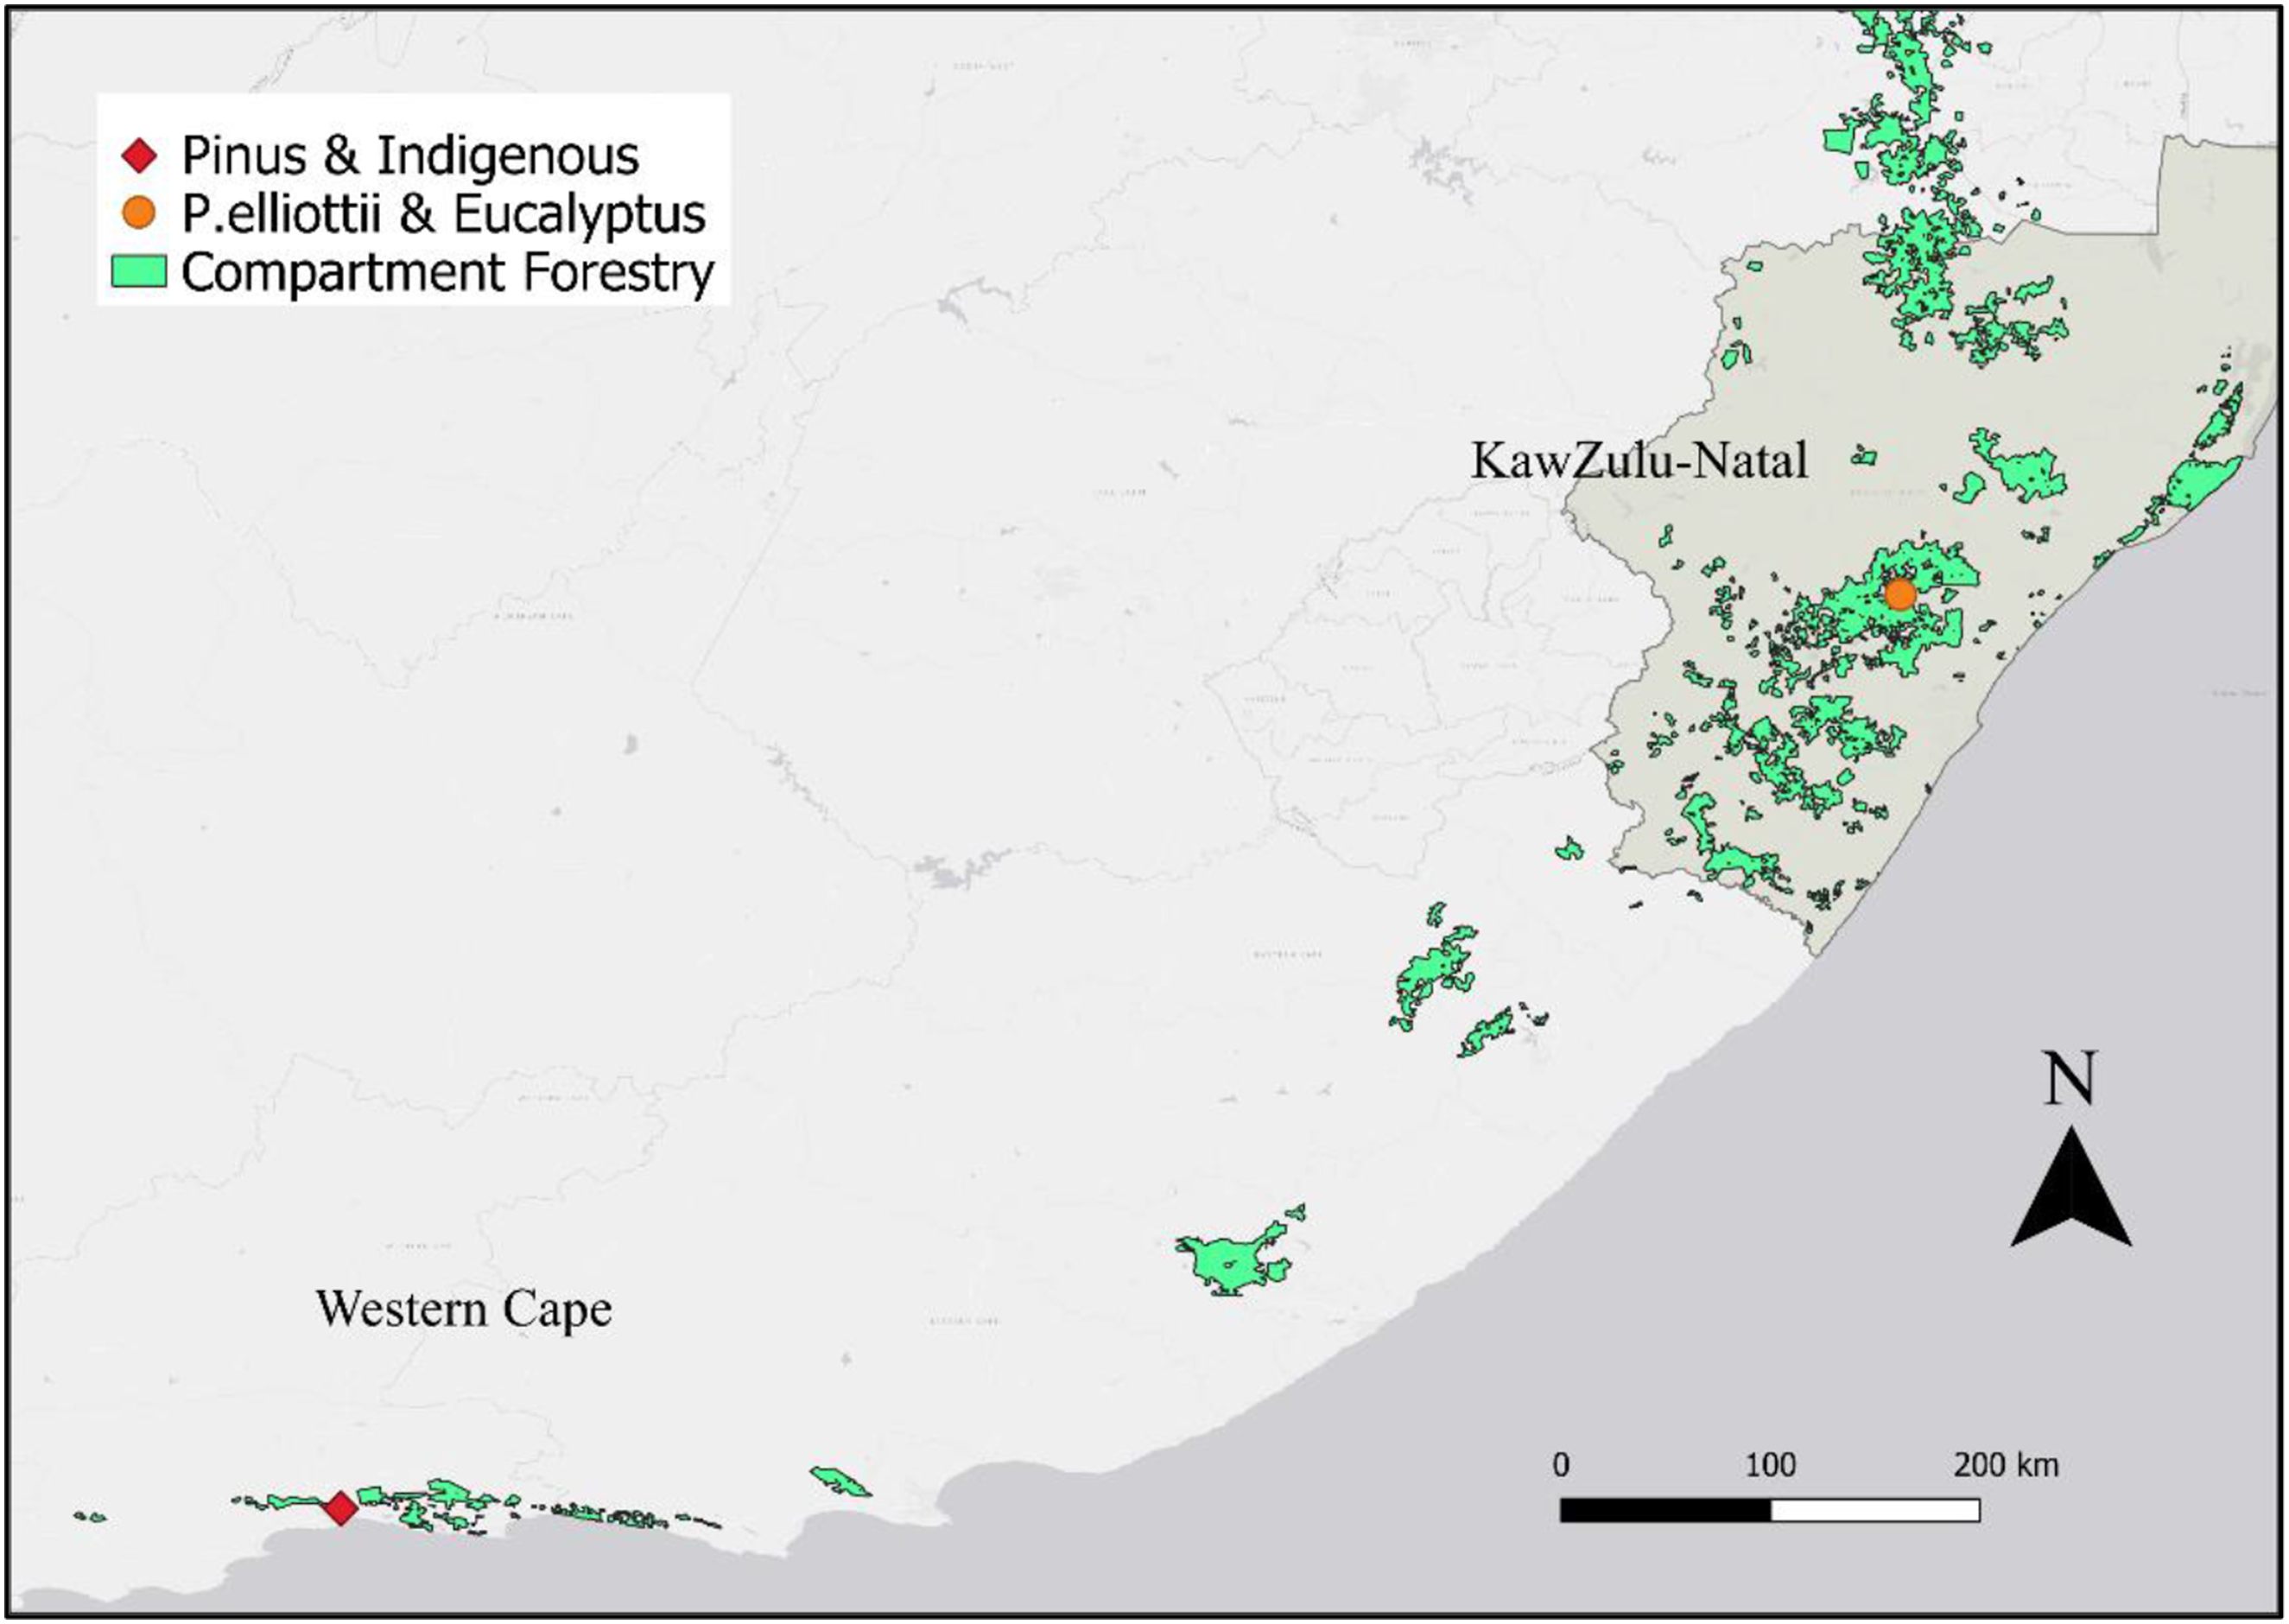
2.2. Field data collection and climatic variables
SV sensors were installed prior to collecting data over the period of 2013–2021. The pine and eucalypt species are widely used across South Africa due to their superior wood quality and fast growth. Climatic variables collected at the sites were solar radiation, rainfall, transpiration, temperature, relative humidity (RH) and vapour pressure deficit (VPD) in conjunction with SV. The variables were collected with the aid of weather stations placed in the areas of the sites.
The weather data variables that were collected from the study sites were rainfall (through TE525-L, Texas Electronics, Dallas, TX, USA), solar radiation (through LI-200SA, LI-COR Inc., Lincoln, NE, USA), temperature and humidity (HMP50, Vaisala, Helsinki, Finland) as well as wind speed through (Model 03,001, RM Young, Traverse City, MI, USA) (Mapeto et al., 2018).
Along with these variables, soil moisture content was measured for trees hourly, at a depth of 30 cm (through CS616, Campbell Scientific) and logged (through Campbell Scientific CR1000) (Mapeto et al., 2018).
2.3. Sap flow velocity data acquisition
Sap flow data used in the study was acquired from past studies of Mapeto et al. (2018) and Kaptein et al. (2022). The objectives of the study by Mapeto et al. (2018), were to quantify and characterize the influence of environmental conditions that occurred locally, on the whole tree sap flow of individual species of Pinus and indigenous trees (Mapeto et al., 2018). The objectives from the study of Kaptein et al. (2022), were to compare the transpiration and total evaporation rates, between Eucalyptus and Pinus species, as well as to assess the impacts of both species on the plantation water yield (Kaptein et al., 2022). Data on sap flow was acquired through the heat ratio method of heat-pulse velocity (Burgess et al., 2001; Kaptein et al., 2022; Mapeto et al., 2018). Of these data sets, daily sap flow data was extracted. These days were matched to the days Landsat data images were available for the year.
2.4. Landsat images and pre-processing
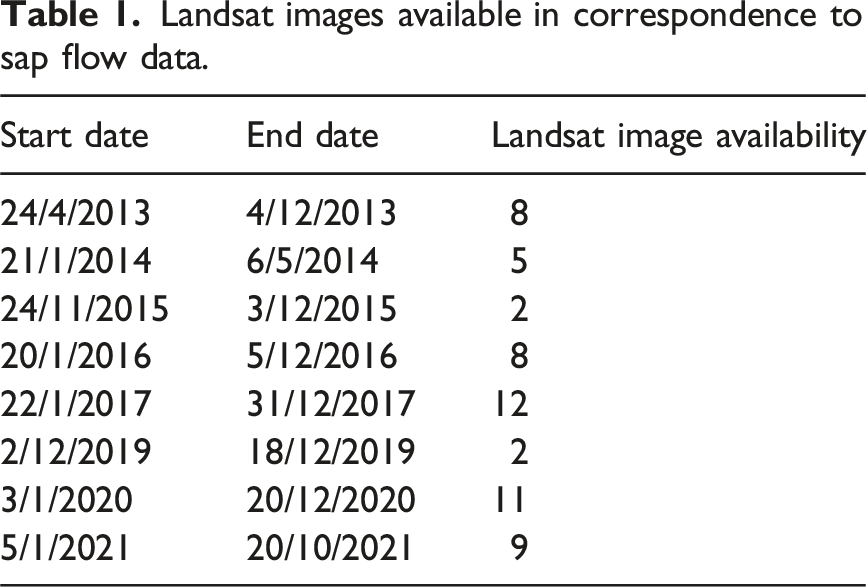
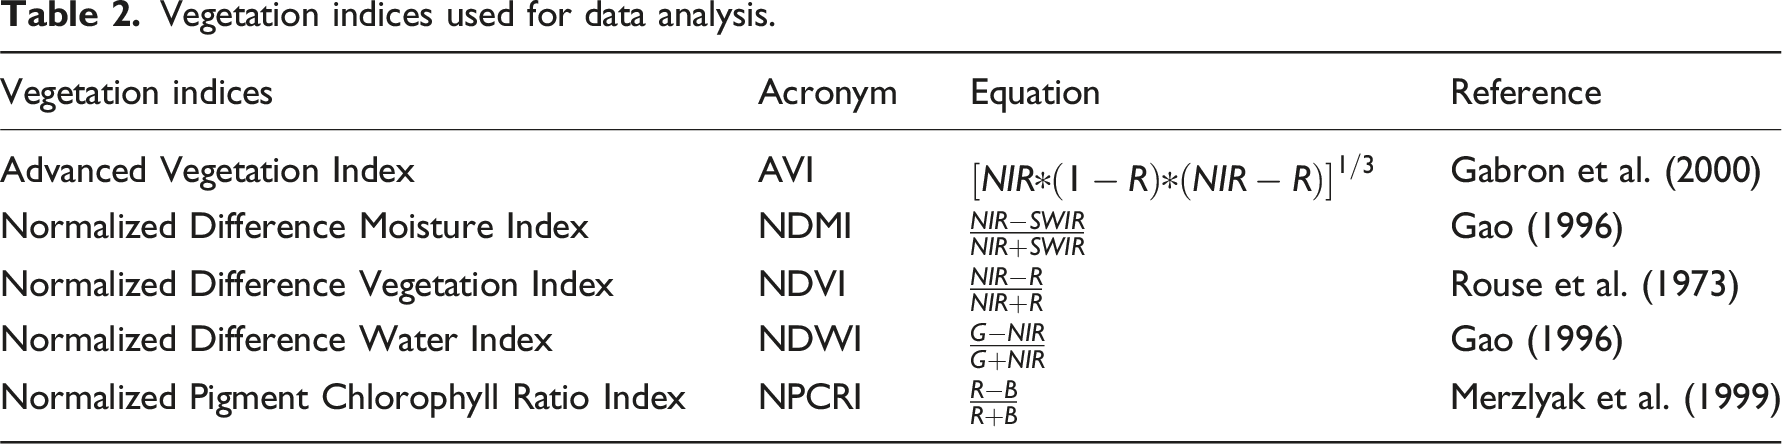
Sap flow data GPS points were used to extract data from corresponding Landsat images. Landsat 8 images were acquired from United States Geological Survey in June 2023 (USGS, https://earthexplorer.usgs.gov/), where images were selected based on availability, less than 10% cloud cover and matched to sap flow timelines. Only one image tile was needed to cover the study area of the George region, and one other to cover the study area of the KwaZulu-Natal province. Landsat 8 has seven spectral bands, at a resolution of 30 m, which were incorporated in the study, namely, Coastal Aerosol (band 1, 0.43–0.45), Blue (band 2, 0.45–0.51), Green (band 3, 0.53–0.59), Red (band 4, 0.64–0.67), Near-Infrared (band 5, 0.85–0.88), SWIR 1 (band 6, 1.57–1.65) and SWIR 2 (band 7, 2.11–2.29). A surface reflectance image was created of the study area in QGIS, using Landsat 8 level 2 data, to reduce the impacts of the atmosphere on reflectance values from the compartments measured. Furthermore, spectral bands were stacked from the acquired images using QGIS version 3.36 and extracted for calculation of indices that were used in data analysis.
Landsat images available in correspondence to sap flow data.
Vegetation indices used for data analysis.
2.5. RapidMiner
Due to the streamlined process of selecting data and managing inputs, RapidMiner was selected for data analysis (Figure 2). Through a preliminary test of the performance of the available algorithms, gradient boosting trees were selected to help visualize the data set and perform cross validation. Model design for predicting sap flow velocity data in RapidMiner, through Process Windows operator.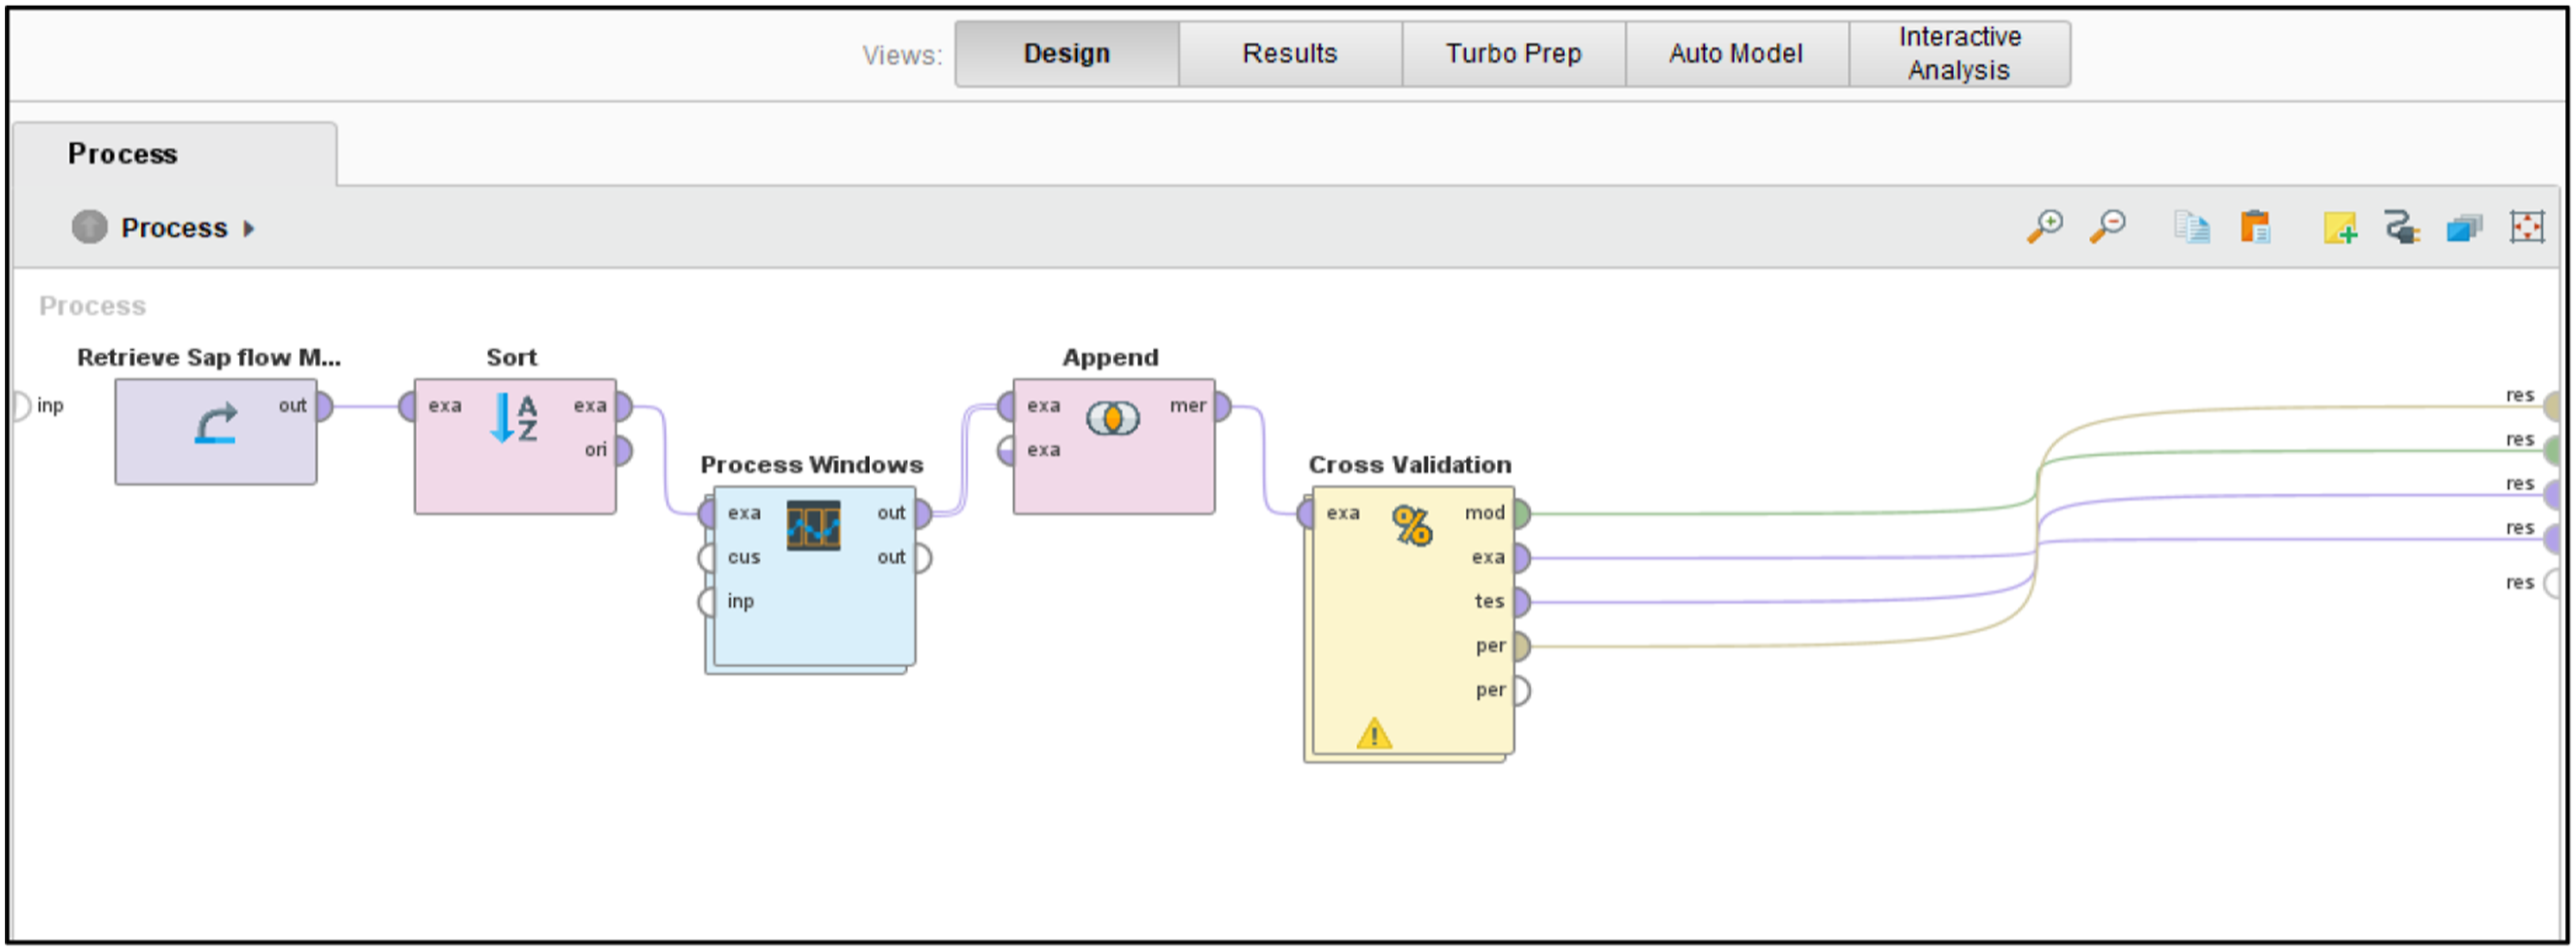
The number of trees selected for GBT was 500, with a maximum depth of 20. The process of the model contains several tasks that are carried out in sequence, such as fetching data, sorting, time series and cross validation. After this process, the model performance is evaluated (Ho et al., 2019), and data can be visualized to view correlations.
2.5.1. Time series method
Time series of sap flow data was performed in RapidMiner, through the Process Windows operator. This operator takes the input time series and creates windows, and from the subprocesses for each of the windows, it loops. The dates of measurements taken were used as the indices attribute, the horizon attribute was set to sap flow, and the window size (number of values in one window) was set to a value 7, other variables were left to default. The next operator parameters were differentiated, which takes the time series attributes and calculates the differentiated values. The attributes selected were set to a subset for variables other than sap flow. The lag was set to the default of 1 with the differentiation method of subtraction. Next the differentiated values were put through the aggregate operator, selecting the mean and stand deviation as attributes. Finally, values were pushed through a GBT model for accuracy assessment of prediction in the cross-validation operator.
2.5.2. Gradient boosting trees
Through the process of training weak learners, gradient boosting trees (GBTs) are produced resulting in predictions that provide analysable data. To increase the robustness of the model, many shallow decision trees, or weaker learners, are created to improve the overall accuracy and minimize error (Callens et al., 2020; Chen and Guestrin, 2016). Boosting is considered popular, due to its ability to perform well with smaller datasets. Furthermore, the training speed of models is fast, which adds to its popularity (Chen and Guestrin, 2016; Joharestani et al., 2019; Zhang et al., 2019). The first equation of GBT follows with equation (1) (Guillen et al., 2023; Hastie et al., 2009):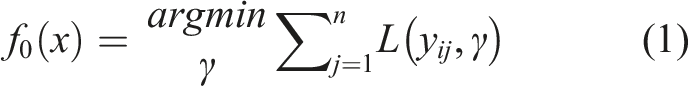
To minimize the mean square error (MSE), the value (a) (b) (c)

The regression tree is fitted to the target
3. Accuracy assessment
Prior to the use of RapidMiner, a sap flow data sheet containing all environmental variables, sap flow, dates and species was compiled in excel, in preparation for data analysis. Through use of the cross-validation operator in RapidMiner, data was divided into 10 subsets, from which 9 of those subsets were used to build a model (training), using 1 as a test subset, to measure the performance of each iteration. There were 100 iterations made from these datasets. Thereafter the performance of the model was produced to compare accuracy of R square and mean error squared in sap flow units, establishing the range in which sap flow can be predicted. This was also done to evaluate the performance per species per site as well as an overall statistical analysis.
4. Results
4.1. Descriptive statistics of all species and the corresponding variables measured at yearly intervals
Descriptive statistics of Pinus species and corresponding environmental variables.
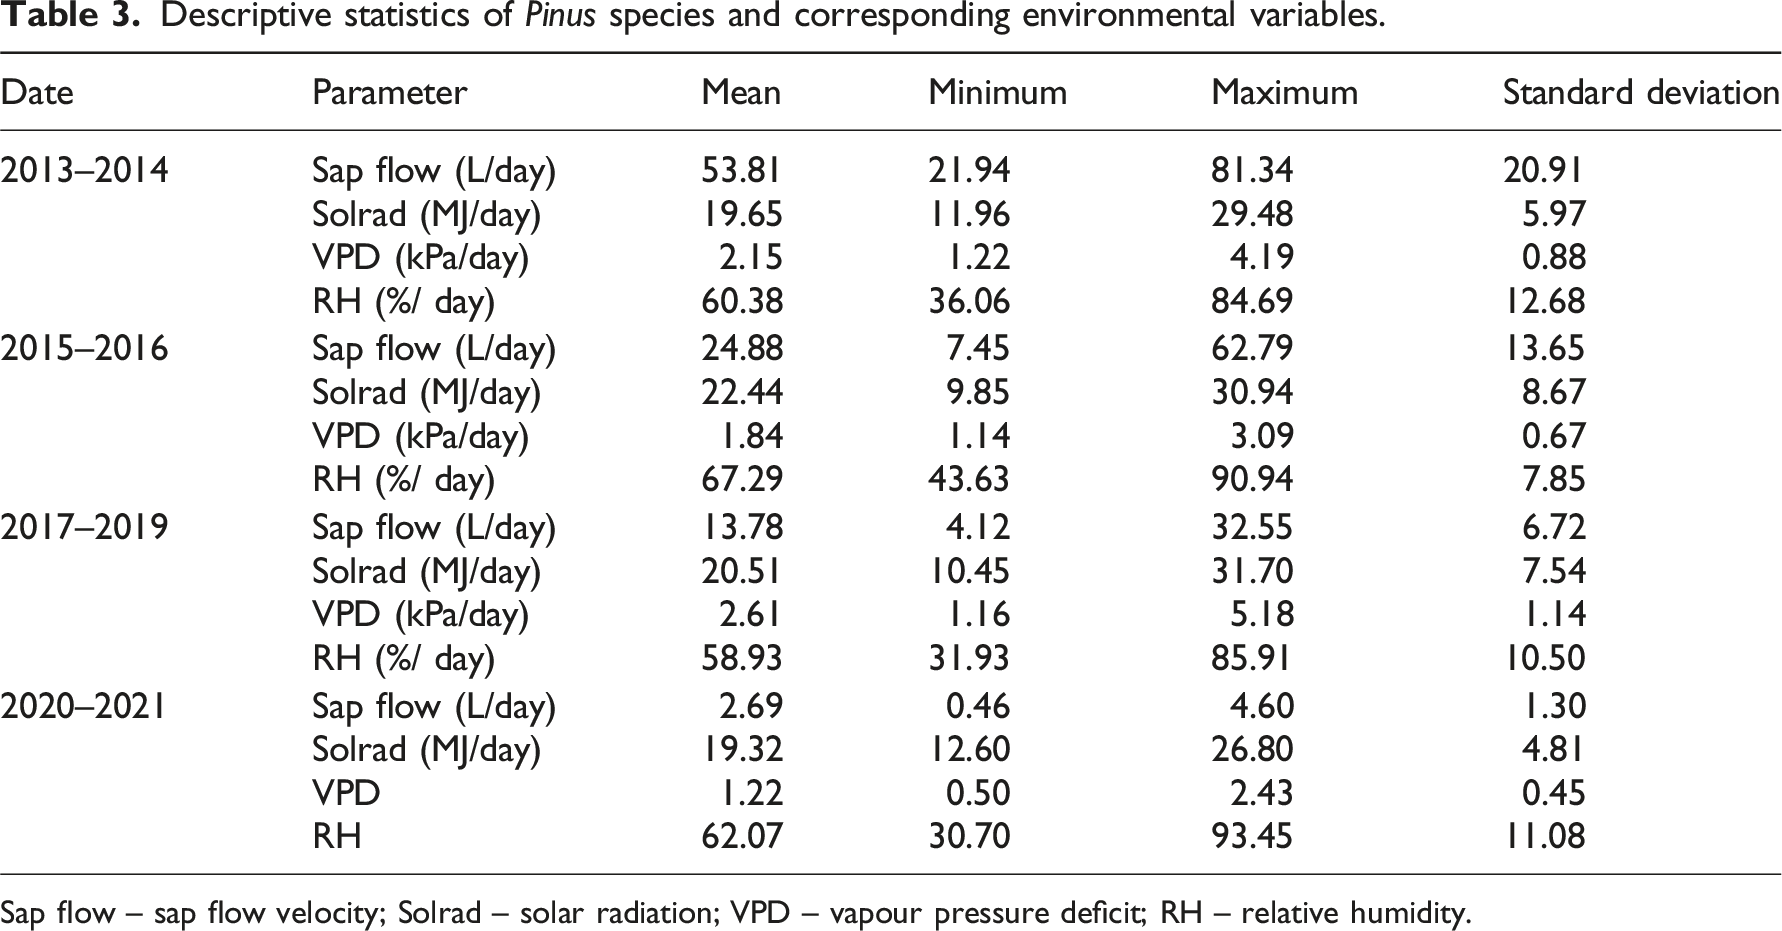
Sap flow – sap flow velocity; Solrad – solar radiation; VPD – vapour pressure deficit; RH – relative humidity.
Descriptive statistics of indigenous species and corresponding environmental variables.
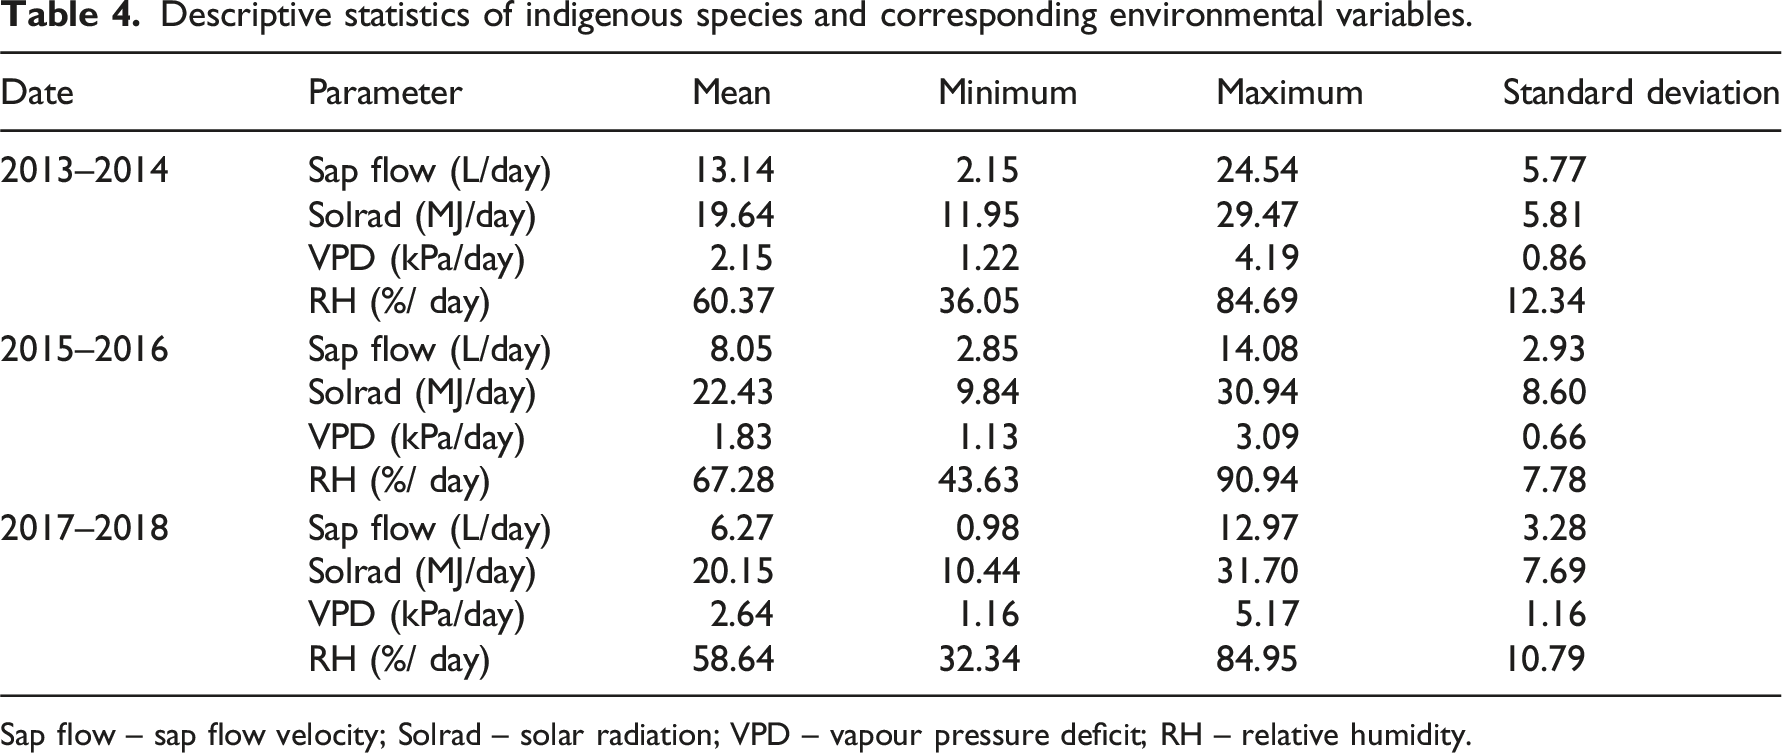
Sap flow – sap flow velocity; Solrad – solar radiation; VPD – vapour pressure deficit; RH – relative humidity.
Descriptive statistics of Eucalyptus species and corresponding environmental variables.
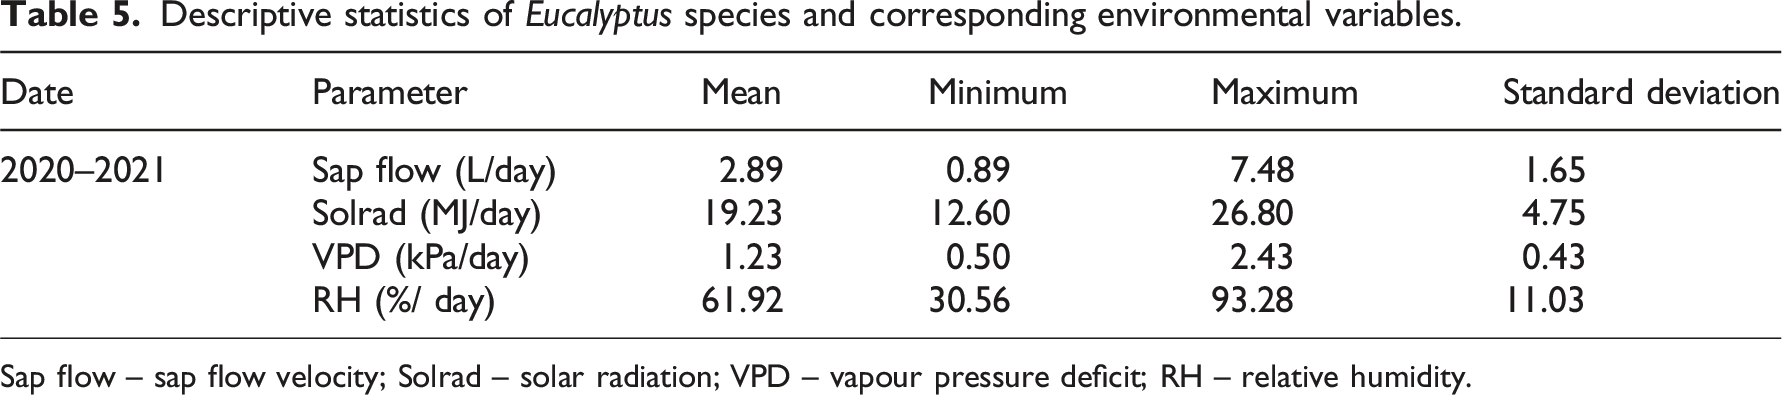
Sap flow – sap flow velocity; Solrad – solar radiation; VPD – vapour pressure deficit; RH – relative humidity.
4.2. Sap flow prediction results for all species tested
Prediction results of sap flow using the respective satellite vegetation indices and climatic data variables when combining all species into one dataset are presented in Figure 3. The model achieved an R2 of 0.97 overall, with an RMSE of 2.39 LPD in sap flow. Prediction results of all species, displaying variation between predicted sap flow and observed sap flow.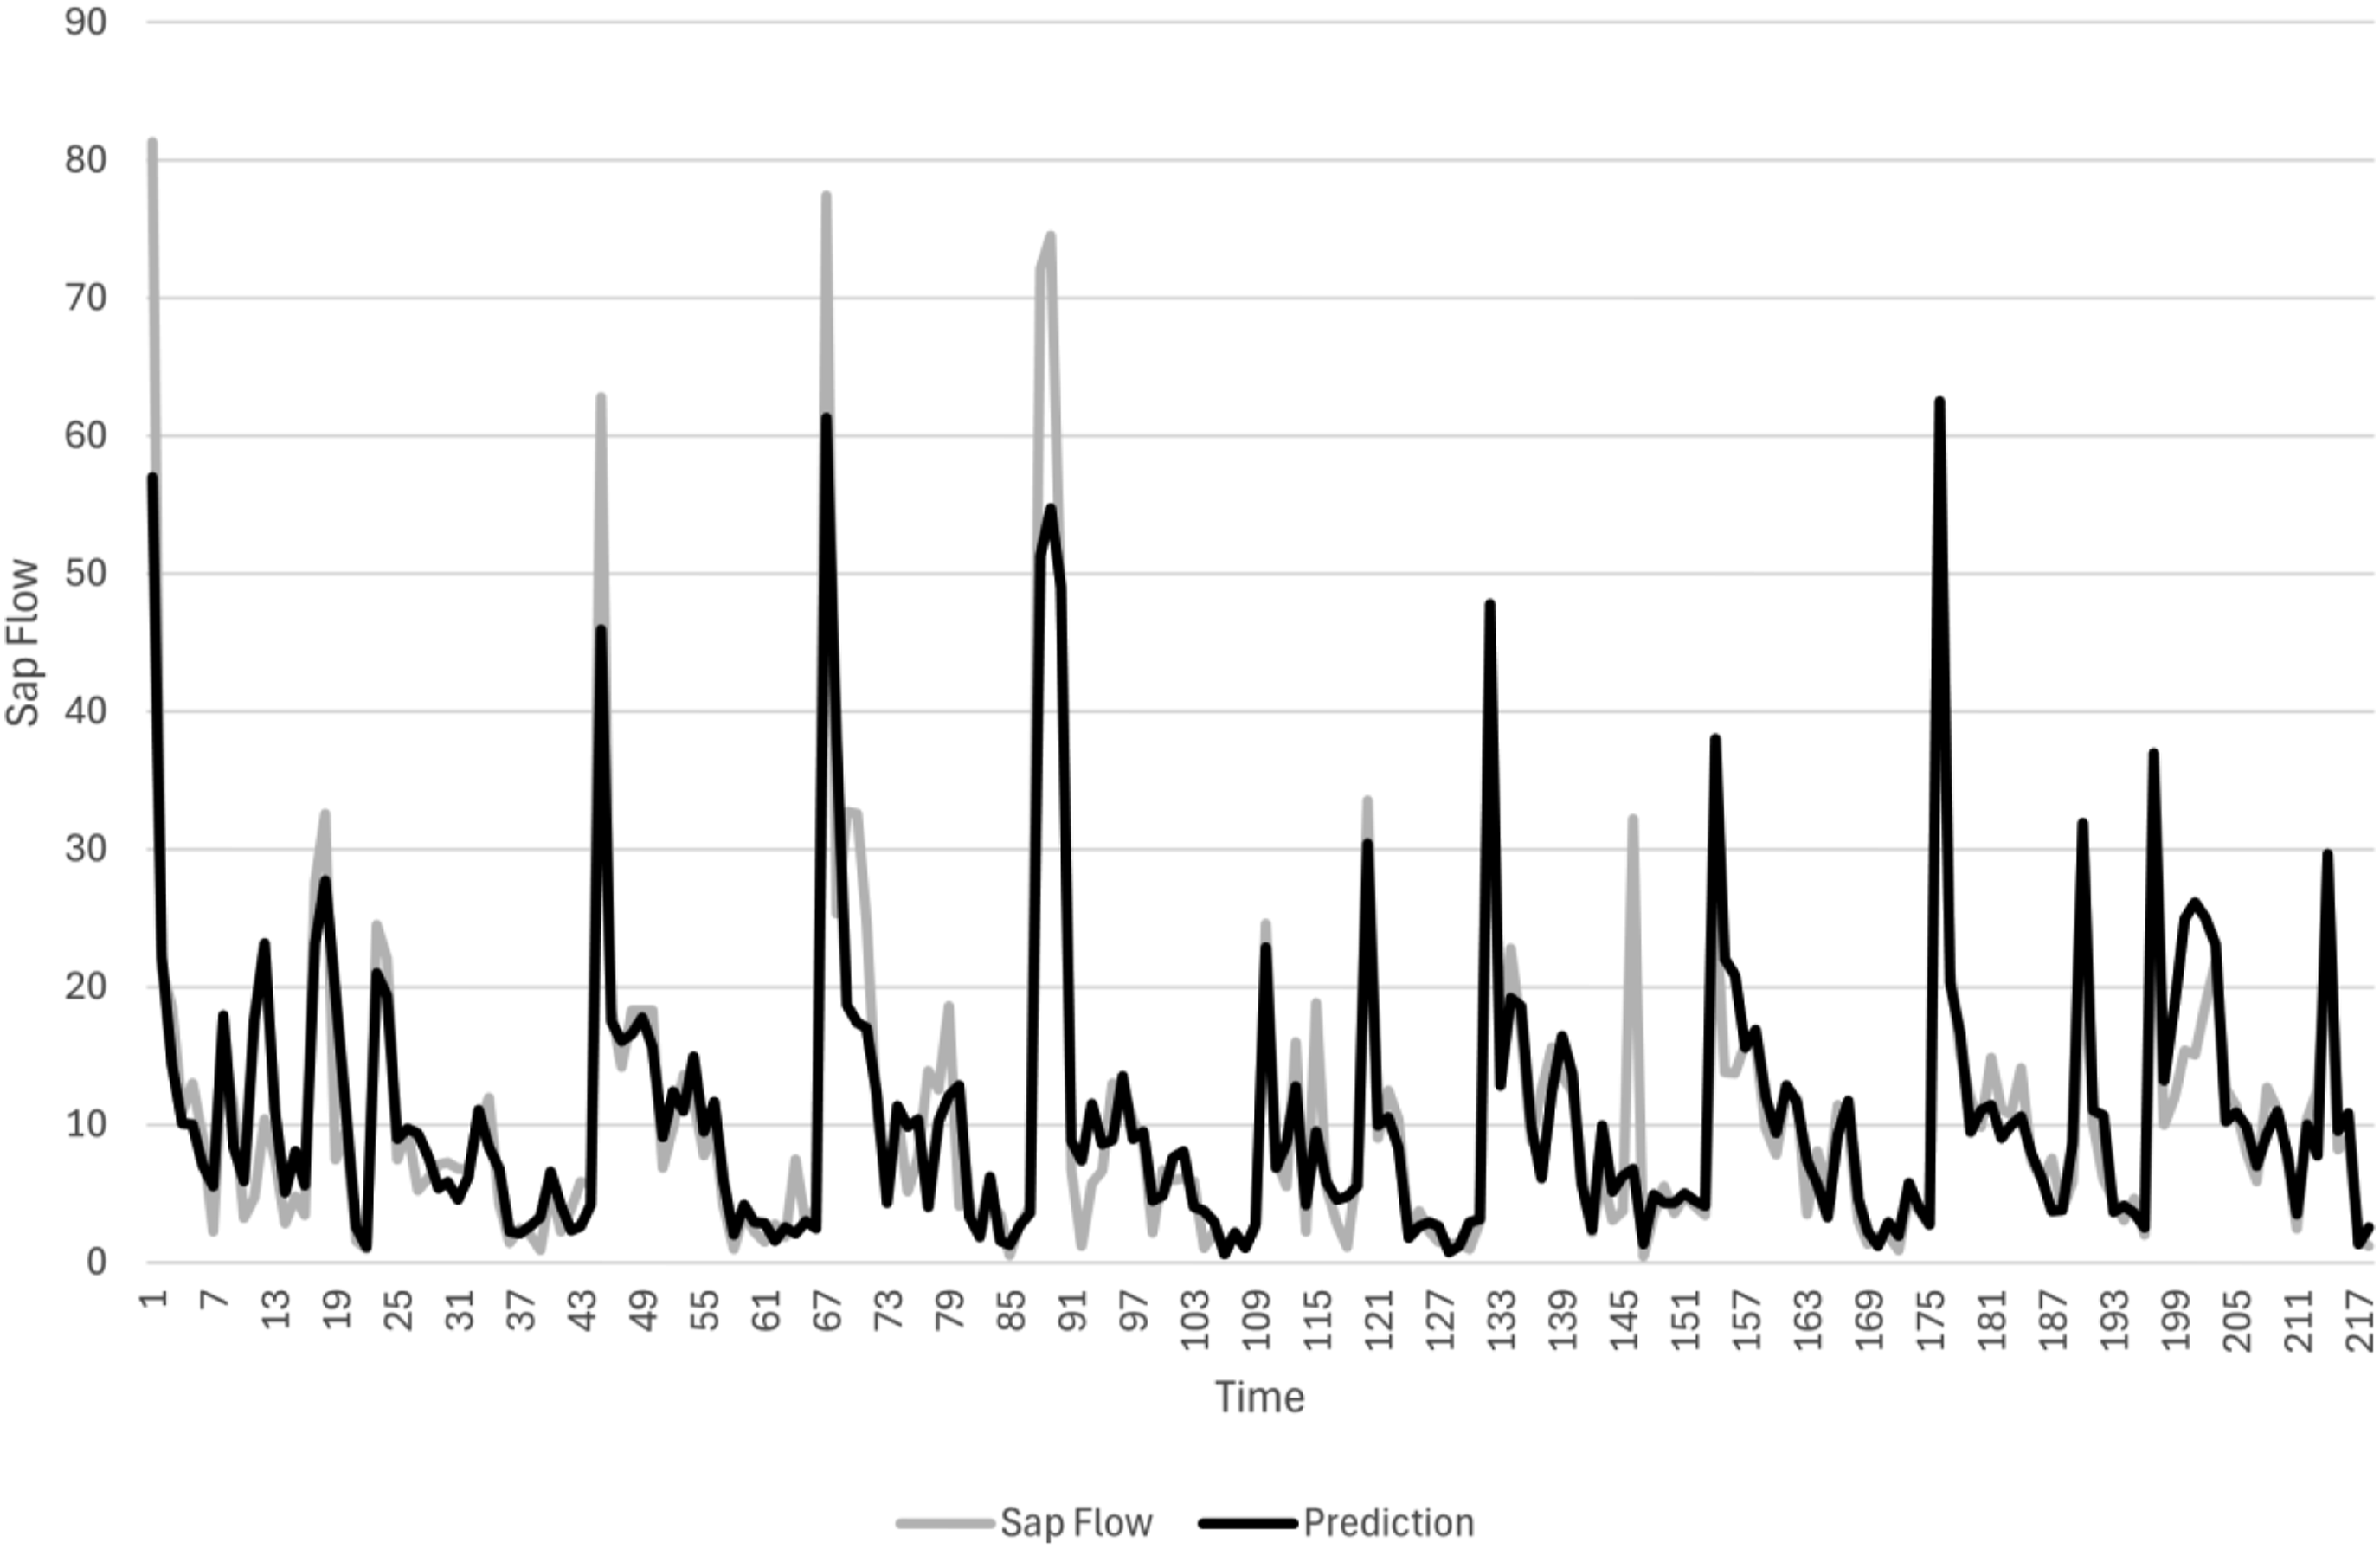
As mentioned, the Pine species that were included in the measurement had the highest error rate in sap flow units. When Pine species were removed from the model, accuracy resulted in an R2 of 0.97 and an RMSE of 0.78 LPD in sap flow. This suggested that sap flow is more difficult to predict in pine than in the indigenous and Eucalyptus species, and that there may be more outliers in model scoring. Overall, the model was successful in predicting sap flow, with predicted and actual sap flow closely overlapping in instances of measurements, providing a framework to conduct future experiments.
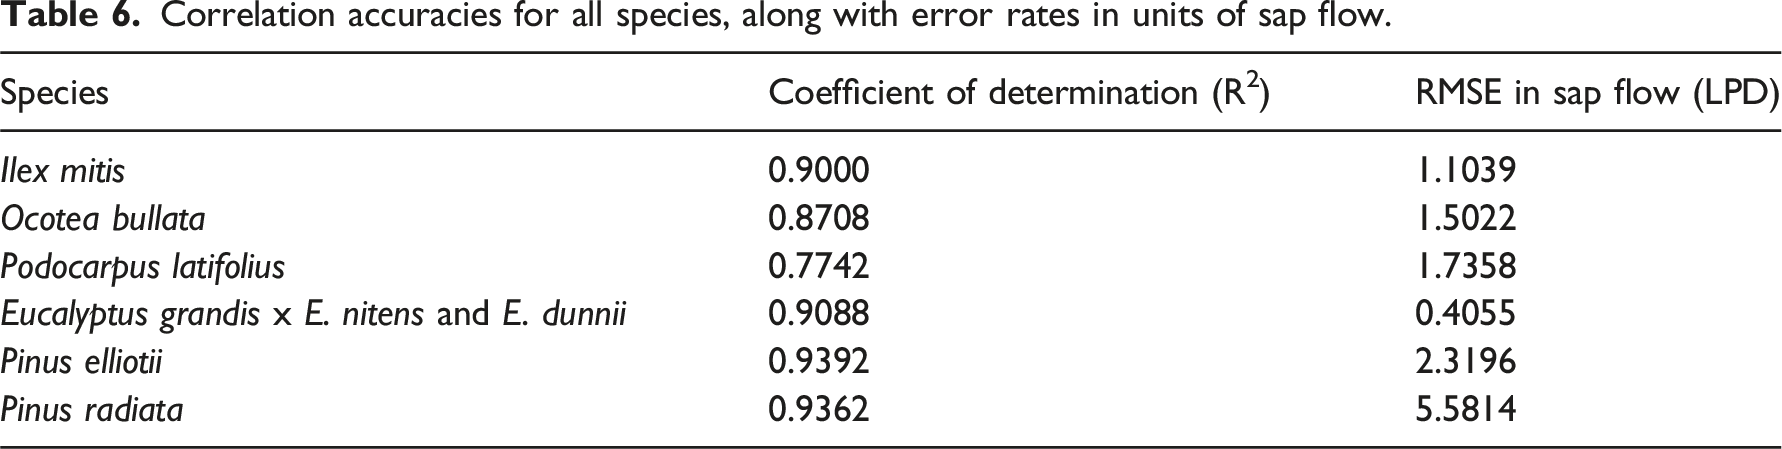
4.3. Correlation analysis for individual species using a combined dataset consisting of satellite, climatic and sap flow data
Correlation accuracies for all species, along with error rates in units of sap flow.
4.4. Relationship between observed and predicted sap flow for individual species
The accuracy of observed sap flow and predicted sap flow of Ilex mitis is presented in Figure 4. These figures give a slightly better indication of sap flow prediction accuracy and outlie in the prediction. The prediction achieved a favourable R2 value of 0.74. Observed versus predicted sap flow for Ilex mitis presented as a time sequence and scatterplot.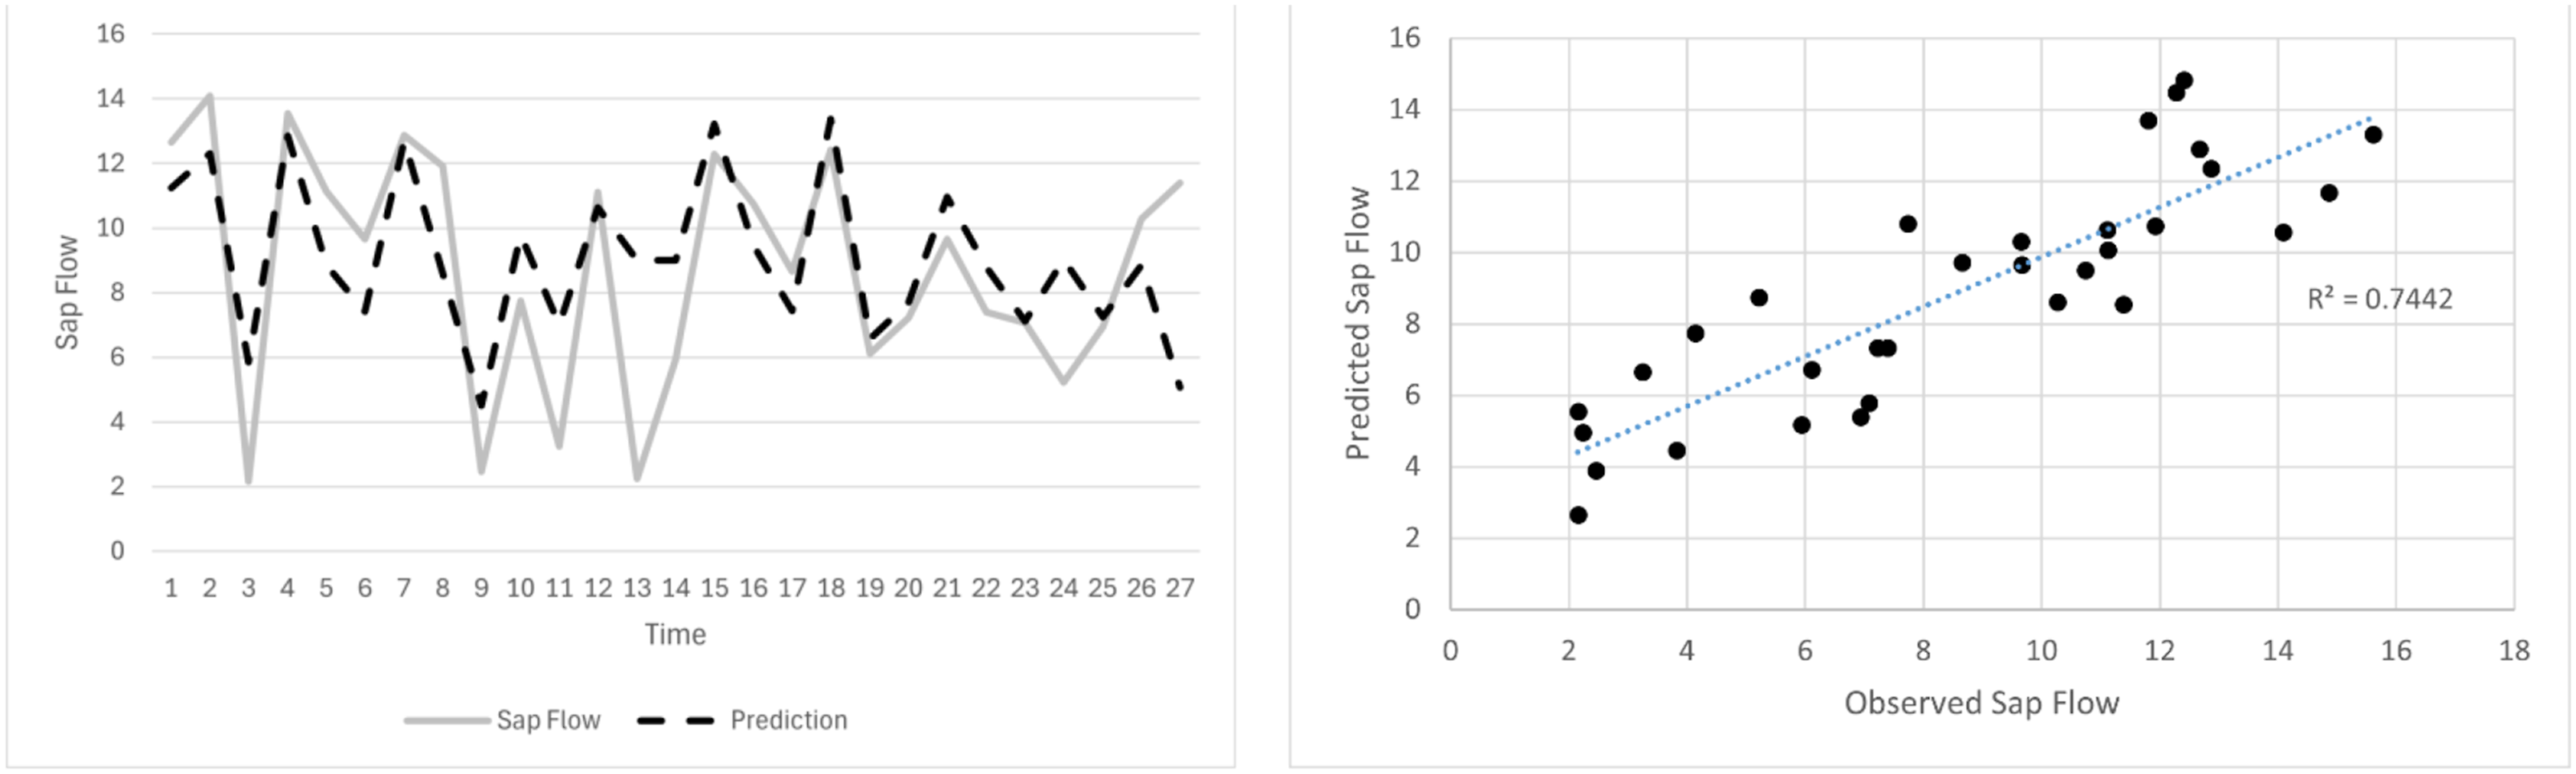
Figure 5 illustrates the observed and predicted sap flow accuracy of Ocotea bullata, which achieved a favourable R2 value of 0.73. Observed versus predicted sap flow for Ocotea bullata presented as a time sequence and scatterplot.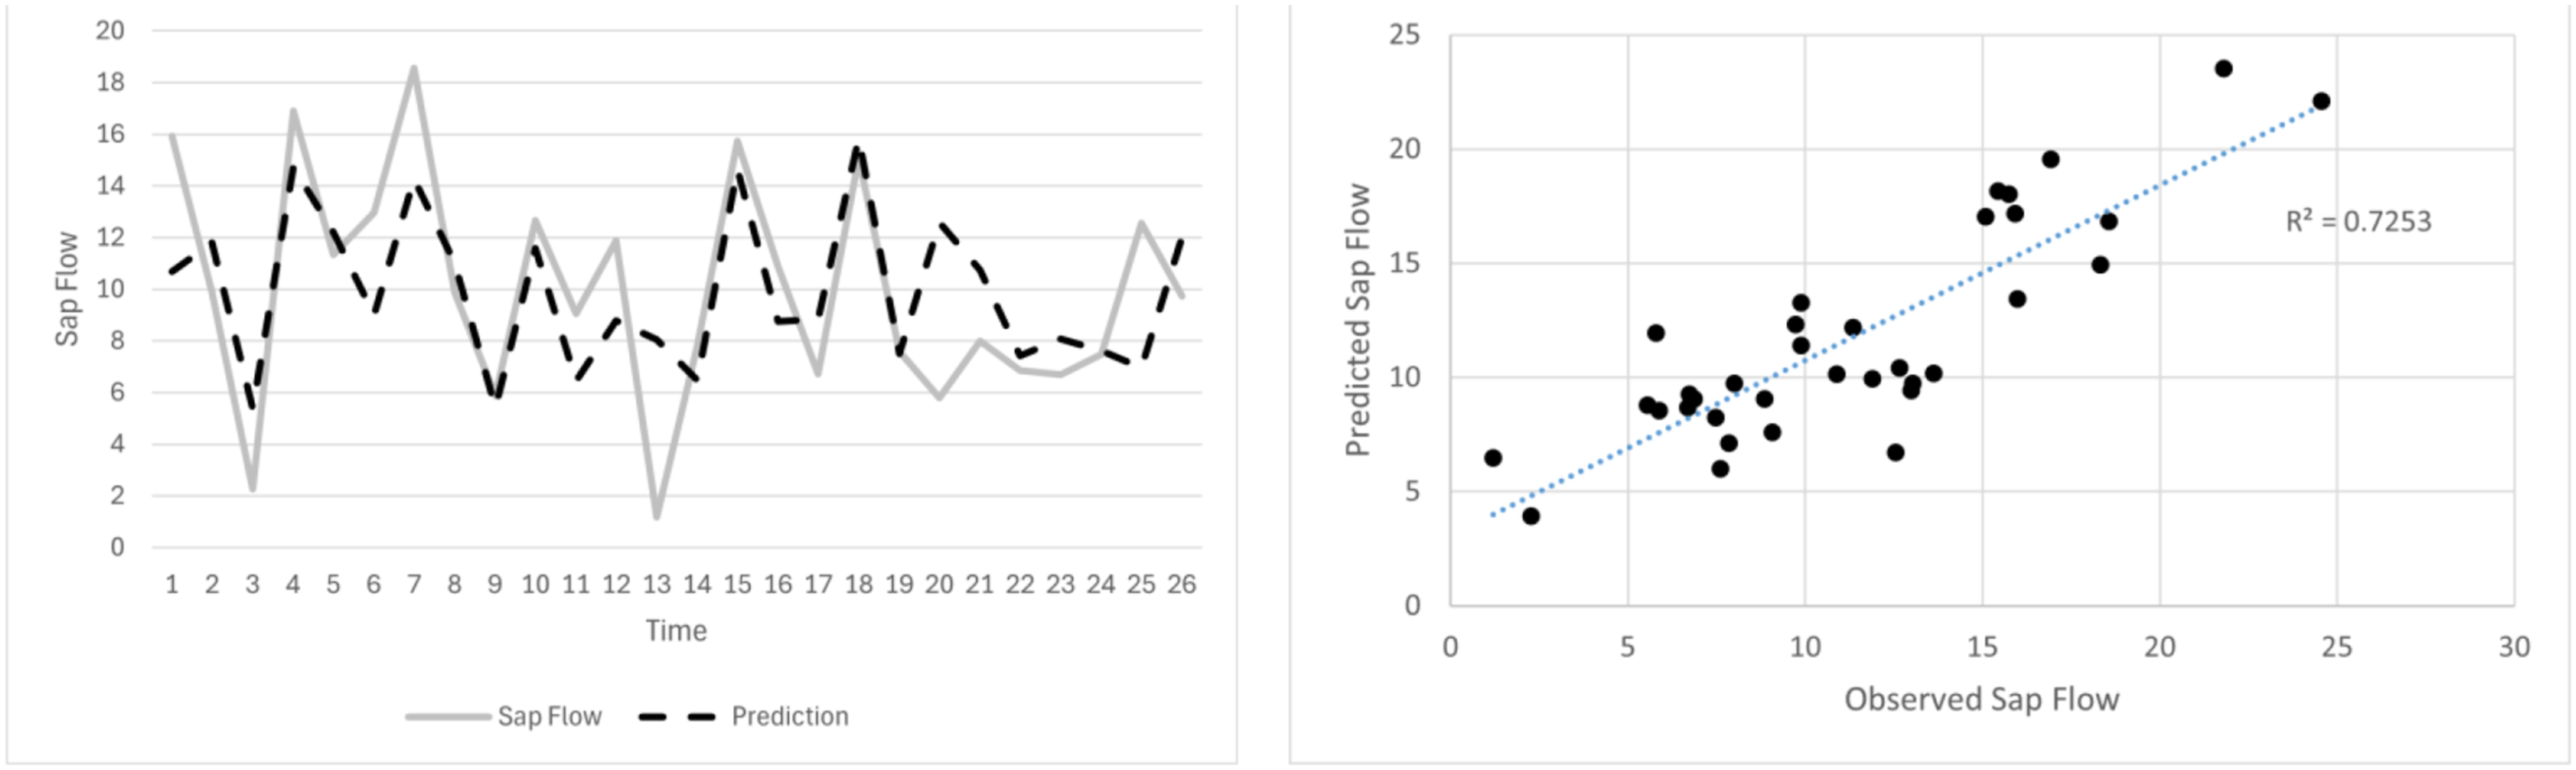
The observed and predicted sap flow accuracy of Podocarpus latifolius is illustrated in Figure 6, similarly achieving a favourable accuracy of R2 = 0.76. This accuracy was slightly higher than the other species in the indigenous trees tested. However, all species achieved favourable results. Observed versus predicted sap flow for Podocarpus latifolius presented as a time sequence and scatterplot.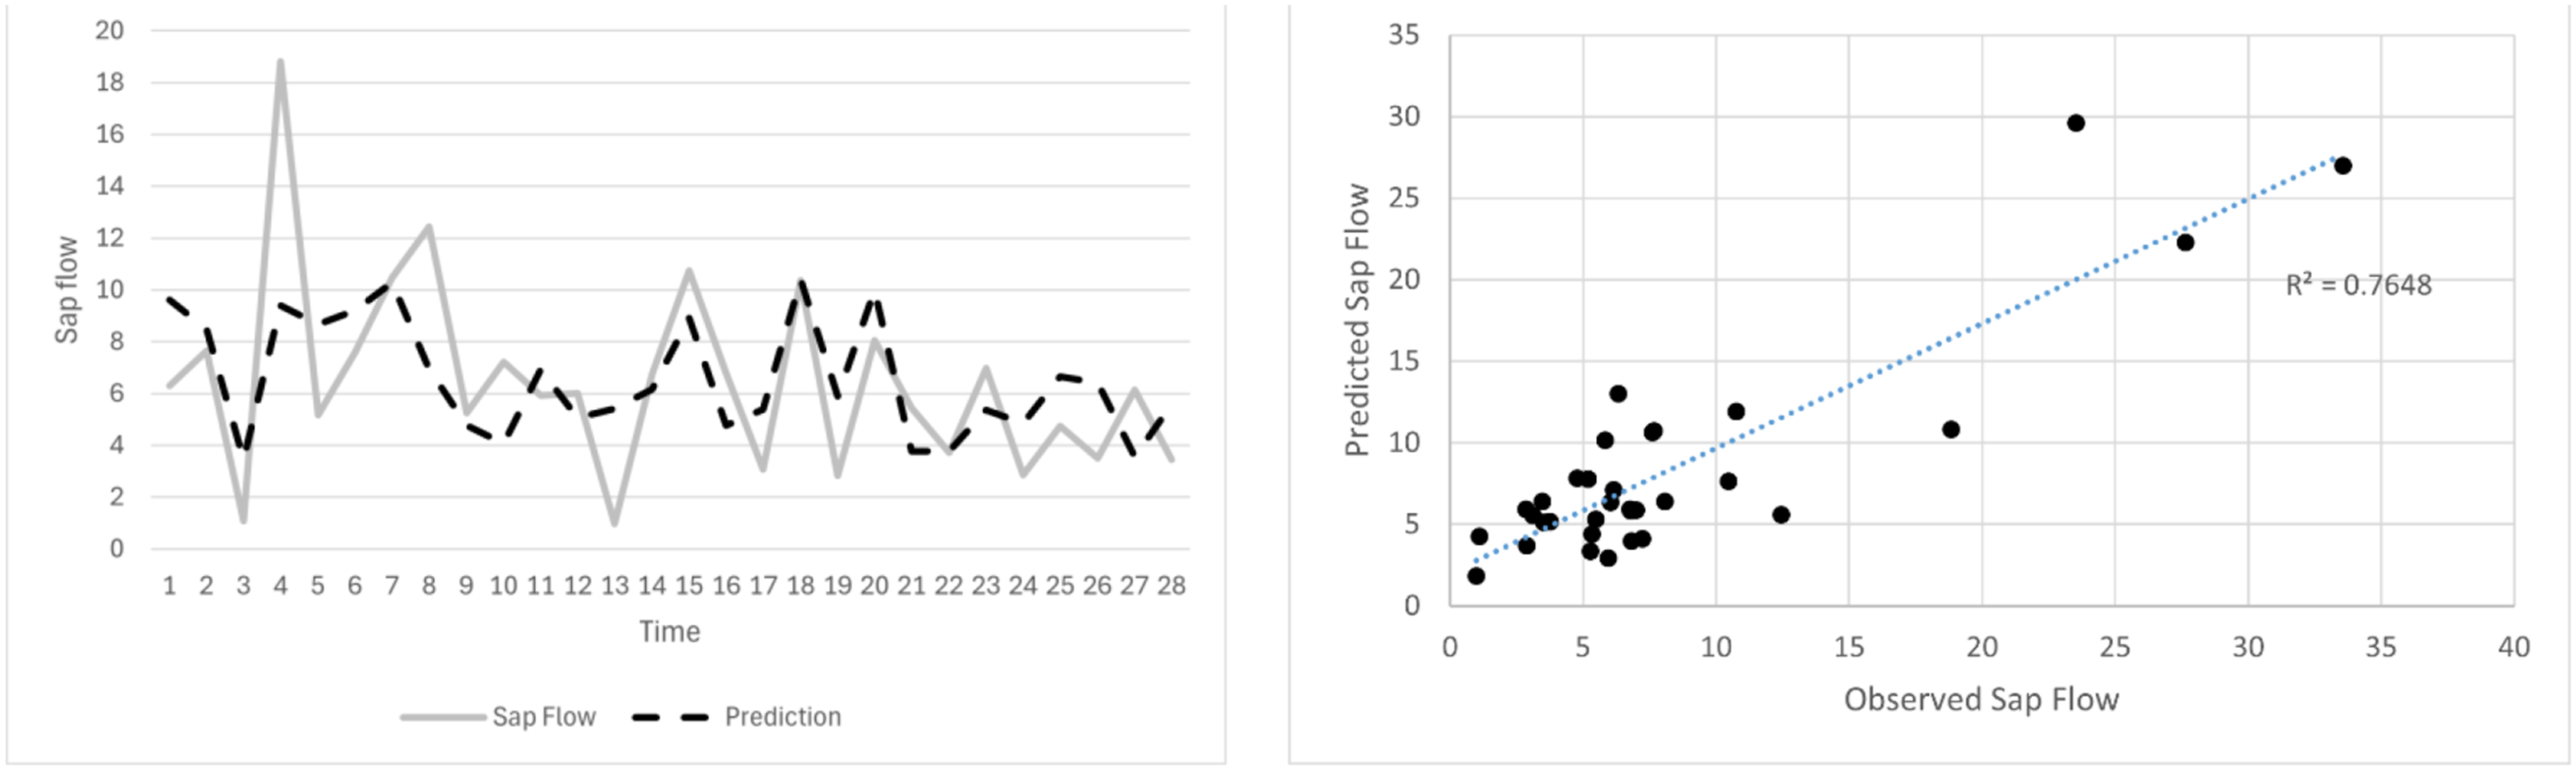
Figure 7 illustrates the observed sap flow and predicted sap flow results for Eucalyptus grandis x E. nitens and E. dunnii. Eucalyptus species were grouped for the purpose of single specie prediction, as RapidMiner was unable to predict sap flow for individual species due to data size. Eucalyptus species achieved a favourable R2 value of 0.75. Observed versus predicted sap flow for Eucalyptus grandis x E. nitens and E. dunnii presented as a time sequence and scatterplot.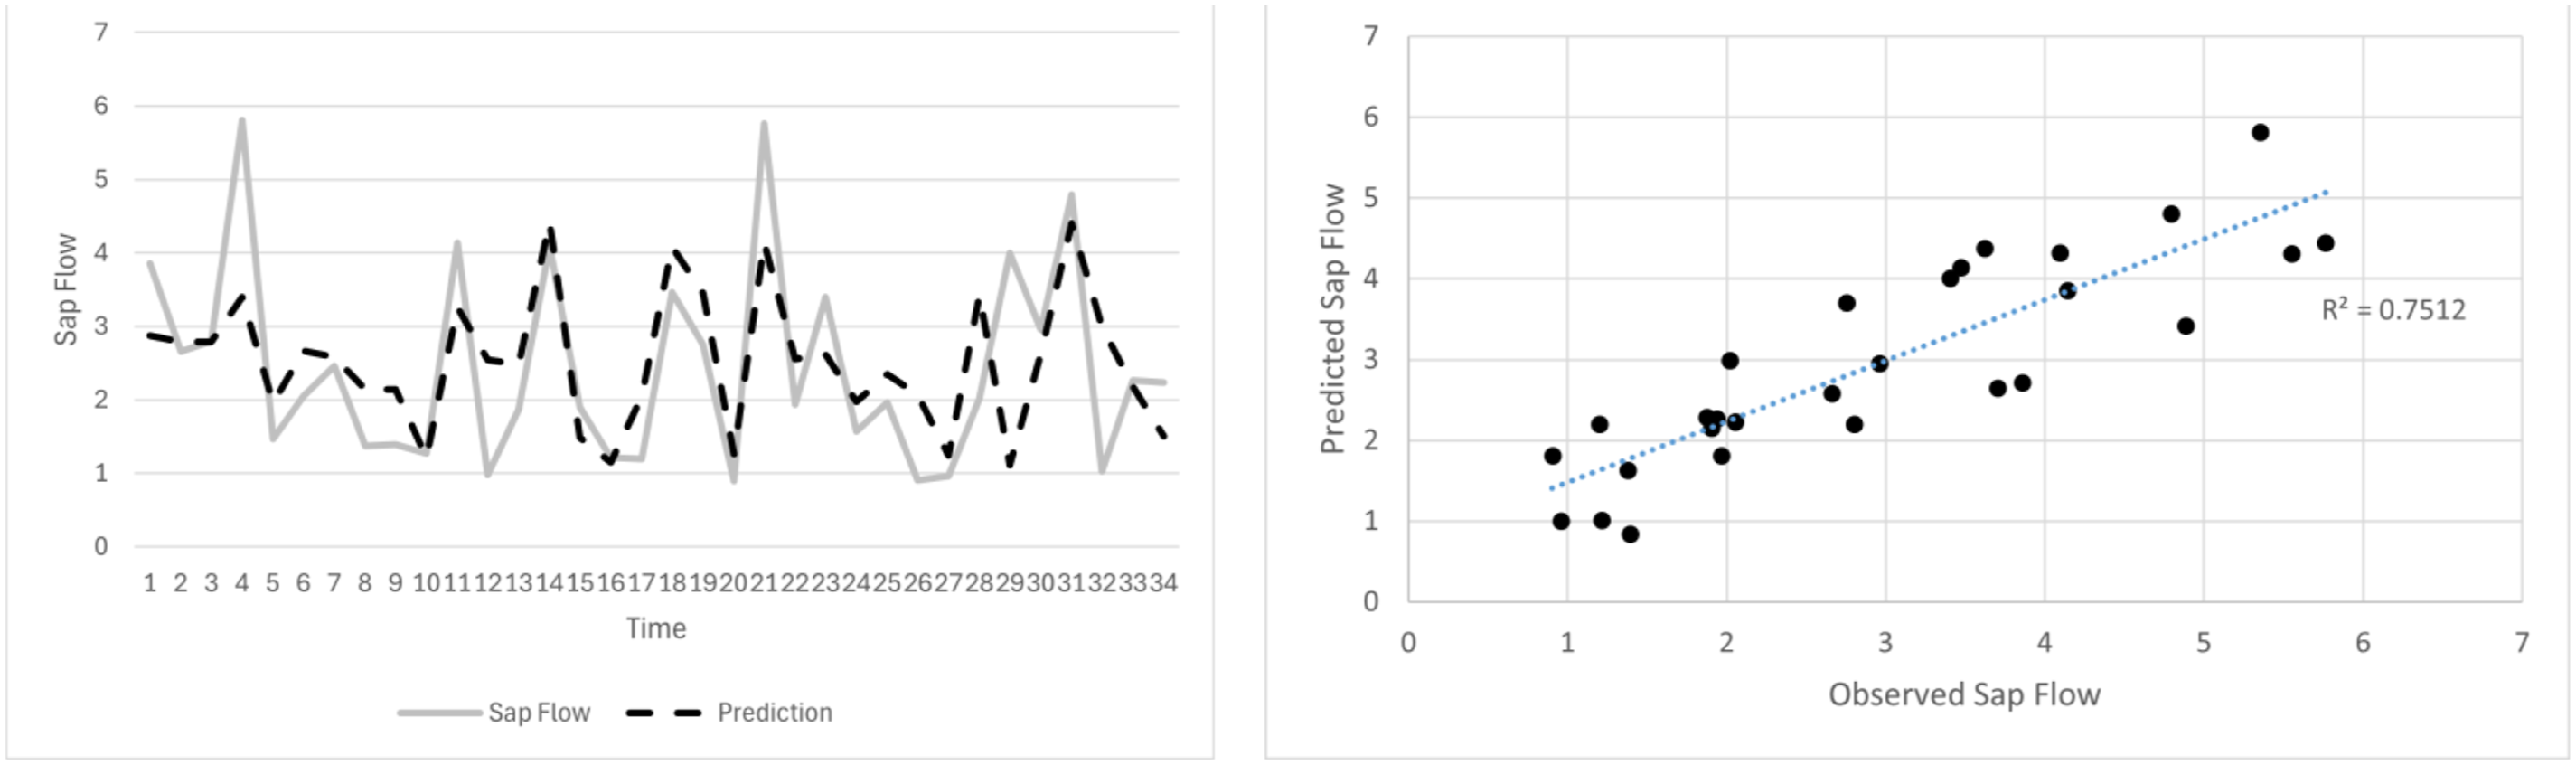
The observed and predicted sap flow accuracy of Pinus elliotii is illustrated in Figure 8, achieving an R2 value of 0.77. Observed versus predicted sap flow for Pinus elliotii presented as a time sequence and scatterplot.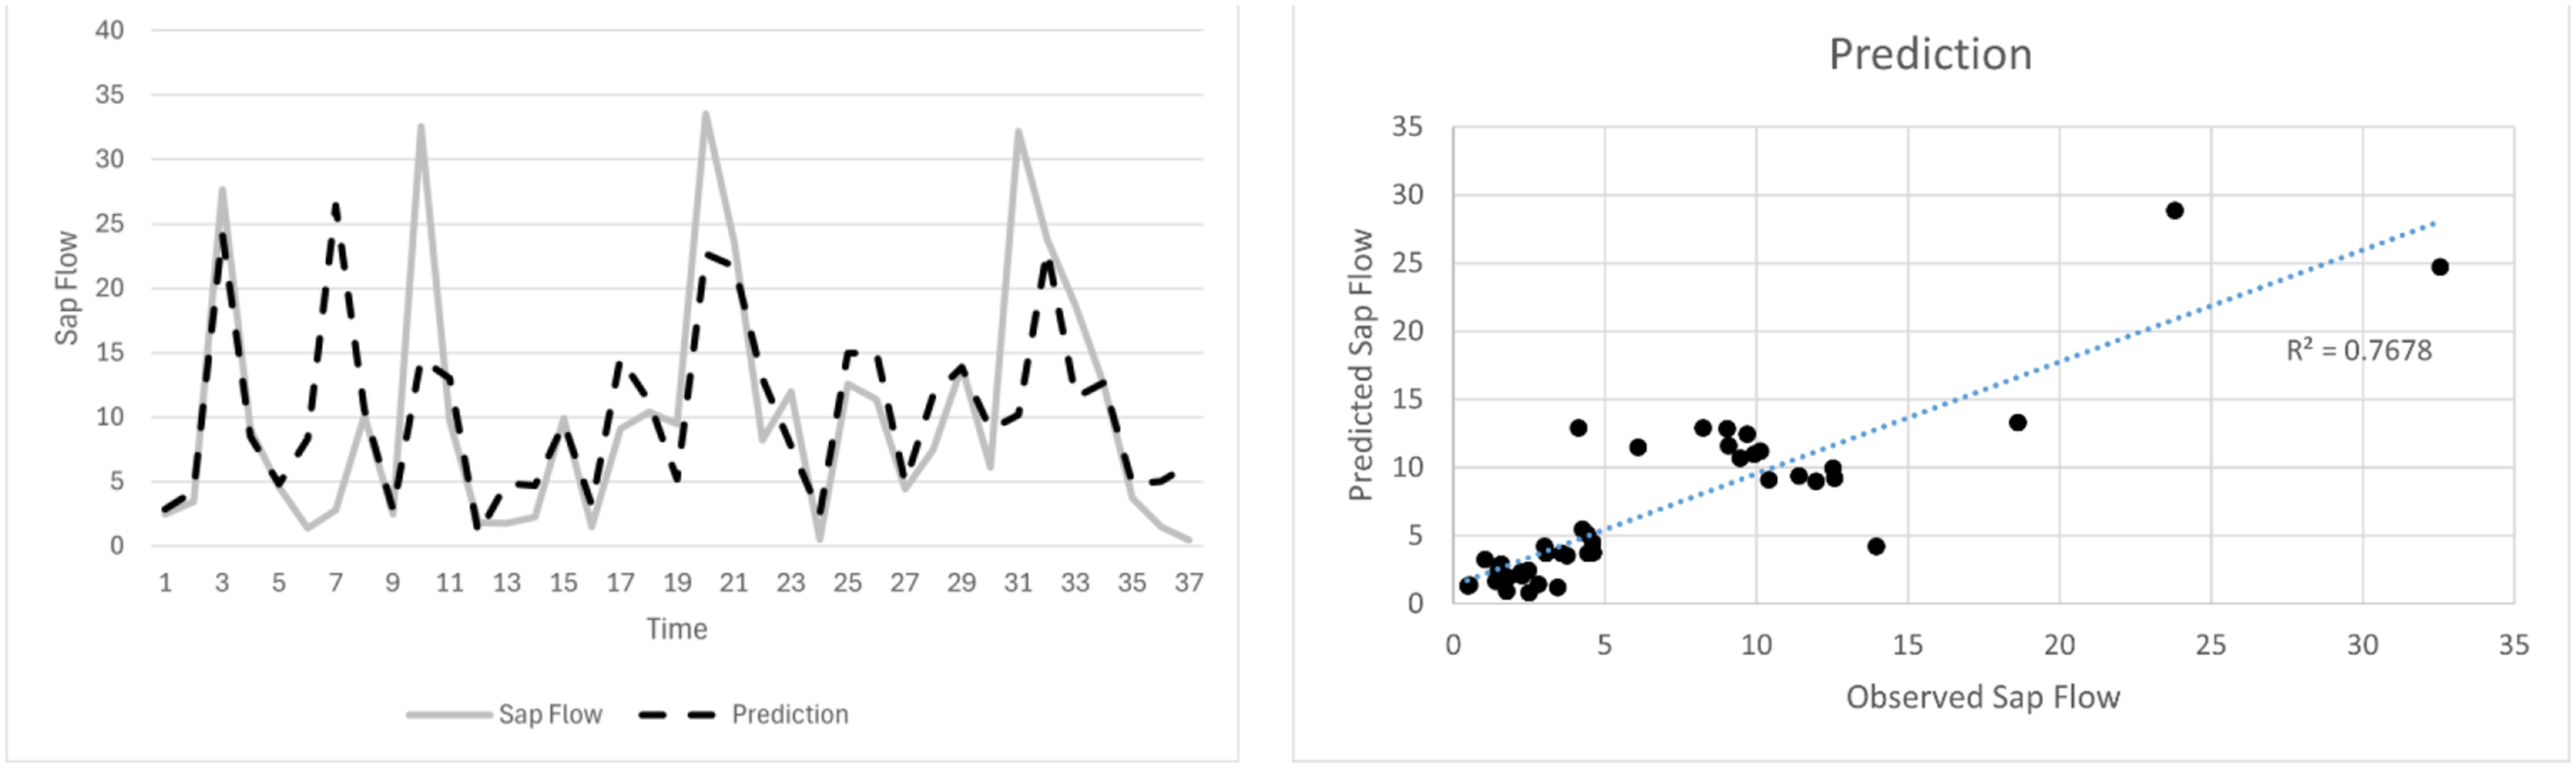
Lastly, the observed and predicted sap flow accuracy for Pinus radiata is illustrated in Figure 9. Pinus radiata also achieved a favourable accuracy of R2 = 0.76. Overall, all species have achieved similar results and have favourable predictions of sap flow. Observed versus predicted sap flow for Pinus radiata presented as a time sequence and scatterplot.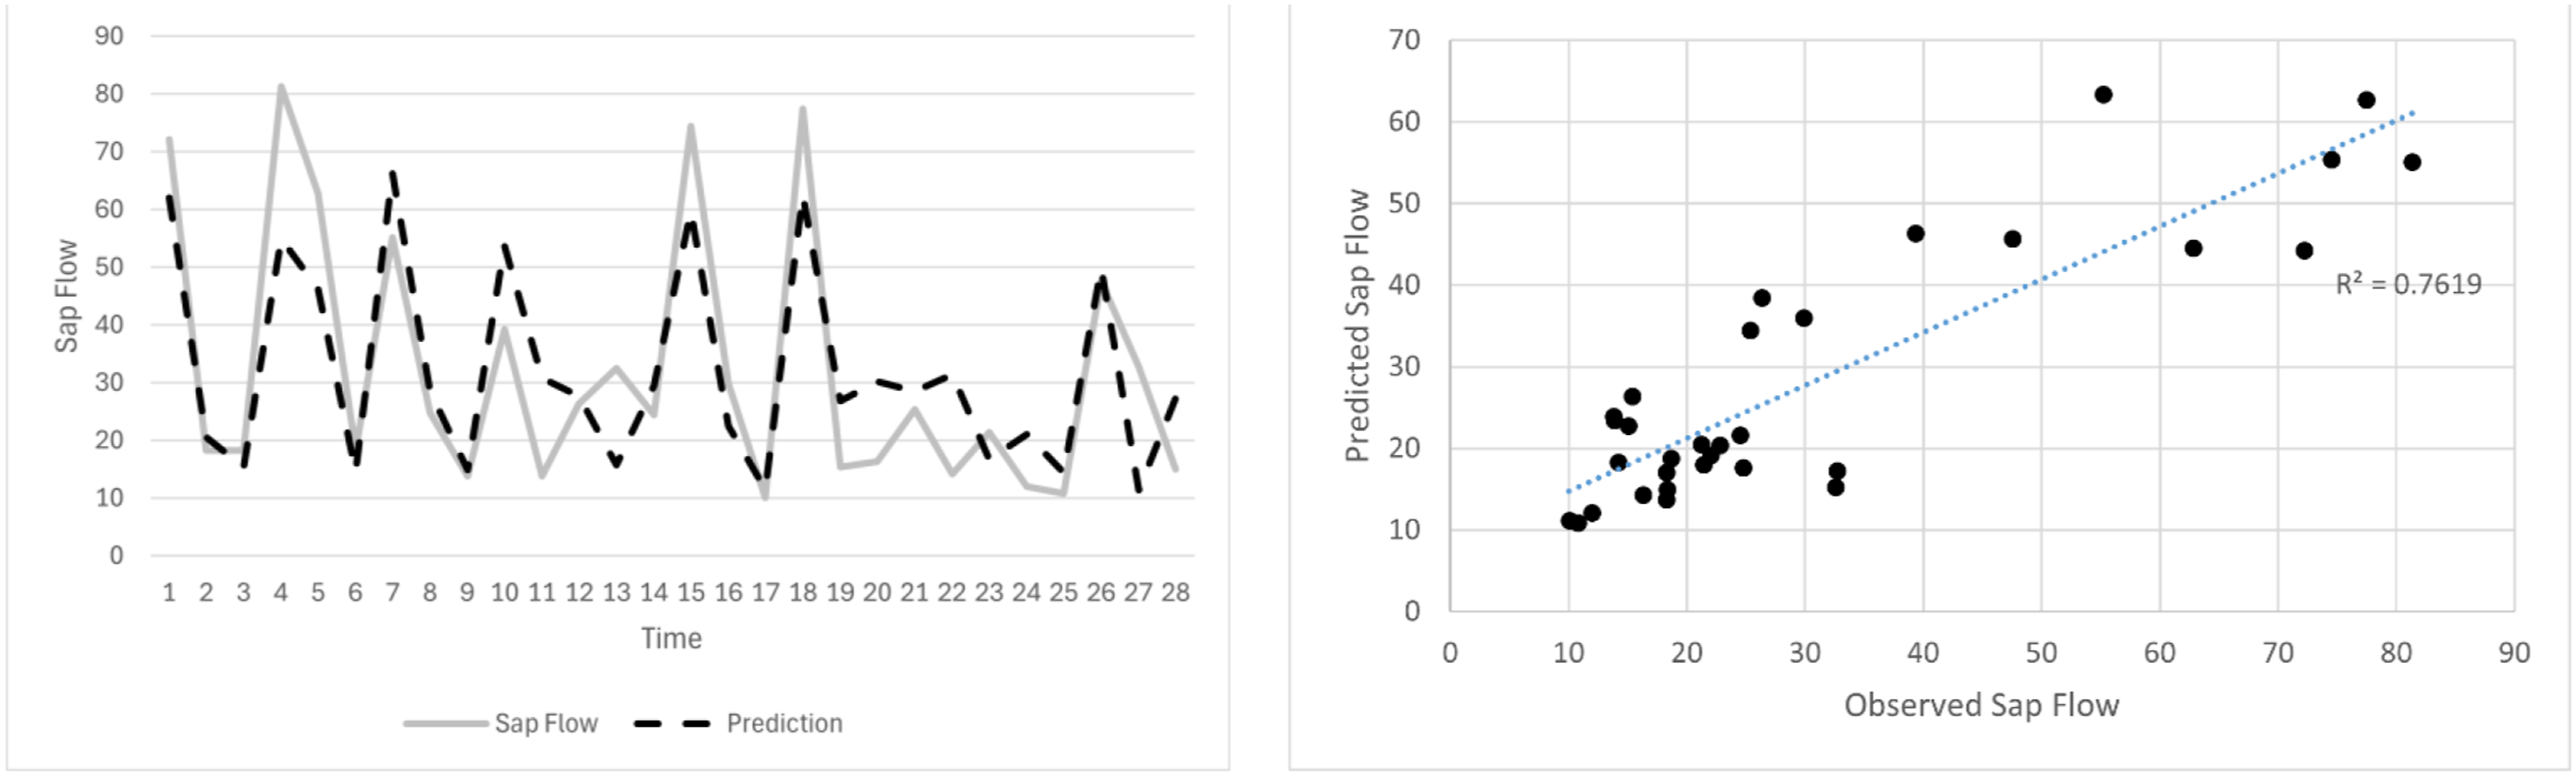
4.5. Variable importance of all environmental variables and sensors tested
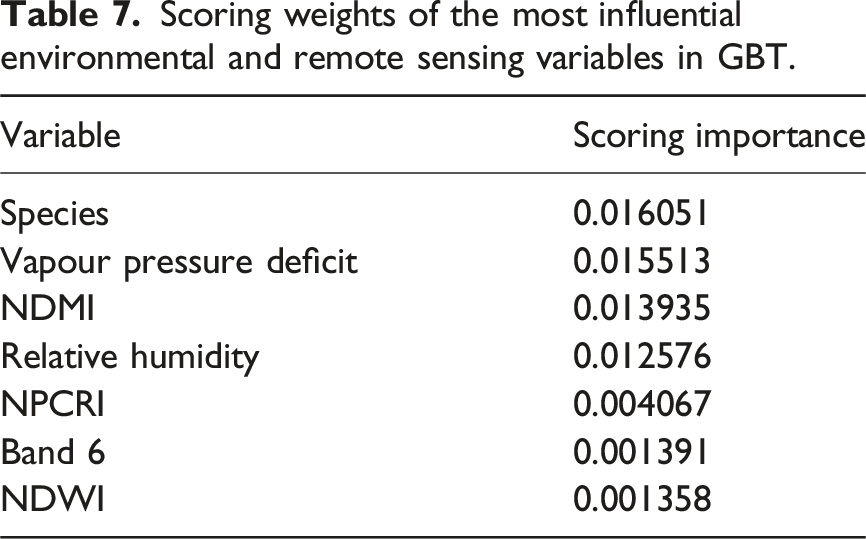
Scoring weights of the most influential environmental and remote sensing variables in GBT.
5. Discussion
This study proved successful in predicting sap flow through measurements using satellite and climatic information. The accuracies of all species were favourable, however, there was a clear higher rate of error amongst the Pinus species in comparison to the indigenous and Eucalyptus species. The advantages of acquiring this information through Landsat 8 images, through predicting forest health in the present, allow for the prediction of possible damage in the future which would aid in management decisions (Drake et al., 2016; Ferreira et al., 2023; Kirilenko and Sedjo 2007; Van der Merwe et al., 2022). However, the lack of image availability due to cloud cover does increase the difficulty of predicting data over the years. Furthermore, sap flow data obtained was measured hourly, scaled up to daily data to match daily images availability of Landsat 8. If remote sensing data can be acquired at least daily for future studies, this could result in a highly detailed analysis of predictive capabilities over time.
5.1. Potential of remote sensing data for determining sap flow velocity
The sap flow data used in this study was acquired from past research that exceeded the archives of image availability of Sentinel-2. Thus, Landsat 8 was the only available remote sensing data that could be acquired, as its image availability reaches back the farthest. The resolution of Landsat data is moderate (30 m), and thus tree level analysis of forest stands is not possible (Brewer et al., 2022; Ferreira et al., 2023; Forkuor et al., 2017). However, as sap flow data acquisition is expensive and difficult to reproduce over an entire forest compartment and sample sites are scattered across forest stands to represent forest health, the relationship between sap flow, Landsat 8 and environmental variables does show a positive outcome for monitoring forest condition and health (Ferreira et al., 2023; Huang and Asner 2009). Nevertheless, the resolution of Landsat did not have an adverse effect on the ability to perform a time series of data, and the prediction of sap flow is still successful.
The results of this study show the potential of using remote sensing data for sap flow prediction in commercial (R2 > 0.90) and ingenious trees (R2 > 0.77) with high accuracy. While the respective studies used other variables to determine sap flow, only a few studies looked at remote sensing data, such as Indices or satellite bands (Hasimoto et al., 2023; Nagler et al., 2007) to improve on sap flow detection. The results obtained using satellite vegetation indices are in line with the above literature proving and alternative methods for further testing of future work.
5.2. Climatic variables for determining sap flow velocity
Of the environmental variables collected from local site weather stations, RH and solar radiation had the highest impact on model scores and sap flow predictions, as the correlation between sap flow changes and solar radiation (which has a significant influence on transpiration rates) is high (Kaptein et al., 2023; Mapeto et al., 2018). Changes in climatic conditions on site may have an adverse impact on water availability, which will impact RH and transpiration (Czimber and Galos 2016; Keskitalo et al., 2016; Mapeto et al., 2018). Thus, measuring these variables for future sap flow predictions may add value to the accuracy of the time series. Finally, GBT performed well within RapidMiner, with an accuracy of R2 = 0.96, RMSE = 6.13 and R2 = 0.97, RMSE = 0.78 for sap flow (when Pinus was removed from time series). Similarly, a study by Aminuddin et al. (2024) also found that GBT to be the better performing algorithm, through testing several machine learning algorithms in RapidMiner and through forecasting robust wind speeds (Aminuddin et al., 2024).
The results of this study show that combining climate variables with remote sensing data can provide a valuable methodology to determine sap flow in tree compartments. The important variables shown in this study have been confirmed to have a strong relationship with sap flow in other studies (Kaptein et al., 2022; Mapeto et al., 2018). However, with the utility of satellite technologies, spatial datasets can now be used over time to enhance ground measurement station data and to predict in areas where there is restricted data available, such as resource-poor countries.
5.3. Monitoring tree health in future studies
This study demonstrated that sap flow can be predicted using tree species, weather data and variables extracted from Landsat imagery. It was demonstrated that the software package RapidMiner was a convenient way to visualize and analyse data. Furthermore, although sap flow is expensive information to gather, when sample stations are spread across forest compartments, ground-based data collected from sap flow stations can continue to be used as reference data to improve the predictive models. Therefore, management and planning can be made easier, when paired with infield data collection. Future research may focus on a comparative analysis of RapidMiner, versus traditional data analysis methods such as R or Python, as well as comparisons across tree species on other sites. This research can benefit the forestry sector, by providing a framework that aids in forest management through monitoring. Predicting canopy moisture status can provide insight into potential risks and provide more information to intervene and apply efficient management tactics. This research can also aid in the analysis of catchment dynamics and landscape ecology, by providing information pertaining to water-use efficiency. Finally, it aids in differentiating between water-use by different species across variable sites.
6. Conclusion
The ability of Landsat 8, paired with RapidMiner and GBT, to predict sap flow over time has made a valuable contribution to tree health monitoring. The most influential variables in predictions were species, and amongst the environmental variables were VPD and RH. As seen with the results, pine species significantly influenced the overall performance of predictions when they were included. The research in this chapter has demonstrated the use of RapidMiner as a tool to provide a quick and efficient analysis of data, as well as to visualize the changes in sap flow over the course of monitoring. Results also suggest that the pine species were the least performing and had the highest variation in sap flow prediction results. The results achieved were favourable; however, more research is required in monitoring and predicting the sap flow of different species through remote sensing.
Nevertheless, the results indicate the usefulness of Landsat 8 in predicting sap flow, which can be valuable for a range of applications in management and decision-making frameworks used in forestry landscapes. This research will contribute to future studies, help refine prediction models, potentially assist with water budgeting and allocation procedures and aid in the health monitoring of commercial forest landscapes.
Footnotes
Acknowledgements
The authors would like to thank Sappi Forests-SA for granting access to the study sites at Shaw Research Centre and excellent working conditions.
Declaration of conflicting interests
The author(s) declared no potential conflicts of interest with respect to the research, authorship, and/or publication of this article.
Funding
The author(s) disclosed receipt of the following financial support for the research, authorship, and/or publication of this article: This study was supported by the National Research Foundation of South Africa (grant number 114898).