
Abstract
Accurate and precise geochronological constraints on marine terrace surfaces are essential for understanding the development of shoreline responses to tectonic uplift and climate change. In particular, high-resolution digital elevation models and numerical dating methods are necessary to establish such constraints on terrace formation. This study aimed to constrain the age of formation of marine terrace T2 in the region around the active Quaternary Eubchun Fault on the eastern coast of the Korean Peninsula. OSL dating and 10Be depth-profile analysis of marine deposits reveal that T2 was abandoned (subaerially exposed) at approximately 71–67 and 62–60 ka, respectively. These age constraints show that the terrace was deposited during a high-sea-level stage (from OSL ages) and subsequently abandoned from 10Be depth-profile age. Through detailed stratigraphic observations combined with the abandonment age, we characterized the process of marine terrace development. In addition, by combining the abandonment age with a high-resolution digital elevation model derived from data obtained from an unmanned aerial vehicle, we determined a precise uplift rate of 0.44 mm/yr. The calculated uplift rate is higher than regional uplift rates (0.2–0.3 mm/yr) and is ascribed to the vertical movement of reactivated Quaternary faults in the study area. In summary, climate forcing led to the formation and abandonment of the terrace, whereas subsequent Late Pleistocene tectonic uplift raised the terrace higher compared with other terraces along the eastern coast of the Korean Peninsula.
Introduction
Marine terraces are formed through the interplay of tectonic activity and changes in sea level throughout the Quaternary period (Lajoie, 1986). Uplift processes driven by tectonic and geodynamic events, including subduction, mantle upwelling, and the thickening of the crust from continental collisions, can align with sea-level fluctuations to create the flat, sloping surfaces characteristic of marine terraces. This phenomenon has been documented in various studies (e.g., Armijo et al., 1996; Jara-Muñoz and Melnick, 2015; Meschis et al., 2020, 2022; Pedoja et al., 2018; Roberts et al., 2013; Saillard et al., 2009). Marine terraces are thus valuable indicators for evaluating Quaternary tectonic uplift (Carobene and Dai Pra, 1991; Leonard and Wehmiller, 1992; Ota et al., 1995; Polenz and Kelsey, 1999). Research conducted on marine terraces in tectonically active regions, such as the Mediterranean Sea, South America, and South Asia (e.g., Cortés et al., 2012; Gharibreza, 2016; Mancini et al., 2007; Mouslopoulou et al., 2015; Regard et al., 2010), has provided valuable insights into the dynamics of the involved tectonic regimes and fluctuations in sea level.
The Korean Peninsula is situated on the eastern Eurasian continental margin and hosts several fault systems. On the southeastern Korean Peninsula, the Yangsan Fault System (YFS) consists of several NNE–SSW-trending faults, including the Yangsan and Ulsan faults (Figure 1). The YFS intersects Mesozoic and Cenozoic rock formations, as well as Quaternary strata, with dextral and reverse kinematics during the Quaternary (Chang et al., 1990; Hwang et al., 2004, 2007). Furthermore, investigations of marine terraces near the eastern YFS have been conducted to understand the interplay between sea-level fluctuation and active tectonics during the late Quaternary (Choi et al., 2008). Field surveys have played a crucial role in defining the paleo-shoreline in the eastern YFS, and various dating methods (Radiocarbon (14C) and Optically Stimulated Luminescence (OSL)) have been utilized to determine the deposition time of Quaternary deposit on marine terraces (Choi, 2019, and compiled references therein). The results from field investigations and chronological analyses significantly contribute to uncovering whether tectonic movements during the late Quaternary played an important role in the marine terraces on the eastern Korean Peninsula (Kim, 1973; Oh, 1981) or sea-level fluctuation primarily influenced (Lee, 1985). Maps of the study area. (a) Satellite image of the eastern coast of the Korean Peninsula (from Google Earth). Green circles: Previous terrace studied localities; AYJ: Ayajin; AI: Anin; JDJ: Jeongdongjin; JB: Jukbyun; DB: Daebo; YN: Yangsan; White circles: reported active fault localities; YSF: Yangsan Fault system; USF: Ulsan Fault. (b) Satellite image of the study area superimposed on a shaded relief map. (c) Terrace mapping of the study area (modified from Kwon et al., 2022). For interpretation of the references to colours in this figure legend, refer to the online version of this article.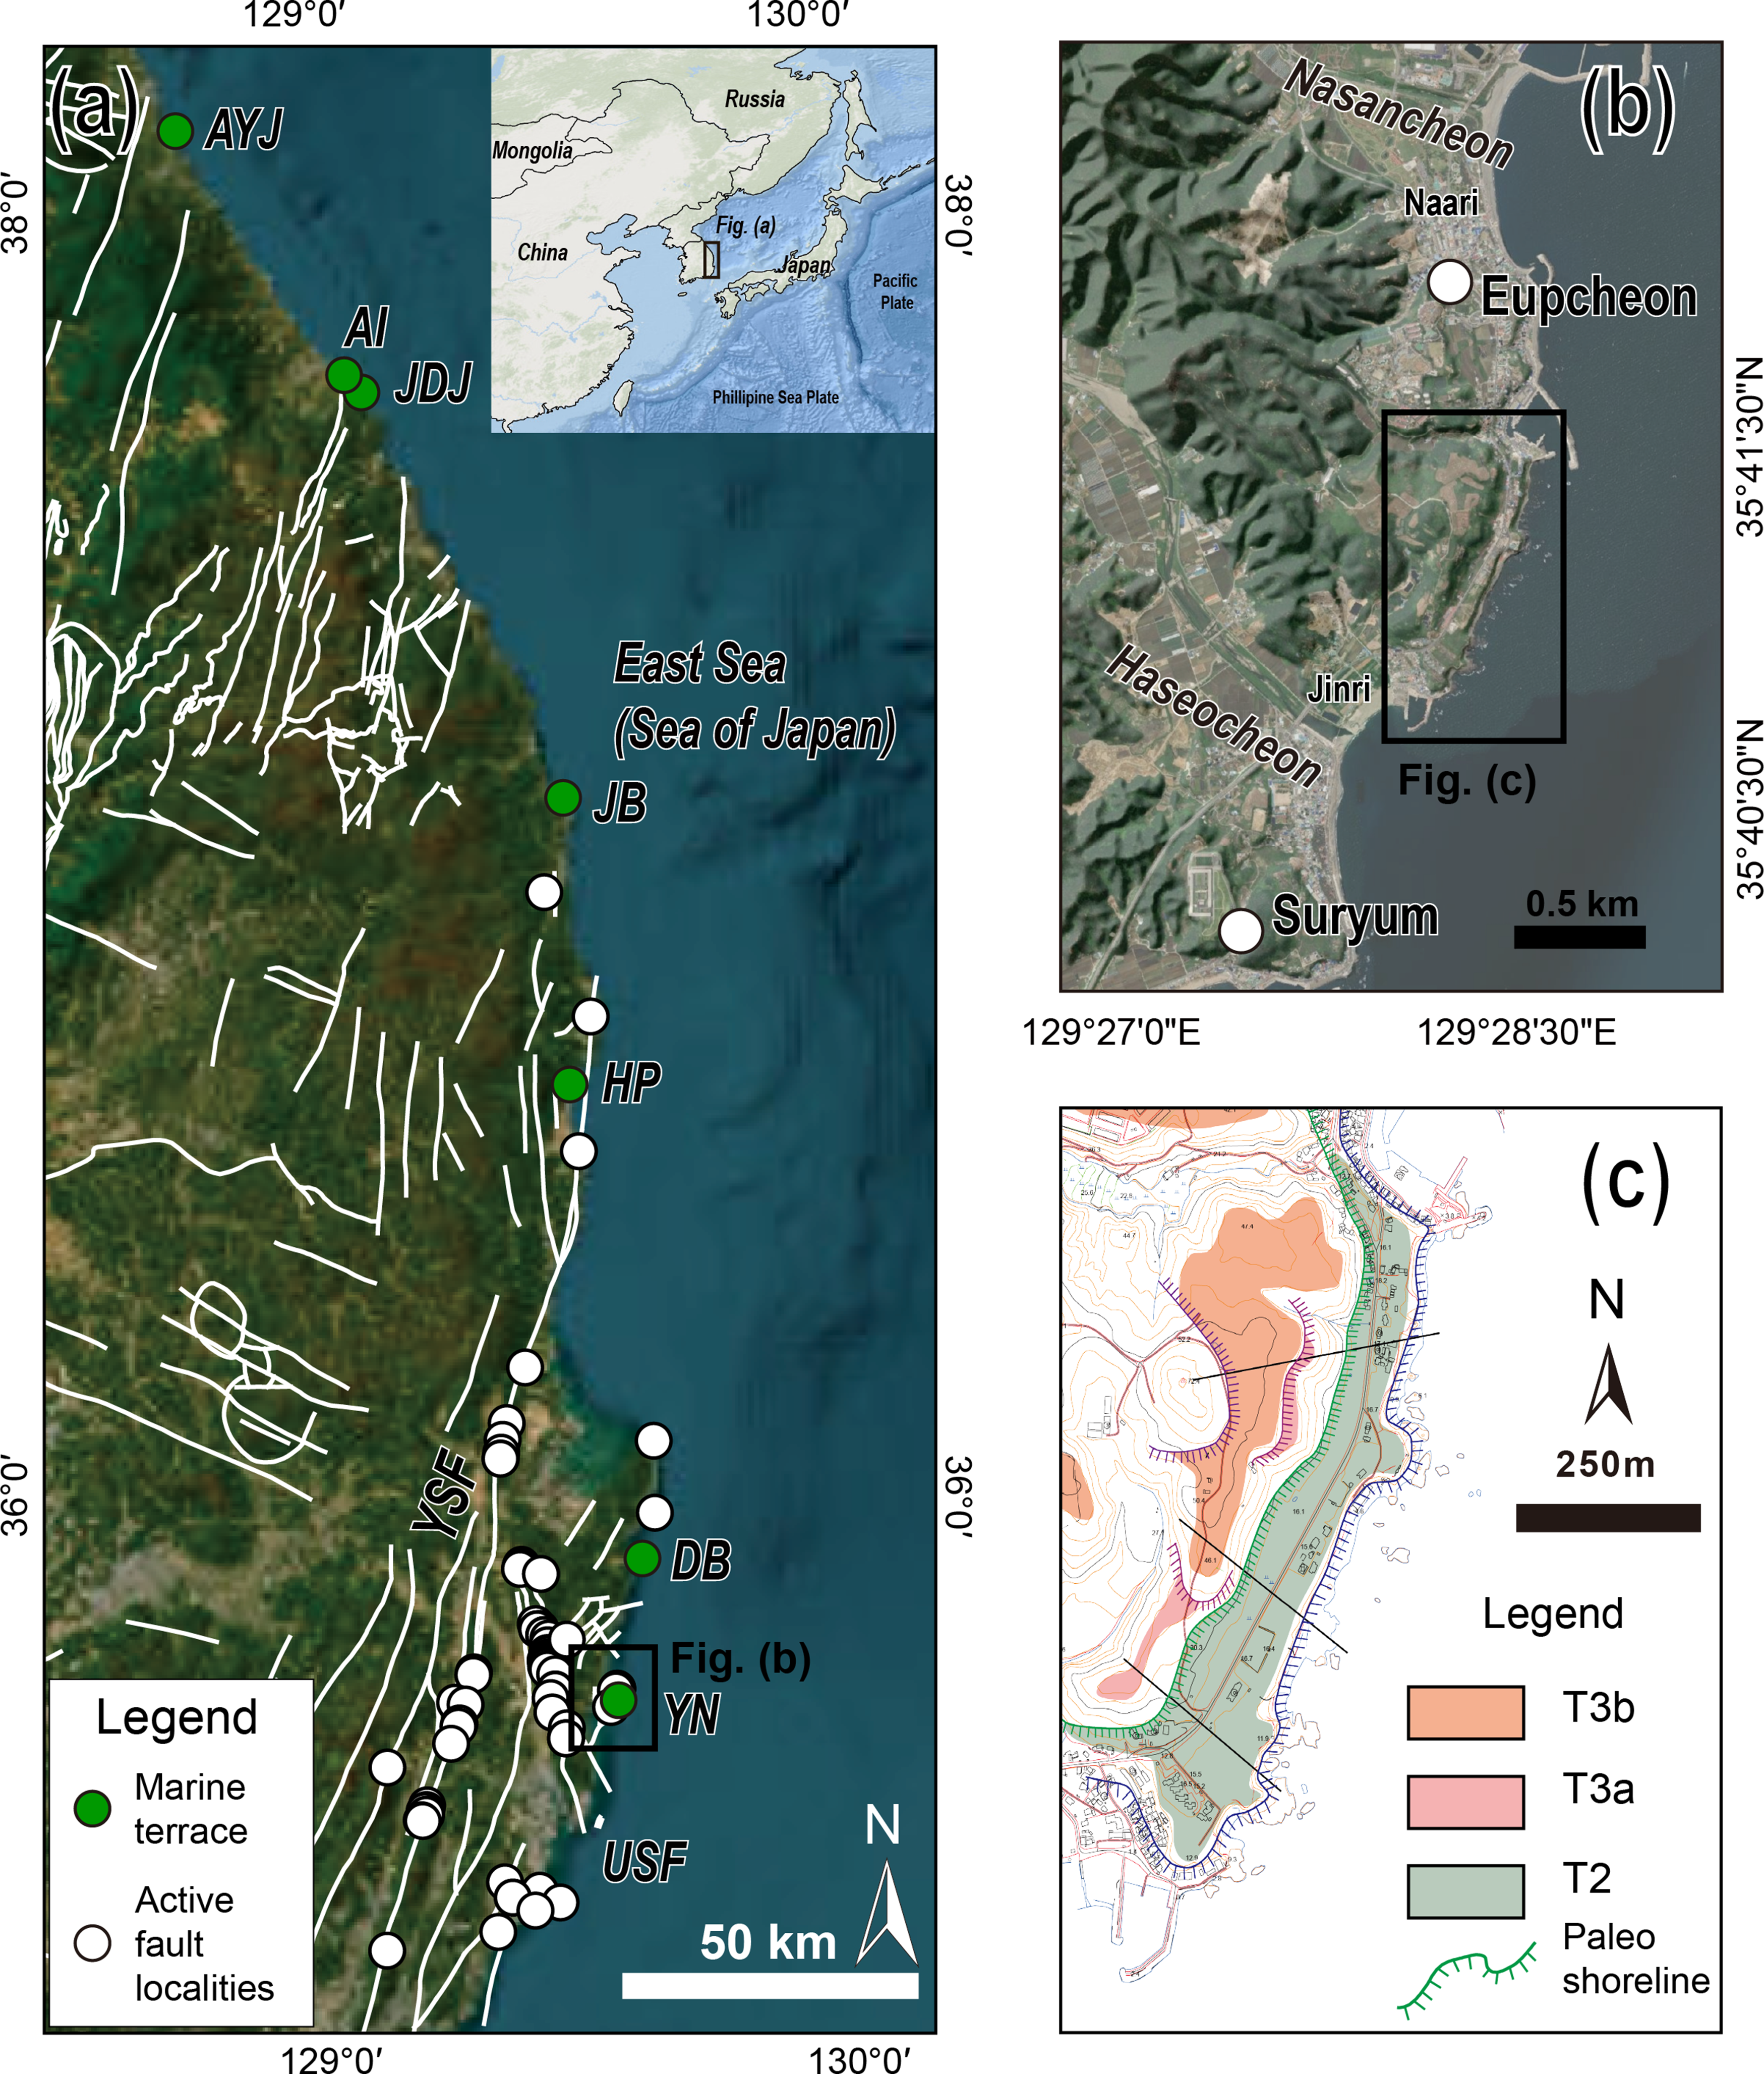
Well-preserved terraces may record information on uplifted height from paleo sea level (L) and the time of abandonment (T), which is used to determine uplift rate (L/T). While previous research in the southeastern Korean Peninsula has identified four or five marine terraces, suggesting a various range of ages for these formations (Choi, 2019, and references therein), the precise elevation of the morphological mapping such as inner or outer edge of these marine terraces along the eastern coast remains undetermined, largely due to urban development. This gap underscores the need for more detailed studies that can bridge the existing knowledge on both the chronological and morphological aspects of terrace. In our study area (Yangnam site), five terraces (T1, T2, T3, T4, and T5 from young/low to old/high) have been mapped via field survey by handheld GPS or profile by total station (Choi et al., 2003; Kim et al., 2007). Chronological measurement such as OSL has been conducted solely to determine the most recent earthquake of Quaternary fault (Eupcheon Fault) at T3 terrace level (Kee et al., 2007). The age derived from OSL helps determine the timing of the sedimentation; however, it assumed the deposit occurred simultaneously. Hence, to accurately determining the uplift rate, the abandonment age of terrace once separated from the sea and constructing a detailed DEM of the area through advanced remoting sensing technology are essential.
In this study, we aim to present the first-ever dating of the abandonment age of the T2. We used OSL dating and 10Be depth profiling to determine the abandonment age of the T2 tread surface. Furthermore, we have employed a comprehensive remote sensing analysis to detect the paleo-shoreline over broad area by utilizing a high-resolution digital surface model (DSM) constructed using data obtained from an unmanned aerial vehicle (UAV). Using this dual approach, we propose a late Quaternary uplift history for the study area. By compiling results of previous studies conducted in the vicinity of the study area, we compare the local uplift rate with the regional uplift rate (Choi, 2019, and compiled references therein). The findings of this study provide a better understanding of the influence of climate-related sea-level change and tectonic activity on the formation of late Quaternary marine terraces and further constrain the spatio-temporal uplift history of the southeastern Korean Peninsula.
Study area
Geologic setting
The southeastern Korean Peninsula has been characterized by substantial NNW–SSE dextral strike-slip movement influenced by expansion of the East Sea during the Miocene (Son et al., 2013, and references therein). The YFS contains several structures (the Yangsan fault, Ulsan fault, and border faults of Miocene sedimentary basins (Yeonil Tectonic Line)), having undergone four main phases of activity since the Cretaceous: (1) During the Late Cretaceous, sinistral slip faulting was accompanied by extensional deformation under a NW–SE compressional regime; (2) during the late Paleogene, intense dextral slip faulting occurred under a regional NE–SW compressional regime; (3) during the Middle Miocene, a period of weak sinistral slip faulting took place with compression-directed NNW–SSE; and (4) during the Quaternary, dextral slip with a reverse component occurred under ENE–WSW to E–W compression (Cheon et al., 2020, and references therein). The Yangsan fault represents the dextral strike slip fault and reactivated during the Quaternary. The Yeonil Tectonic line represents the western boundary fault of Miocene crustal deformation (Son et al., 2013); however, no evidence of the Quaternary activity has been associated with it. The Ulsan fault is an active reverse fault under the current stress regime (Cheon et al., 2023).
In the Haseo Basin, one of several Miocene pull-apart sedimentary basins on the southeastern Korean Peninsula, dextral strike-slip faults oriented NNW–SSE or N–S occur, alongside normal faults oriented NE–SW (Figure 1). The Haseo Basin is divided into two sub-basins (northeast and southwest) by the Haseo fault (Yoon et al., 2014). The basement rock in this basin consists primarily of the Ulsan Formation of the Gyeongsang Supergroup, together with granite. Numerical dating results have revealed that the granite was emplaced during the early Cenozoic (60–40 Ma) (Kim et al., 1995). The basin fill can be categorized into three units: the Hyodongri Volcanics, the Sinseori Formation, and the Hwanseori Formation in ascending stratigraphic order (Yoon et al., 2014). The Hyodong-ri volcanic rocks are composed of dacitic or andesitic volcanic rocks, with the Sinseori Formation consisting of various clastic sedimentary rocks, including conglomerate, sandstone, and mudstone (Yoon et al., 2014). Andesite from the Hyodongri Volcanics in the Eoil area has yielded an age of 24.0 ± 0.3 Ma using the Ar/Ar method (Kim et al., 2005). The upper dacite tuff has been reported with a fission-track age of 21.6 ± 1.4 Ma (Shin, 2013). The Sinseori and the Hwanseori formations are distinct from the Beomgokri Group and the Janggi Group, respectively (Yoon et al., 2014).
Geomorphic setting
Since Kim (1973) initiated research on marine terraces of the Korean Peninsula, various studies have been conducted to examine their distribution and characteristics. Choi (1993) shifted the focus to determining the age of formation and understanding the subsequent developmental processes by employing numerical dating methods. This shift sparked a growing scientific interest in the rate of uplift, particularly in relation to the selection of sites for nuclear power plants. As a result, numerous studies of uplift rate of marine terrace have been conducted, primarily along the eastern coast of the Korean Peninsula (e.g., Jeongdongjin, Ayajin, and Yangnam). The introduction of dating techniques such as OSL has played an important role in investigations into the formation age/period of marine terraces. OSL dating has been performed on samples from sedimentary layers on marine terraces at a total of 35 locations, including a comprehensive analysis of 87 samples obtained from 16 specific points on the east coast of the Korean Peninsula (Hong, 2018; Hong and Oh, 2024).
The study area is located in Yangnam, Gyeongju, and extends from Naari to Jinri (Figure 1). Several flights of marine terraces are located behind Eupcheon Port. Nasancheon (stream) in the northern part of the study area and Haseocheon (stream) in the southern part of the study area flow NW–SE and have deposited abundant sediments onto the marine terraces. In the Nari area, the Quaternary Eupcheon Fault strikes NE–SW (Chwae et al., 1998; Kee et al., 2007; Lee et al., 1999). The Eupcheon Fault is exposed at an elevation of 35 m above sea level (a.s.l.) and is categorized as a reverse fault with a strike of N15°E and a dip of 45°SE. The period of fault activity has been reported as from 250 to 30 ka (Chwae et al., 1998; Kee et al., 2007; Lee et al., 1999). Vertical displacements indicate a vertical slip rate of between 0.024 and 0.2 mm/yr over 250 to 30 ka (Lee et al., 1999).
10Be Depth-profile Results.
Methods
Field observations and mapping
Outcrops of marine terrace deposits, which are crucial for identifying sedimentary layers, are highly limited due to vegetation cover and human-induced destruction of landforms. Following a previous study that focused on the sedimentary section of T2 (Lee et al., 2013), a field survey was conducted during the present study to identify newly exposed sedimentary sections of T2 within the study area, describe the composition and characteristics of the strata, and infer the sedimentary environment.
Data acquisition
The survey and mapping utilized a Trimble R8s GNSS receiver, which has a manufacturer-specified maximum positional error of 8 mm horizontally and 15 mm vertically. These error margins were deemed negligible for the purposes of this study. For quantitative morphological analysis of T2 surveyed during fieldwork, a UAV (Phantom 4 RTK) was used to capture orthographic images of the survey area, which allowed point cloud data to be obtained. More specific process is followed by Figure 2. Conceptual framework for data acquisition with UAV.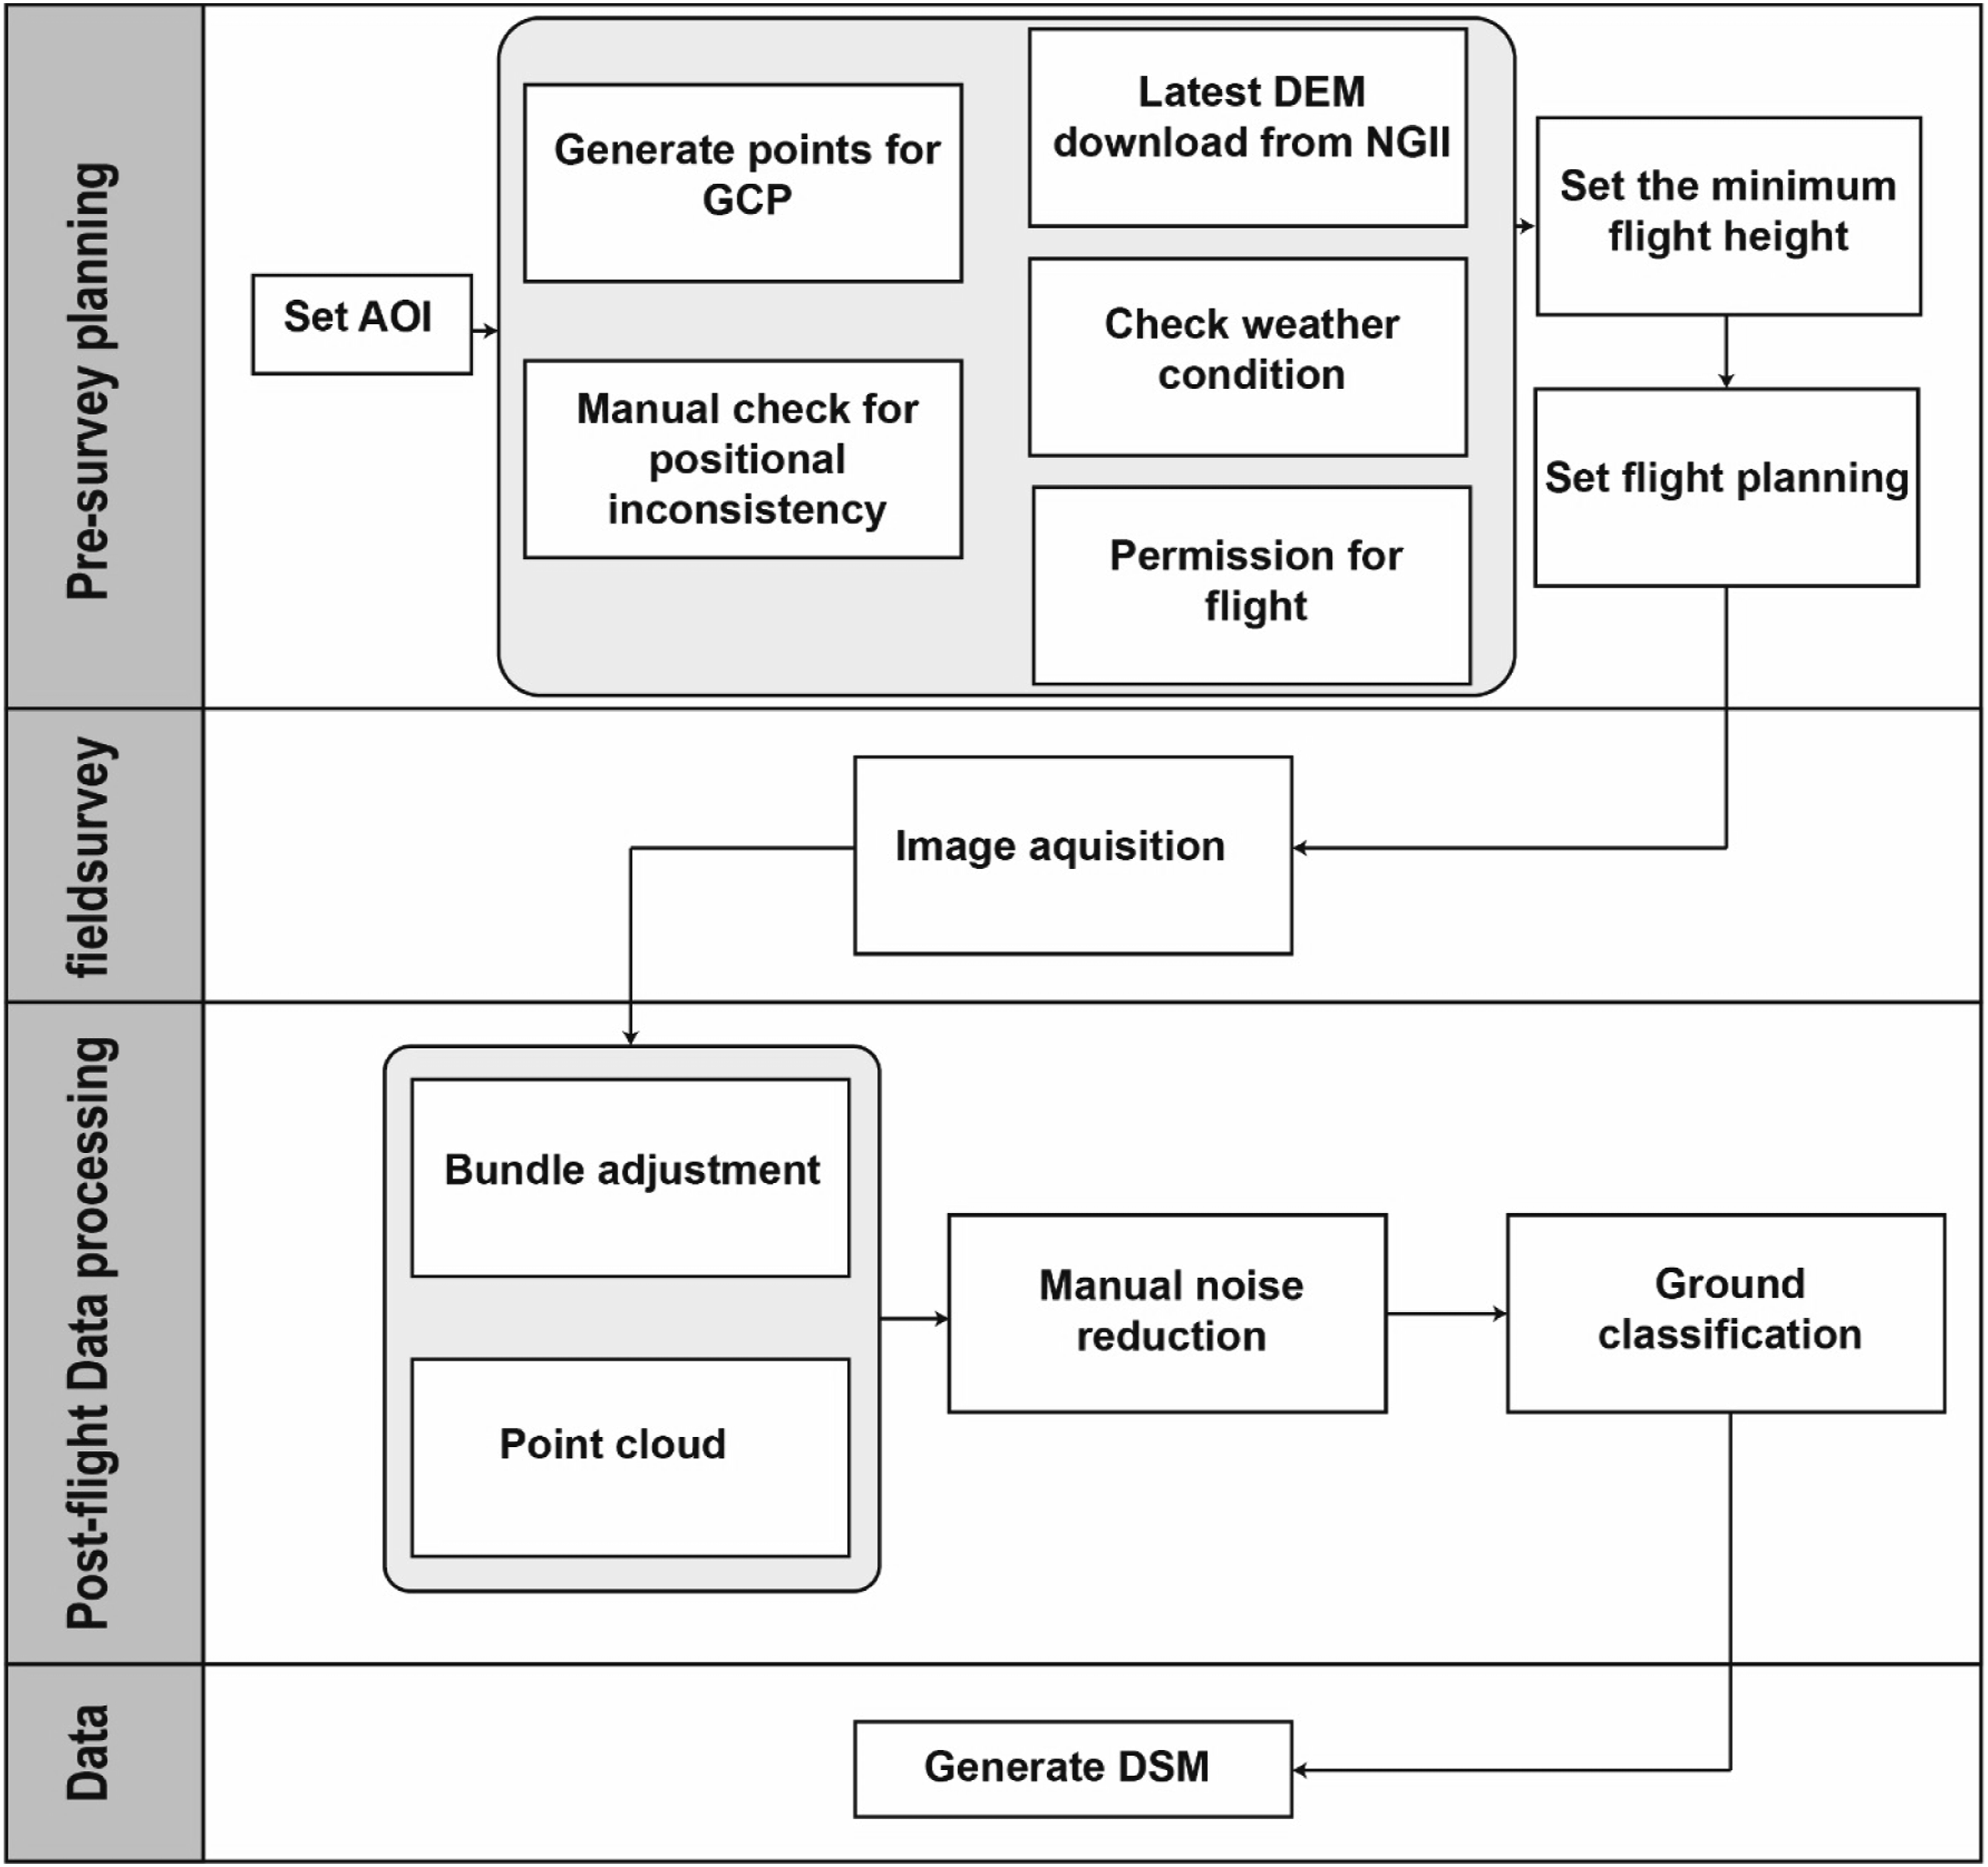
The study area was surveyed during a single field campaign in September 2021, after the rainy season and the typhoon. To mitigate distortions caused by the fish-eye lens, we utilized the highest camera resolution available. We planned three flights with overlapping paths to comprehensively cover the entire study area. A fishnet pattern in our flight plan resulted in reducing systematic errors. Flight parameters were set at an average flight speed of 10–12 m s−1 and a constant altitude of 150 m above ground level. Each flight lasted approximately 20 minutes, obtaining an overlap of 70 % between consecutive images. The flight missions were executed using the GS RTK application on Android platform. A total of 915 images were captured during the survey.
Subsequently, the point cloud data were used to generate a digital surface model (DSM) using the software program Metashape, version 1.7.4 (Agisoft). The distribution and morphology of T2 in the survey area were quantified by combining the results of the field survey and DSM data.
OSL dating
For OSL analysis, we collected a total of four samples from T2. To determine the formation age of T2, samples were collected from various depths of the terrace deposits: two from 50 cm to 80 cm above the basalt forming the terrace base, and two from the upper and lower sections of a gravel layer, ranging from 40 to 70 cm in depth, at the top of the terrace. All samples were collected using stainless steel tubes (30 cm in length and 5 cm in diameter). Subsequently, the collected samples were transferred to a subdued red-light laboratory at the Korea Institute of Geoscience and Mineral Resources (KIGAM), where all preprocessing procedures were conducted. The outer 3 to 5 cm sediments from both ends of the sampling tubes, which were potentially exposed to light during collection and thus considered bleached, were removed under darkroom conditions and used for dose-rate analysis. Additionally, approximately 5 cm of sediment from the central portion of each sampling tube was extracted for water content measurement. After removing sections for dose-rate and water content measurements, only the remaining ∼15 cm of sediment from the inner portion of the sampling tube was used for equivalent dose (De) determination. In this study, both coarse-grained (90–250 ㎛) and fine-grained (4–11 ㎛) fractions were separated for De measurement. First, coarse-grained quartz was separated by wet sieving using standard sieves, isolating particles smaller than 90 ㎛ and those between 90 and 250 ㎛. Subsequently, the separated 90–250 ㎛ particles were treated with 10% HCl for 3 hours and 33% H2O2 for 1 hour to remove carbonate minerals and organic matter, respectively. Additionally, minerals with a density greater than 2.62 g/cm3 were separated using heavy liquid (sodium polytungstate, SPT). The separated minerals were then treated with 48% HF for 1 hour to remove all minerals except quartz, including the outer alpha irradiated rims on quartz grains, and finally, fluoride compounds were removed with 35% HCl for 1 hour (Choi et al., 2004). Next, to isolate fine-grained quartz, particles under 90 ㎛ previously separated were sorted into sizes between 4 and 11 ㎛ using Stoke’s law of settling method. These particles were then treated with 10% HCl and 33% H2O2 for 2 days each, followed by a 14-day treatment with 40% H2SiF6 to obtain pure fine-grained quartz particles (Roberts, 2007).
All procedures associated with infrared (IR) test, preheat plateau test, dose recovery test, and De measurement were conducted using a Risø TL/OSL automatic reader (TL/OSL-DA-20) installed at KIGAM. This reader includes a 90Sr/90Y beta source with 0.096 Gy/s (for coarse-grained sample) and 0.090 Gy/s (for fine-grained sample) to the sample position. OSL signals were generated by stimulation with blue LEDs (470 ± 20 nm) and captured using an EMI-9635Q photomultiplier tube through a U-340 5.0 mm + 2.5 mm Hoya glass filter. The separated coarse and fine quartz grains were mounted onto 9.7 mm diameter stainless steel discs using silicone oil.
De values were determined utilizing the single-aliquot regenerative (SAR) dose protocol (Murray and Wintle, 2000). Prior to De measurement, IR test (feldspar contamination test), preheat plateau, and dose recovery tests were conducted on both coarse and fine quartz samples (Duller, 2003; Wintle and Murray, 2006). De measurements were performed on at least 12 aliquots per sample, and an exponential function was used to fit the dose-response curve. Aliquots were considered valid when the recycling ratio was below 10% and recuperation was under 5%. When the De value exceeded the 2D0 (characteristic dose) value (De > 2D0), it was assumed that over 86.4% of the traps in the quartz lattice defects were saturated (Wintle and Murray, 2006). Under these conditions, we did not calculate the ages. All De values were determined using the central age model (CAM), with all uncertainties presented as 1σ standard errors (Galbraith et al., 1999). Dose rates for the samples were calculated through radioactive measurements using a Broad Energy Germanium Detector (BE6530) gamma-ray spectrometer system, installed at KIGAM. The dose rate conversion factors and contributions from cosmic rays were obtained from Prescott and Hutton, (1994) and Olley et al. (1996), respectively. This study utilized a mean alpha-value of 0.04 ± 0.02 for fine-grained quartz and a beta attenuation factor of 0.88 ± 0.04 for coarse-grained quartz (Mejdahl, 1979). Data reduction was conducted using Analyst 4.57 (Duller, 2018).
10Be depth profiling
The application of cosmic-ray-derived radioactive isotopes to scientific problems has been significantly enhanced over time and is now routinely used to determine the ages of different parts of Earth’s surface and deposition ages of sediment. This method has been widely used to gain insights into the timing of formation of topography, its evolution, and the processes involved (e.g., Bierman et al., 2021; Cockburn and Summerfield, 2004; Gosse and Phillips, 2001). Although this dating method has been applied in numerous geomorphologic studies (Binnie et al., 2016; Robertson et al., 2019, 2020, 2023; Vergara et al., 2024), only limited instances of research involving cosmic-ray-induced radioactive isotopes have been conducted in South Korea.
Beryllium-10, usually referred to as 10Be, is continually generated when the target mineral, such as SiO2, is exposed to cosmic rays. Typically, the production of 10Be decreases exponentially with increasing depth from the surface and becomes negligible at approximately 2 m depth. The depth-profile dating method, which involves the measurement of 10Be content within sedimentary layers at different depths, employs inverse modeling equations to determine the exposure time of the top (surface) of the uppermost layer. Given that the present (uppermost) sedimentary layer represents the final site of sedimentary deposition, it may contain inherited 10Be. This method allows the age of abandonment of the sedimentary top surface to be determined after compensating for inherited isotopes.
In this study, we utilized the 10Be depth-profile method to estimate the abandonment of T2 sediments. To identify appropriate sampling locations, a field survey was conducted to identify outcrops where the original surface was relatively well preserved. Samples were obtained at site 2 at depths of 40, 60, 80, and 120 cm from the surface. The 0 cm (surface) level was excluded from sampling, as the original topography was considered poorly preserved. Samples could not be collected at depths greater than 120 cm because of slope collapse (Figure 3c). Field observations and high-resolution DSM from UAV capture. (a) DSM and map of terrace geomorphology in the study area. (b) Outcrop photograph of the margin (foreshore) of T2 (Site 1). (c) Outcrop photograph of the side of T2 (Site 2). (d) Oblique view of T2 captured by the UAV. Cross-section results are further discussed in Figure 8 (Discussion section). For interpretation of the references to colours in this figure legend, refer to the online version of this article.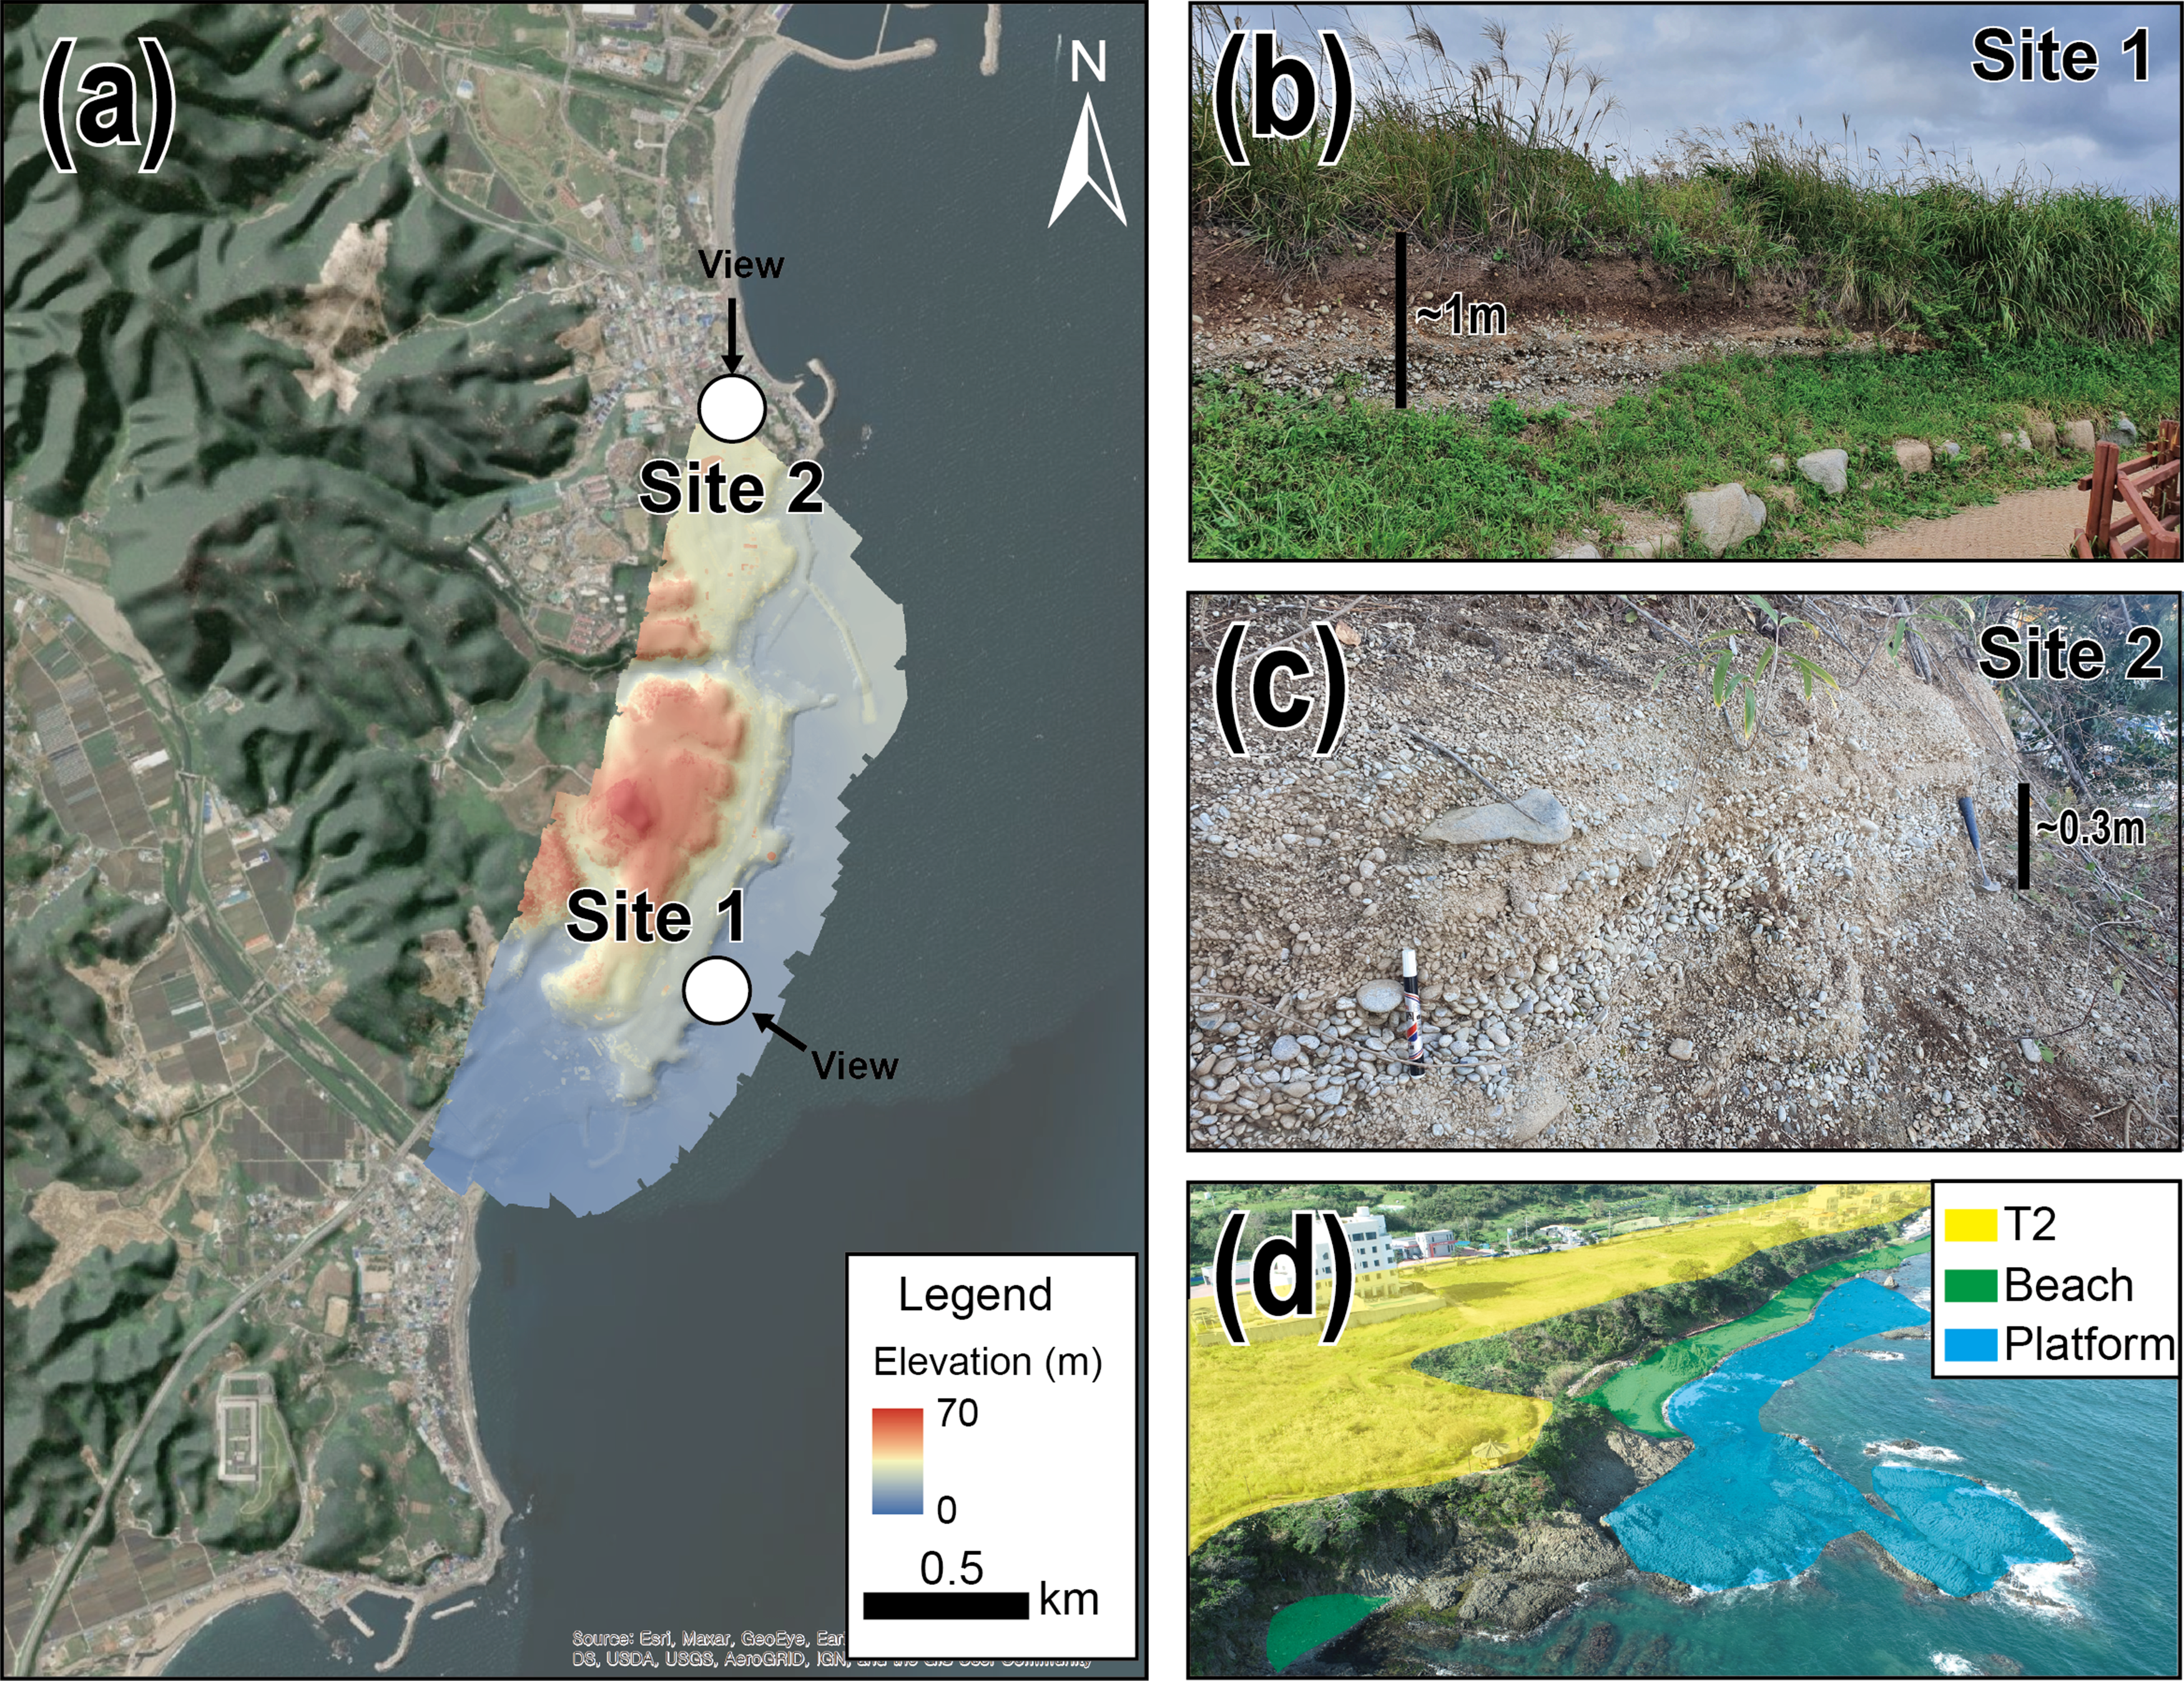
The sampling process involved three main steps. The first step, which was conducted at the KIGAM, involved crushing the collected samples to a size range of 250–500 µm. In the second step, eliminating minerals other than quartz, as well as removing 10Be formed in the air and organic matter which was conducted at the Future Land Research Institute of Korea University, Seoul, South Korea, after obtaining pure quartz, a chemical pretreatment process was applied to extract only 10Be from the quartz. In the third and final step, which was conducted at the Korea Institute of Science and Technology (KIST), Seoul, South Korea, measurements of 10Be were performed using an accelerator mass spectrometer.
Results
Field observations and mapping
By synthesizing 900 photographs taken using the Phantom 4 RTK drone, we generated a foreground image (orthomosaic image) and a DSM of the study area using Metashape version 1.7.4 (Agisoft). The spatial resolution of the orthographic image in the study area is 3.63 cm/pixel, whereas the spatial resolution of the DSM is 7.26 cm/pixel (Figure 3a).
For T2, our observations revealed cyclic layers of coarse gravel and pebbles, indicating vertical repetition of sedimentary units (Figure 3b and 3c). A detailed illustrative representation of these sedimentary units can be found in Figure 4d. These interlayers are mostly clast supported. We conducted a field survey focusing on two sites. The sedimentary layers at site 1 span a total thickness of approximately 180 cm and can be divided into only four distinct horizontal sedimentary units. Unfortunately, we didn’t see the boundary between bedrock and Quaternary layers because the site becomes a preservation area (Figure 3b). The uppermost layer corresponds to the soil layer and measures ∼40 cm in thickness. Beneath the uppermost layer is a well-sorted layer composed of small, well-rounded pebbles of <1 cm in size with clast-supported matrix and no imbrication. The underlying unit comprises a layer consisting of larger cobbles and coarse sand, locally interspersed with patches of sand with clast-supported matrix. The cobbles are well rounded, with dominant disk-like shapes. Below this unit, another layer of small pebbles is observed; these are also well rounded and well sorted. Based on previous research in other region (Buscombe and Masselink, 2006; Gupta and Allen, 1999) and in nearby areas (Lee et al., 2013), we can infer that the sedimentary layers below the soil layer likely result from the repeated deposition of fine gravel induced by wave action within a foreshore environment. Results of OSL dating and 10Be depth-profile analysis at Site 2. (a) Outcrop photograph of the sampled 10Be profile; (b) outcrop photograph showing 10Be profile sample positions; (c) 10Be content as a function of terrace depth for the studied T2 sediment profile; (d) OSL ages for the studied T2 sediment profile (modified from Lee et al., 2013). For interpretation of the references to colours in this figure legend, refer to the online version of this article.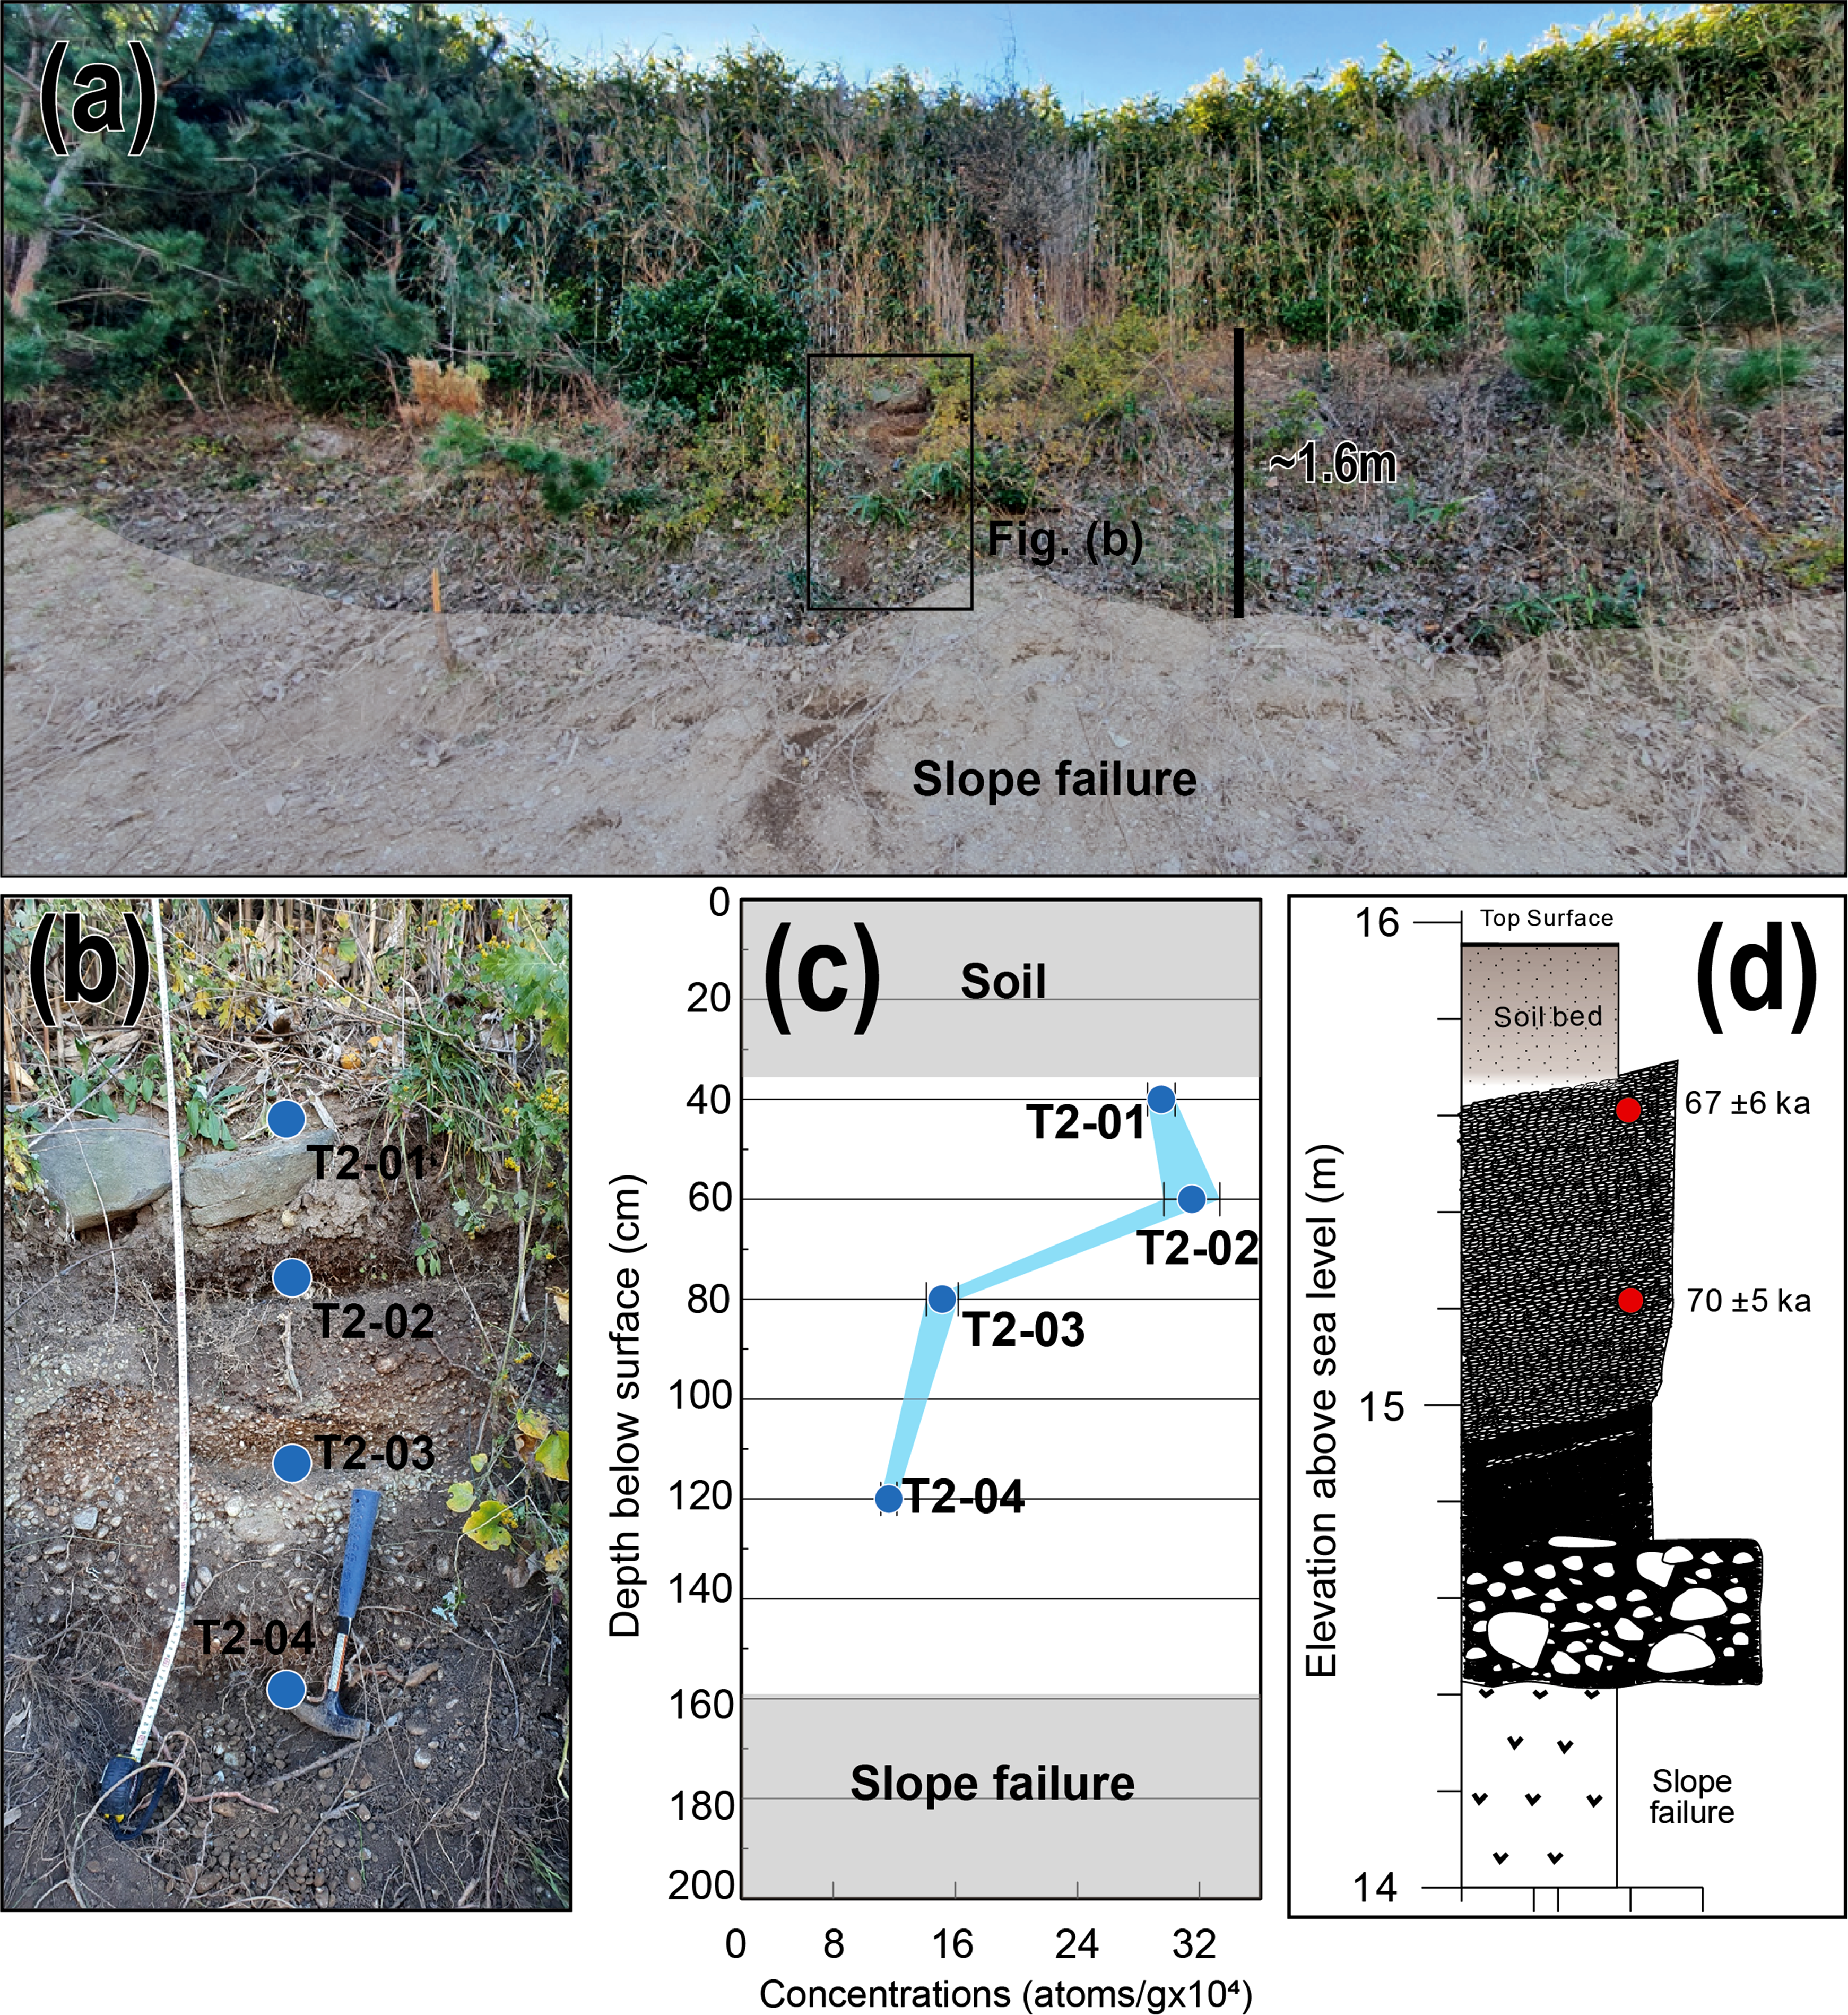
We can find several layers at site 2 due to slope failure. The layers can be divided into four sedimentary units (Figure 4d). The uppermost layer is soil layers with ∼40 cm of thickness. Beneath the uppermost later consists of pebble to granule of <2 cm in size with clast-supported matrix and no imbrication. The underlying unit comprises pebble of several centimeters and boulders of ∼30 cm in size were observed. These boulders are scattered in patches within coarse sand and are arranged in a clast-supported matrix. The bottom layer consists of pebble to granule of <2 cm in size with clast-supported matrix and no imbrication. Following the criteria for site 1, this sedimentary layer can be interpreted as having been deposited in the backshore or stream environment.
OSL ages
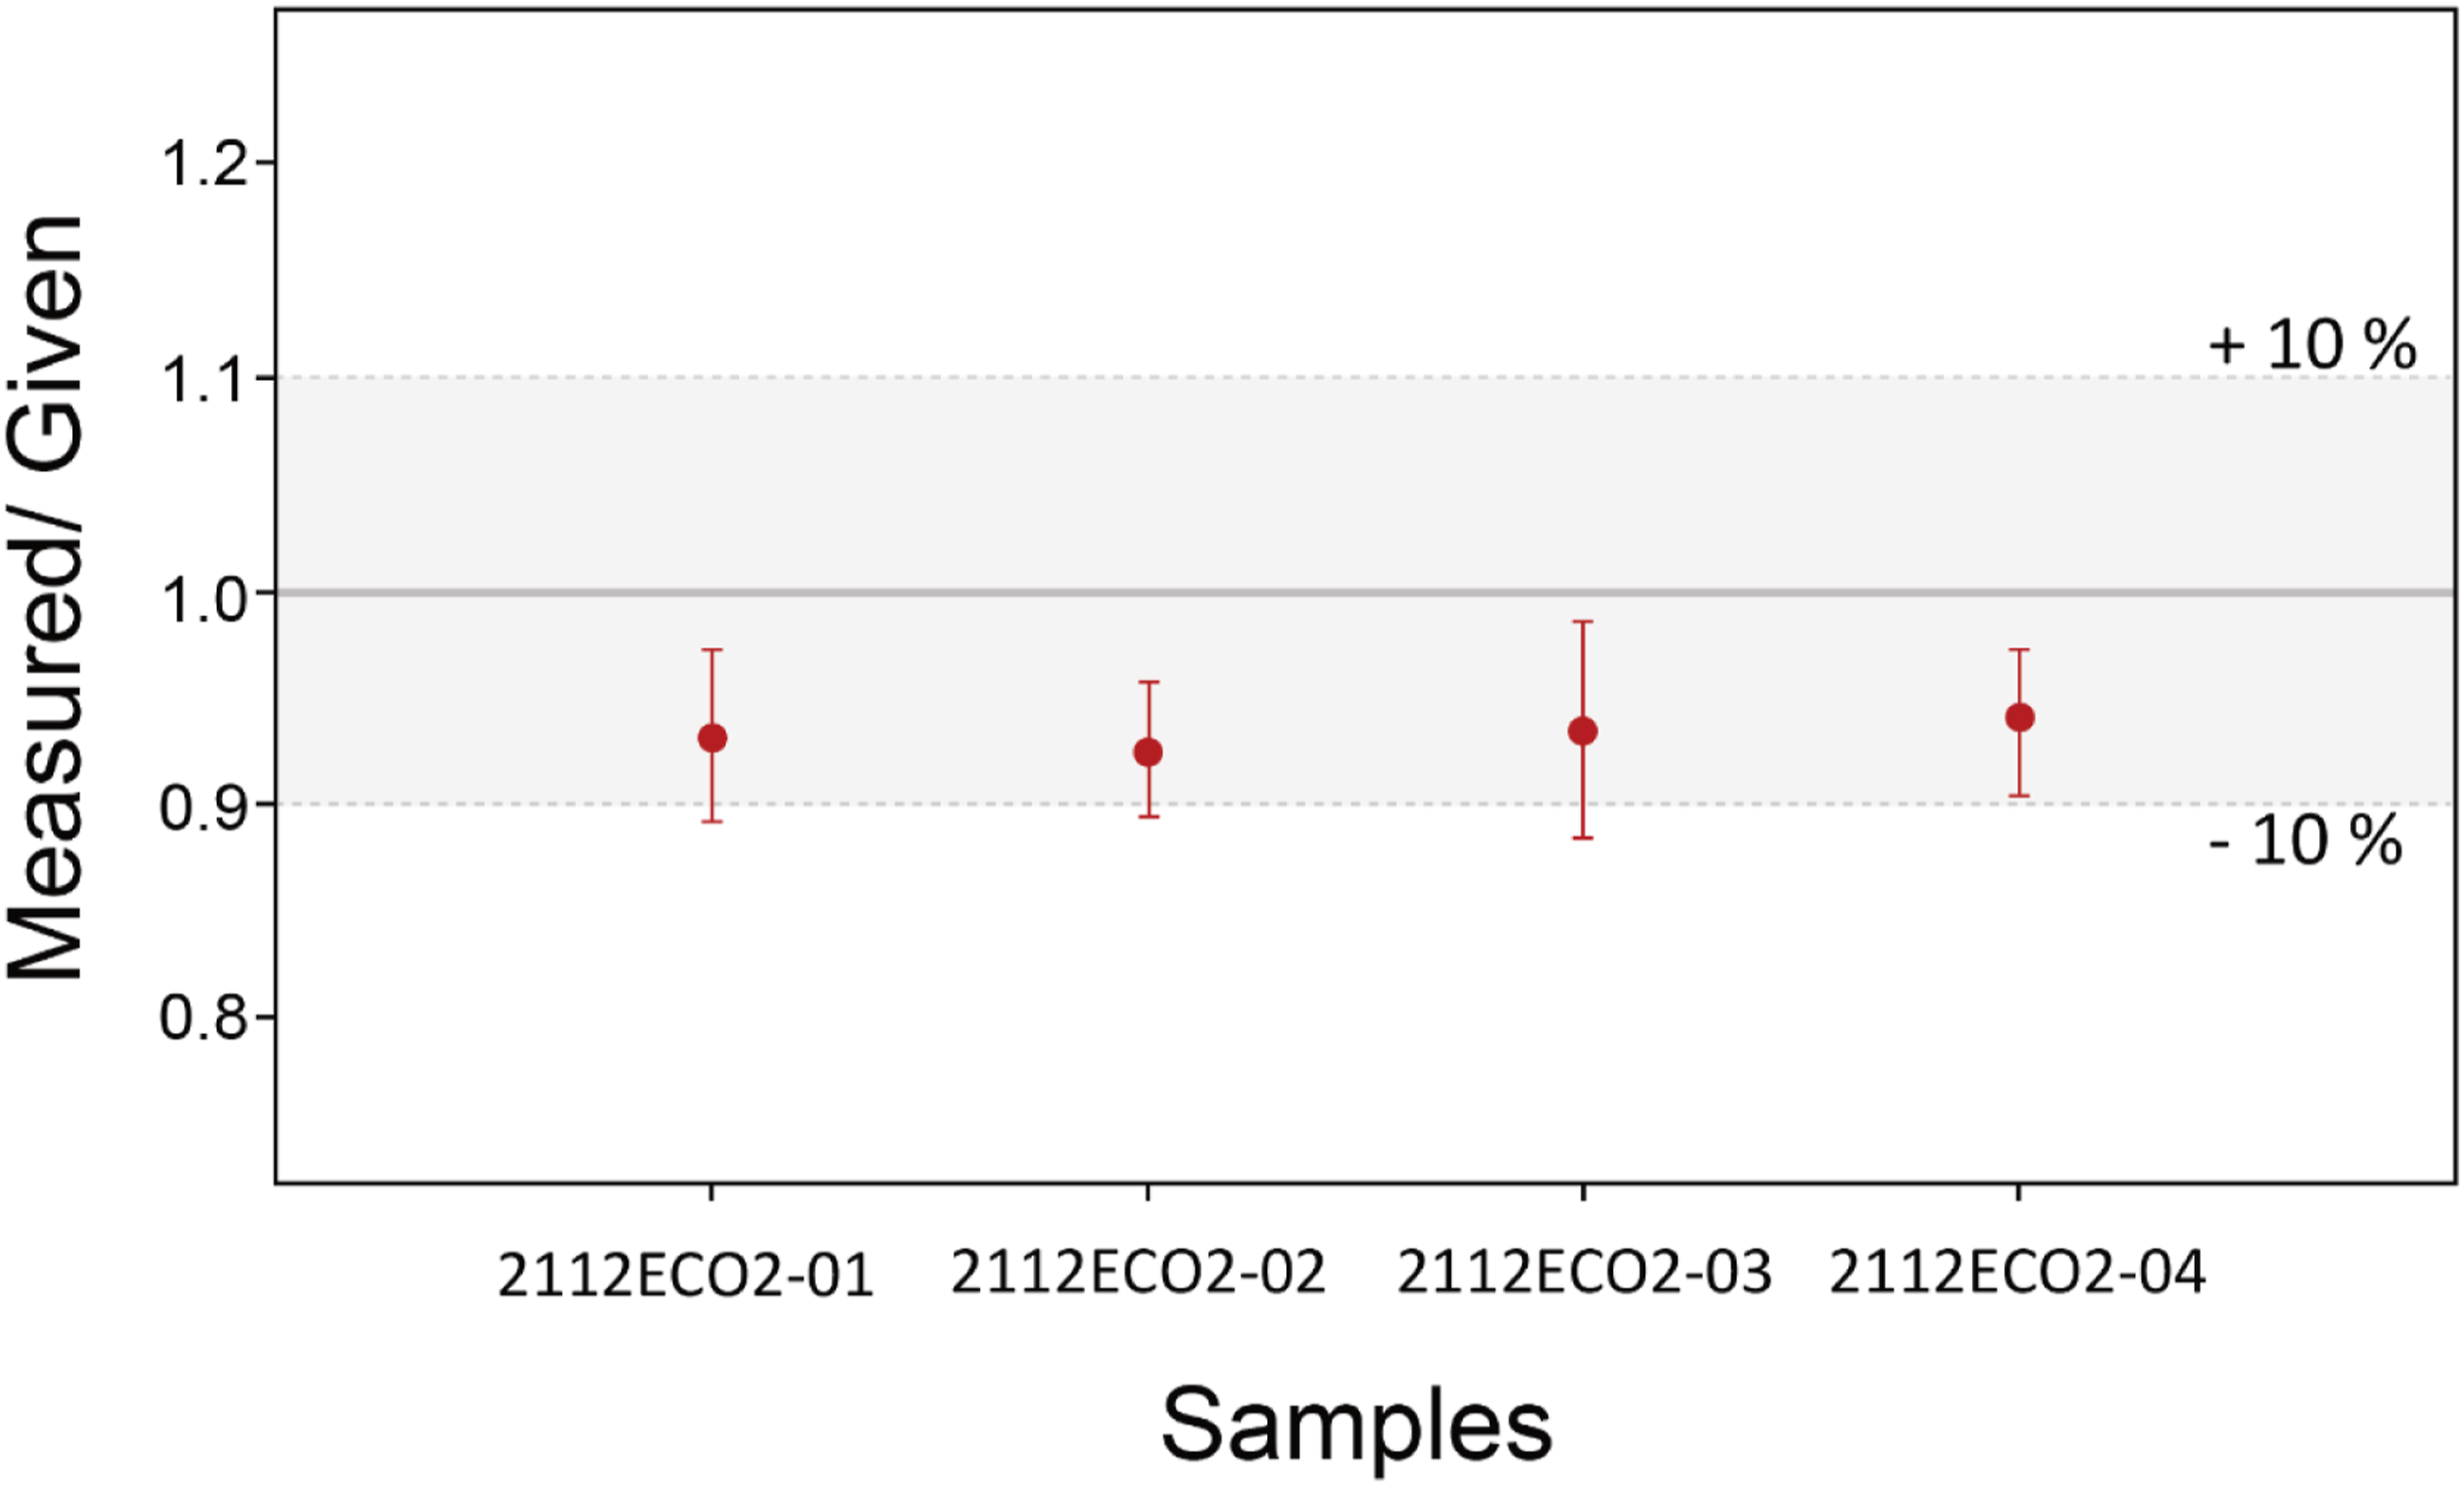
Before the De measurements for all samples, we performed an IR depletion test to check for feldspar contamination. The IR test showed that the average IR/Blue signal ratio for all samples was below 5%, confirming that feldspar was effectively removed during the pretreatment process. Afterward, we estimated the approximate De values for each sample using three aliquots per sample. As a result, all coarse-grained quartz samples were identified to show De values greater than 2D0, indicating saturation. Therefore, subsequent OSL analyses were conducted solely on fine-grained quartz. Preheat plateau tests were also conducted to determine the appropriate preheating temperatures for all samples. All samples were preheated in 20°C intervals, ranging from 160 to 300°C, with three aliquots at each temperature. The cut-heat temperature was set at 160°C. Consequently, it was observed that all samples formed a plateau between 200°C and 280°C. Based on these results, a preheat temperature of 220°C and a cut-heat temperature of 160°C were selected for all subsequent analyses (Figure 5). Additionally, a dose recovery test was performed for all samples using three aliquots each to determine if they were suitable for OSL equivalent dose analysis via the SAR protocol (Wintle and Murray, 2006). In this study, the results of the dose recovery tests for all samples yielded the measured to given laboratory dose ratios between 0.93 and 0.94, confirming their suitability for OSL analysis (Figure 6). Preheat plateau tests for fine quartz fractions from four samples. All samples formed a plateau between 200°C and 280°C. For interpretation of the references to colours in this figure legend, refer to the online version of this article. Dose recovery test for fine quartz samples. The measured to given laboratory dose ratios of all samples show dose recovery ratios within 1.0 ± 10%. For interpretation of the references to colours in this figure legend, refer to the online version of this article.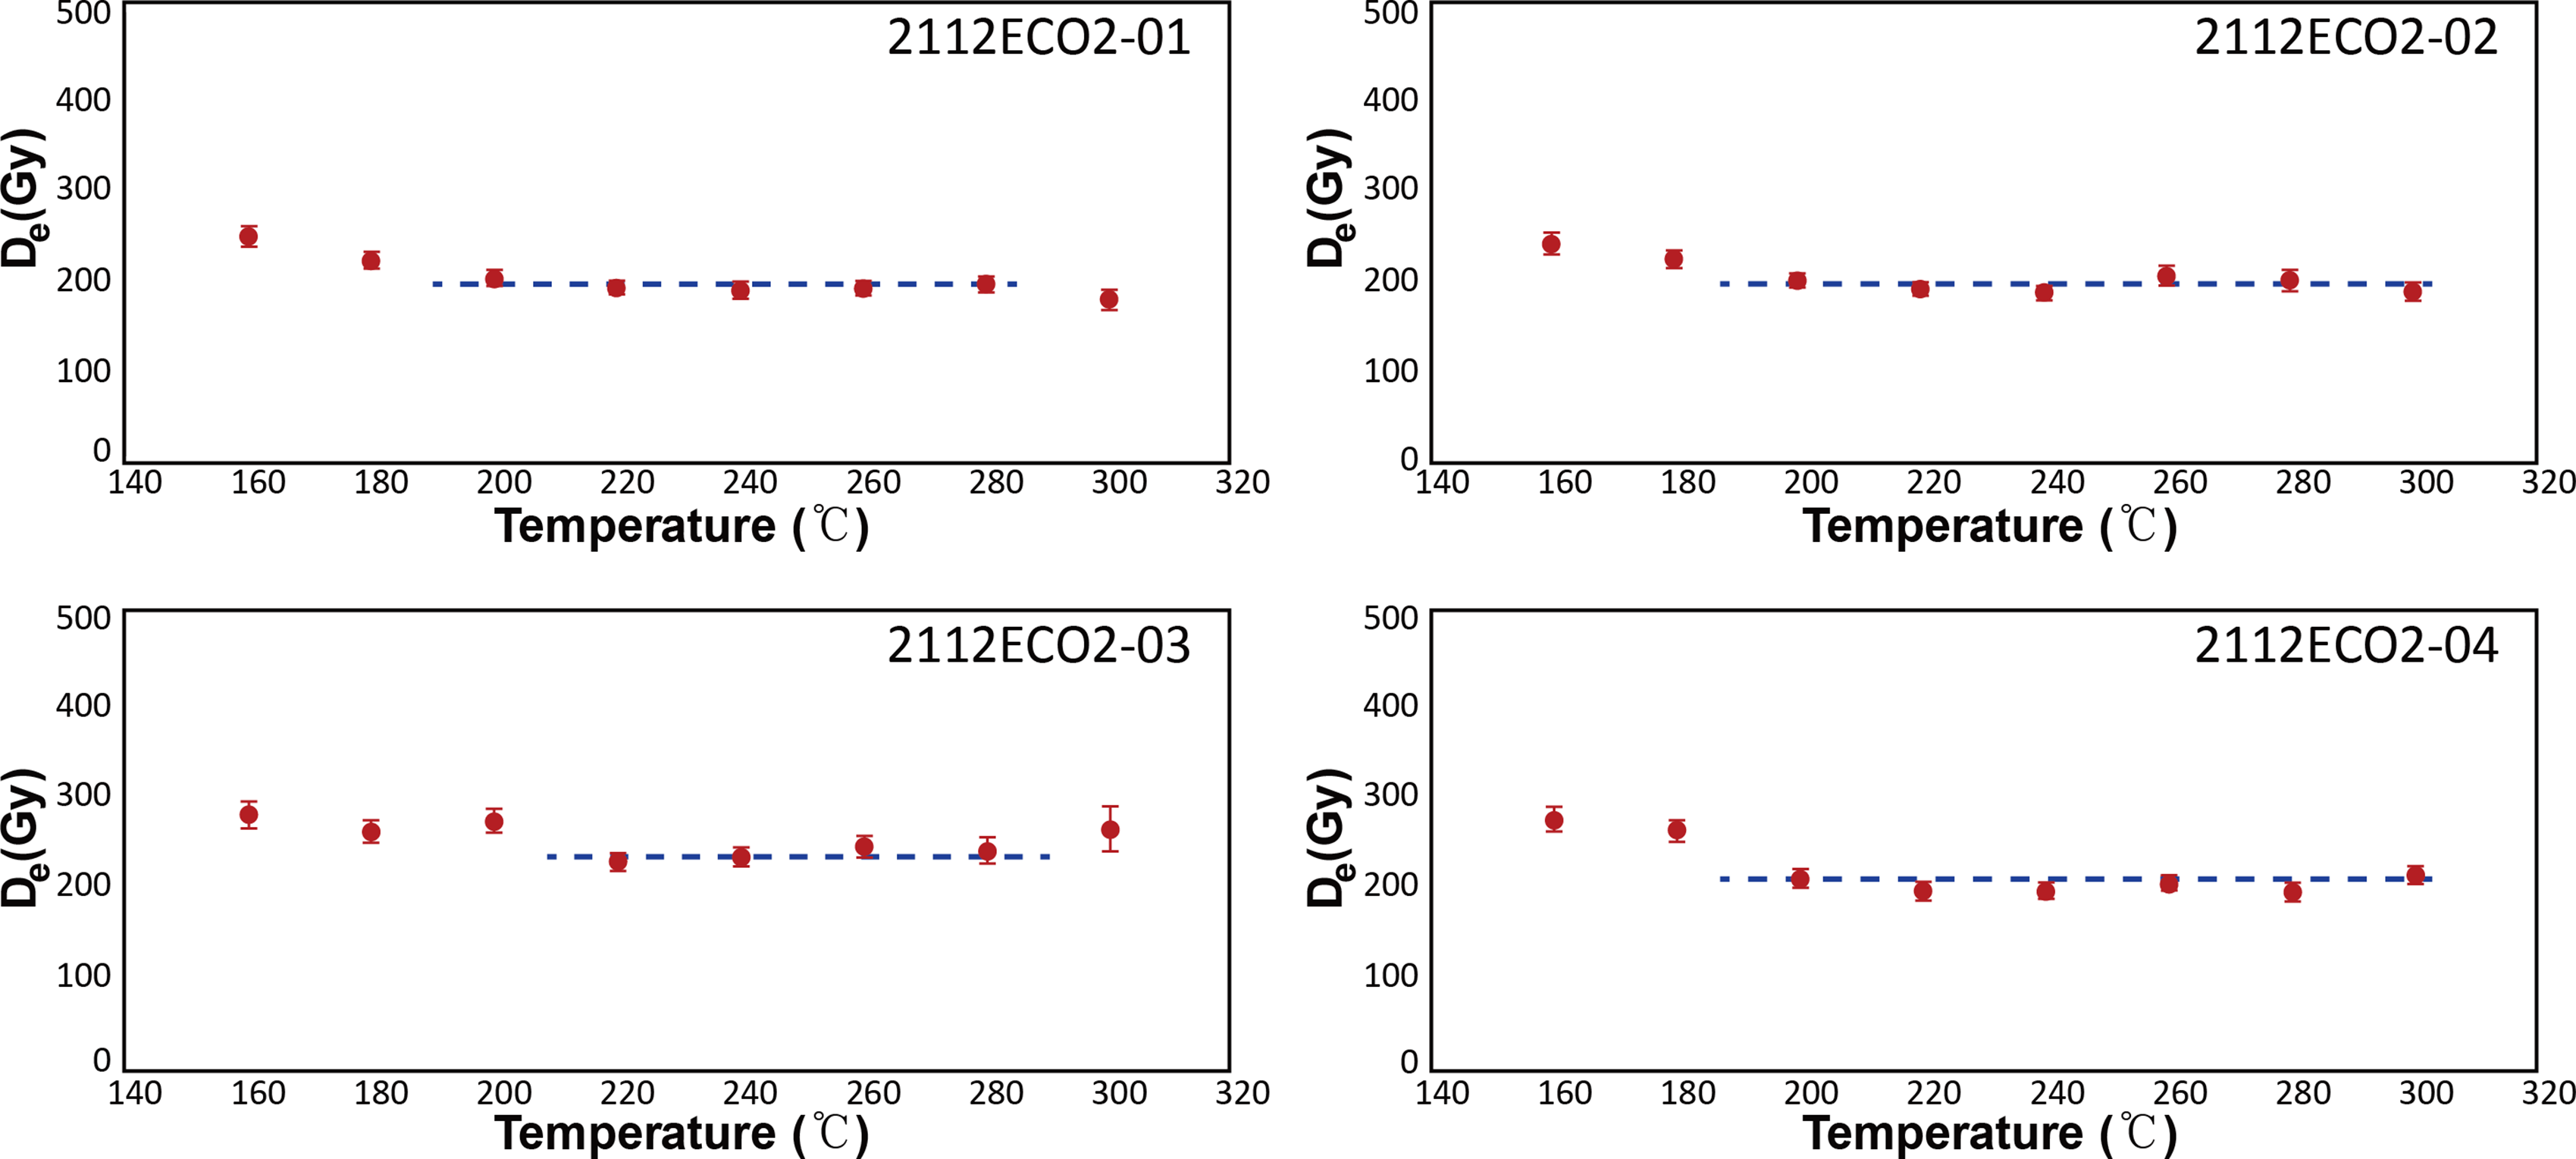
The OSL signal of all samples exhibited a marked decrease to less than 10% of the initial signal within approximately 2–3 s (Figure 7). This observation indirectly confirms that the fast OSL component suitable for dating predominated in all analyzed samples. Detailed information regarding the radioactivity value, sampling depth, moisture content, annual dose, equivalent dose, and OSL central age of the analyzed samples is given in Table 2 and Table 3. OSL dating results of four samples from sedimentary deposits of T2. For interpretation of the references to colours in this figure legend, refer to the online version of this article. Radioactivity Values of the OSL Samples. OSL Dating Sample Properties and Age Determinations.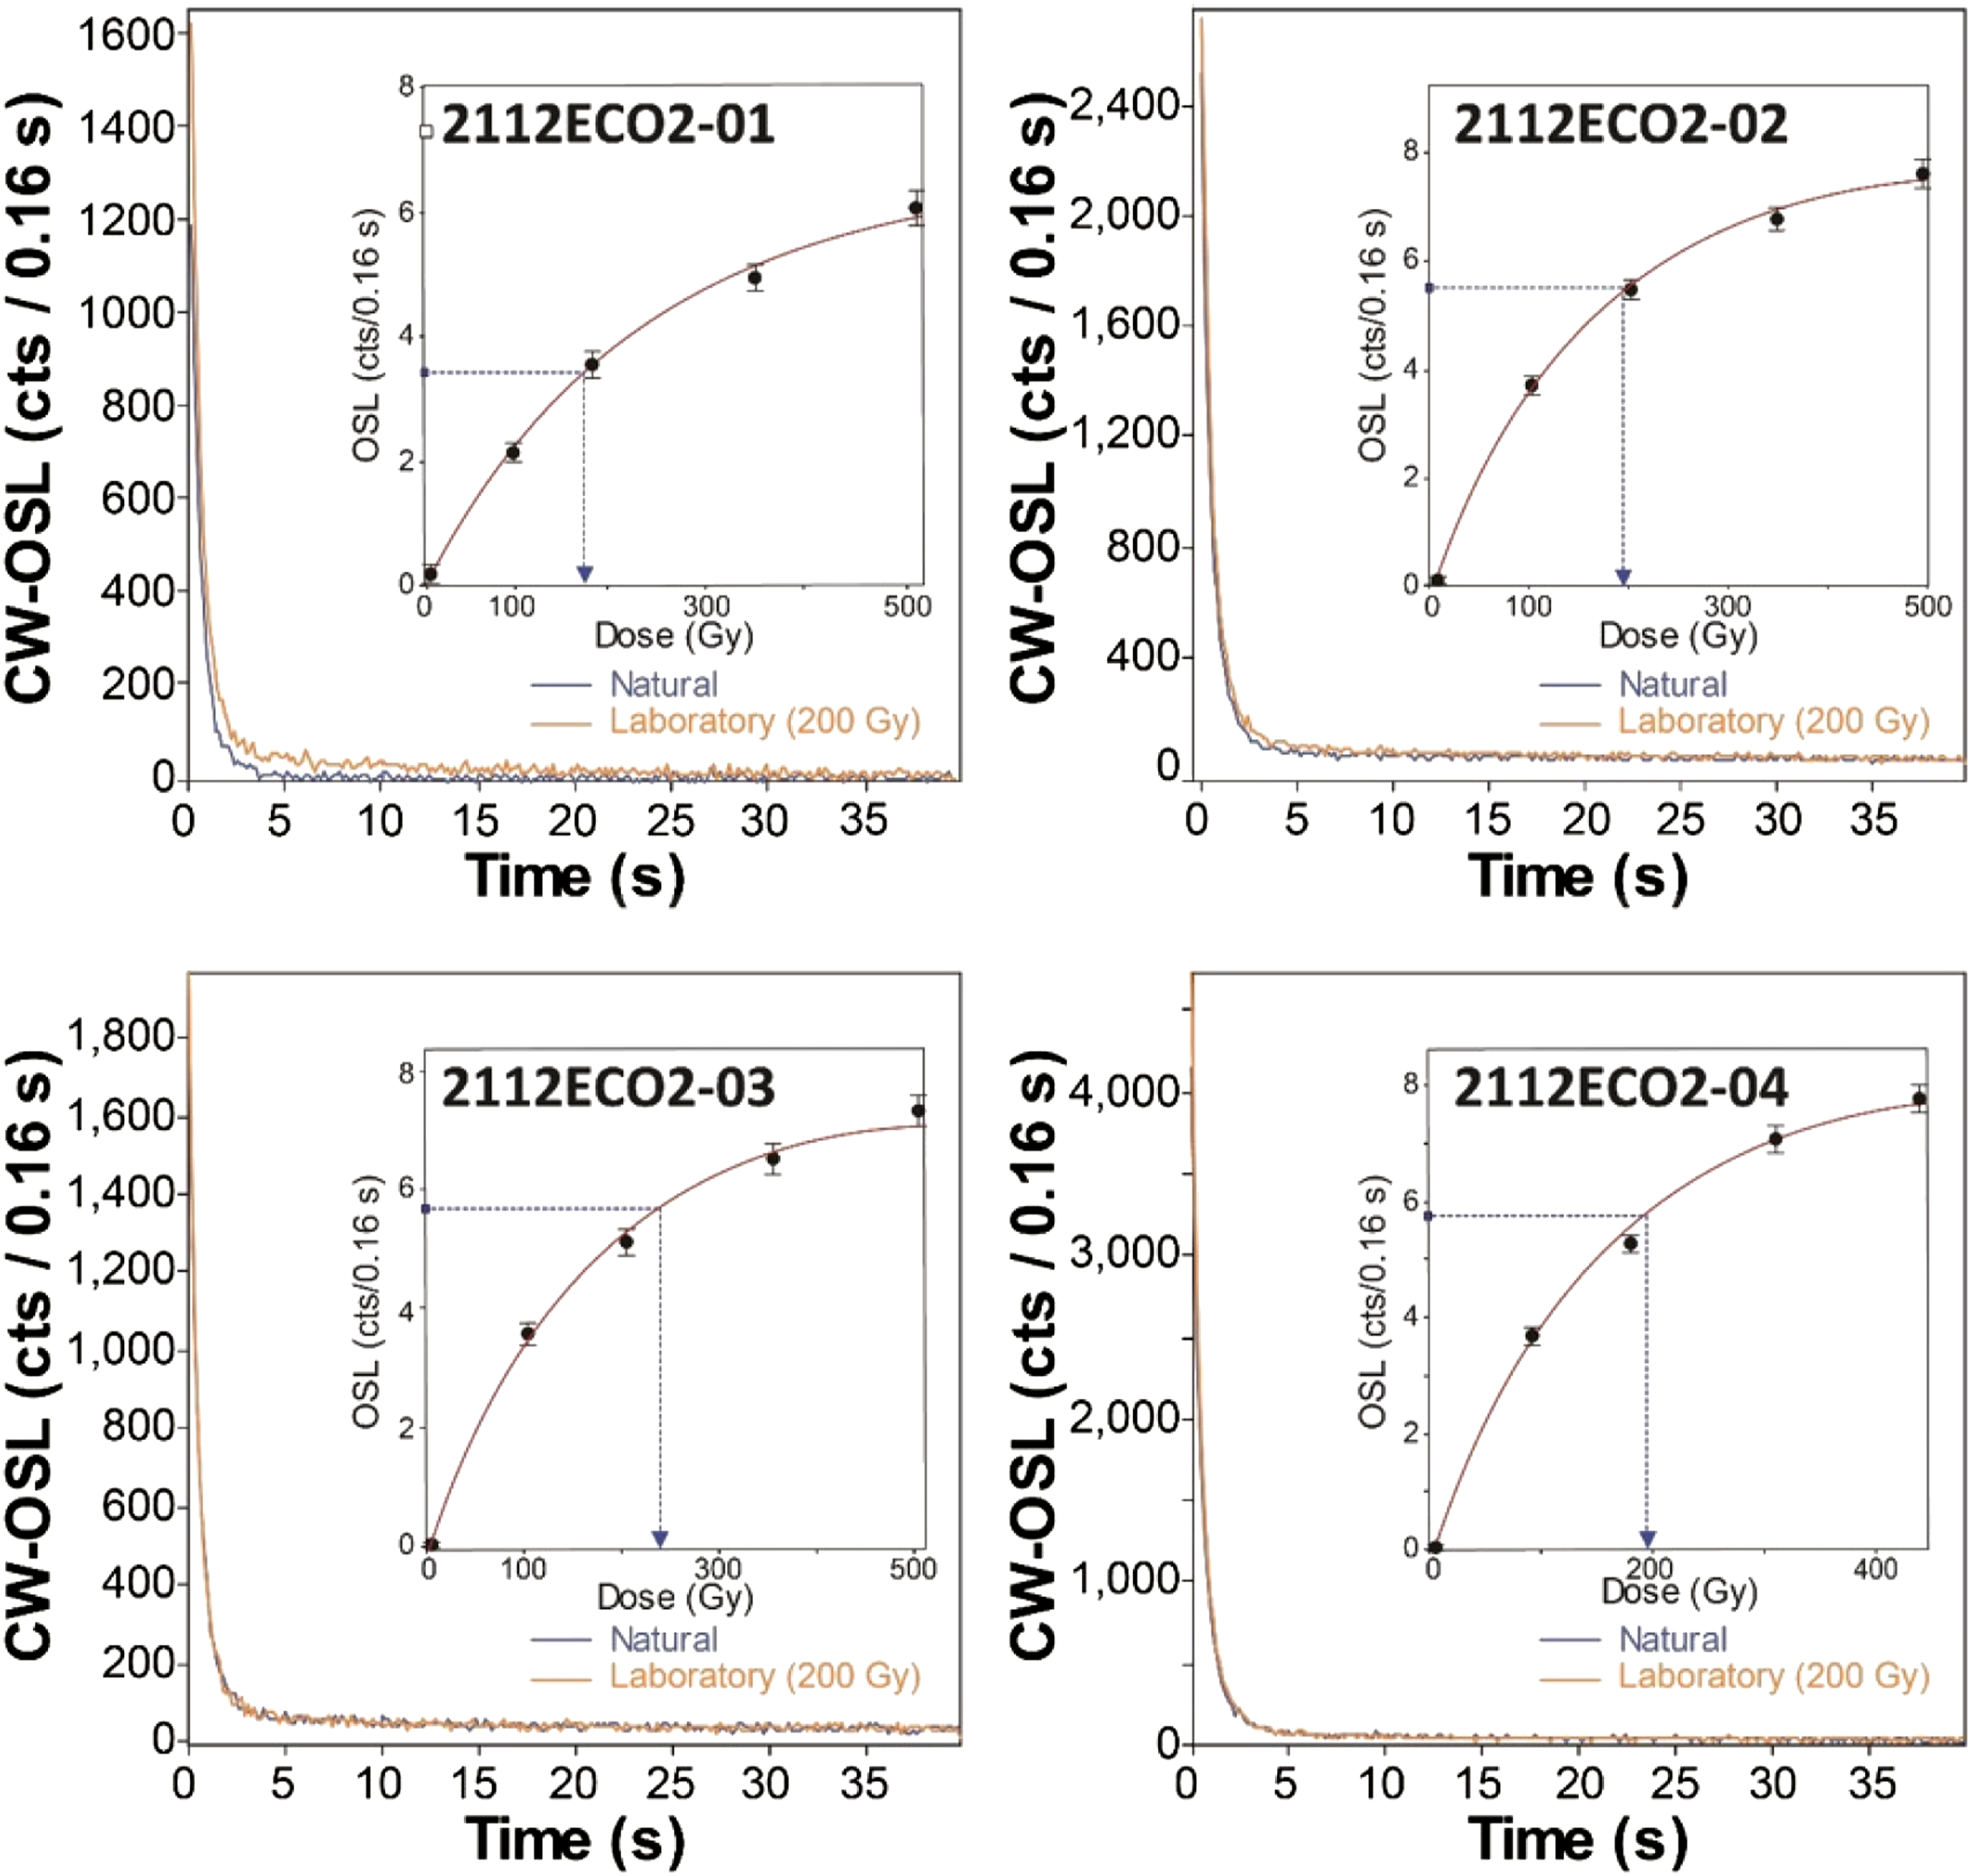
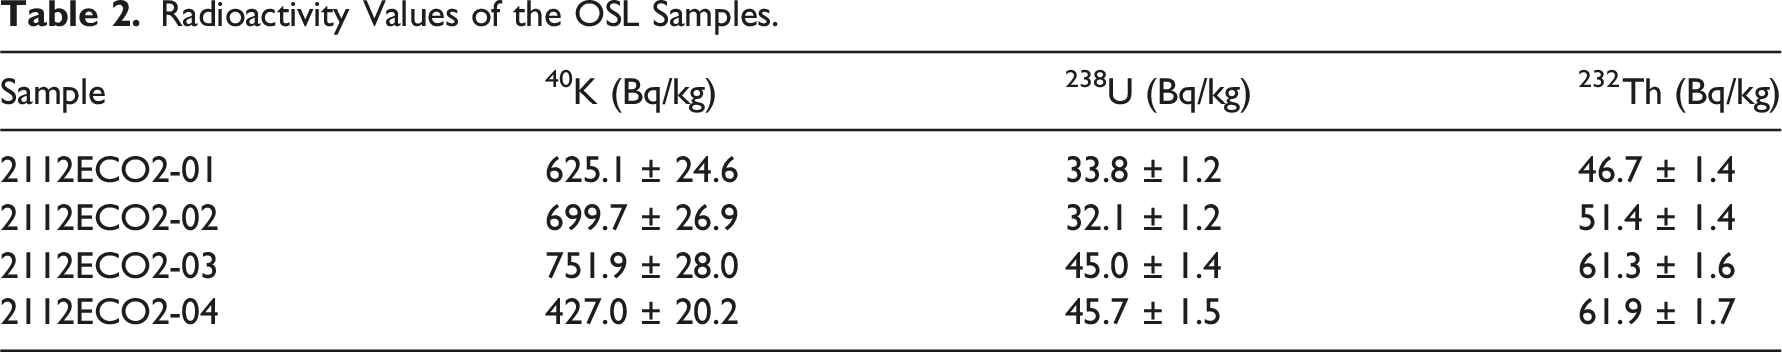
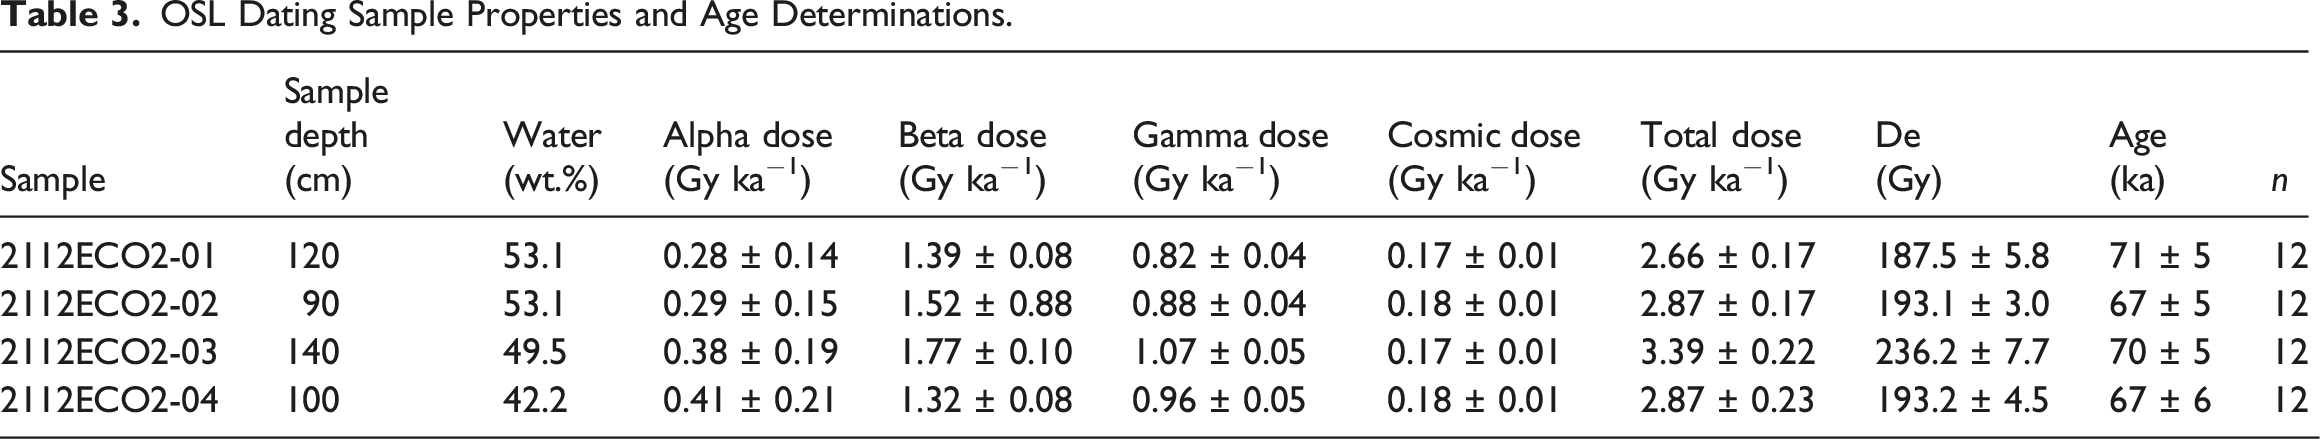
OSL analysis of samples collected from T2 developed in Yangnam-myeon, Gyeongju, yielded ages of 71 ± 5 ka, 67 ± 5 ka, 70 ± 5 ka, and 67 ± 6 ka from the bottom to the top of the terrace, respectively. For these samples, 12 aliquots were accepted for each, and the overdispersion (O.D.) values were 0% for the first three samples and 3.4% for the fourth sample (Table 3). These results indicate that all four samples analyzed fall within the same age range, suggesting that the sedimentary layers in T2 of the study area were deposited approximately 70 ka. The OSL ages determined in this study lie within the previously reported age range of 80–49 ka for the sedimentary layers of T2 (Choi, 2019) but provide a tighter chronological constraint than previously reported.
10Be depth profiling
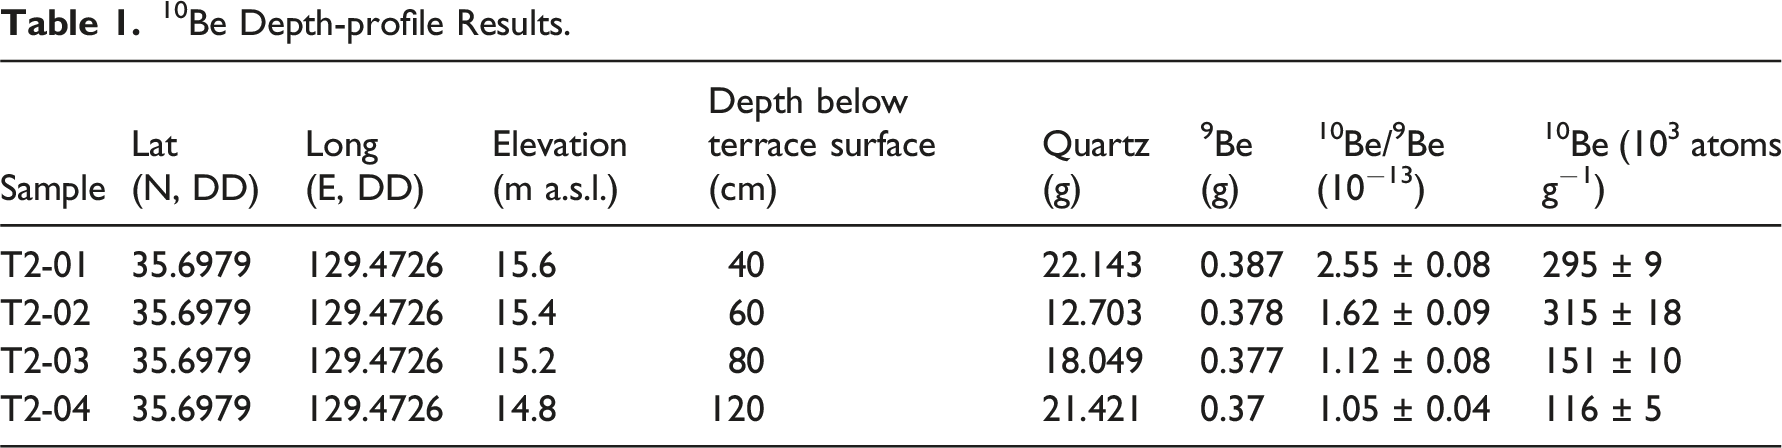
The contents of 10Be measured for samples from various depths are presented in Table 1 and Figure 4c. In general, at well-preserved sites, samples would be collected at intervals of 30–40 cm, covering depths to 200 cm below the terrace surface to determine inherited 10Be. However, in this study, no samples were taken from the top surface (∼16 m a.s.l.) and at depths greater than 120 cm owing to urbanization-related slope failure.
To estimate the exposure age, 10Be inheritance, and surface erosion rate, we employed the MATLAB Monte Carlo modeling program developed by Hidy et al. (2010) with 100,000 simulation runs. Cosmogenic 10Be ages were calculated using the time-independent scaling scheme proposed by Lal (1991) and Stone (2000). We used a reference spallogenic 10Be production rate of 4.76 ± 0.39 atoms/g/a (1σ, sea level high latitude; Balco et al., 2008) scaled to our field site. Our calculations took into account a 10Be half-life of 1.387 × 10⁶ yr (Korschinek et al., 2010) and an attenuation length of 160 g/cm2 (Gosse and Phillips, 2001).
During fieldwork, we conducted measurements of topographic shielding and derived corresponding values. We applied a density of 2.2 g/cm3 in the Monte Carlo model as a reasonable estimate of sediment density. All 10Be depth-profile ages and modeled parameters, including inheritance and erosion rate, are presented at the 95% confidence level based on outcomes from the Monte Carlo model.
Based on the above findings and assumptions, we adopted a maximum erosion rate of ≤100 mm/ka from catchment-wide denudation rate around the study area (Kim et al., 2016). To compare the results of 10Be profiling with those of OSL dating, we used a broader age range, setting a minimum age of 40 ka and a maximum age of 90 ka. This range was determined based on previous compiled Quartz OSL data (Choi, 2019) to meet the requirement of the Monte Carlo model. The extended temporal range enabled us to evaluate the successive relationship between the depositional timing (OSL results from this study) and the abandonment age predicted by the model, thereby facilitating a more comprehensive and robust analysis. In addition, we specified the inheritance values for the Monte Carlo model. The minimum inheritance was determined as 4 × 10⁴ atoms/g on the basis of the exponent regression line, whereas the maximum inheritance was assumed to be 1.00 × 10⁵ atoms/g, considering T2-04 (120 cm) as the inheritance. The cosmogenic 10Be depth profile yielded ages of 61.7 ka (mean) and 60.0 ka (median). The mean surface erosion rate for T2 was calculated as 8.4 mm/ka (mean and median). The inheritance value was determined to be 7.00 × 10⁴ atoms/g.
Discussion
Formation age and uplift rate of T2
Abandonment age of T2
Previous studies have reported Quartz OSL ages of T2 around the study area of 80 to 49 ka in the study area (Choi et al., 2003; Heo et al., 2014; Hong, 2018; Jeong et al., 2007; Kim et al., 2007). The diversity in these dates can be attributed to various factors, including the use of diverse measurement procedures, the influence of quartz transport by erosion (Jeong et al., 2007; Kim et al., 2007), and the impact of active fault movement (Heo et al., 2014; Hong, 2018; Kim et al., 2007). In our research, we collected samples from locations identified by previous stratigraphic study (Lee et al., 2013) as having horizontally and stably deposited sedimentary facies. Our OSL analysis has narrowly constrained the depositional age of T2 sediments to around 70 ka.
Understanding the precise timing of terrace formation and associated sedimentation process is crucial to marine terrace research. OSL dating outcomes should be checked that terrace formation (deposition) and subsequent uplift (abandonment) occur simultaneously or not. In our study, we utilized two different age dating methods to evaluate the timing of the formation of the terrace. Our analysis yielded not only OSL age range (71–67 ka) but also checked the timing of the abandonment (63–62 ka) by conducting 100,000 Monte Carlo simulations of cosmogenic 10Be depth profile. We established the timing of abandonment between 62 and 60 ka. These results suggest evidence that deposition preceded uplift at T2. The integration of these two numerical age-dating methods (OSL and cosmogenic 10Be depth-profile) offers a nuanced perspective on the deposition and abandonment processes of T2, suggesting a more sequential and therefore complex geomorphological evolution than previously understood. This approach not only sheds light on the specific dynamics at T2 but also sets a precedent for reevaluating the formation timelines of marine terraces more broadly.
Sea-level fluctuations and estimation of tectonic uplift rate
Marine terraces are commonly analyzed using well-established sea-level curves from studies (Lambeck and Chappell, 2001; Rohling et al., 2014; Shakun et al., 2015; Siddall et al., 2003; Spratt and Lisiecki, 2016; Waelbroeck et al., 2002). For example, during the last interglacial period (LIG, MIS 5e), the global eustatic sea level increased to reach approximately 6 m higher than the present sea level (Dutton and Lambeck, 2012; Veeh, 1966). However, the extent of this rise varied across different regions around the world because of regional and local influences such as tectonic activity, glacial-isostatic adjustment processes, and sediment compaction (Ryang et al., 2022). For instance, sea-level records from MIS 5e indicate elevations 3 to 6 m above present sea level along the western coast of the Korean Peninsula, while records from the east coast range from 9 to 32 m (Ryang et al., 2022). Our research focuses on a specific local area, where applying global sea level changes directly poses challenges due to regional discrepancies. Consequently, we utilized the graphic correlation curve from previously conducted on this region. Thus, we settled on a −10 m as the paleo sea level (SL) referencing Choi et al. (2008) as it complied and correlated various sources related with paleo sea level (Choi et al., 2008, Table 4).
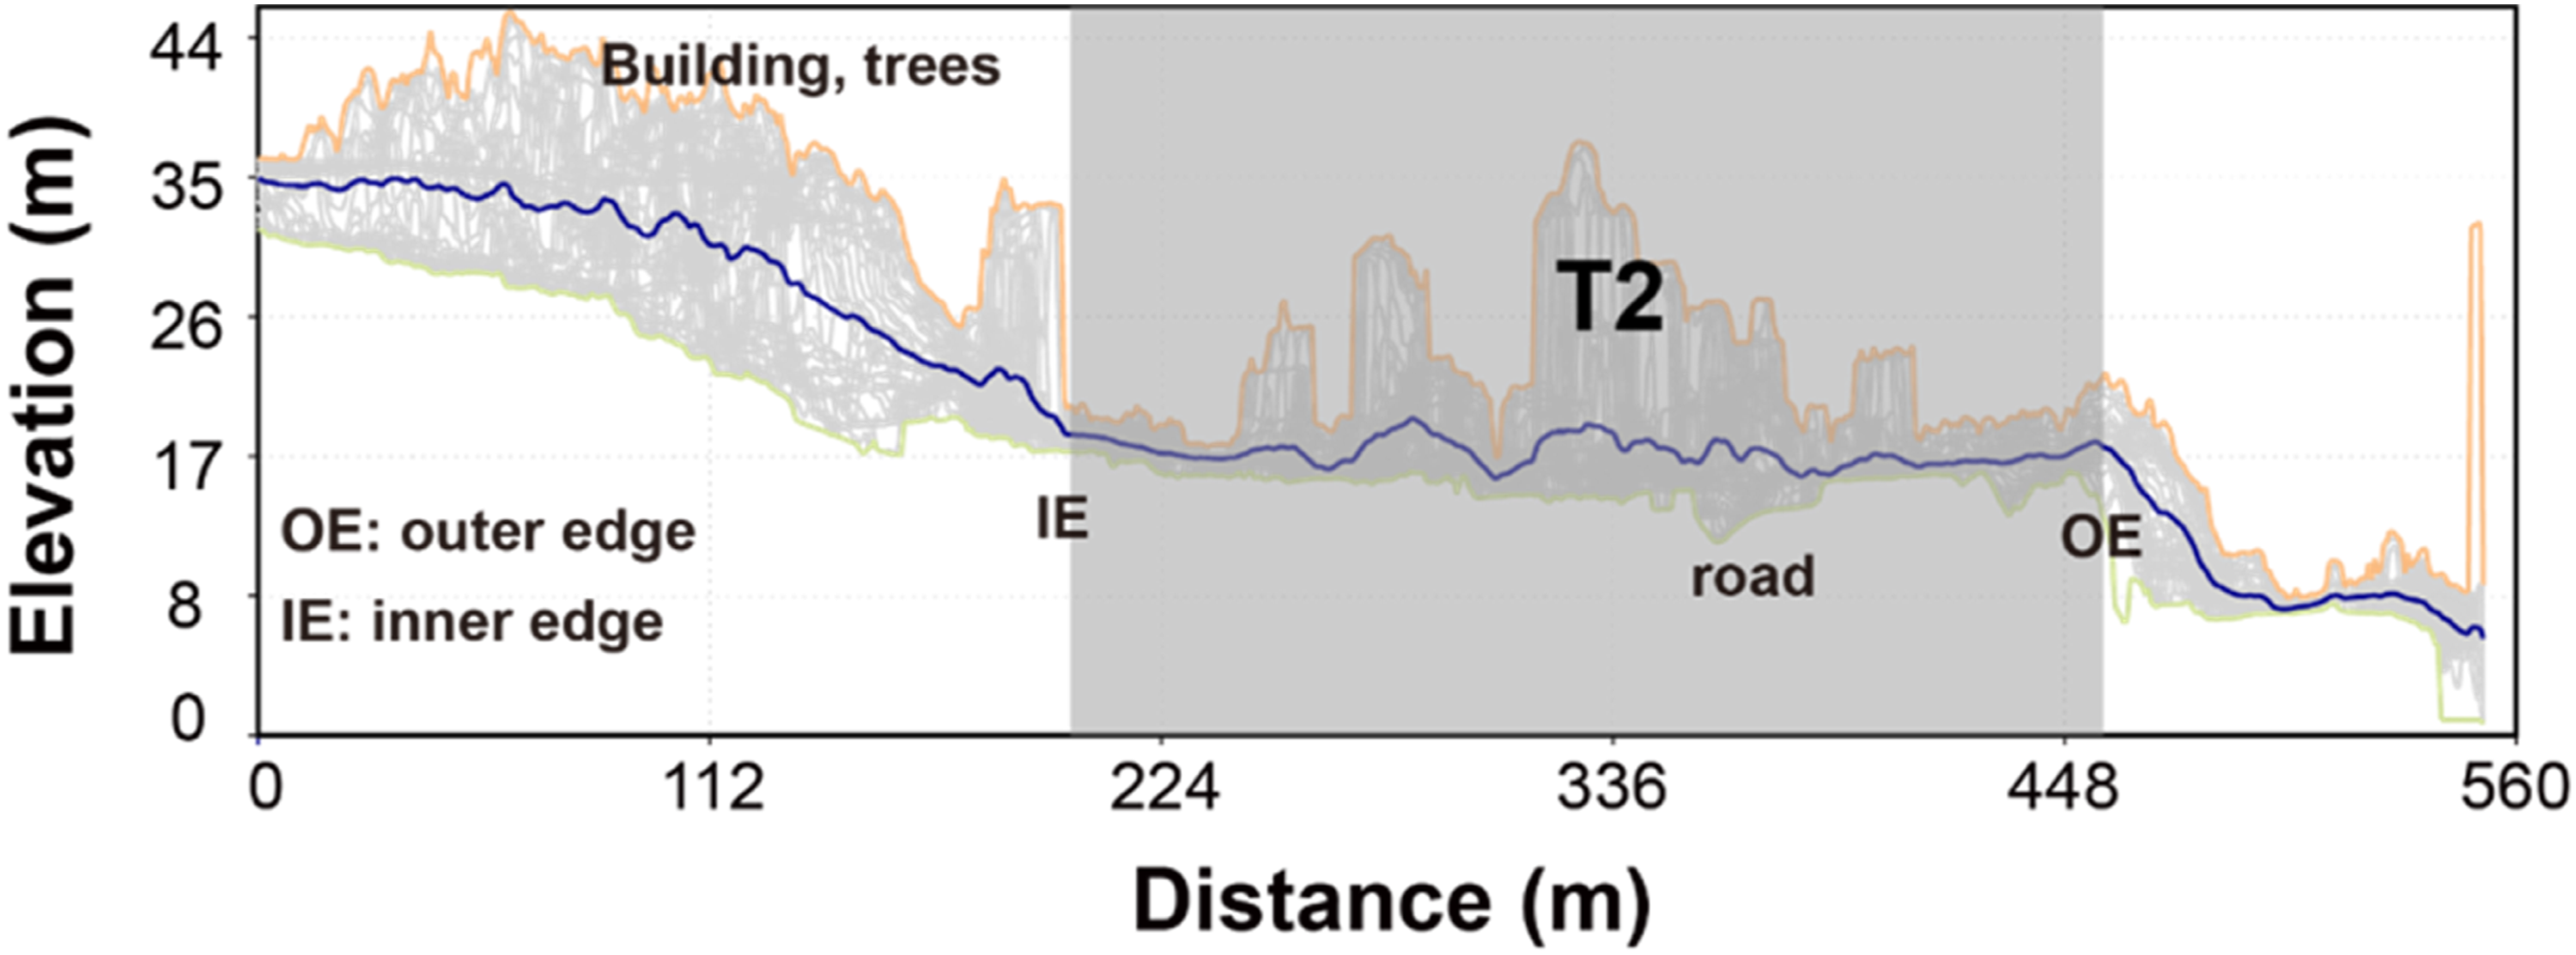
The most commonly used approach for reconstructing paleo relative sea level from marine terraces is based on the elevation of the shoreline angle (SA). This term refers to the “inner edge” defined by Bradley and Griggs, (1976) or the junction between the marine platform and the paleo sea cliff defined by Muhs et al. (1990). By integrating our field observations, previous stratigraphic description (Lee et al., 2013), and precise and accurate dating of terrace abandonment age, we infer that the marine terrace reflects the position of the paleo shoreline at the time of its deposition. We employed a DSM derived from UAV data to identify the inner edge of T2 and to compute the uplift rate (U) according to the following equation: Swath profile of T2 using a swath width of 100 m. Solid orange line: maximum elevation; solid blue line: mean elevation; solid green line: minimum elevation. For interpretation of the references to colours in this figure legend, refer to the online version of this article.
Terrace formation and tectonic uplift
It has traditionally been accepted that the Korean Peninsula is characterized by a stable intra-plate tectonic setting, featuring a consistently low uplift rate (0.1–0.22 mm/yr) with no particular variation between the western and eastern coasts (Choi, 2001; Kim et al., 2008; Lee and Park, 2006). However, recent studies have revealed that different regions may exhibit distinctive and higher rates of uplift (0.19–0.46 mm/yr) (Choi et al., 2019; Choi et al., 2008; Chwae and Choi, 2007; Hwang et al., 2012). We compiled rates of uplift from previous studies of the eastern Korean Peninsula (Choi, 2019; Choi et al., 2008; Hong, 2018; Park et al., 2017; Ryang et al., 2022). The regional uplift rate along the eastern coast of the Korean Peninsula is 0.2–0.3 mm/yr. Accordingly, the local uplift rate of 0.44 mm/yr (this study) is considerably higher than the mean rate observed along the eastern coast of the peninsula. This relatively high rate of uplift is the result of a combination of climatic and tectonic factors, as discussed below.
Sediment accumulation and fluctuations in sea level are influenced by climate change, with increased sediment supply during interglacial periods. However, it is unlikely that climate change (relative sea level drop) was the only influence on the observed uplift rate. The absence of vertical variation in sedimentary layers in coastal sediments of the study area indicates that rapid sea-level rise did not occur during the period of deposition of T2 (Lee et al., 2013). This suggests the possibility of a platform-forming phase during peak sea level, with the deposition of the coastal terrace sedimentary layer corresponding to the uppermost part of the high-sea-level fluctuation curve. This specific period corresponds to the peak of sea-level rise during the interglacial period of the early Late Pleistocene, which occurred between ∼130,000 and ∼71,000 years ago (MIS 5). Thus, climate influence is unlikely to play a role in the abandonment of terrace.
Our investigation into the formation of marine terraces demonstrates a strong correlation with regional tectonic activities, highlighting the complex interaction between terrace development and fault movements. The variation in uplift along the eastern coast may be due to reactivated Quaternary faults within the Ulsan Fault zone (Choi et al., 2008; Chwae and Choi, 2007). Locally, the Eupcheon (Chwae et al., 1998; Kee et al., 2007) and Suryum (Chwae et al., 1998) faults, characterized by NE–SW orientation, reverse slip, and east dipping, intersect T3 and T4 terraces, are matched with the terrace abandonment periods. The broader tectonic context also supports potential uplift variability across the south-eastern Korean Peninsula. The Ulsan Fault zone, trending mainly NNW–SSE to N–S from Gyeongju to Ulsan, features an imbricate thrust zone configuration with moderate to low dip angles, exhibiting reverse-slip motion during the Quaternary. Especially, this fault zone divides into two distinct areas (Figure 9; Cheon et al., 2023): the northern distributed complex deformation zone and the southern concentrated deformation zone. Our study’s observed higher uplift rate, particularly in the east-side-up region of the southern segment, is attributed to these tectonic implications. Thus, our results not only enrich the understanding of terrace formation but also highlight the broader tectonic effects on the southeastern Korean Peninsula, confirming the influence of ongoing tectonic forces on the landscape formation than previously recognized. Nevertheless, a detailed understanding of the mechanisms associated with each Quaternary faults will become clear only after comprehensive dating analysis. Map of the Ulsan Fault zone and the surrounding terrain (simplified from Cheon et al., 2023). For interpretation of the references to colours in this figure legend, refer to the online version of this article.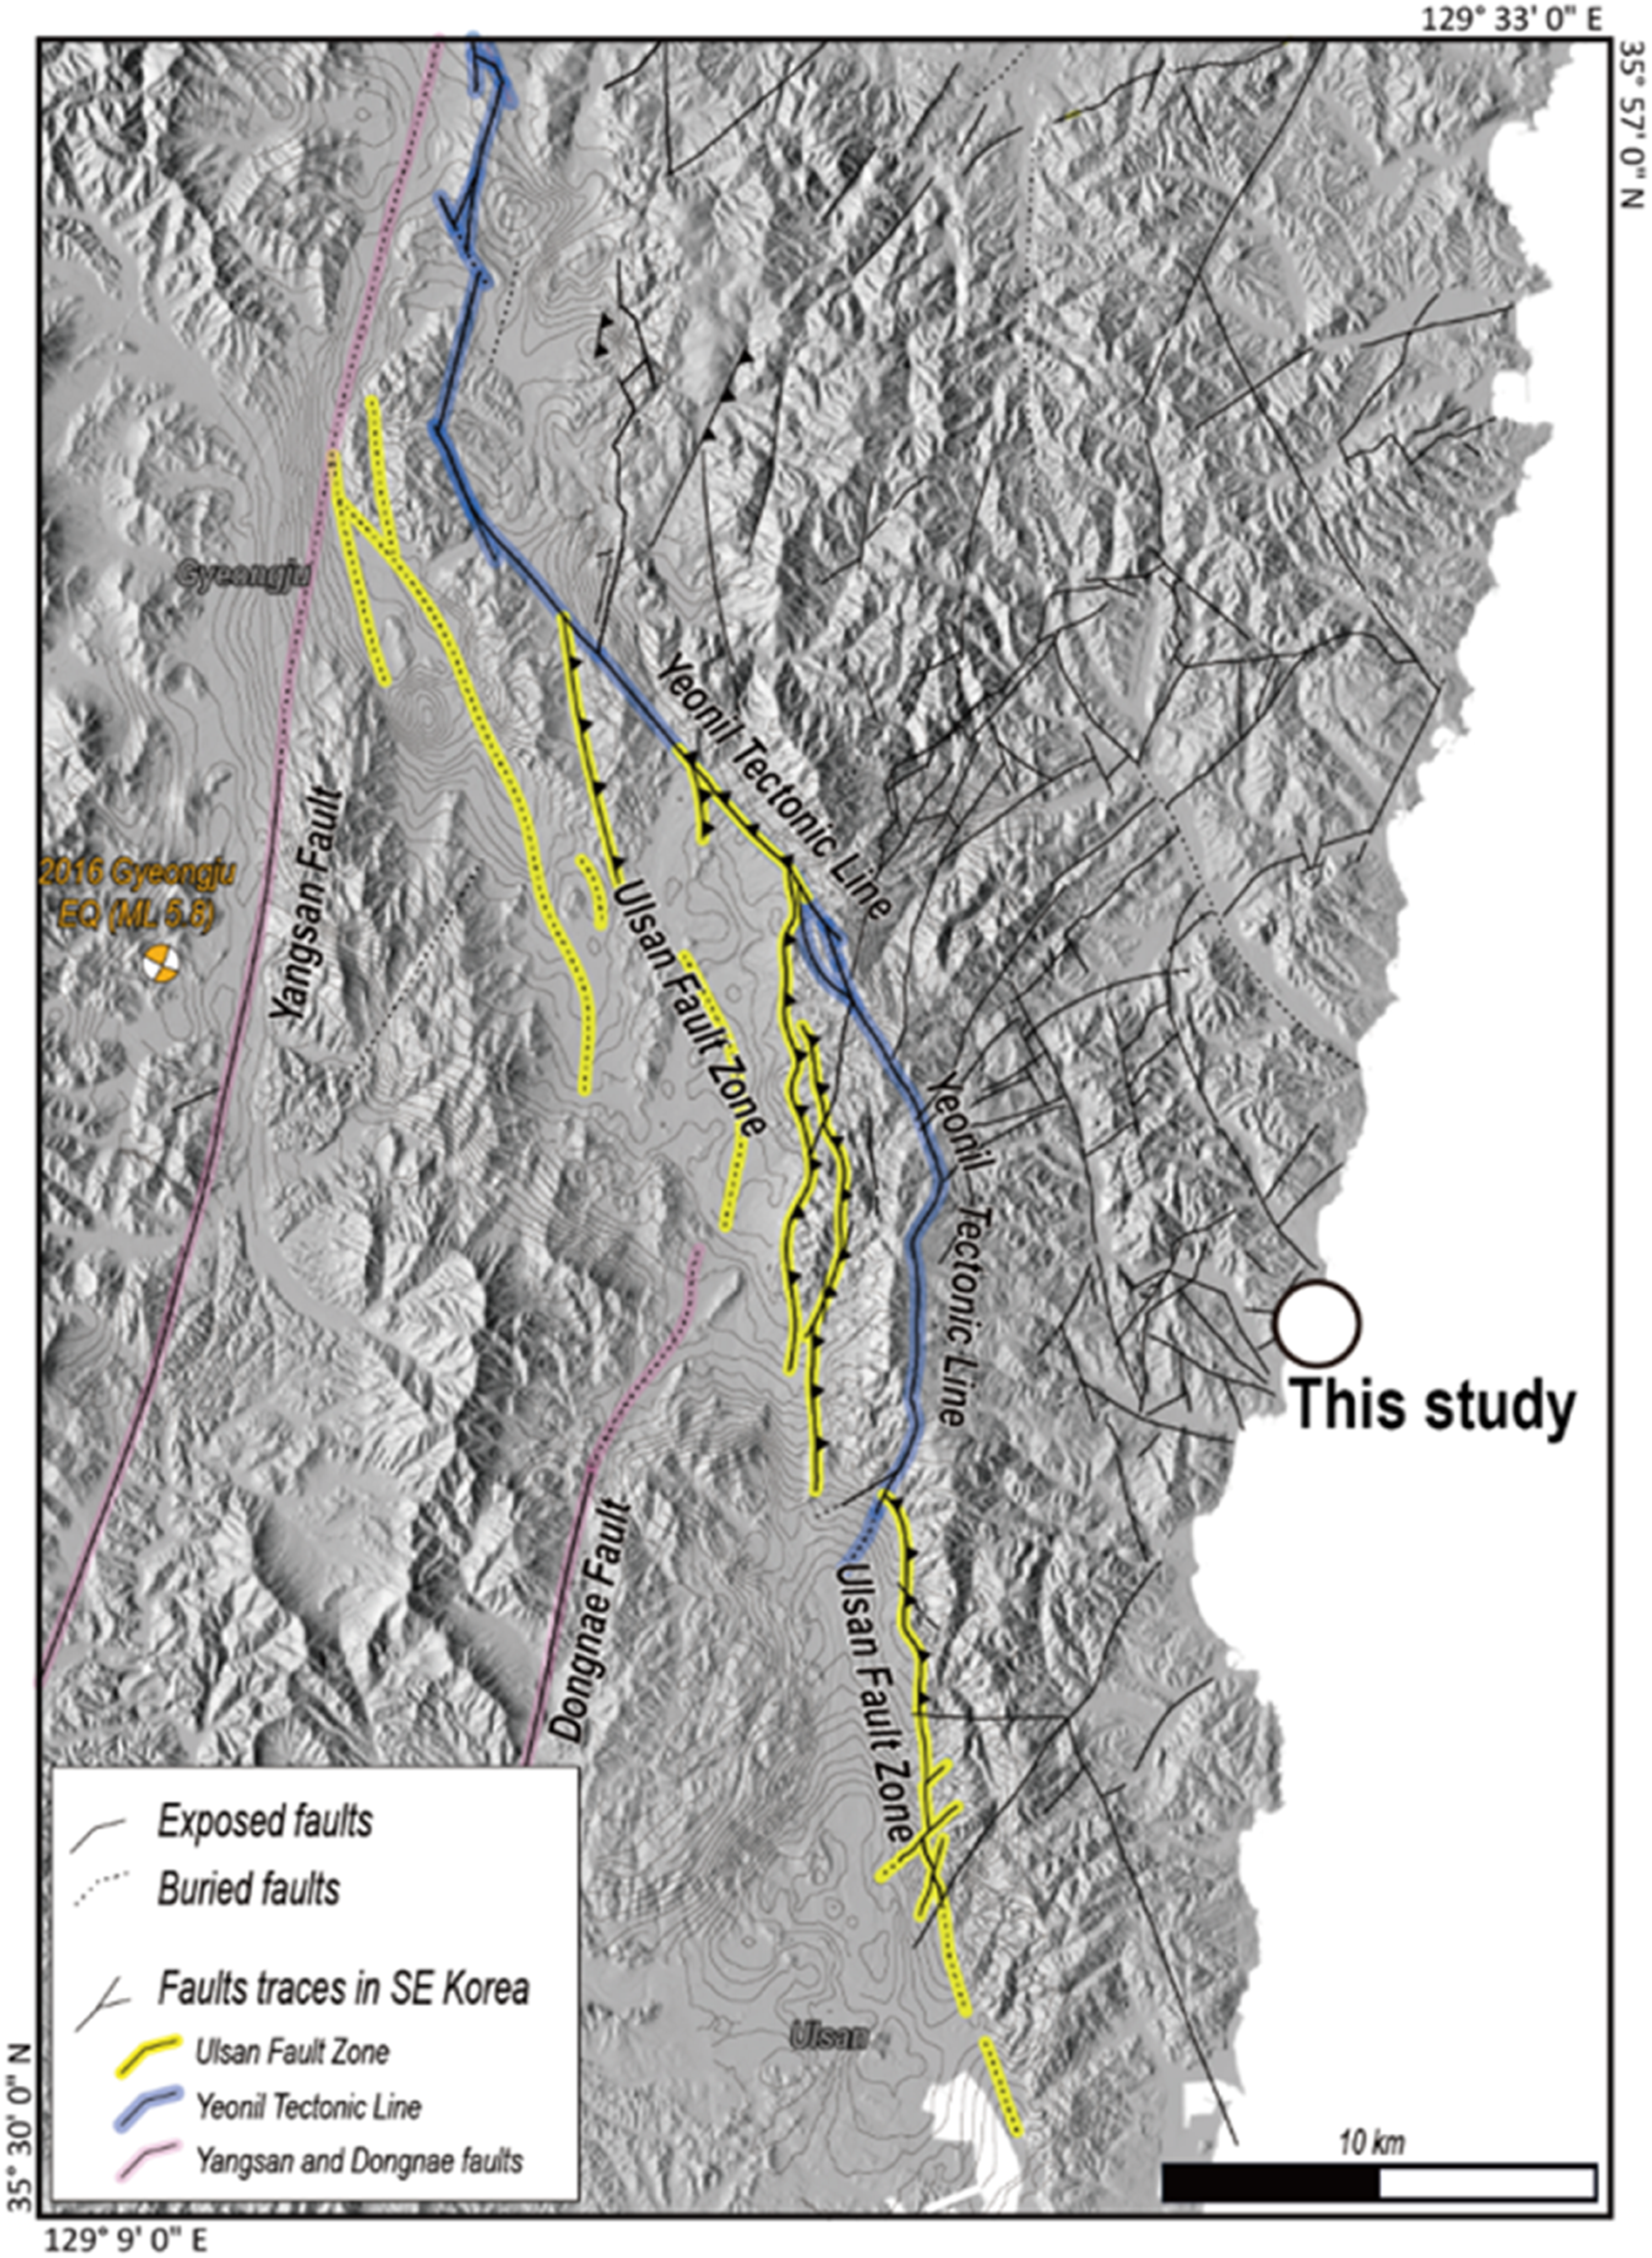
We have suggested a simplified model to propose the developmental process of T2. Figure 10 illustrates the development of T2 in the study area with respect to climate change and tectonic activity. Figure 10a represents the period before the MIS 5a (∼80 ka), with the dotted white line depicting the coastline position. T2 was submerged and the terrace surface underwent multiple cycles of aggradation. Figure 10b represents the period during MIS 5a (∼80 ka) to 62 ka, which was characterized by a slightly lower sea level compared with the present. During this period of relatively stable sea level, the sediment underwent deposition in response to steady wave energy. Figure 10c represents the period from 62 ka to the present. This period was characterized by decreasing sea level and simultaneous uplift of the sediments of T2 from below sea level, resulting in subaerial exposure of the terrace. The exceptional state of preservation of T2 in the study area can be credited to the existence of basalt bedrock. T2 and other basalt-based terraces near the study area display high resistance to erosion, resulting in preservation of the original platform topography. Schematic process. White dashed line indicates paleo sea level. Photograph from KIGAM. For interpretation of the references to colours in this figure legend, refer to the online version of this article.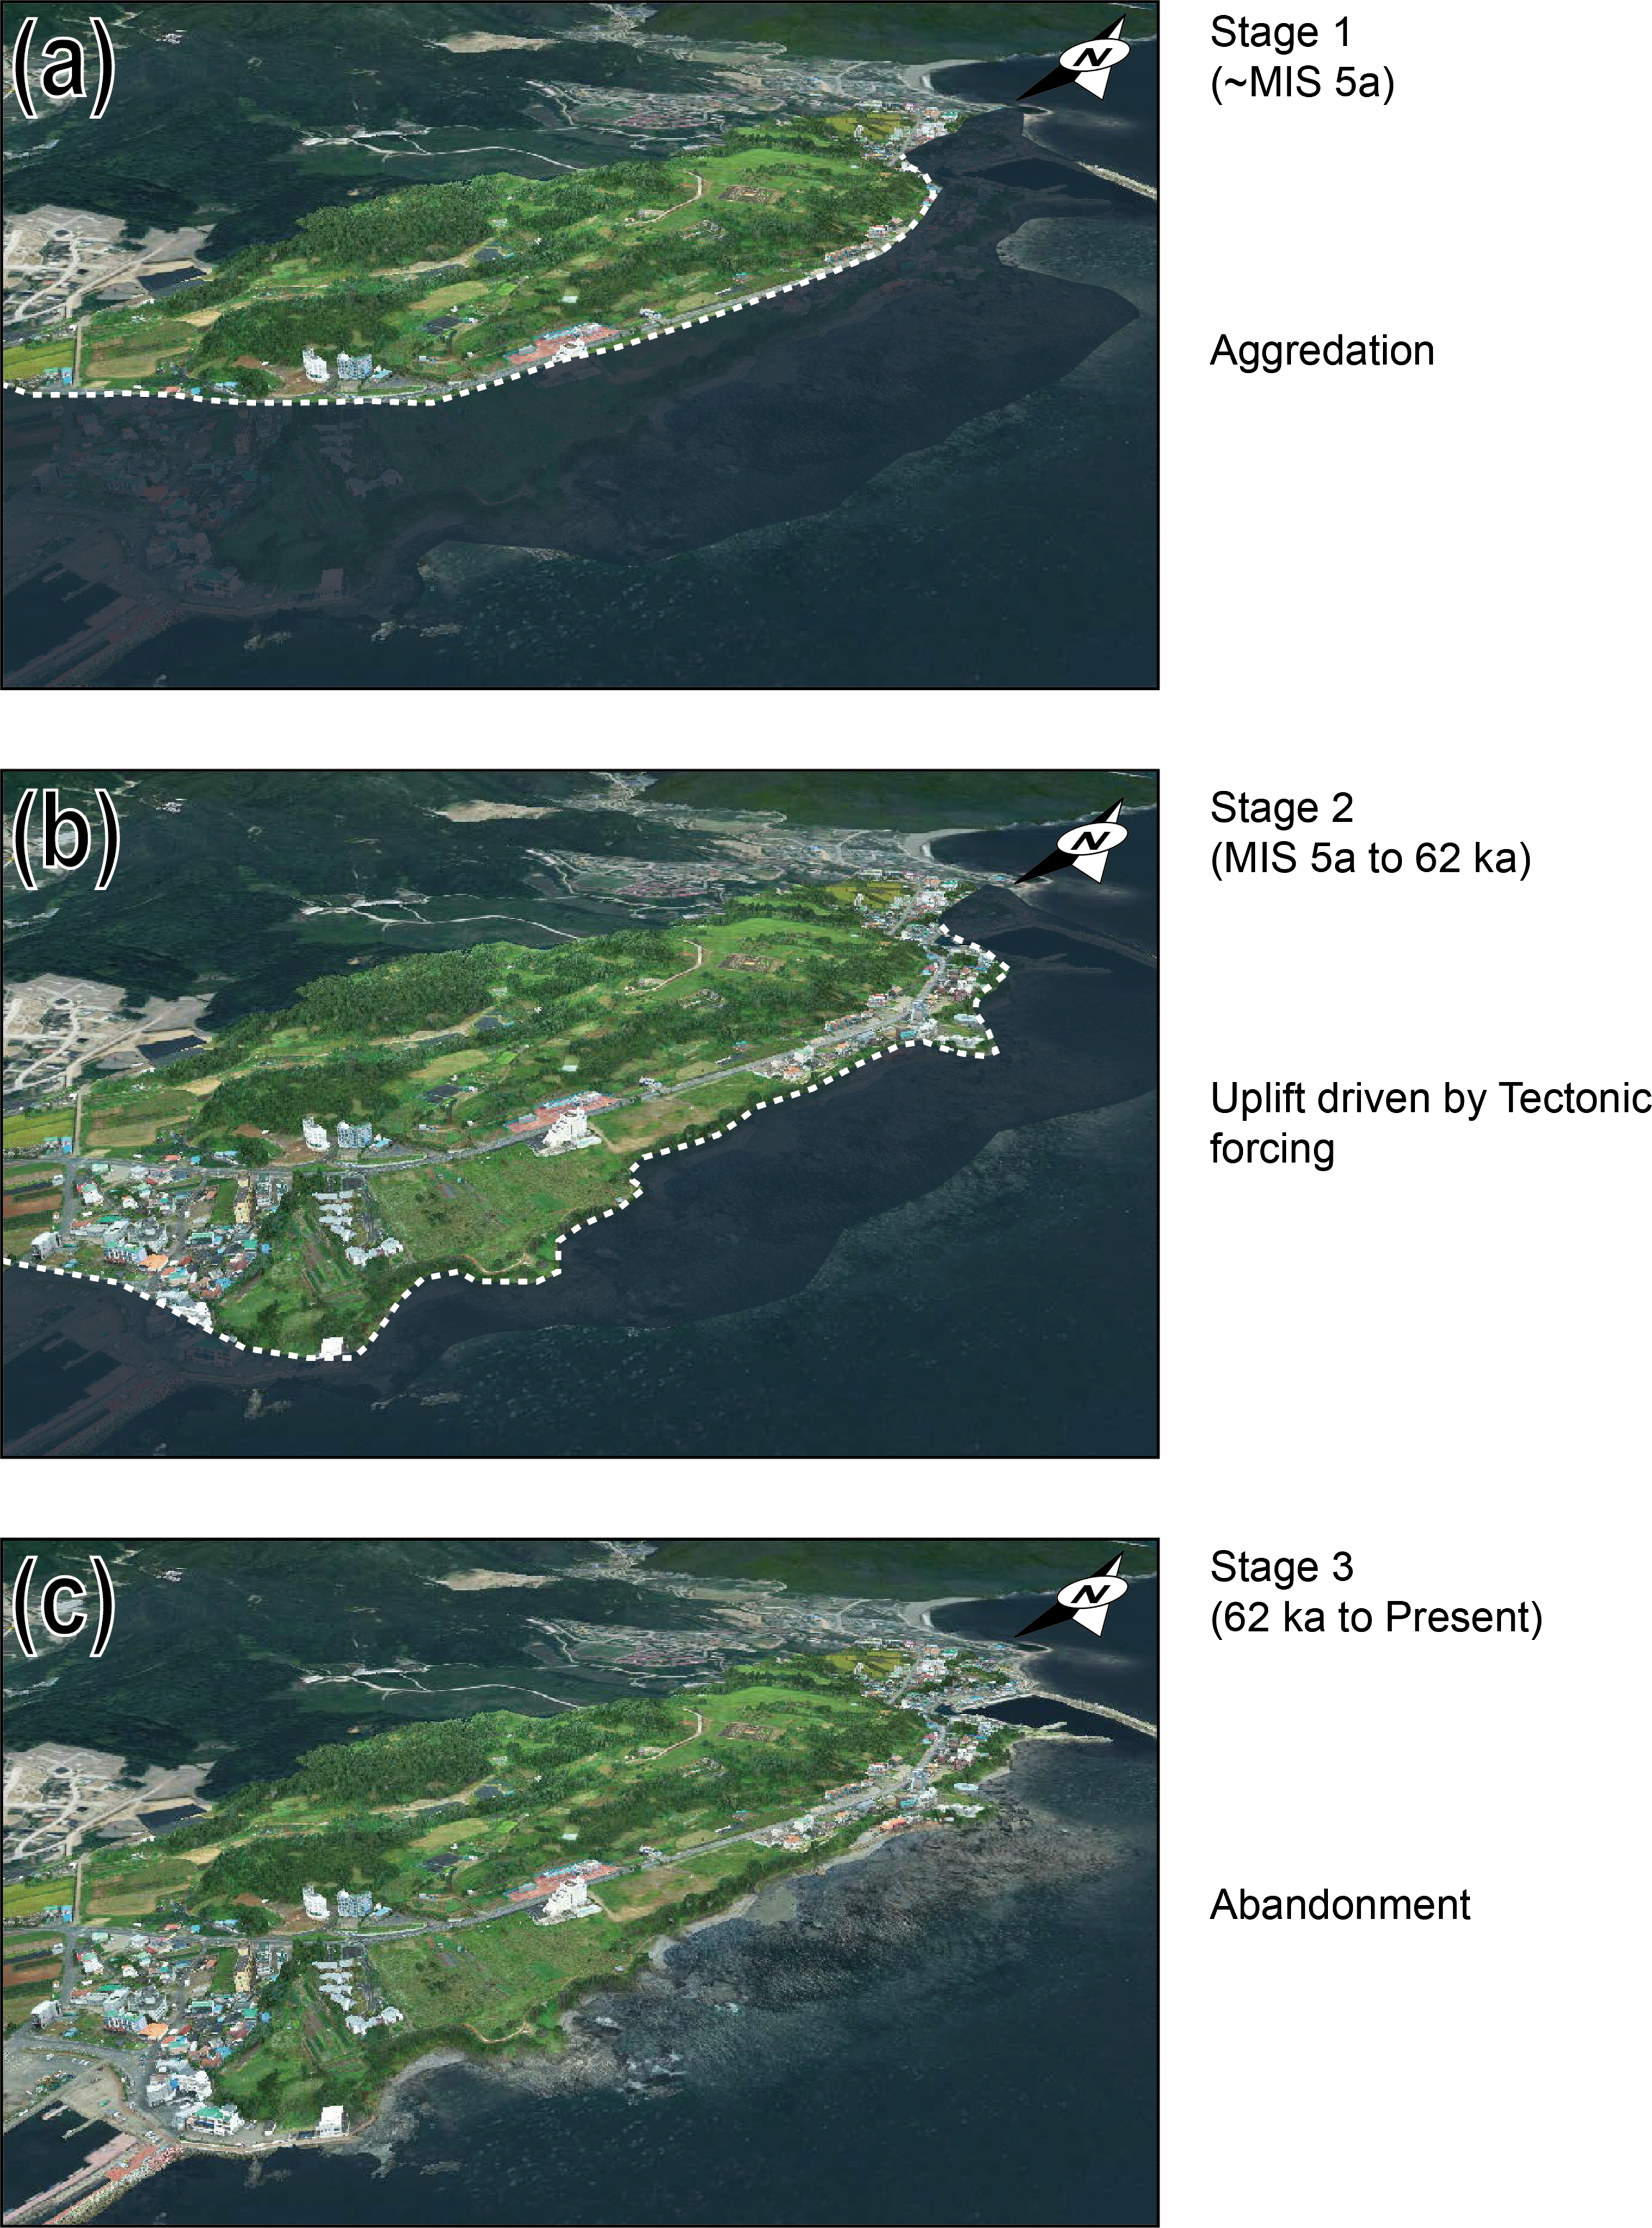
Conclusion
Marine terraces are surfaces that have been uplifted following aggradation of sediments on flat, wave-cut bedrock platforms. This study investigated the formation age and development of T2 in the Eupcheon area of Yangnam-myeon, Gyeongju, on the southeastern Korean Peninsula. A multidisciplinary approach was applied, integrating field surveys of stratigraphy, the use of UAV data to generate high-resolution DSMs, and the application of quartz OSL dating and 10Be profiling of sedimentary layers to establish terrace chronology. This work presents the first assessment of the chronology of T2 based on a combination of OSL dating and 10Be profiling and construction of the first high-resolution DSM of the terrace.
OSL ages of sediment samples of 71–67 ka date the time of abandonment (subaerial exposure) of the terrace. Cosmogenic 10Be depth profiling reveals that subaerial exposure occurred at or around 62–60 ka. An uplift rate of 0.44 mm/yr since abandonment was calculated using an age of 61 ka for terrace abandonment. This local uplift rate is higher than the regional uplift documented on the eastern Korean Peninsula (0.2–0.3 mm/yr), suggesting the influence of local fault-based tectonic activity and uplift since MIS 5a, consistent with the location of the study area to the east of the Ulsan Fault zone and the presence of numerous Quaternary fault outcrops in the study area. Application of our combined dating and high-resolution morphometric approach to other terraces along the eastern coast of the Korean Peninsula should lead to a more comprehensive understanding of the distinct timings and processes of terrace formation and development in specific regions.
Footnotes
Correction (September 2025):
Article updated online to correct the unit from m/yr to mm/yr since its original publication.
Declaration of conflicting interests
The author(s) declared no potential conflicts of interest with respect to the research, authorship, and/or publication of this article.
Funding
The author(s) disclosed receipt of the following financial support for the research, authorship, and/or publication of this article: This work was supported by The Korean Ministry of Science and ICT (GP2025-035) and Research on Potential Earthquake Characteristics of the Korean Peninsula Based on Intraplate Large Earthquake Recurrence Models (GP2025-013).