
Abstract
Sand dunes on barrier islands, such as North Bull Island in Dublin Bay, often provide natural defences against coastal erosion and storm surge impact on landward habitats, communities, and infrastructure. The ability of dunes to withstand erosion during a storm depends primarily on the height and extent of the foredune relative to the elevation of the storm surge, parameters that are highly variable alongshore. This study investigates the alongshore variations in the coastal protection provided by foredunes on North Bull Island during a 1-in-16-year storm, using a modified version of the FEMA-540 Rule. Results indicate clear alongshore variability in foredune morphology and vulnerability to extreme event-induced dune failure, with seven out of ten analysed foredune sections vulnerable during a 1-in-16-year storm. Alongshore variations in aeolian sand transport patterns observed on three on-/alongshore wind days hint at the cause for this alongshore variation in foredune morphology and vulnerability. Observed aeolian sand transport occurred primarily as streamers, varied significantly between days and alongshore, and was not explained by beach sediment moisture content or grain size, mean wind speeds, or wind direction. It was, however, significantly influenced by mean gust speeds. Overall, our study underscores the need for continuous measurement of aeolian sand transport and environmental variables at multiple alongshore locations and points in time to fully assess the coastal protection provided by foredunes. It also highlights the importance of adaptive management strategies to enhance sediment supply and retention, encourage foredune development, and bolster the ability of barrier islands to act as an effective natural barrier for low-lying landward coastal regions in the face of climate change and sea-level rise.
Keywords
Introduction
Barrier islands are elongated, shore-parallel depositional landforms composed primarily of unconsolidated sediment (Davis, 1994). These subaerial landforms can form as individual islands or extensive chains of islands that are a few kilometres in width and vary from tens to hundreds of kilometres in length (Barrineau et al., 2015; Hoyt, 1967). Each island’s morphology is different due to the depositional and erosional processes involved in its formation and the influence of wave, tide, and wind energy (Barrineau et al., 2015; Davis, 1994); however, they often share sedimentary features such as beaches, foredunes, dune ridges, barrier flats, salt marshes, washover fans, subaerial spits, and tidal flats (Leatherman, 1979; Oertel, 1985).
Barrier islands can protect coastal communities and ecosystems from extreme weather (Barrineau et al., 2015; NOAA, 2021; Spalding et al., 2014; Stone and McBride, 1998). Firstly, the island, dunes, and associated vegetation absorb energy from incoming waves (Mathew et al., 2019; Spalding et al., 2014). During a storm, if the foredune and dune ridges have an elevation greater than that of the storm surge, they can prevent overtopping, reducing the impact of the surge and the probability of coastal flooding (Houser et al., 2008; NOAA, 2021). Even if inundated during a storm, barrier islands may still provide coastal protection by creating friction and bathymetric resistance (Grzegorzewski et al., 2009). The absence of barrier islands has been linked to increased flood risk during hurricanes along the US Gulf Coast (Fritz et al., 2007; Irish et al., 2010; Penland and Suter, 1988).
The protective potential of barrier islands in the context of climate change is at risk given their dynamic nature and, according to Houser et al. (2015), depends on the rate of post-storm recovery, which is influenced by a combination of pre-storm dune height and sediment availability. The response of a given barrier island to future sea-level rise and storm surges, and whether it is overtopped or breached, thus depends largely on the elevation of the surge relative to the height and extent of the dunes (Houser et al., 2008), primarily the foredune. If the dunes are overtopped, and the surge carries and subsequently deposits sand onto the backbarrier environments, this is termed ‘overwashing’ and forms washover fans, accelerating the landward retreat of the barrier island and increasing the flood risk to the mainland (Figlus et al., 2011). Houser et al. (2008) observed the response of the Santa Rosa barrier island in north-west Florida to Hurricane Ivan (2004) and found that overwash and breaching tended to be more destructive where there were no or poorly developed dunes. Areas where the dunes were larger experienced less overwash and, historically, lower rates of shoreline erosion (Houser et al., 2008). Therefore, if of sufficient height and extent, dunes may prevent barrier erosion and drowning and slow the translation rate, even under moderate rates of sea-level rise (Masselink et al., 2011), allowing the barrier to act as a natural coastal protection measure now and in the future.
The Federal Emergency Management Agency (FEMA) in the USA established a size criterion for coastal dunes that ensures integrity against erosion during a 1-in-100-year storm (FEMA, 2018). This rule specifies that the frontal dune reservoir, defined as the area seaward of the dune crest and above the 100-year stillwater elevation (SWEL), must contain 540 square feet (50 m2) of sand (Figure 1). The SWEL represents the flood level, excluding the effects of waves but including the effects of astronomical tides, storm surges, wave set-up, and seasonal variations (FEMA, 2005, 2018). By modifying this rule, we can determine whether the dunes on a barrier island are of sufficient height and extent to provide coastal protection against a storm surge of a given elevation (Mehrtens et al., 2023). Illustration of the terminology used in the FEMA-540 Rule. The relevant dune features, including the frontal dune reservoir, are shown for two types of coastal dunes. Source: recreated based on FEMA (2018), p. 12.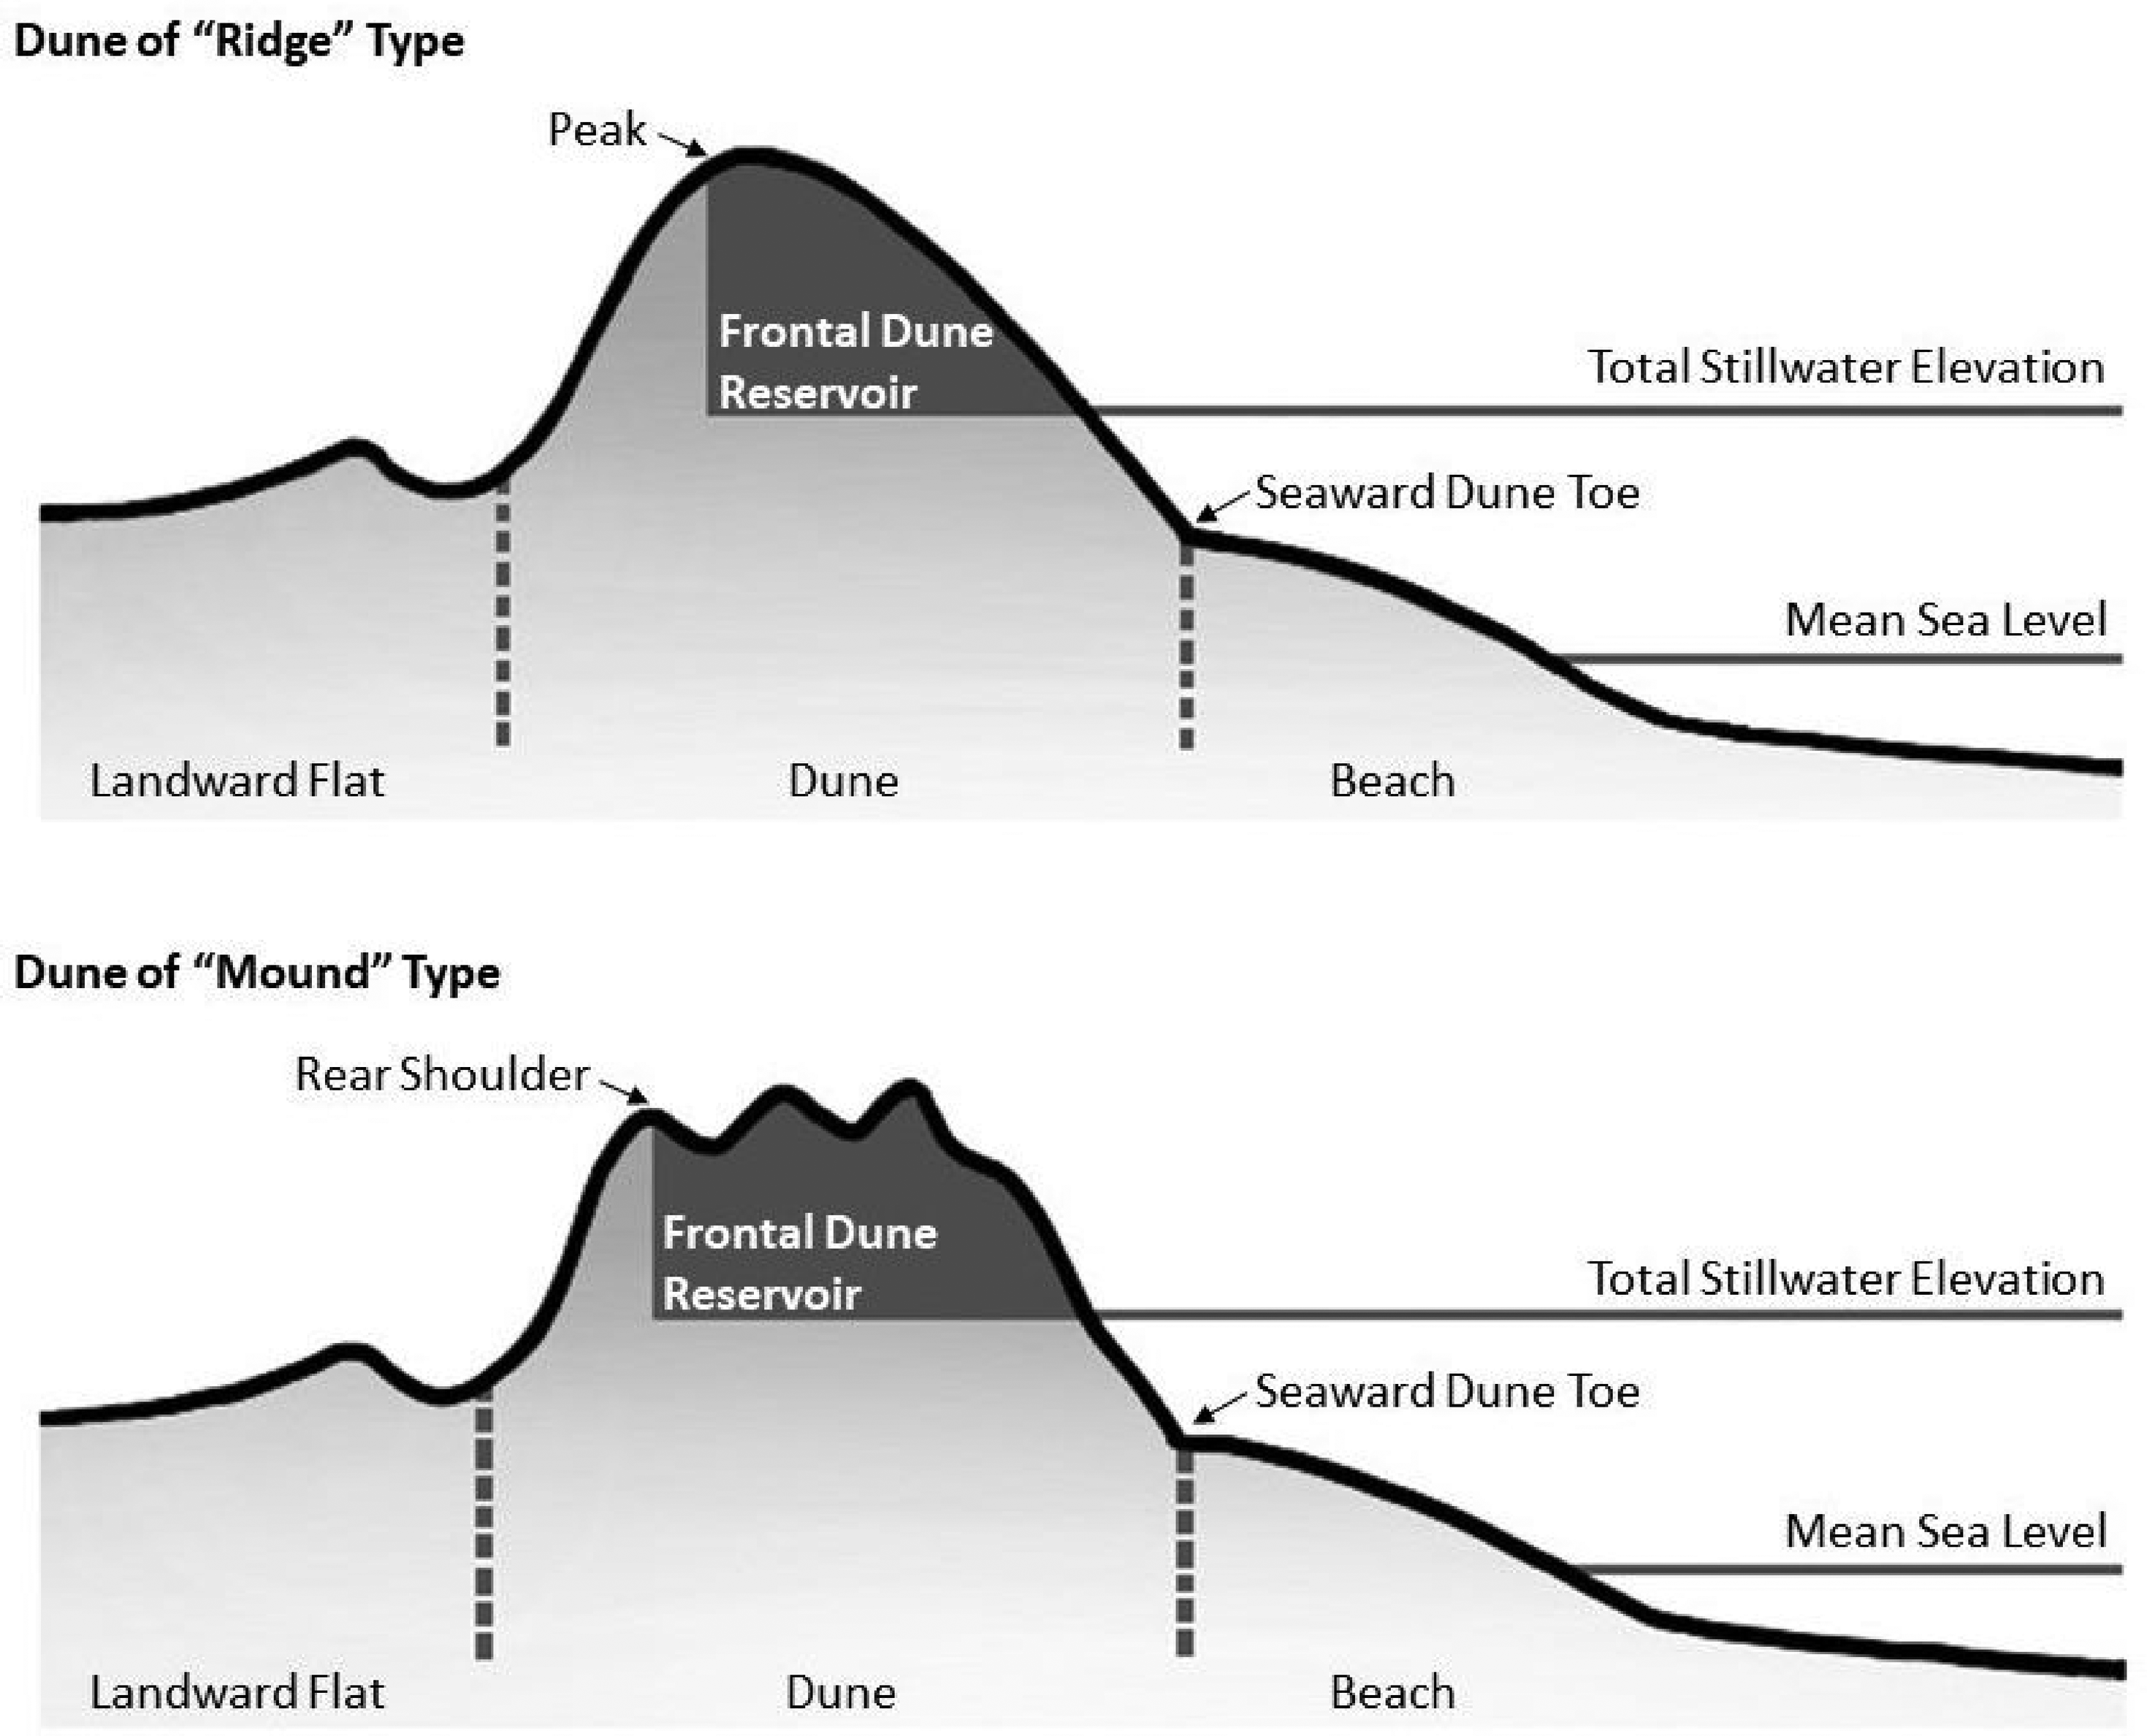
Coastal dunes are generally composed of fine to medium-grained (125–500 μm) well to very well-sorted sands and are complex landforms due to their interactions with terrestrial, oceanic, and atmospheric systems (Pye, 1983). The form, height, and volume of coastal foredunes depend on the amount of sand supply, which is influenced by a combination of aeolian and nearshore processes (Davidson-Arnott et al., 2018). Key factors influencing aeolian sand transport and, thus, the morphology and development of coastal dunes at a local to regional scale include wind regime, sand supply, vegetation, and physiographic setting (Davidson-Arnott et al., 2018; Husemann et al., 2024; Pye, 1983). Given its dependency on beaches as a sand source, dune morphology may be further influenced by variations in beach morphology, sediment moisture content, sediment grain size, and wave energy along the shore (Husemann et al., 2024; Pye, 1983). Where dunes provide protection to backbarrier habitats, communities, or infrastructure, a better understanding of the alongshore variation in (a) foredune morphology (and ability to withstand extreme storm surge conditions) and (b) delivery of sand into the dunes is critical.
In this study, we combine (a) a morphometric assessment of alongshore variability in dune geometry indicative of resilience against storm surge impact with (b) instantaneous observations of alongshore variability in aeolian sand transport into dunes, to explore whether this dual approach can form the basis for a practical alongshore assessment of the capacity of frontal dunes to (a) withstand extreme storm surge conditions and (b) strengthen their morphological resilience to such events into the future. We do so on a barrier island protecting the port and northern suburbs of Ireland’s capital city, Dublin.
Study area
North Bull Island/Oileán an Tairbh Thuaidh, hereafter referred to as ‘Bull Island’, is a barrier island in northern Dublin Bay, a 10 km wide bay on Ireland’s east coast (Figure 2), where bar-built estuaries dominate the coastal system (Cooper, 2006). Dublin Bay is a shallow, horseshoe-shaped bay bordered by Howth Head, a quartzite headland to the north, and Killiney Hill, a granite headland to the south (Figure 2) (Minogue et al., 2020). The River Liffey enters the shallow inner bay between the North and South Bull Walls. The tidal regime in Dublin Bay is semi-diurnal and mesotidal (mean tidal range of 2–4 m) with a clockwise tidal current (Cooper, 2006; Harris, 1977). In the early nineteenth century, the building of the North and South Bull Walls altered tidal currents within the bay such that sediment began accumulating on what was then the North Bull sand bank, gradually building up to form Bull Island (Kennedy, 1949). Recently, sea-level rise is thought to have been accelerating within the bay from 1 mm yr−1 between 1953 and 2016 to 7 mm yr−1 between 1997 and 2016 (Shoari Nejad et al., 2022), raising questions about the island’s geomorphological future. Study area: North Bull Island (c) within Dublin Bay (b) on the east coast of Ireland (a). The inset box in (a) indicates the extent of (b), and the inset box in (b) indicates the extent of (c). In (b), A = Howth Head, B = Clontarf, and C = Sutton. In (c), D = the North Bull Wall and E = Sutton Creek. Source: Satellite imagery from Maxar.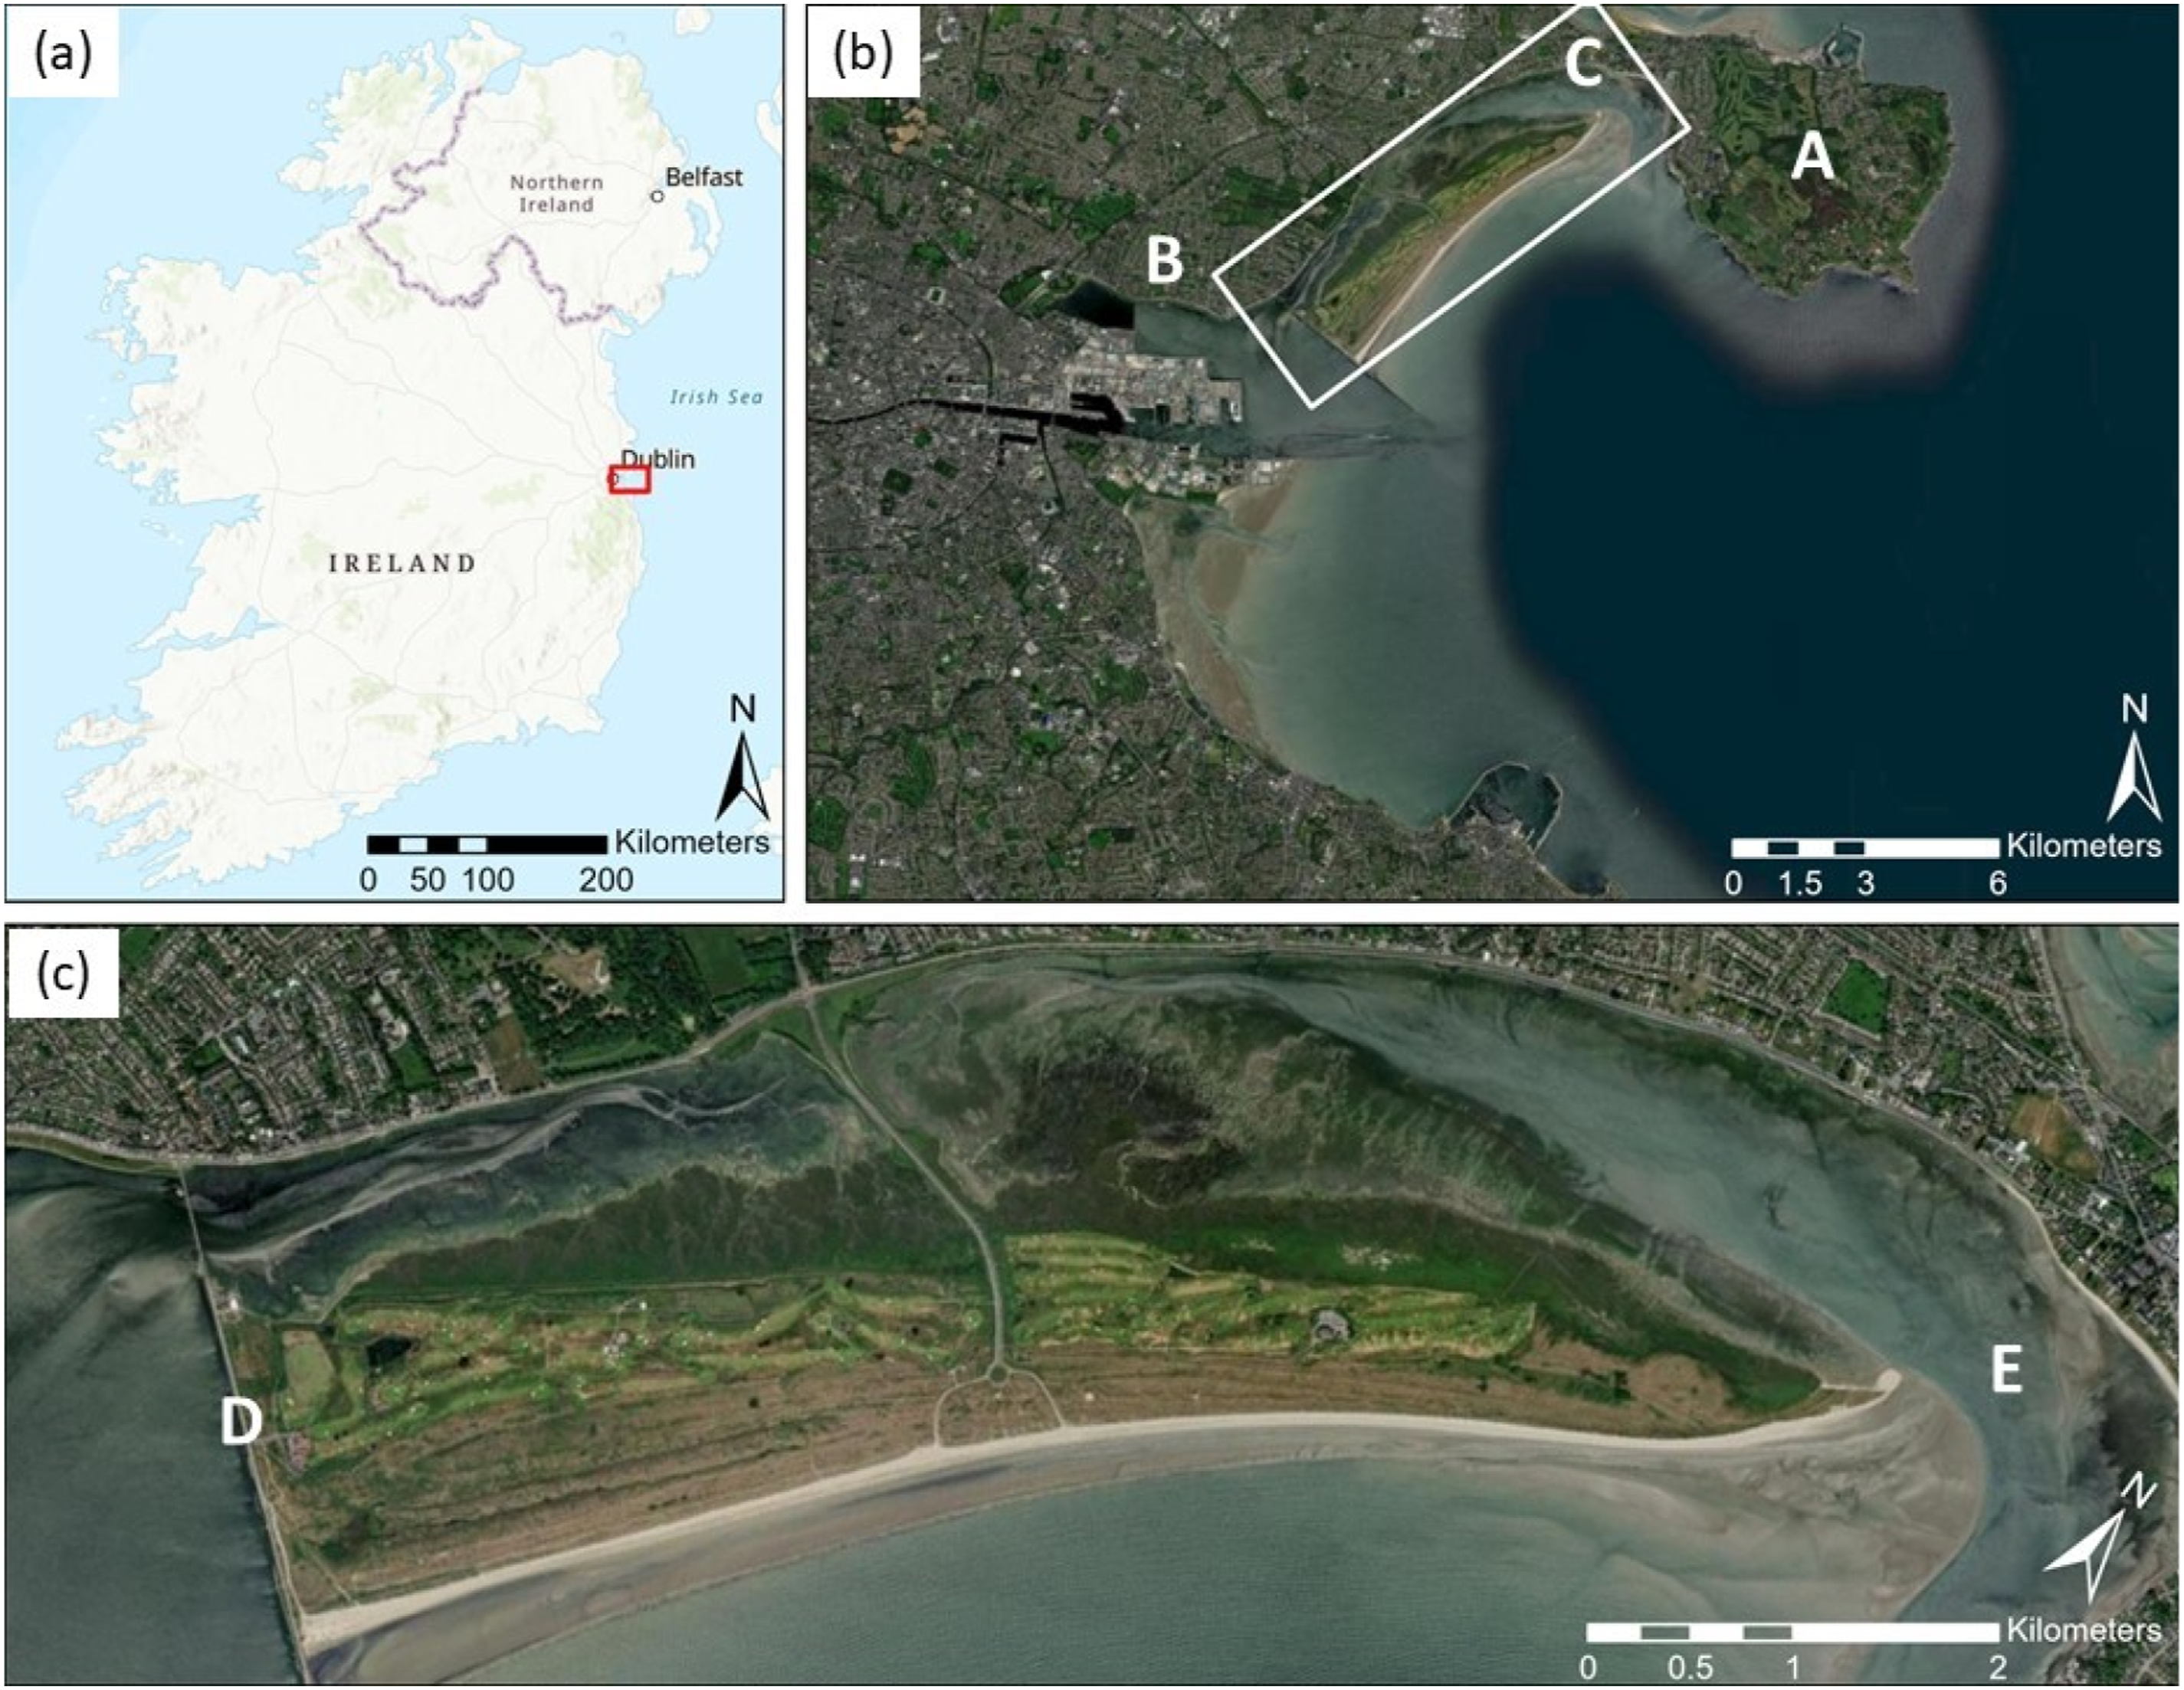
Bull Island is oriented north-east (width around 200 m) to south-west (width around 1 km) along a section of approximately 5 km parallel to the mainland between Clontarf and Sutton, bounded in the south by the Bull Wall and in the north by Sutton Creek (Harris, 1977; Kennedy, 1949; Mathew et al., 2019) (Figure 2). A causeway constructed in the 1960s extends across the backbarrier lagoon providing an additional point of contact with the mainland (Harris, 1977). The beach, Dollymount Strand, extends along the seaward side of the island. The width of the beach during low tide ranges from 600 m in the south to 900 m towards the north (Gibson et al., 2014). The beach surface slope is greater at the south-western end than at the north-eastern end of the island (Gibson et al., 2014). The dune complex extends the length of the island and is roughly 840 m wide in the south, gradually thinning towards the north (Gibson et al., 2014; Mathew et al., 2019). The dunes range in height from 1 to 4 m above Ordnance Datum Malin Head (hereafter ‘OD’, which is 2.51 m above Mean Sea Level at Dublin Port) at the southern and northern ends to more than 9 m OD in the centre (Gibson et al., 2014; Mathew et al., 2019).
While Mathew et al. (2019) reported accretion rates of 3.4 m yr−1 for the dunes along the north-eastern end between 1952 and 2013, McClung (2021) showed that between 2005 and 2021, rather than accreting, the dunes along the north-eastern portion of the island have been eroding at a rate of −0.6 m yr−1. An examination of satellite imagery using Google Earth Pro for the period since 2021 shows that the seaward vegetation line along the north-eastern portion of the dune complex has continued to retreat, eroding up to 29 m at points. While Bull Island has withstood sea-level rise thus far, the acceleration in sea-level rise at Dublin Port since 1997 (Shoari Nejad et al., 2022) and the increasing frequency and magnitude of extreme storm events in Ireland since 2014 (Met Éireann, 2022), coupled with the greater magnitude of onshore winds and waves since 2013 (McClung, 2021), has taken its toll on the island’s north-eastern tip and dune complex. As a barrier island, Bull Island has the potential to protect the low-lying coastline of north Dublin against the impacts of climate change. It is unknown, however, to what extent the island’s dunes are vulnerable to storm impacts and can thus be relied on as nature-based coastal protection for the intertidal backbarrier marshes and lagoons under a climate-changed future. It is further unclear whether the recent erosion of the dune complex on the north-eastern end is indicative of an alongshore pattern in the ability (or lack thereof) of the dunes to regenerate in the aftermath of extreme storm events through landward sand transport.
Data and methods
An exploratory visit to the island found a breach in the dune complex ∼100 m from the north-eastern tip of the island; while not far south from this breach, the dunes are well-established and taller. To capture this geomorphological transition (and the associated potential differences in sediment properties, wind conditions, and (micro-)topography), 10 dune transects (1 to 10) were established at an even spacing of ∼83 m along this 750 m long north-eastern end of the island (beginning 10 m from the north-eastern tip of the dune complex), for foredune topographic surveys and vulnerability analysis. We selected dune transects 1, 4, 7, and 10 as locations for capturing variability in sand transport along this geomorphological transition. As such, four transects evenly spaced at ∼250 m intervals were established along the upper beach. As we were particularly interested in alongshore variations in upper shoreface sand transport and delivery to the dunes, each beach transect extended seaward from the dune toe 18 m across the backshore (Figure 3). The dune toe is the junction between the gentle slope of the upper backshore and the relatively steep slope of the foredune face (FEMA, 2018), identified visually in the field as the point where there is a marked break in slope at the base of the foredune, that is, where the gentle slope of the upper beach visibly breaks and transitions to the steeper dune front. Aeolian sand transport was measured over 30-minute periods at each beach transect on 3 days (A to C) in June 2023 (9th, 14th, and 27th). Data relating to the following was collected, processed, and analysed: topographic profiles, beach surface characteristics (moisture content and grain size), wind characteristics (wind speed, gust speed, and wind direction), and aeolian sand transport. Experimental set-up (not to scale). The inset box in (a) denotes the location of (b) on Bull Island. Beach transects 1 to 4 and dune transects 1 to 10 are depicted (b). Triangles denote sand traps, and circles indicate beach surface sediment sample locations upwind of the sand traps (in this instance, for a north-easterly wind). All distances between transects and apparatus are indicated (metres). Source: Satellite imagery from Maxar.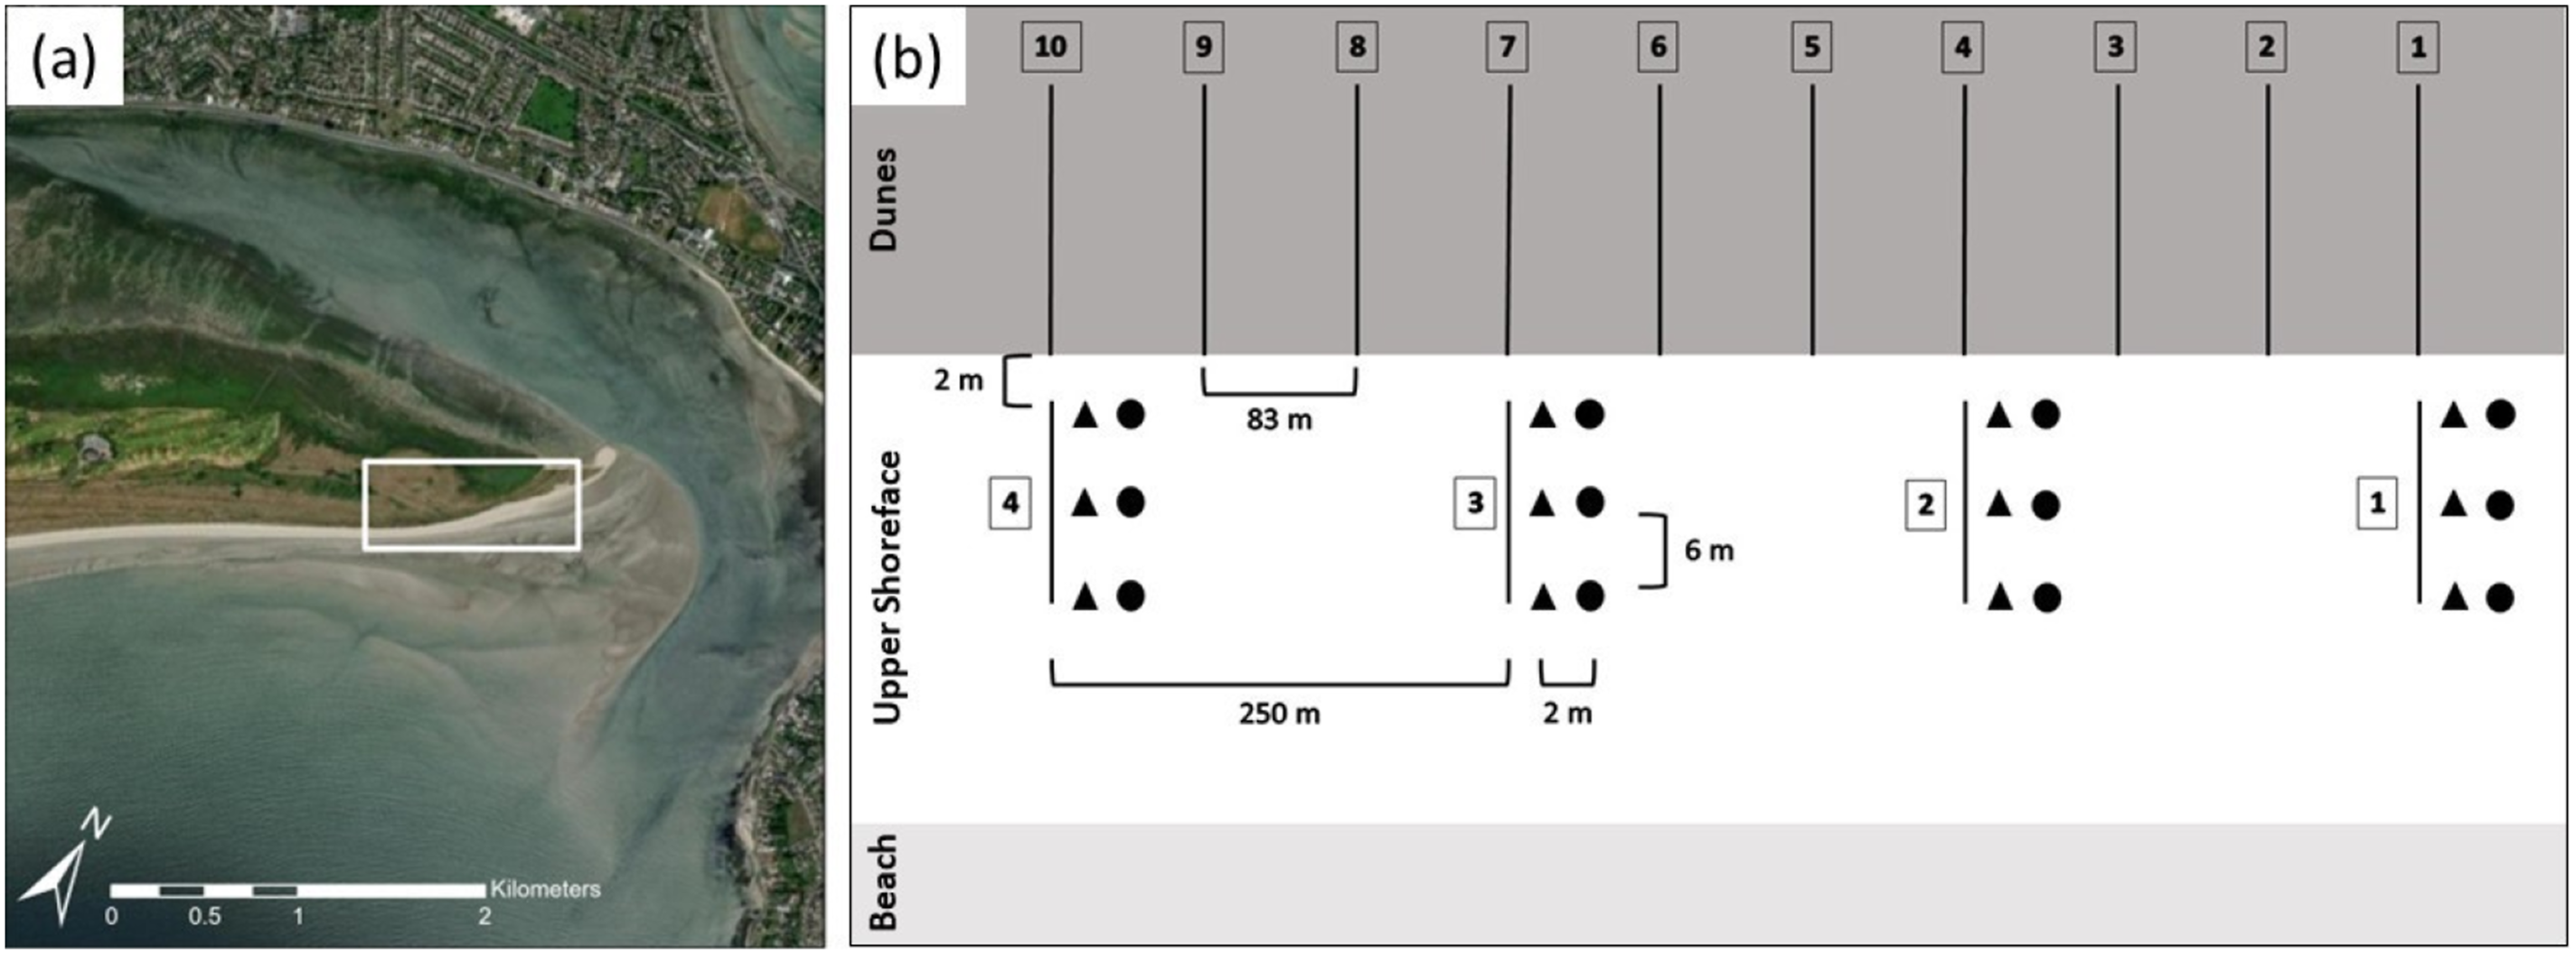
Data collection and processing
Topographic profiles and foredune vulnerability analysis
A Trimble R8S integrated GNSS system was used to obtain the elevation relative to OD at 1 m intervals across the ten dune transects (only as far as it was safe and possible to do so) and four beach transects on the 6th of July, 2023.
This data was used to create ten topographic profiles, four of which encompassed both a beach and dune transect, extending from the lower backshore towards the mainland, and six of which began at the seaward dune toe and extended towards the mainland (Figure 3). The slope across each beach transect was calculated by dividing the elevation gain from the most seaward point on the transect to the dune toe (change in y) by the horizontal distance between the most seaward point on the transect and the dune toe (change in x). Although not calculated, fluctuations in the slope and microtopographic variations across each beach transect were noted and considered during the analysis of our results (see sections 4.1 and 4.5).
The FEMA-540 rule was modified and applied to determine if the foredune section in each topographic profile could withstand erosion due to a storm surge of equal magnitude to that during Storm Emma. Snow Storm Emma hit Ireland between the 28th of February and the 4th of March 2018, coinciding with a spring tide, which, coupled with strong easterly winds, exacerbated the impacts of the storm surge on Ireland’s east coast (Met Éireann, 2019). The rule was modified in that the SWEL reached during Storm Emma, estimated to have been a 1-in-16-year storm (Ferreira et al. (2019), was substituted for the 1-in-100-year SWEL. To determine the SWEL during Storm Emma, a dataset containing water-level recordings at the Dublin Port Tide Gauge every 5 minutes between the 27th of February and the 5th of March 2018 was obtained from the Marine Institute ERRDAP server. The maximum water level recorded in Dublin Port during the storm period was taken as the SWEL. Additionally, by inputting increasing Storm Surge Level (SSL) values, the Critical Storm Surge Level (CSSL), the maximum SSL for which an adequate amount of sand is stored in the frontal dune reservoir (Mehrtens et al., 2023), was calculated for any foredune sections that could withstand erosion during a 16-year storm.
Beach sediment characteristics
During each experiment day, a surface sediment sample was taken 2 m upwind of each sand trap location (accounting for spatial variations in wind direction), with three sand trap locations on each of the four beach transects (see section 3.1.4), yielding a total of 12 samples. Taking samples 2 m upwind of each trap ensured that the characteristics determined for the samples were representative of the sand being transported and collected by the traps. The samples were taken using a trowel and ruler from a constant depth of 3 cm below the surface, following Gares et al. (1997) and Namikas et al. (2010), whose work suggests that 3 cm is an appropriate depth to ensure consistency across the study site and experiment days while still being representative of surface conditions. Once collected, the samples were sealed in plastic bags to prevent evaporation and stored in a cool room overnight. The samples were weighed in the lab using a 2-point analytical balance to obtain their ‘wet weight’ before being dried in a Memmert oven at 65°C for 48 hours, left to cool for 10 minutes in a silica gel desiccator to prevent moisture reabsorption (Wiggs et al., 2004), and reweighed to obtain their ‘dry weight’ and the percentage moisture content.
Surface sediment samples were collected in the same manner for grain size analysis on day A. Size distribution analysis was carried out for each of the 12 samples using a Malvern Mastersizer 3000 laser diffractometer. Sample preparation and Mastersizer programming followed the optimal method determined by Sperazza et al. (2004). GRADISTAT version 9.1 was used for determining grain size distribution summary parameters (Blott and Pye, 2001).
Wind characteristics
Wind data were obtained from the Commissioners of Irish Lights (CIL) sensors installed on the MetOcean Dublin Bay Buoy (DBB), a safety marker 6 km offshore between Howth and Dun Laoghaire. Data from the DBB are posted to an automatic X feed (@DublinBayBuoy) every 30 minutes. This feed was monitored while in the field to obtain the 30-minute mean wind speed, gust speed, and wind direction for each 30-minute sampling period and corresponding alongshore position. The wind direction reported by the DBB was used when positioning the openings of the sand traps (see section 3.1.4). A handheld anemometer was used to confirm any potential deviations between the DBB-recorded wind conditions and those present on the beach at the time of sampling.
Aeolian sand transport
Three v-shaped, or wedge-shaped, vertical aeolian sand traps, modelled on those designed by Nickling and Neuman (1997), were used on each day at each of the four transects. The traps were installed at 6 m intervals across each beach transect, at 2 m (upper backshore), 8 m (middle backshore), and 14 m (lower backshore) from the dune toe (Figure 3). All traps were positioned above mean high water neap (MHWN) level (0.99 m OD) with the lower lip flush with the beach surface and the receptacle, a plastic cup attached to the bottom of the trap, buried beneath the surface. The traps were oriented with their openings facing the predominant wind direction (see section 3.1.3). The mesh back of the traps was not interfered with to allow unimpeded airflow and ensure isokinetic sampling (Nickling and Neuman, 1997). The traps were opened simultaneously at the beginning of each 30-minute sampling period. After 30 minutes, they were closed and tilted from side to side to allow the trapped sand to fall into the receptacle. The cups were detached and sealed, and the procedure was then repeated at the remaining transects. After each experiment day, the sand trapped at each of the 12 stations was weighed using a 4-point analytical balance. The weight of the sand trapped will henceforth serve as a proxy for sand transport rates at each station and will be referred to as ‘transported sand’ or similar.
Statistical data analysis
RStudio version 2023.06.1 was used to investigate temporal (between experiment days) and spatial (alongshore and cross-shore) variations in transported sand, beach sediment characteristics, and wind characteristics. The data relating to transported sand, surface sediment moisture content, and surface sediment grain size were not normally distributed and were transformed using the Box and Cox (1964) method before employing parametric tests. The data relating to wind characteristics were not normally distributed, nor did transforming make them normally distributed. Thus, non-parametric tests were used to analyse these data. It was then determined whether statistically significant relationships existed between transported sand and the aforementioned variables.
One-way analysis of variance (ANOVA) and Tukey’s Honest Significant Differences (HSD) post-hoc tests were used to determine if there was significant variation in the mean amount of transported sand and surface sediment moisture content between experiment days. Kruskal–Wallis and Dunn’s post-hoc tests (with the Holm (1979) method of p-value correction) were used to determine if there was significant variation in the mean (across the four 30-minute sampling periods) wind speed, gust speed, and wind direction between experiment days. Two-way ANOVA and Tukey’s HSD post-hoc tests were used to determine if there was significant alongshore (between transects) and cross-shore (between the upper, middle, and lower backshore trap positions at each transect) variation in the mean amount of transported sand, surface sediment moisture content, and surface sediment grain size on each experiment day (this was only carried out once for surface sediment grain size). Variation in wind characteristics between transects on each experiment day was analysed by calculating the coefficient of variation (CV).
Potential relationships between the variables were investigated using the cor.test function. The raw, non-transformed data was used here to prevent misinterpretation of relationships. Spearman’s correlation coefficient (rs) was used as it does not make assumptions about the distribution of the data. A 95% confidence level was applied throughout.
Results
Topographic profiles and foredune vulnerability analysis
Figure 4 shows topographic profiles 1 to 10. The maximum dune crest elevation, defined and identified as the peak with the maximum elevation along the topographic profile (Mehrtens et al., 2023), was 7.17 m OD (profile 10), corresponding to a dune height of 4.90 m. The minimum dune crest elevation was 3.11 m OD (profile 2), corresponding to a dune height of 1.08 m. Topographic Profiles 1 to 10. Elevation (m OD) is on the y-axis, and distance (m) seaward (positive) and landward (negative) of the dune toe (0) is shown on the x-axis. Profiles (1) to (10) correspond to dune transects 1 to 10, with profiles (1), (4), (7), and (10) also encompassing beach transects 1 to 4, respectively. Sand trap locations are indicated by the circular points in profiles (1), (4), (7), and (10). The horizontal dotted line in each profile represents the elevation of Mean High Water for a spring tide, and the horizontal dashed line represents the elevation of Mean High Water for a neap tide.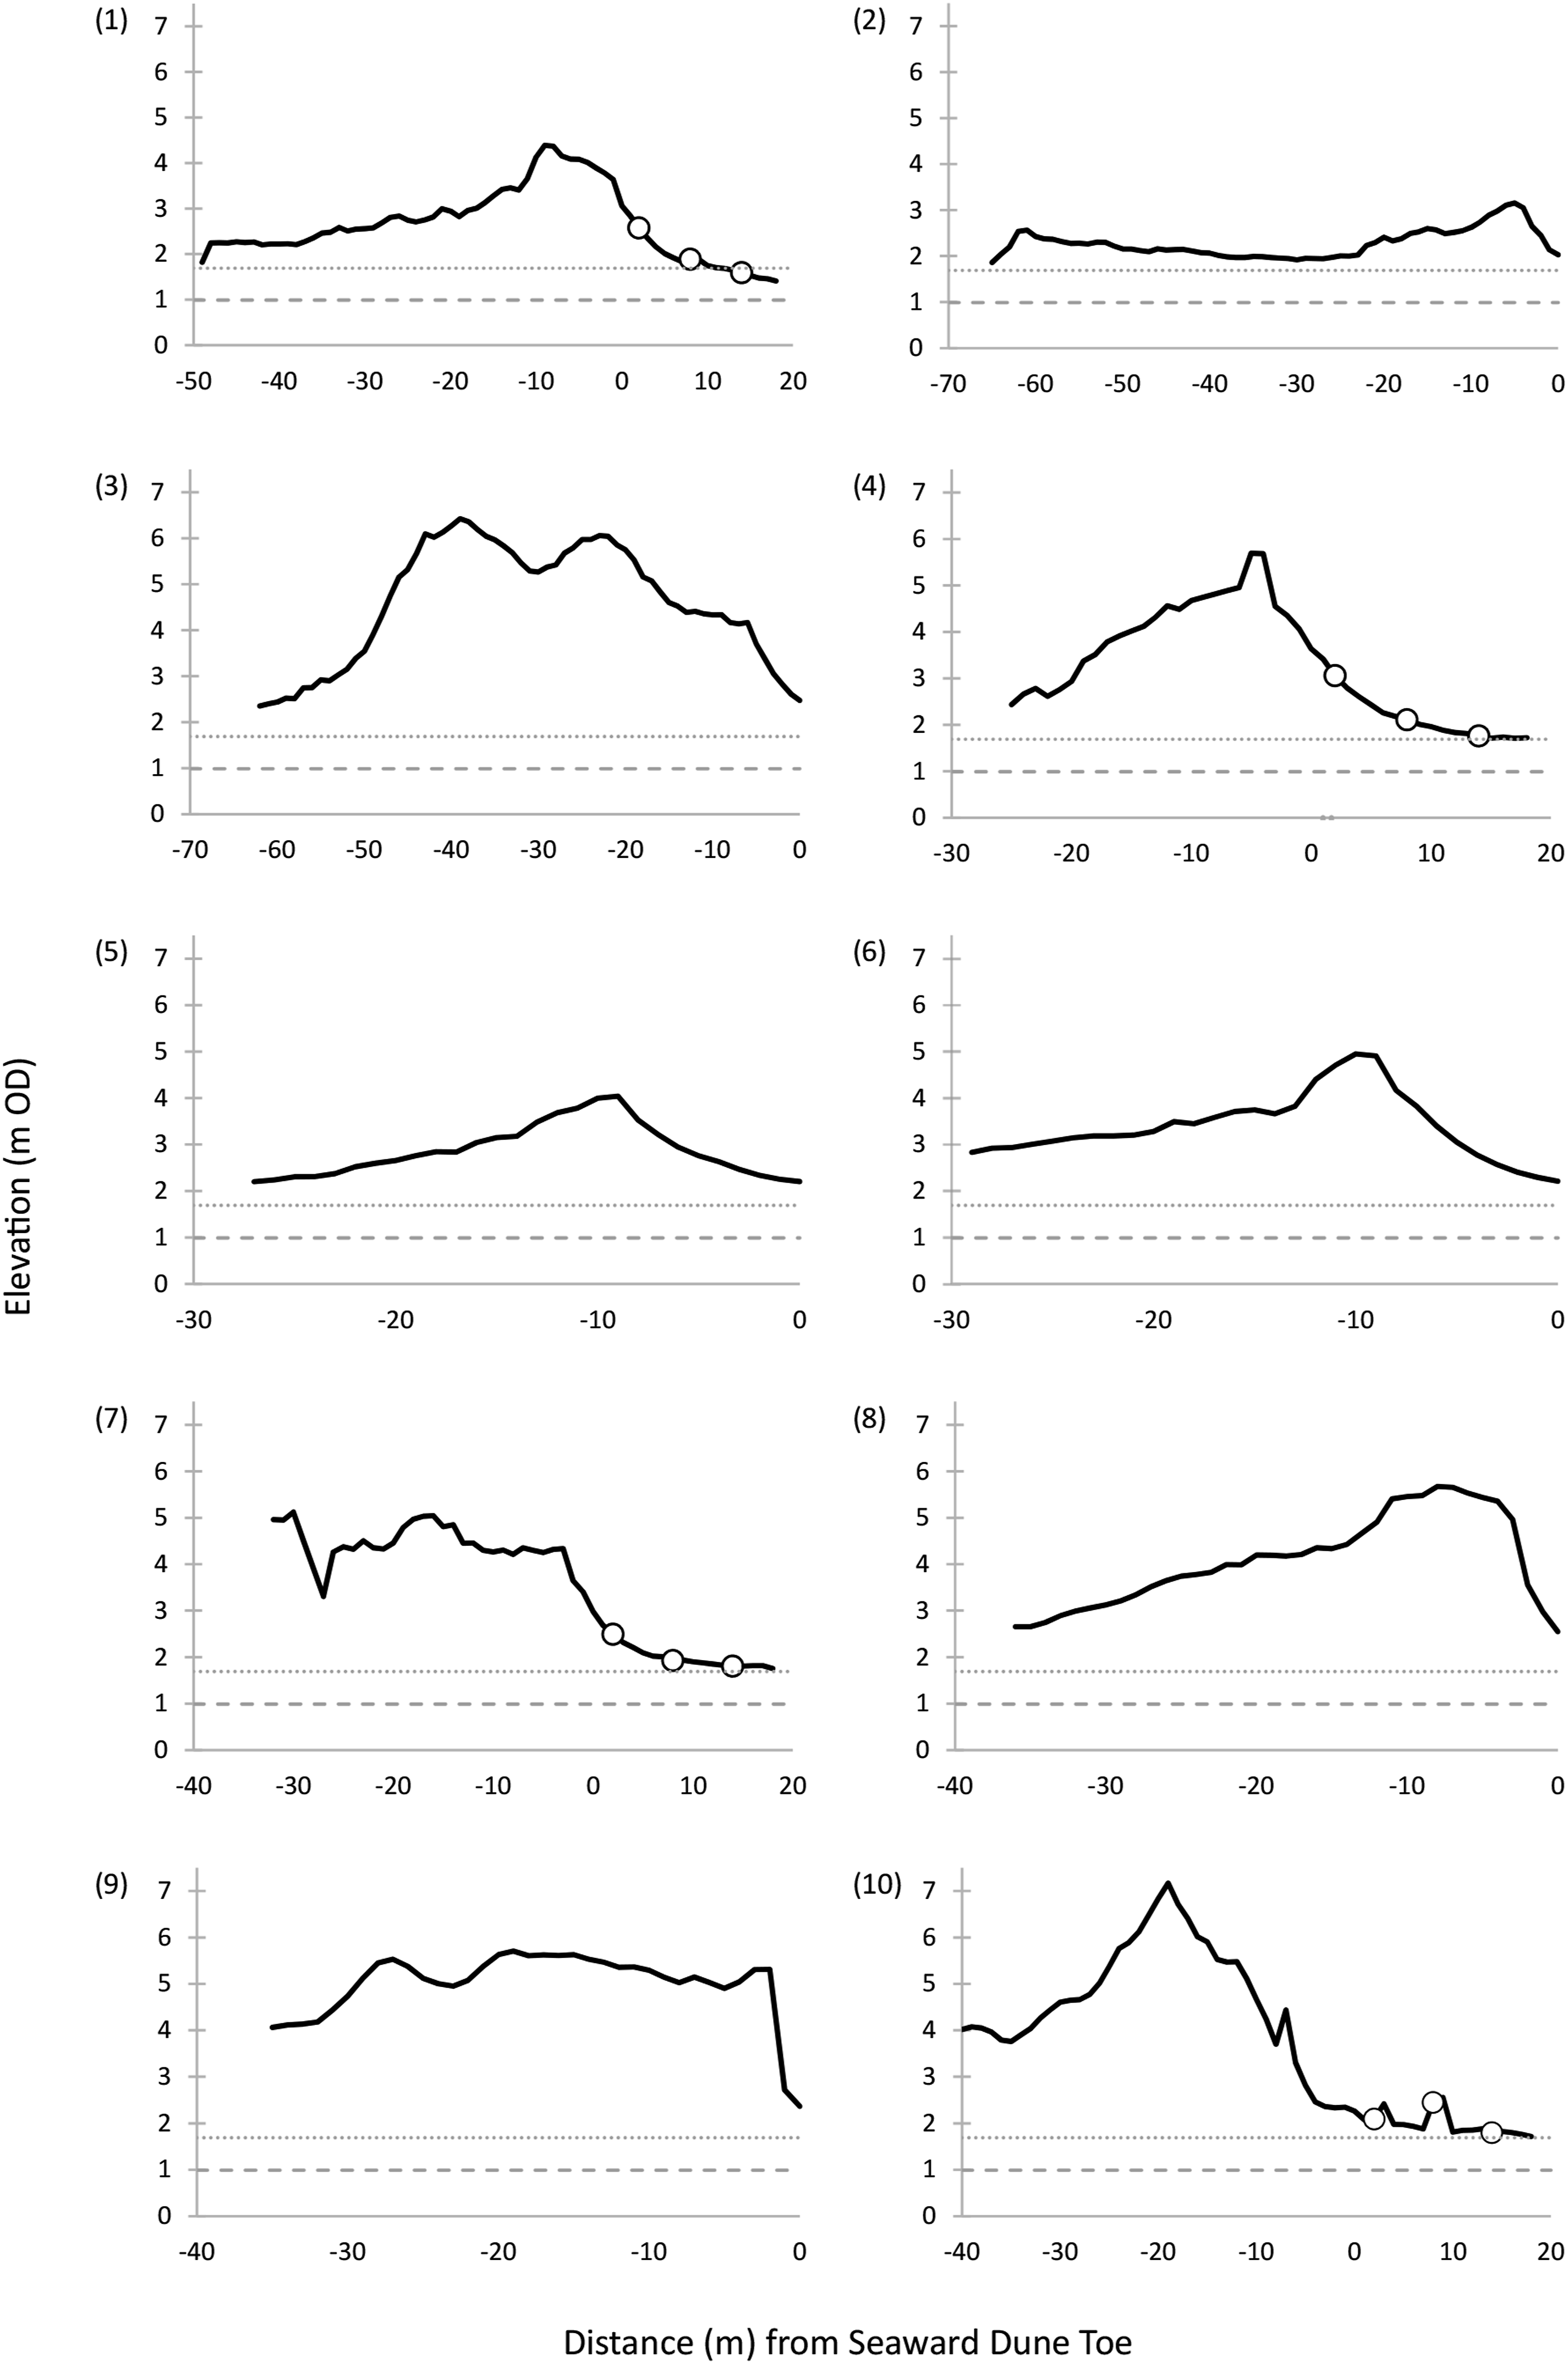
Frontal Dune Reservoir Cross-Sectional Area for Topographic Profiles 1 to 10 and CSSLs for Those profiles With Frontal Dune Reservoirs of >50 m2.

Beach sediment characteristics
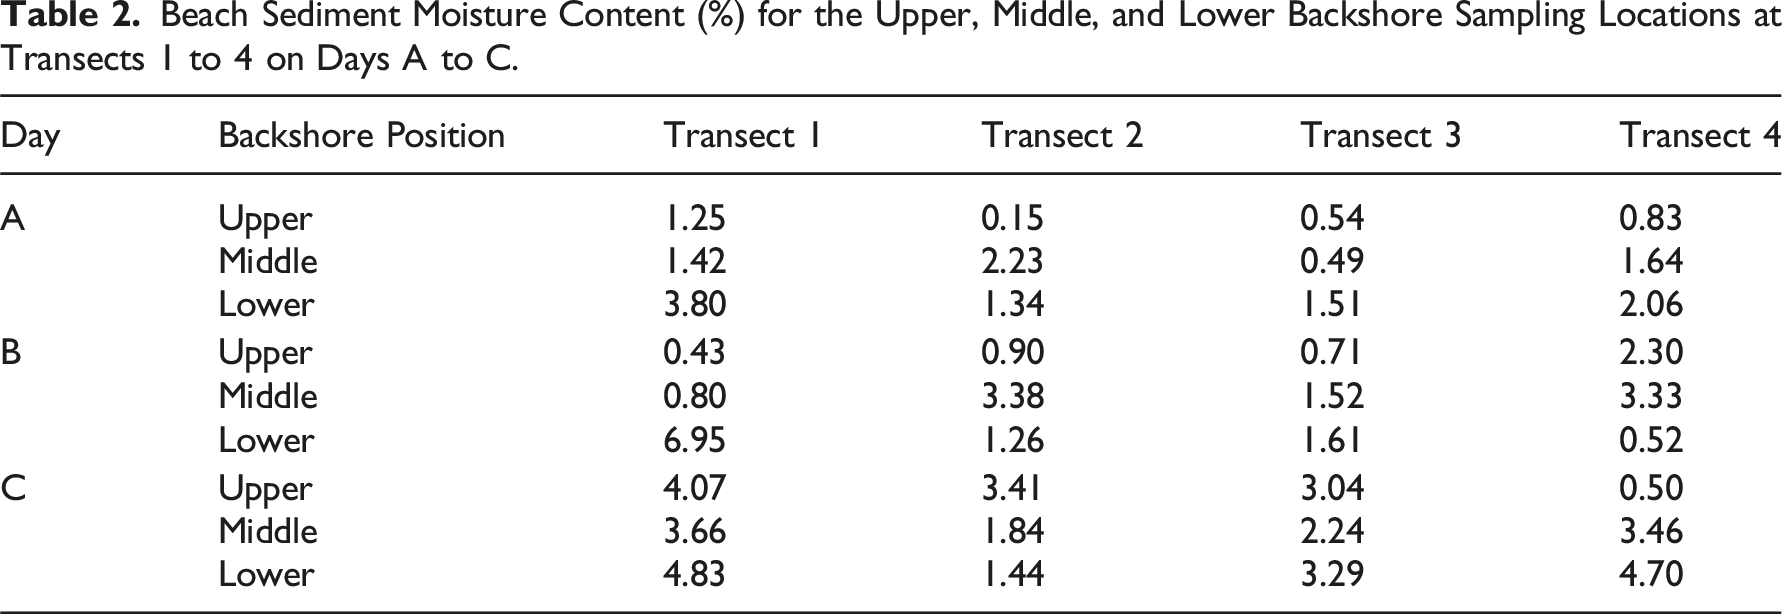
Beach Sediment Moisture Content (%) for the Upper, Middle, and Lower Backshore Sampling Locations at Transects 1 to 4 on Days A to C.
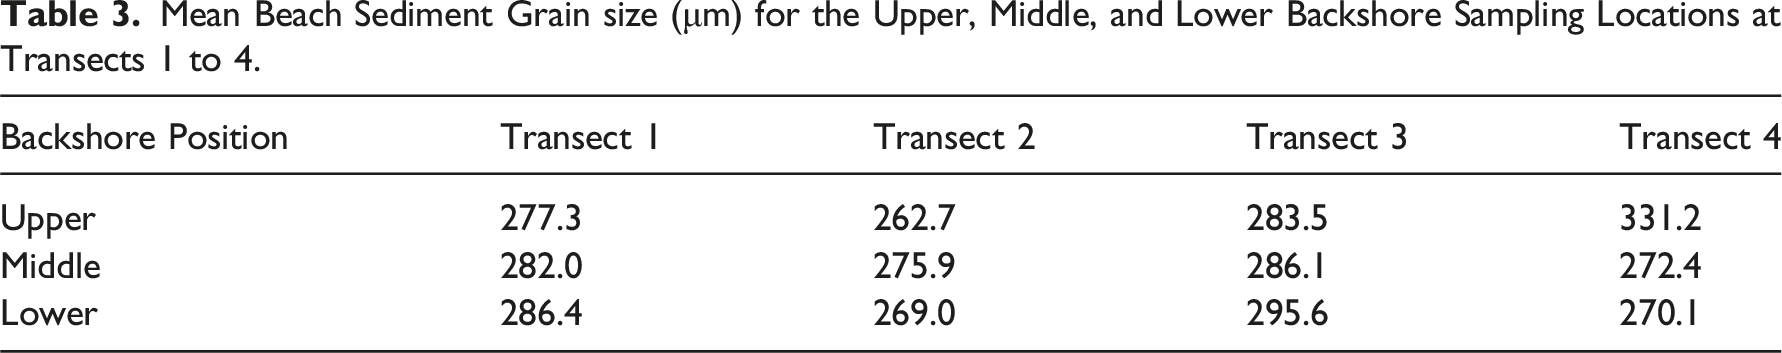
Mean Beach Sediment Grain size (μm) for the Upper, Middle, and Lower Backshore Sampling Locations at Transects 1 to 4.
Wind characteristics
30-Minute Mean Wind Speed (km/h) (WS), Gust Speed (km/h) (GS), and Wind Direction (WD) (Degrees From North) for the Sampling Period at Beach Transects 1 to 4 on Days A to C, and the Coefficient of Variation (CV) (%) Between These Values.
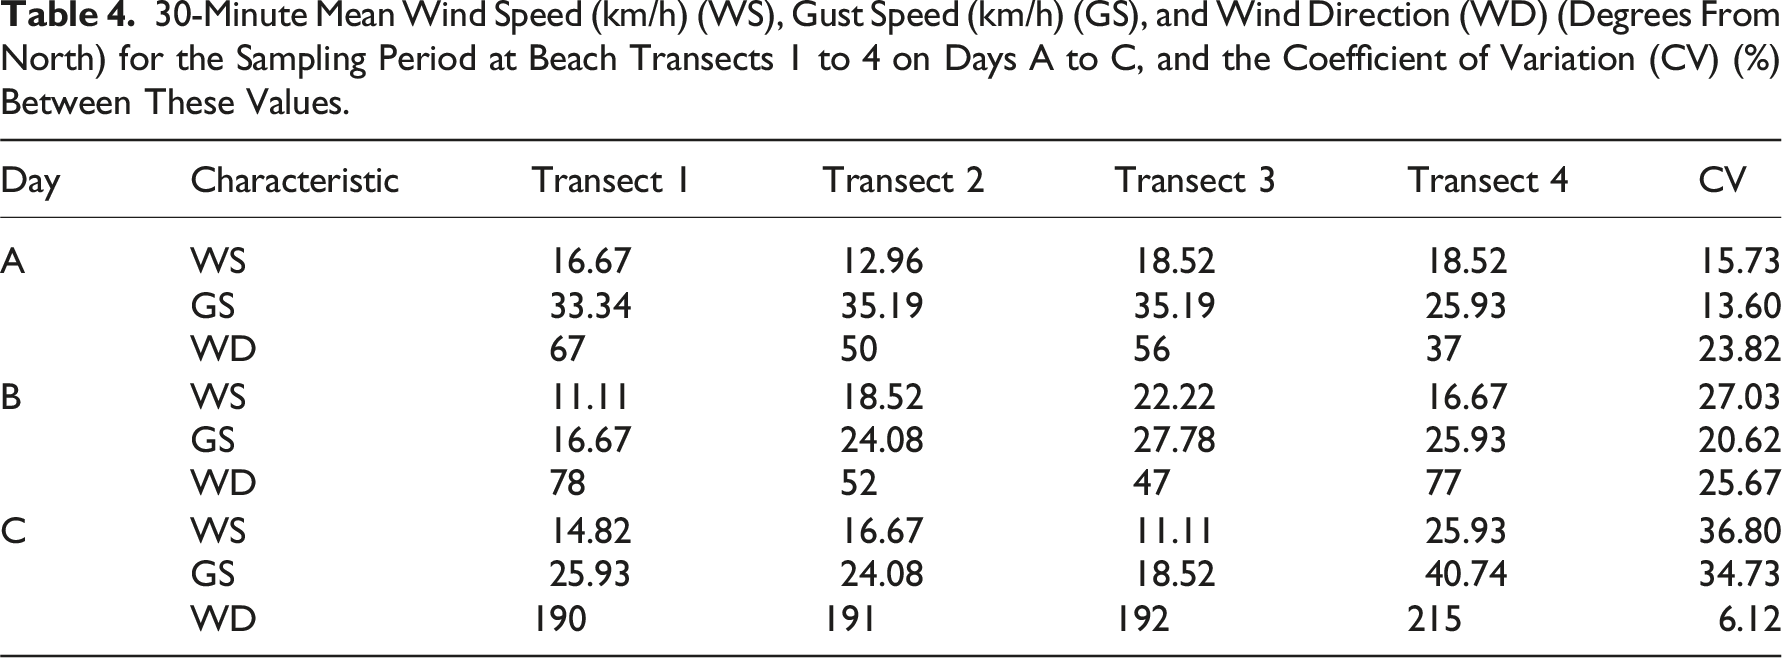
As shown in Table 4, between the sampling periods at transects 1 to 4, the 30-minute mean wind speed varied by 15.73% on day A, 27.03% on day B, and 36.08% on day C. Between the sampling periods at transects 1 to 4, the 30-minute mean gust speed varied by 13.60% on day A, 20.62% on day B, and 34.73% on day C. Finally, between the sampling periods at transects 1 to 4, the 30-minute mean wind direction varied by 23.82% on day A, 25.67% on day B, and only 6.12% on day C.
Aeolian sand transport
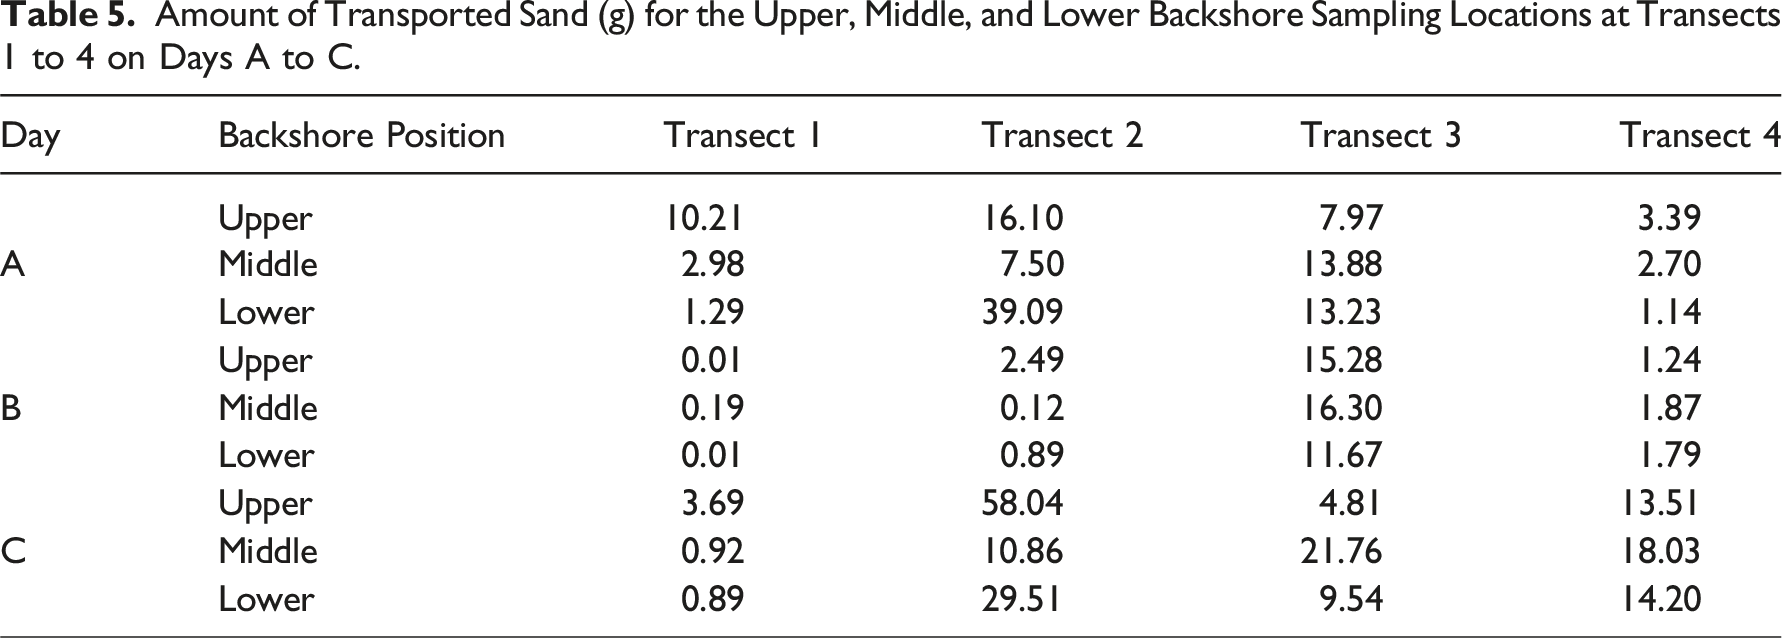
Amount of Transported Sand (g) for the Upper, Middle, and Lower Backshore Sampling Locations at Transects 1 to 4 on Days A to C.
Correlation between transported sand and environmental variables
Topographic variation reduces wind energy and can lead to the deposition of saltating grains, thereby decreasing sand transport (Pye and Tsoar, 2008). In our study, however, no discernible relationship existed between the slight variations in slope or microtopographic features across each beach transect (see section 4.1) and the amount of sand transported at any of the sampling stations. Therefore, we can assume that the backshore surface topography at our study site was sufficiently consistent not to have been a controlling factor for aeolian sand transport during our study.
Studies have established that the critical threshold for aeolian sediment transport is a function of wind speed, sediment moisture content, and grain size, as discussed previously (Davidson-Arnott et al., 2018; Husemann et al., 2024; Pye, 1983). As reported in section 4.2, in our study, sediment moisture content exhibited minimal variation, with significant differences observed only between the means on days A and C and between the upper and lower backshore on day A (Table 2). There was no significant alongshore variation in sediment moisture content on any day (Figure 5(a)). Similarly, sediment grain size showed no statistically significant variation along or across the shore (Figure 5(b)). Given these results, calculating critical aeolian transport thresholds based on moisture content and grain size for our study locations and times would not be meaningful. Instead, our analysis will focus on the spatial and temporal variations in sand transport, driven by the only variables that showed statistically significant variation during our study: wind speed, gust speed, and wind direction. Alongshore plots showing beach sediment moisture content (%) and grain size (μm), wind speed (km/h), gust speed (km/h), wind direction (degrees from north), and transported sand (g) at transects 1 to 4 on days A to C. Panel (b) depicts the grain size results from day A, the only day on which samples were collected for grain size analysis. Panels (a), (b), and (f) display the means of the values recorded across the three sand trap locations (upper, middle, and lower backshore) at each transect. These results correspond to the beach transect locations depicted in Figure 3(b).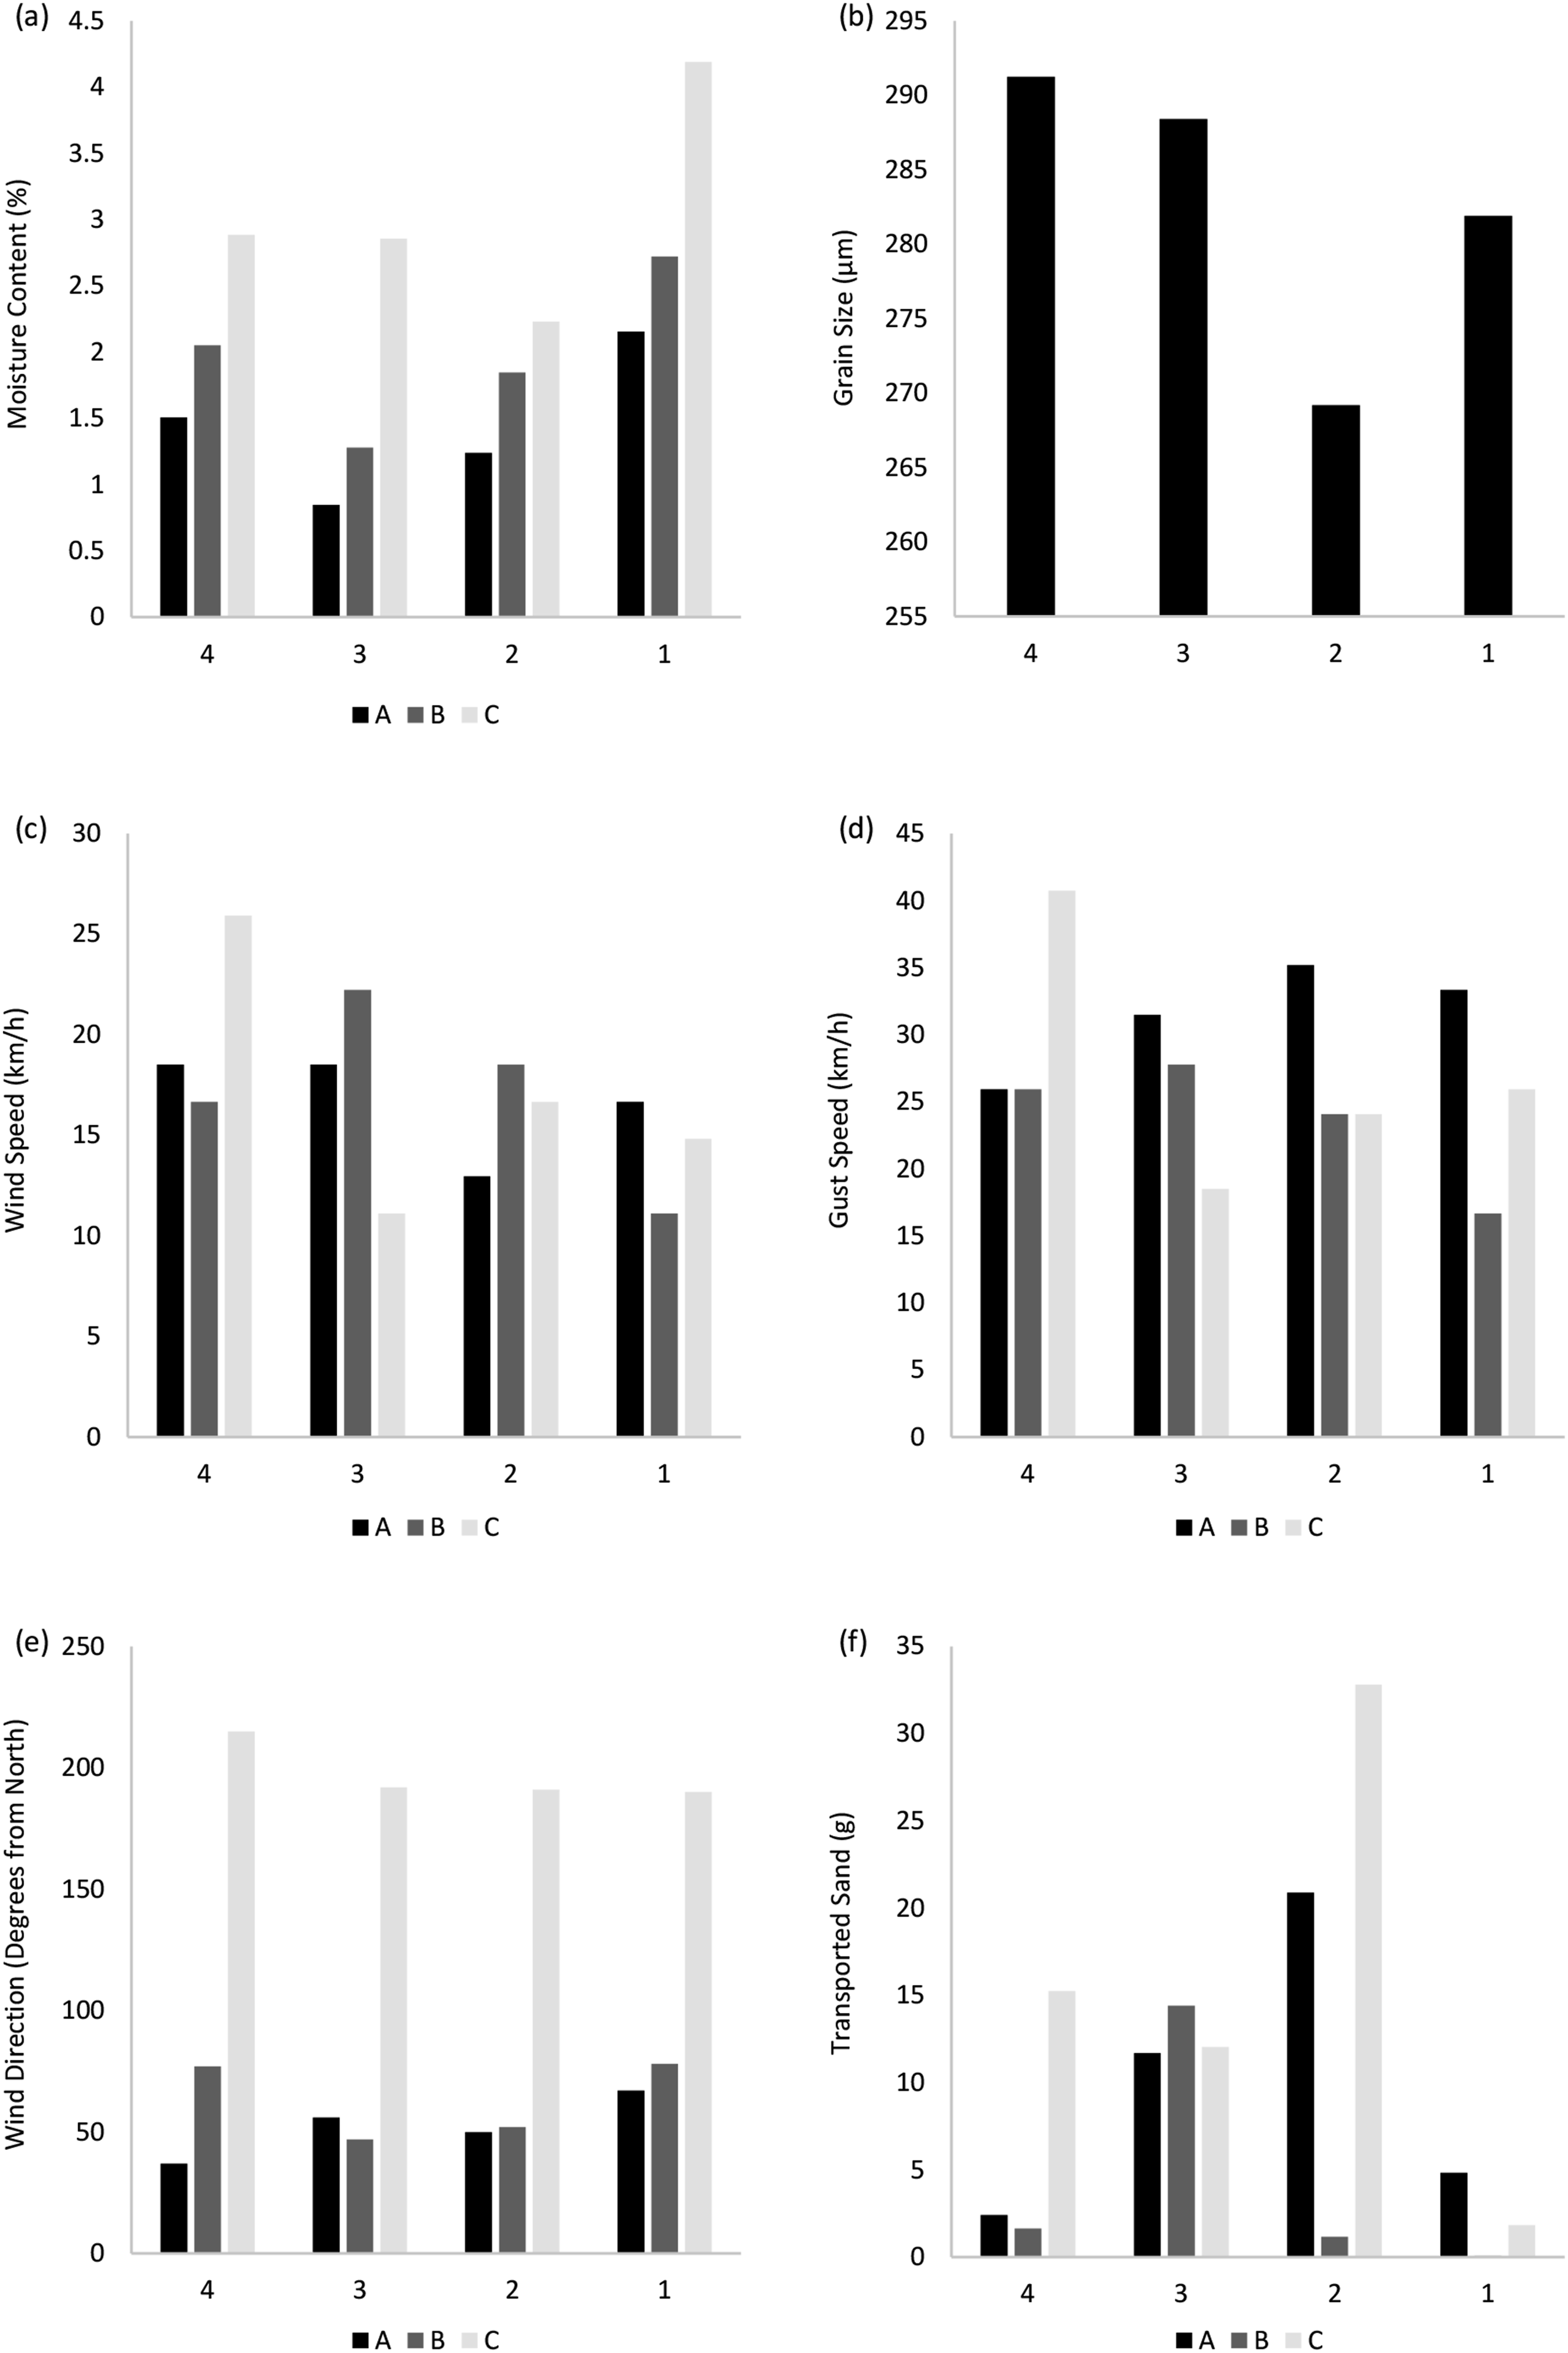
Neither the 30-minute mean wind speed (rs = 0.26, p = .12) nor the 30-minute mean wind direction (rs = 0.12, p = .49) correlated significantly with the amount of transported sand. Transported sand was, however, significantly positively correlated with 30-minute mean gust speed (rs = 0.44, p = .007).
Discussion
Foredune vulnerability analysis
The morphology of the foredune and dune ridges is highly variable alongshore at Bull Island. Within our study site, there is a visible transition from small, poorly developed dunes at the two northernmost dune transects to taller, well-developed dunes at the southernmost dune transects (Figure 4). This result supports the findings of McClung (2021) and reaffirms that the northern tip of Bull Island has recently experienced, and is still experiencing, erosion and dune retreat.
Of the ten foredune sections analysed, only three have frontal dune reservoirs sufficient to provide protection against a 16-year storm surge (Table 1). Based on the FEMA rule, the foredune in profiles 3, 7, and 9 would likely experience dune face retreat during a 16-year storm but would avoid overwash or breaching (FEMA, 2018). The CSSLs calculated for these foredune sections are 3.75 m, 2.5 m, and 3.25 m OD, respectively (Table 1). These results indicate that the foredune in profiles 3 and 9 could withstand a storm surge exceeding the 2.36 m OD recorded during Storm Emma, but even a slight increase in SWEL (0.14 m) would likely breach the foredune in profile 7. On the other hand, for the foredune in the seven remaining profiles, a 16-year storm surge would likely cause dune face removal, replacing the vertical dune face with a gently sloping dune profile that may not offer the same degree of coastal protection due to a loss in dune height and volume. Due to their low crest elevations (Figure 4) and frontal dune reservoir volumes (Table 1), the foredunes in profiles 2 and 5 are most at risk of destruction and would likely be overwashed by a storm surge with a much lesser SWEL than during Storm Emma.
Therefore, while some sections of the foredune here currently offer adequate coastal protection in the face of a 16-year storm, the majority do not. With the projected increase in the frequency and intensity of extreme weather events and a certain acceleration in sea-level rise beyond 2100 (IPCC, 2022) – a rise of 7 mm yr−1 within Dublin Bay as of 2016 (Shoari Nejad et al., 2022) – it can be concluded that the current height and extent of the foredune along the northern half of Bull Island are insufficient to ensure the stability of the island in a repeat of the conditions experienced during Storm Emma. An immediate recurrence of such a storm may cause preferential breaching in locations where dune crest elevations are lower than others, such as in profiles 2 and 5 (Figure 4), compromising the stability of the island and the current level of coastal protection provided by the dunes to the landward lagoon, Dublin’s port, and northern suburbs. Given sufficient sand supply and favourable wind conditions, aeolian sand transport processes responsible for upper shoreface sand delivery could enable the dunes to accrete both laterally and vertically, offering increased coastal protection in the future (see discussion below).
Beach sediment characteristics
We measured sediment characteristics on the backshore to assess alongshore variability in dune-building conditions and processes. All traps at transects 2, 3, and 4 were located above mean high water spring (MHWS) level, with only the lower trap at transect 1 located 10 cm below this level. The primary source of surface sediment moisture here is thus precipitation in the form of rainfall, followed by atmospheric humidity. Between May and June 2023, a high-pressure weather system over and to the north of Ireland caused widespread climatological dry periods (Met Éireann, 2023). As such, our results show that variation in beach sediment moisture content was minimal (Table 2) and only statistically significant between days A and C; alongshore variation was insignificant on all days (Figure 5(a)), and cross-shore variation was only significant between the upper and lower backshore on day A. Slightly higher moisture contents on day C, particularly at transect 1 (Figure 5(a)), were likely caused by a 5-minute rain shower that occurred 2 hours before sampling began at transect 1. Studies have suggested that sediment moisture contents of at least 4 to 6% are necessary to limit entrainment and reduce aeolian sand transport (Azizov, 1977; Davidson-Arnott et al., 2008; Logie, 1982; Swann et al., 2021; Wiggs et al., 2004). Our moisture contents exceeded 6% once and 4% three times (Table 2), but overall, variation was minimal (with the exception of the statistically significant instances noted above). Thus, we can reasonably assume that, in the context of this study, beach sediment moisture content was not a controlling factor for aeolian sand transport.
The mean grain sizes determined for the beach sediment on Bull Island ranged from 262.7 μm to 331.2 μm, with an overall mean of 282.7 μm (Table 3). These results align with the grain sizes expected for a sandy beach (Arens and Van der Lee, 1995; Baas and Sherman, 2005; Davidson-Arnott and Bauer, 2009; Gares et al., 1997; Sherman et al., 1998; Wentworth, 1922), with 10 out of 12 samples identified as well-sorted medium or fine sands conducive to aeolian transport. Our results align with Harris (1977), who reports that samples from Bull Island consisted of well-sorted fine sand with diameters between 125 μm and 250 μm. Despite the 46-year difference, both studies show consistent grain size, indicating that the beach sediment composition on Bull Island does not vary significantly on decadal or seasonal timescales. Furthermore, our results show insignificant alongshore (Figure 5(b)) and cross-shore variability in beach sediment grain size. Therefore, due to the lack of temporal and spatial variation in grain size at our study site, we can also assume that beach sediment grain size was not a controlling factor for aeolian sand transport during our study.
Mean wind speed versus mean gust speed relationship to aeolian sand transport
While our results show that the correlation between the amount of sand transported and the mean wind speed was insignificant (p = .12), the weakness of the correlation (rs = 0.26) is noteworthy as it highlights the inapplicability of traditional models of aeolian sand transport, those based on time-averaged wind speeds and assuming steady wind conditions with uniform sand transport, such as that of Bagnold (1941), to this environment. Here, sand transport was significantly positively correlated with mean gust speed (rs = 0.44, p = .007), aligning with the findings of wind tunnel studies, which show that unsteady, turbulent airflow conditions influence aeolian sand transport systems (Butterfield, 1998; Spies et al., 2000; Dong et al., 2003; Li and McKenna, 2014). Butterfield (1998) found that when wind velocity varies sinusoidally, increasing gust frequency increases the transport rate, and this relationship is further heightened by increasing gust amplitude. Thus, Butterfield (1998) concluded that sand transport rates in turbulent winds would be greater than in steady winds of the same velocity. This relationship between sand transport and turbulent airflow is evident in our results when comparing the mean wind speeds and gust speeds (across the four 30-minute sampling periods) with the mean amount of sand transported on each experiment day.
The finding that the mean amount of sand transported on day A was significantly greater than on day B (p = .03), despite the lower mean wind speed on day A (day A = 16.68 km/h, day B = 17.13 km/h), can be attributed to the higher mean gust speed on this day (day A = 32.41 km/h, day B = 23.62 km/h). Additionally, the mean wind speed on days B and C was equal (17.13 km/h), but the mean gust speed was slightly higher on day C (day B = 23.62 km/h, day C = 27.32 km/h), and the variability in both mean wind speed and mean gust speed between the sampling period at each transect was also greater on day C (Table 4) (Figure 5(c) and (d)), indicating more turbulent conditions. Consequently, the mean amount of sand transported on day C was significantly greater than on day B (p = .006). Therefore, while we acknowledge that there are other factors at play, it could be concluded that the gusty and turbulent nature of the winds on days A and C, respectively, compared to the calmer conditions on day B, contributed to the greater amount of sand transported on these days (Butterfield, 1998; Spies et al., 2000; Dong et al., 2003; Li and McKenna, 2014).
During this experiment, aeolian sand transport was observed in the form of streamers. Sand streamers are quasi-linear concentrations of sand blown in the streamwise direction thought to be generated by near-surface gusts (Baas and Sherman, 2005). It is perhaps not surprising then that on the experiment days with the highest mean gust speeds, day A followed by day C, the mean amount of sand transported was significantly greater than on day B, as near-surface gusts could more readily entrain sand grains and initiate transport as streamers (Baas and Sherman, 2005). A similar study conducted by Gares et al. (1997) on Carrick Finn Strand in Donegal, Ireland, observed streamers selectively flowing around sand traps. Streamers range in width from 0.1 m to 1 m and meander laterally (Baas, 2008; Baas and Sherman, 2005); thus, while this was not observed during our experiment, it is possible that some streamers flowed around the sand traps, leading to an underestimation of the amount of sand transported.
Alongshore variations in aeolian sand transport
The significant difference in the mean amount of sand transported on days A and C compared to that on day B is noteworthy. The observed alongshore variability in sand transport appears to vary between individual days (Figure 5(f)) and thus is likely linked, amongst other controls, to different wind directions associated with different catchment areas and pathways of sand movement. On day B, for example, winds were blowing sand from the North to the South, and the mean amount of sand transported differed significantly between transects 1 and 3, 1 and 4, and 2 and 3 (Figure 5(f)). On day C, however, winds were blowing sand from the South to the North, and the mean amount of sand transported differed significantly only between transects 1 and 2, perhaps due to transect 1 in the far North experiencing a reduced catchment area due to its orientation relative to transects 2 to 4 (Figure 2(a)).
Our results suggest that the amount of sand transported is significantly dependent on gust speed. On day A, the mean amount of sand transported at transects 2 and 4 closely relates to the 30-minute mean gust speed recorded for that sampling period, that is, the lowest mean amount of sand was transported at transect 4 (2.41 g), where the 30-minute mean gust speed was lowest for the day (25.93 km/h). The highest mean amount of sand was transported at transect 2 (20.89 g), where the 30-minute mean gust speed was highest for the day (35.19 km/h). This relationship does not hold for transects 1 and 3 on this day. Here, the 30-minute mean gust speeds for the sampling periods were 33.34 km/h and 25.93 km/h, respectively, yet the mean amounts of sand transported were 4.83 g and 11.69 g, respectively. The mean wind speed for the 30-minute period at transect 1 (16.67 km/h) was only slightly lower than that at transect 3 (18.52 km/h), and the mean wind direction during the sampling periods at transects 1 and 3 varied only from 67 to 56° from north, respectively (Figure 5). These results suggest that while wind conditions, primarily gust speeds, were a significant controlling factor for aeolian sand transport during our study, future research should consider potential alongshore differences in catchment areas and sand transport pathways to help explain alongshore variations in aeolian sand transport that cannot be attributed solely to variations in gust speeds. This should involve examining the overall morphological characteristics of the beach (e.g. cross-shore slope and width) and the surface sediment characteristics in more detail, both on individual beach sections and at greater distances from the sand traps.
Upper shoreface sand delivery
For the purpose of this study, the potential connection between the observed alongshore variation in aeolian sand transport during different wind directions and the observed alongshore variation in the topography and vulnerability of the foredune on Bull Island was of key interest. Overall, the total amount of transported sand was lowest at beach transect 1, where, on days B and C, the daily minimum values were also recorded (Figure 5(f)). Interestingly, the foredune at dune transect 1 and nearby at dune transect 2 have two of the smallest frontal dune reservoirs (Table 1) and have experienced the most significant erosion in recent years, from which they have not recovered. This may indicate that aeolian sand transport at beach transect 1, and on the northernmost portion of the beach at Bull Island in general, is permanently lower than at some of the southern transects regardless of wind characteristics. Our aeolian sand transport measurements conducted over 3 days with statistically significant differences in wind directions (northerly vs southerly) support the hypothesis that this transect does not receive as much sand via aeolian sand transport processes as any of the other beach transects. It is possible that this limits dune-building processes at the island’s northern tip, even during onshore winds, which have the potential for upper shoreface sand delivery. As mentioned previously, one factor that may have confounded our transported sand measurements is the lack of knowledge relating to the catchment area and sand transport pathways for transect 1 and those for transects 2, 3, and 4, as well as the potential influence of the precise subaerial beach area present at different times of day and tidal stages.
Conversely, beach transect 3 recorded the second-highest amount of sand transported overall (Figure 5(f)). This beach transect aligns with dune transect 7, one of the three locations at which the foredune had a frontal dune reservoir sufficient to withstand the storm surge of a 16-year storm. As such, this may indicate that this alongshore position frequently experiences higher amounts of aeolian sand transport. During winds of 90–180° from north, but particularly during shore-normal winds (136° from north), upper shoreface sand delivery at this location enables dune-building processes such that the foredune has been able to accrete sufficiently here to offer coastal protection against a 16-year storm. The idea that aeolian sand transport on Bull Island regularly experiences this pattern of alongshore variation, with weaker transport on the island’s northernmost portion, and greater transport towards the island’s central portion, is supported by the findings of Mathew et al. (2019) who found an accretion rate of 1.2 m yr−1 for the dunes in the central region, and the findings of McClung (2021), who found an erosion rate of −0.6 m yr−1 for the northern dunes. Thus, a tenuous link can be drawn between the alongshore variation in aeolian sand transport found in this study and the dune-building processes that influence the morphology and vulnerability of the foredune on Bull Island. While beyond the scope of this research, determining the influence of the tides on aeolian transport processes at Bull Island, particularly their influence on the sand catchment areas, may explain this finding.
Implications for future foredune stability
While further research is needed to better understand the factors driving alongshore variation in aeolian sand transport processes at Bull Island alongside variations in wind characteristics, our results enable a preliminary discussion of the potential future stability of the foredune and its ability to offer coastal protection. Meteorological data recorded hourly by CIL sensors on the DBB between 2014 and 2024 show a mean wind speed of 23.02 km/h, gust speed of 32.76 km/h, and a prevailing wind direction of west/north-west, followed by the south/south-east (Figure 6). Thus, the most common onshore wind direction for the past decade was southerly, followed by south-easterly (∼130-190° from north). Southerly winds of less than 180° from north and south-easterly winds, particularly those 136° from north, are most likely to facilitate upper shoreface sand delivery on the northern portion of Bull Island. In the last decade, winds travelled from these directions approximately 14.5% and 12.5% of the time, respectively. In such conditions, the overall direction of sand transport would be from the southern half of the beach (as on day C) or from the foreshore, respectively, towards the upper shoreface on the northern half of the Island. Our observed wind directions on days A and B, on the other hand, were from north-easterly directions; such winds occurred less frequently (∼7%) over the past decade. The frequency with which winds reached or exceeded the 30-minute mean wind speeds recorded during our sampling periods over the past decade from those directions was around 2.5% and 10.5% for the north-easterly and southerly directions, respectively (Figure 6). Over the past decade, winds blew from alongshore directions comparable to those in this study and more directly onto the shore around 50% of the time and mean wind speeds exceeded those recorded in this study around half of the time when winds occurred from any of these directions (Figure 6). Hourly mean wind speeds and directions for Dublin Bay from 2014 to 2024. Source: data obtained from CIL sensors on the DBB via ERRDAP.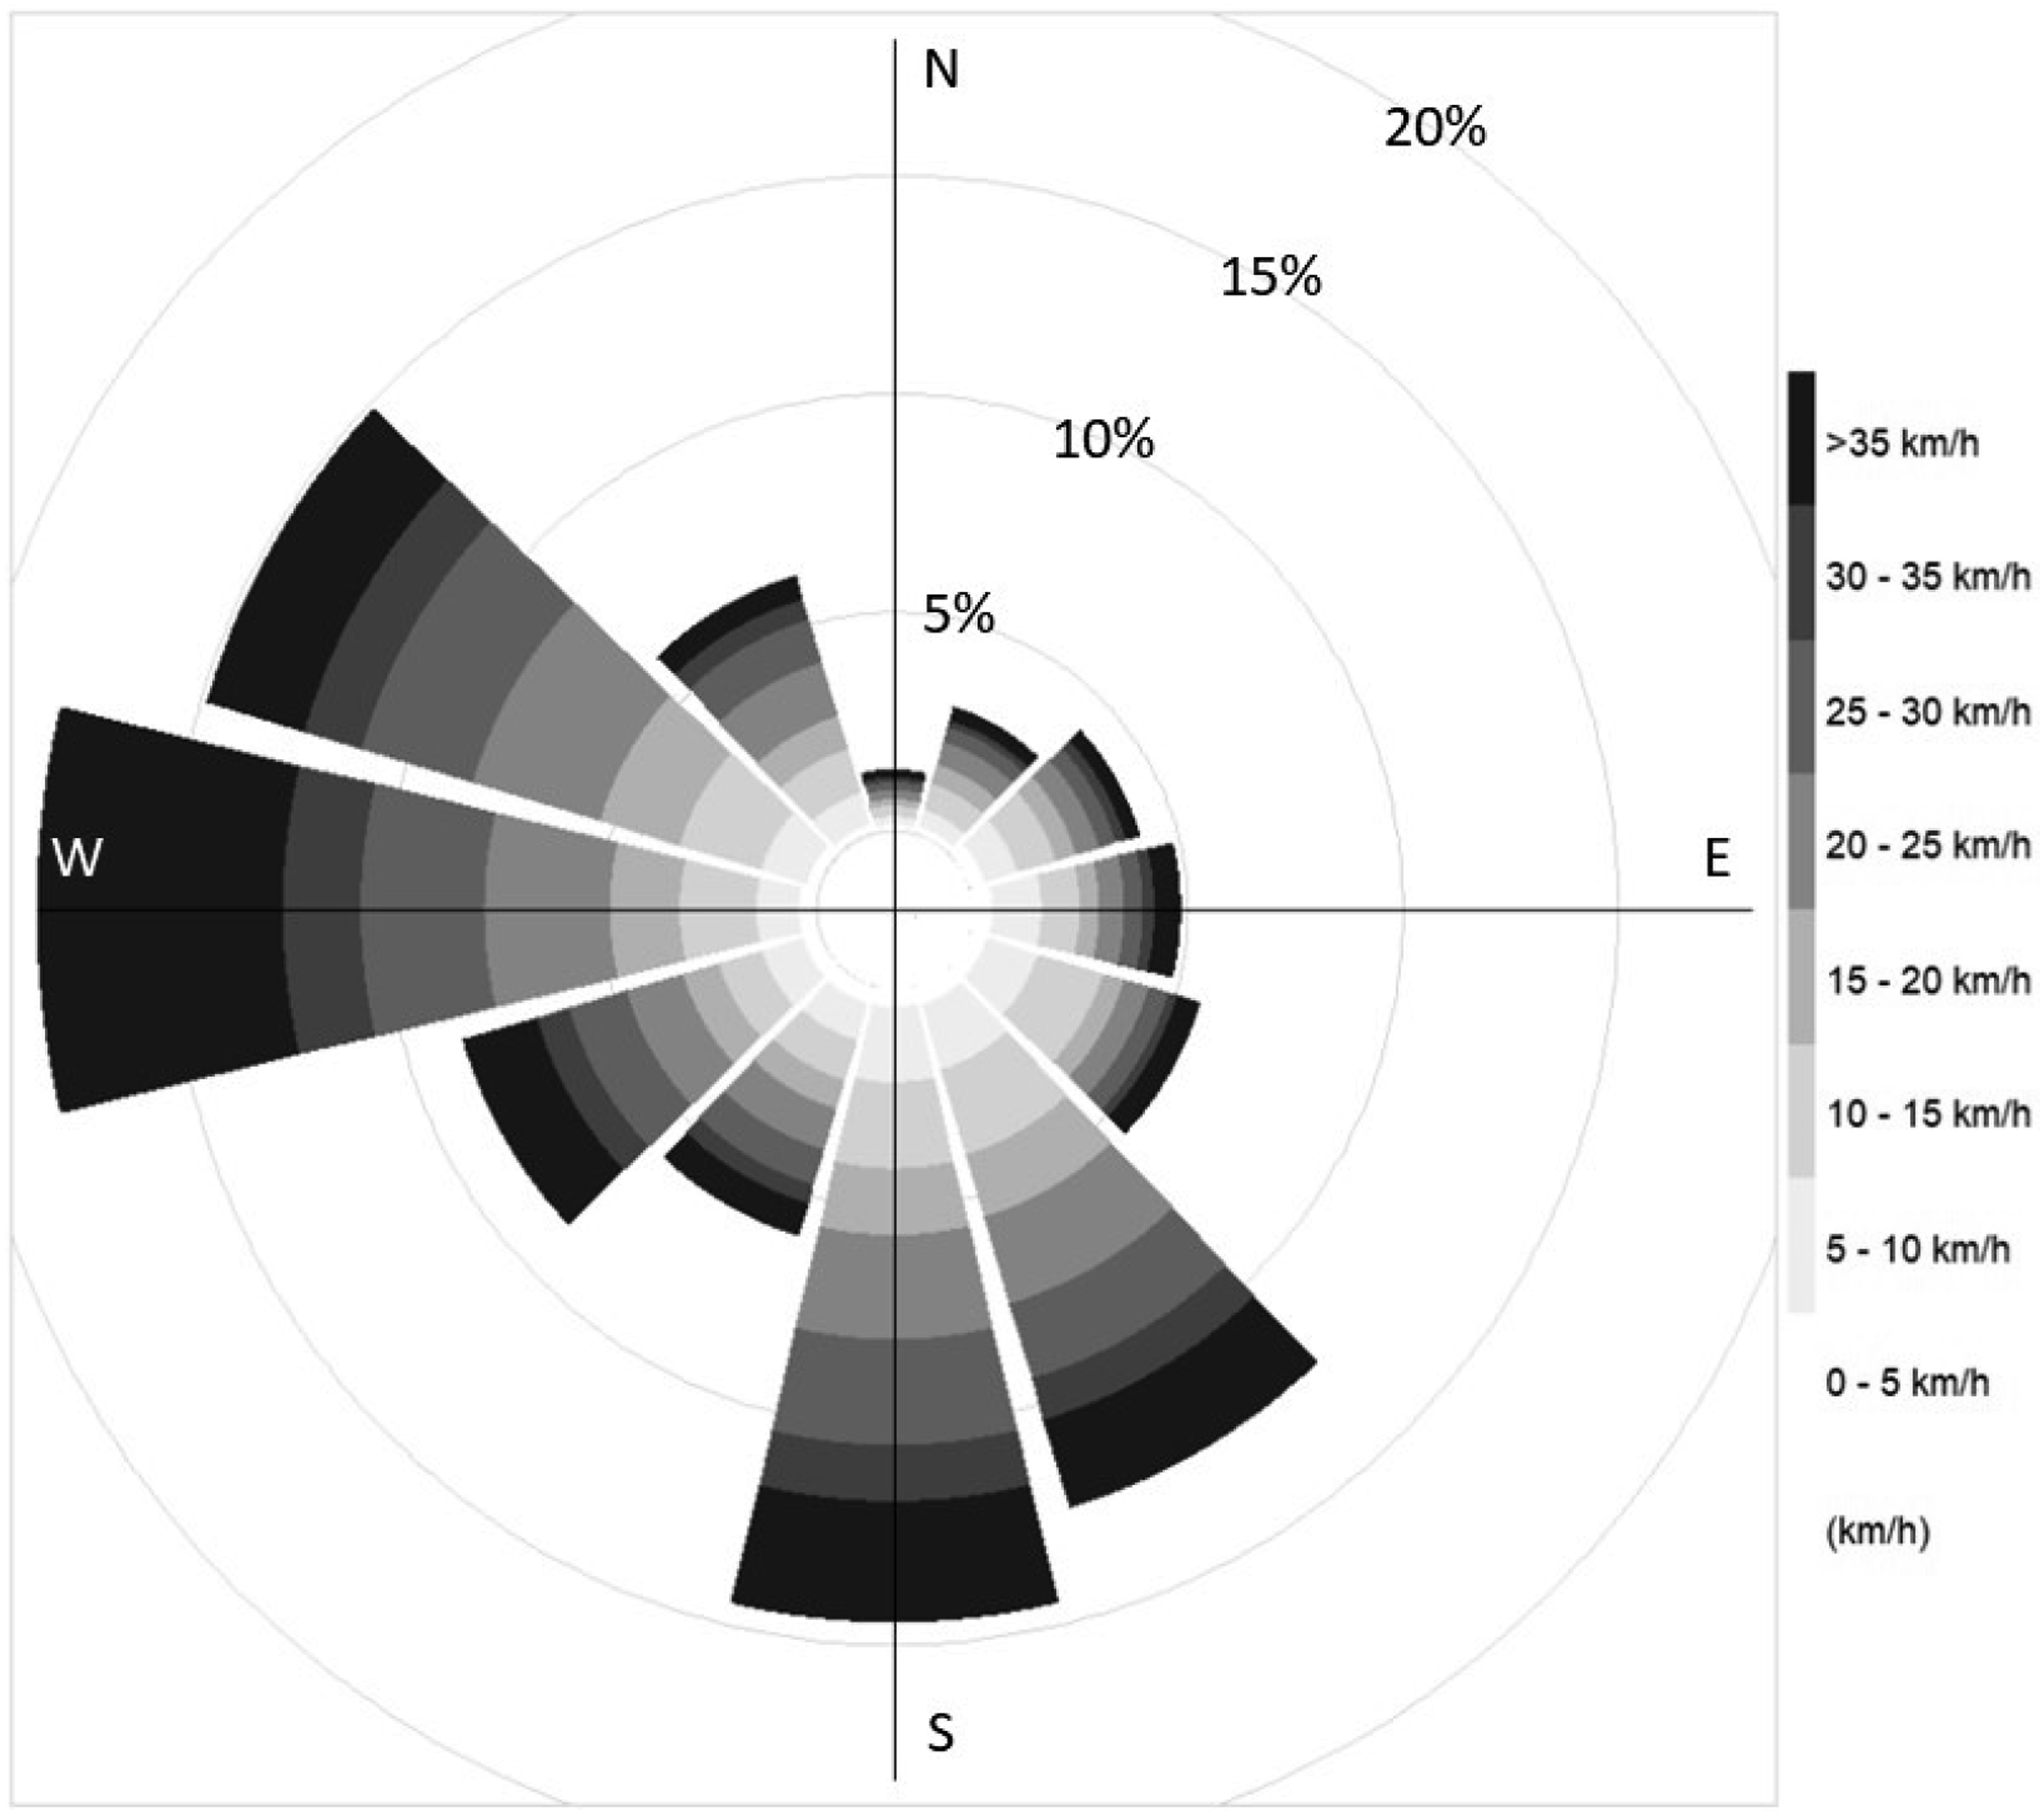
A conservative annual estimate of sand delivery to the four foredune sections corresponding to beach transects 1 to 4 can be made. For this calculation, we assume conditions similar to those during our study at an annual frequency similar to that at which they occurred over the past decade. Considering that, in reality, we would likely see more frequent occurrences of lower (rather than higher) sediment transport rates, given likely precipitation effects, we would consider these assumptions to lead to over- rather than under-estimates. We take the alongshore differences in the mean amount of transported sand (averaged over the three traps at each transect) into account for the northeasterly versus southerly transport conditions and assume a sand transport rate equal to the average determined in this study for easterly (onshore) wind directions that lie between those observed in this study. Notwithstanding the importance of wind gust speeds raising transport rates (as our results suggest), this scaling up would result in an annual total aeolian transport rate into the dunes of approximately 12.79, 188.83, 80.31, and 83.94 kg at transects 1, 2, 3, and 4, respectively. Although based on rough calculations, these rates emphasise the potential effect of the alongshore variation in sand transport found in this short-term study when scaled up to annual estimates.
Since 2015, Ireland has experienced, on average, eight named storms per storm season (Met Eireann, 2023). With just under 13 kg of sand (as an overestimate) expected to be supplied to the foredune at beach transect 1 (dune transect 1) annually, it is unlikely that the dunes here will be able to achieve net annual accretion. Instead, most of this supply will replace sand lost during storms and regular offshore winds, which, over the last decade, occurred 50% of the time. The volume of the frontal dune reservoir at beach transect 2 (dune transect 4) was not sufficient to withstand a 16-year storm (Table 1). Thus, the large volume of sand expected to be delivered to the foredune here may be sufficient to bring the volume of the frontal dune reservoir above the FEMA threshold if the foredune does not suffer further severe volume removal. Finally, at beach transects 3 and 4 (dune transects 7 and 10), similar volumes of sand are expected to be delivered to the foredune annually. At beach transect 3 (dune transect 7), the frontal dune reservoir is already above the FEMA threshold; thus, in the absence of severe volume removal, any additional volume will allow the foredune to grow both in height and extent to offer a greater level of protection, raising the CSSL. At beach transect 4 (dune transect 10), the foredune missed the FEMA threshold by 6.09 m2 (Table 1). Thus, over time, an annual supply of roughly 80 kg of sand may be sufficient to bring this foredune section above the threshold.
Our results show that aeolian sand transport varies alongshore on Bull Island, and we cannot assume the transport patterns recorded across the four beach transects remain the same in the alongshore positions between these transects. Thus, we cannot estimate annual sand supply volumes for the foredune sections at the remaining six dune transects, for which we do not have beach sand transport rates. By assuming that the annual supply volumes to the remaining six dune transects stay within the range of those calculated above, however, we can say that due to the low crest elevations (Figure 4) and low frontal dune reservoir volumes (Table 1), it is less likely at dune transects 1, 2, 5, and 8 than at the other locations that the foredune sections will be able to accrete sufficiently to achieve net annual accretion and surpass the FEMA threshold without human intervention.
Our results support the idea that important alongshore variability exists over distances of less than a few hundred metres in the processes that cause dune building and the resulting dune stability. This alongshore variability drives the spatial variability in the morphological response of barrier islands, such as North Bull Island, to individual storms and storm surge events and in how this response manifests as alongshore variability in barrier island migration rates over decadal timescales (Brooks et al., 2016). Just as dune-building and erosion processes appear punctuated by instantaneous events (wind gustiness was a key factor in explaining our observed sand transport, while extreme storm surges cause short-term erosion), the likely future of protective dunes on barrier islands is also punctuated in space, by specific alongshore locations more vulnerable to rapid morphological change than immediately neighbouring areas. Understanding the particular alongshore variation in upper shoreface sand transport and delivery to the dunes (and the factors controlling this variation) is thus essential for any assessment of a dune system’s ability to withstand and/or recover from erosion in a climate-changed future in which both gust speeds (which may build dunes) and extreme storm surge events (which may erode them) are likely to intensify (IPCC, 2022).
Conclusions
To our knowledge, this is the first study to combine (a) a morphometric assessment of alongshore variability in dune geometry indicative of resilience against storm surge impact with (b) instantaneous observations of alongshore variability in aeolian sand transport into dunes on an Irish beach. In combining these approaches, we have shown that this dual approach can form the basis for a practical alongshore assessment of the capacity of frontal dunes to (a) withstand extreme storm surge conditions and (b) strengthen their morphological resilience to such events into the future. In particular, we can conclude that (1) The morphological vulnerability of the foredune on Bull Island to extreme storm surge impact varies alongshore, with seven of the ten sections analysed at risk of erosion during a 16-year storm surge. (2) Aeolian sand transport processes vary between days and alongshore, over distances of only a few hundred metres, impacting upper shoreface sand delivery. This variation exists in the absence of the controls of beach sediment moisture content or grain size. (3) Mean gust speed (rather than mean wind speed) was a key controlling factor in determining the delivery of sand into the foredune of Bull Island during our observation period. (4) Alongshore variations in foredune morphology-based indices of vulnerability to extreme storms can, at least conceptually, be explained by observed event-based alongshore variations in aeolian sand transport processes. (5) Continuous measurement of aeolian sand transport and environmental variables is needed at multiple alongshore locations on Bull Island and in similar environments elsewhere to comprehend these variations and their implications for future foredune stability. Further studies on likely future changes to wind gustiness, given its potential importance for aeolian sand delivery into protective coastal foredunes, are also needed.
Footnotes
Acknowledgements
The authors would like to thank Dr James Canavan and Dr Elaine Treacy of the Department of Geography, School of Natural Sciences, Trinity College Dublin, for their assistance with field preparations, laboratory, and particle size analysis. Field assistance was gratefully received from Grace Murphy, Kristina Zubovic, and Daniel Brien. The authors are also grateful to Pat Corrigan and staff at Dublin City Council for granting permission to carry out research on North Bull Island Nature Reserve. Finally, the authors thank our colleagues at Trinity, whose thought-provoking discussions have significantly shaped this research. The authors are grateful to Trinity College Dublin’s E3 funding provided to Prof Möller, which enabled the writing of this publication.
Author Contributions
IM conceived of the overall project idea and contributed to the writing and revisions of the manuscript. JC carried out all practical elements of the study, including data processing and analysis, wrote the initial manuscript, and produced the figures and tables.
Declaration of conflicting interests
The author(s) declared no potential conflicts of interest with respect to the research, authorship, and/or publication of this article.
Funding
The author(s) received no financial support for the research, authorship, and/or publication of this article.
Data Availability Statement
All data generated during this study are included in this published article and its supplementary information files.