
Abstract
Remote sensing plays an important role for modern geography and environmental science. At the same time, it often stands on a weak epistemological foundation. Remote sensing results are mostly treated as strictly objective, context-independent artifacts. This vastly ignores the human practices that led to these results. Thus, remote sensing data are uncritically incorporated into (environmental) policy decision-making processes without understanding exactly how they were generated. Recent research has been critical of this. In a previous study, I showed that the accuracy of land use results can be increased by class aggregation, while the geographic or environmental meaning of the results suffers. I called this provocatively the “more accurate, less meaningful (MALM)” effect and showed that it exists regardless of the technical level of classification. In this study, I discuss the extent to which MALM can be remedied by choosing an appropriate quality indicator. I show that, to the largest extent conceivable, the quality indicator does not and cannot unveil the effects of socio-technical practices, which are materially inscribed into land use maps. Hence, quality indicators are unable to objectivize the effects of practices and values by the researchers. Consequently, they do not solve the MALM problem. On the contrary, I show that the explicit inclusion of geographic knowledge in quality addresses the MALM effect to the largest extent possible. This reinforces my claim that more attention needs to be paid to considering the values and practices behind remote sensing information. I discuss the results in a broad context and argue that and why critical remote sensing based on critical (physical) geography and science-and-technology studies is vital to better incorporate such results into policymaking.
Keywords
„Our discussion will be adequate if it has as much clearness as the subject-matter admits of, for precision is not to be sought for alike in all discussions, […] In the same spirit, therefore, should each type of statement be received; for it is the mark of an educated man to look for precision in each class of things just so far as the nature of the subject admits” Aristotle, Nicomachean Ethics, 330 B.C., Book I, Verse 3
1
Introduction
Background
The Greek philosopher Aristotle had held that there were three fundamental human types of action: teoria, poiesis, and practice. While teoria is a purely cognitive endeavor, practice and poiesis are about physically doing things. While poiesis refers to the production of things, practice refers to the doing itself. While Aristotle did reflect on the nature of light and color, he was totally unaware of either the full electromagnetic spectrum and its detection in remote sensing imagery, of course. Nonetheless, if he lived today, he would have some important contributions to make on remote sensing, as I will show in the following.
Remote sensing land use analysis of optical satellite data has its permanent place in modern geography. Land use analysis are an important product (poiesis) of modern remote sensing applied in almost all domains of geography and environmental science (Boyd, 2009; Curran, 1987; Estes et al., 1980; Quattrochi et al., 2003). The practice in supervised land use classifications is as follows, a human operator defines land use classes and marks some training data in satellite images. Training data are geographical places with known class memberships. For instance, a forest patch known from terrain, which covers some hundreds of pixels within the satellite image and hence, can be used to represent the class “forests” in the image. In the different bands of the satellite image, classes have a certain spectral pattern (i.e., typical reflectance values). After defining a set of classes and representing them by training data, an algorithm learns the spectral patterns of the training data to assign a class to all data with unknown class membership (i.e., the algorithm is trained, using the training data). The process of first defining classes, second defining training data with known classes, third having an algorithm learn the spectral patterns of these classes and fourth using the learnt patterns to assign classes to all areas without known class memberships is called classification. Its result typically is a land-use map. It covers the entire geographical extent of the satellite image and defines a class label for each pixel in it (Chutia et al., 2016; Lillesand et al., 2015; Phiri and Morgenroth, 2017; Weinmann and Braun, 2021a). At this point, it is important to prevent a very fundamental misunderstanding that Tadaki et al. (2014) identified in a different context. Classifications are not descriptions of objective truths of nature. They are rather suggestions for subjective categorizations for nature, depending on values, practices, and a certain performativity. This is exactly where the most decisive point of my argument is to be found. It is precisely this misunderstanding that is often uncritically ignored! As soon as the land use maps materially exist, they are validated as if they were just that: Descriptions for objective truths of nature. My article wants to show that as soon as one succumbs to this misunderstanding, its consequences can no longer be remedied technically. Hence, I will hold that remote sensing today lacks on an appropriate teoria, for example, regarding its epistemological connects to observed phenomena.
To validate the land-use map, the operator defines control data. Just as for training data, the class membership for control data is known as well (e.g., a second patch of forest, which is covered by another hundred pixels or so). In contrast to training data, control data are never used in the learning process of the algorithm. 2 Control data are not used to train, but to control the algorithm. To do so, the algorithm is used to classify the control data. Then, the class label assigned by the algorithm is compared to the class label known to the operator. The more closely the algorithm matches the judgment of the human operator, the better it is deemed. The amount of match between algorithm and human operator is measured according to some quality indicator. The quality indicator is a statement on the accuracy of the land-use map (Congalton, 1991, 2007; Curran and Williamson, 1985). Classification results are compared with respect to different accuracy criteria (Foody, 2002; Weidner, 2021). These accuracy criteria compare the extent to which the class memberships determined by the classification procedure match the class memberships determined by the human operator over the set of control data. Examples include overall accuracy, which measures the percentage of correctly classified (i.e., class determination by human operator and algorithm agree) control data out of the total control data; another is Cohen’s kappa coefficient. It is a measure of how classification results compare to randomly assigned values (Stehmann, 1996). After this control procedure, the resulting land-use map is used in geographical (or environmental) analyses. Threshold values have been defined in the literature to determine at what overall accuracy remotely sensed land use analyses are sufficiently accurate to be used in follow-up analyses. They lie somewhere between 75% or even 90% accuracy (Anderson, 1976; Shao and Wu, 2008). The assumption here is that the land use map has geographic meaning, that is, that it contributes to geographic knowledge gain.
Scientific problem
The assumption that achieving some accuracy thresholds leads to a gain in geographic meaning has to be critically revised! The current scientific practice uncritically assumes that the “quality” sought in remote sensing methods development (i.e., accuracy) equals the “quality” in applied geographical and environmental research (i.e., geographical meaning). This assumption is problematic, at best. The problem with this assumption is that it decontextualizes the notion of quality. However, quality is not free from a context. Bringing the debate down to simpler terms, what is “good” cannot be decided without explicitly taking account of the practical context, in which this decision is taken. And neither can it be decided what is “good enough,” without making some reference to other experiences within that practical context.
It may lead to the following dilemma: remote sensing analysis deliver high quality results (in terms of accuracy). Hence they are apparently ideally suited for the research questions at hand. However, “quality” in terms of the communities applying remote sensing results may not refer merely to accuracy, but to other properties that are not well reflected by classical accuracy indicators. This creates two risks. On the one hand, the interdisciplinary discourse on environmental issues could be superseded by a kind of “technological arms race,” in which the main concern is who can bring the best classification methods to the battlefield and thus achieve the highest hit accuracy. On the other hand, geoethical questions also arise as a result. Namely, for example, who defines the standards under which we call “environmental knowledge” as such and for whom “environmental knowledge” is still useful and comprehensible, if it is dominated by ever more complicated procedures, whose complexity no longer stands in any tradeoff to the reality of the terrain. (Bennett et al., 2022; Feilhauer et al., 2021; Braun, 2021).
Based on this fallacy, scientific practices diverge. In this regard, remote sensing devotes much research effort in developing better classification methods (e.g., Benediktsson et al., 2007; Camps-Valls and Bruzzone, 2009; Ma et al., 2019). Usually, a classification method is considered better if it outperforms other classification algorithms in benchmark tests (Weinmann and Braun, 2021b; Zhou et al., 2018). In such benchmark tests, standard datasets whose classes are algorithmically very difficult to distinguish are classified by different algorithms. If a newer algorithm outperforms an older one in a series of benchmark tests, this is taken as a quality criterion for the newer algorithm’s ability to reliably produce results on other datasets. Examples of benchmark datasets include AVIRIS Indian Pines, the Salinas, and the ROSIS Pavia dataset (cf. Priyadharshini and Sathya Bama, 2021; Song et al., 2018). On the other hand, geographical or environmental inquiries applying land-use maps work on scientific products are not matched to their quality criteria, but to the quality criteria relevant to remote sensing. At the same time, these land-use maps become increasingly important in environmental policymaking (Bennett et al., 2022; Boyd, 2009; Estes et al., 1980).
Previous work
Since it is highly problematic that results established on a questionable epistemological basis become increasingly relevant to policymaking, I challenged the assumption that higher accuracy of land-use maps generally signifies a higher meaning for geography (Braun, 2021). I showed that a “more accurate, less meaningful (MALM)” effect exists. MALM arises if accuracy is increased by aggregating land-use classes which are relevant to geography or environmental studies, but are difficult to distinguish in satellite images (e.g., pine forest and mixed pine/spruce forest into one superclass of conifer forest). For instance, by aggregating these classes, accuracy increases but geographical meaning is lost. Once again, it becomes clear that such attempts at classification are less approximations of an objective truth than performative constructions of an ontology by means of which geographical terrain reality is made manageable. In a comparable argumentation, Brierley et al. (2021) have spoken of classifications as “dark art” that carry elements of witchcraft and wizardry. I argued that for this reason, the endeavor should not be to strive for maximum accuracy. Instead, just as pointed out by Aristotle as early as 330 B.C., trade of the aspired accuracy against the complexity of the problem. Put bluntly, a land-use map that has only 75% accuracy, but distinguished between pine forest and mixed pine/spruce forest may be more meaningful than a map that has 82% accuracy, but ignores the two forest types. In this context, Cullum et al. (2017) praise vagueness as a value, so to speak. While this may sound straightforward to some, current practice discussed in (Braun, 2021) is different. For instance, any reviewer of a paper, claiming the accuracy thresholds proposed by Anderson (1976) or Shao and Wu (2008) may motivate researchers to ignore some differences. I developed my reasoning from critical physical geography (CPG) (Labban et al., 2015; Lave, 2014, 2015, 2018a, 2018b; Lave et al., 2014; Tadaki et al., 2012). CPG raises awareness of the fact that scientific results have a political dimension, and are thus also fraught with a fundamental value, and calls for subjecting one’s scientific practice to reflexive critique (Blue and Brierley, 2016; King and Tadaki, 2018; Lave, 2015; Slaymaker, 2017). Three core tenets are at the heart of CPG, which are also relevant to this work. Tenet 1: Crappy Landscapes (Urban, 2018): In the Anthropocene, it no longer makes sense to want to study the natural in “pristine landscapes”. If we are the dominant geological process, we can only understand nature if we study it in altered landscapes. Tenet 2: Politics of Environmental Science (King and Tadaki, 2018): The power relations that shape landscapes also shape research on landscapes. Tenet 3: Impacts of Environmental Science (Law, 2018): The knowledge thus generated about landscapes in turn changes landscapes (“The myth of the ivory tower [of science, A.B.] is just that: a myth.” Lave et al., 2018a: 5). This approach is often established on the epistemology of critical realism (Bhaskar, 2010), which holds that scientific results may indeed adequately describe reality, but only if the underlying values and practices that led to the results are reflected upon. On the basis of this reasoning, in Braun (2021) I have shown that MALM may exist independently of the technical level of the classifier. Since MALM is related to the practices and values behind land-use analyses, it applies to simple and complex classifiers alike.
Objectives for this study
After the publication of Braun (2021), in which I addressed MALM using the choice of classifier as an example, I received feedback that the choice of an appropriate quality measure could remedy the aforementioned effect. This is a claim which I doubt. I hypothesize that for the same reasons that MALM is independent of the classifier, it is also independent of the quality measure: it stems from values and practices, not from technical levels. 3 Hence, as long as values and practices are not reflected and made transparent, MALM may always incur. This article therefore has three goals. The first goal is to show that the selection of the quality measure does not eliminate the described MALM effect. This is also to show that MALM is a more general phenomenon than demonstrated in (Braun, 2021). The first objective is to generalize my statements from Braun (2021) by considering technical quality assessment procedures in addition to technical classification procedures. As a second aim, I show that all technical procedures are situated in a research context in which the MALM effect can occur and why the solution to MALM is not in technological fixes but in a consideration of socio-technical practice. As a third objective, I would like to emphasize my call (and that of some other authors) for a critical revision of remote sensing, and appeal for it to be placed on a stable epistemological and scientific theoretical basis.
Materials and methods
Dataset
In order to make my argumentation comparable to previous research, this study uses the same dataset as Braun (2021), Figure 1. The dataset comprises a ten class (c = 10) Landsat TM dataset from a peri-urban area in Argentina, know to me from fieldwork. Within the dataset, several geographically meaningful differences are present, which lead to classes that are difficult to distinguish for classification algorithms. I refer to the difference between dense and non-dense urban areas (class 1 and class 2), two different forest types (class 3 and class 4), unpolluted water and polluted water (class 5 and class 6). This dataset has been classified by four different classifier generations (maximum likelihood MXL, artificial neural ANN network, support vector machine SVM, and adaboosting ADA). These four classifiers were chosen because they can be understood as a kind of chronology through the technological evolution of land use classification. First MXL was the dominant method, then ANNs, then came SVMs, and finally ADA. Of course, this is not without alternatives. For example, random forests could have been used instead of ADA. One can also ask whether ANNs are not already counted as AI. Nonetheless, I think this series gives a fairly plausible overview of the technological development that underlines my argument. Furthermore, it has been subject to four different class aggregation strategies (cf. Sec. “Class aggregation strategies”). Herein, the support vector machine results are exclusively used to evaluate how class aggregation strategy and the quality indicators from Sec 2.3. interplay. Complex peri-urban study site in northern Argentina (city of Tigre) used in Braun (2021): Overview with ten land-use classes and three subsets with spectrally similar classes that are easily confused (urban classes 1 and 2, forested classes 3 and 4, water classes 5 and 6).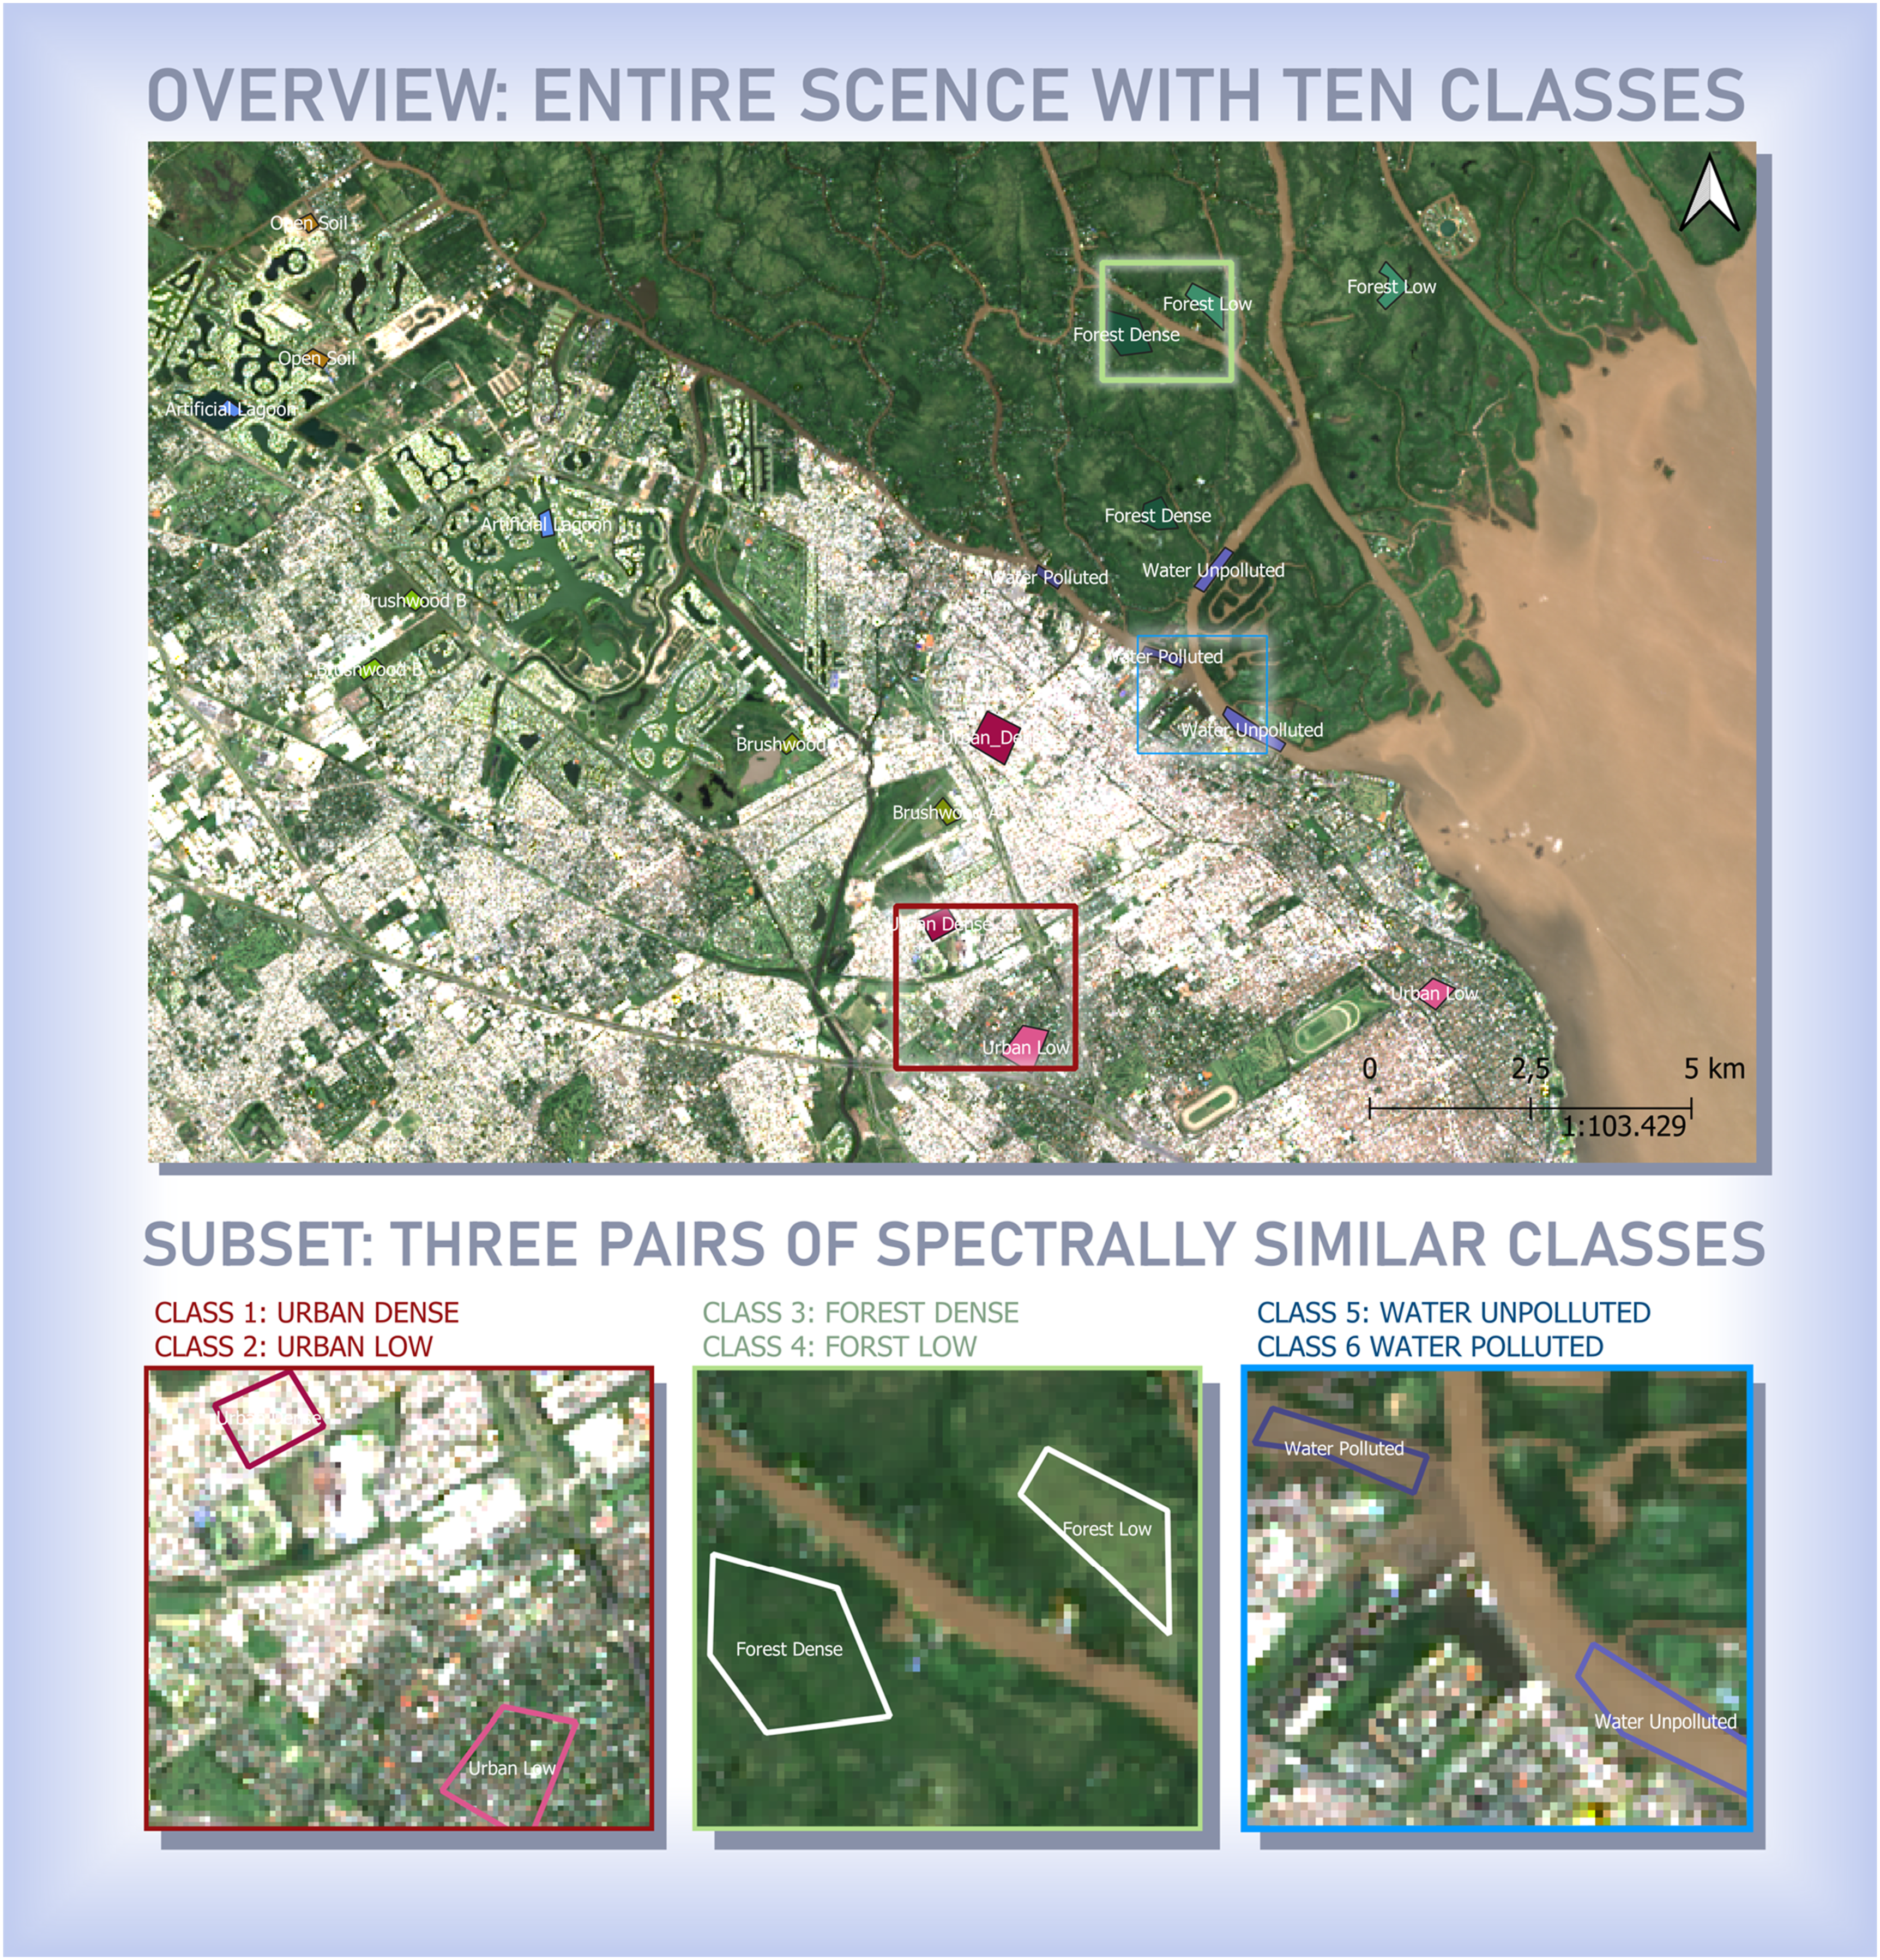
Class aggregation strategies
Class aggregation strategies in remote sensing.
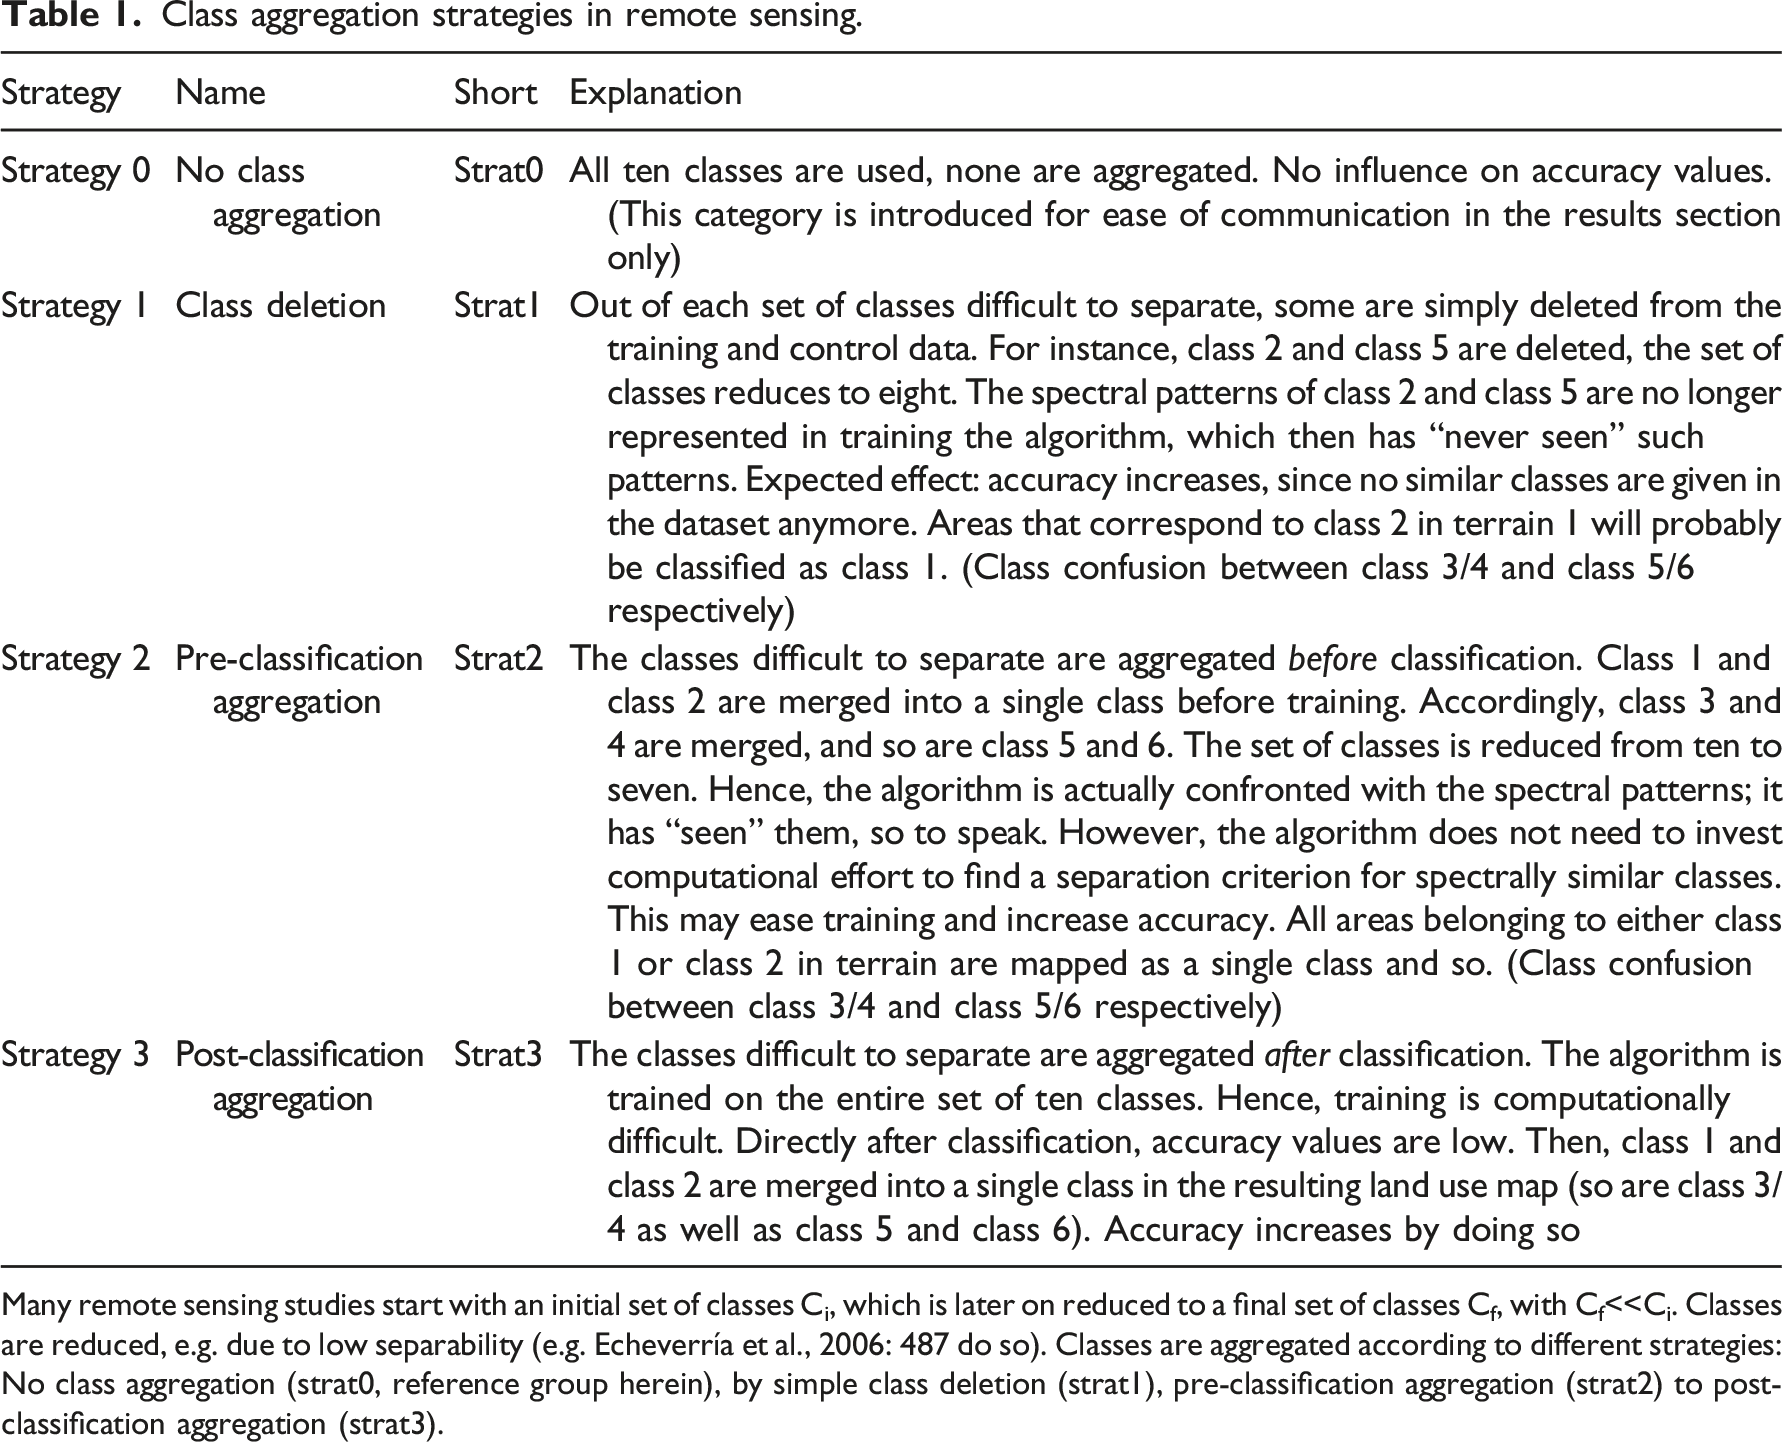
Many remote sensing studies start with an initial set of classes Ci, which is later on reduced to a final set of classes Cf, with Cf<<Ci. Classes are reduced, e.g. due to low separability (e.g. Echeverría et al., 2006: 487 do so). Classes are aggregated according to different strategies: No class aggregation (strat0, reference group herein), by simple class deletion (strat1), pre-classification aggregation (strat2) to post-classification aggregation (strat3).
Quality indicators
Overview
Quality indicators used herein.
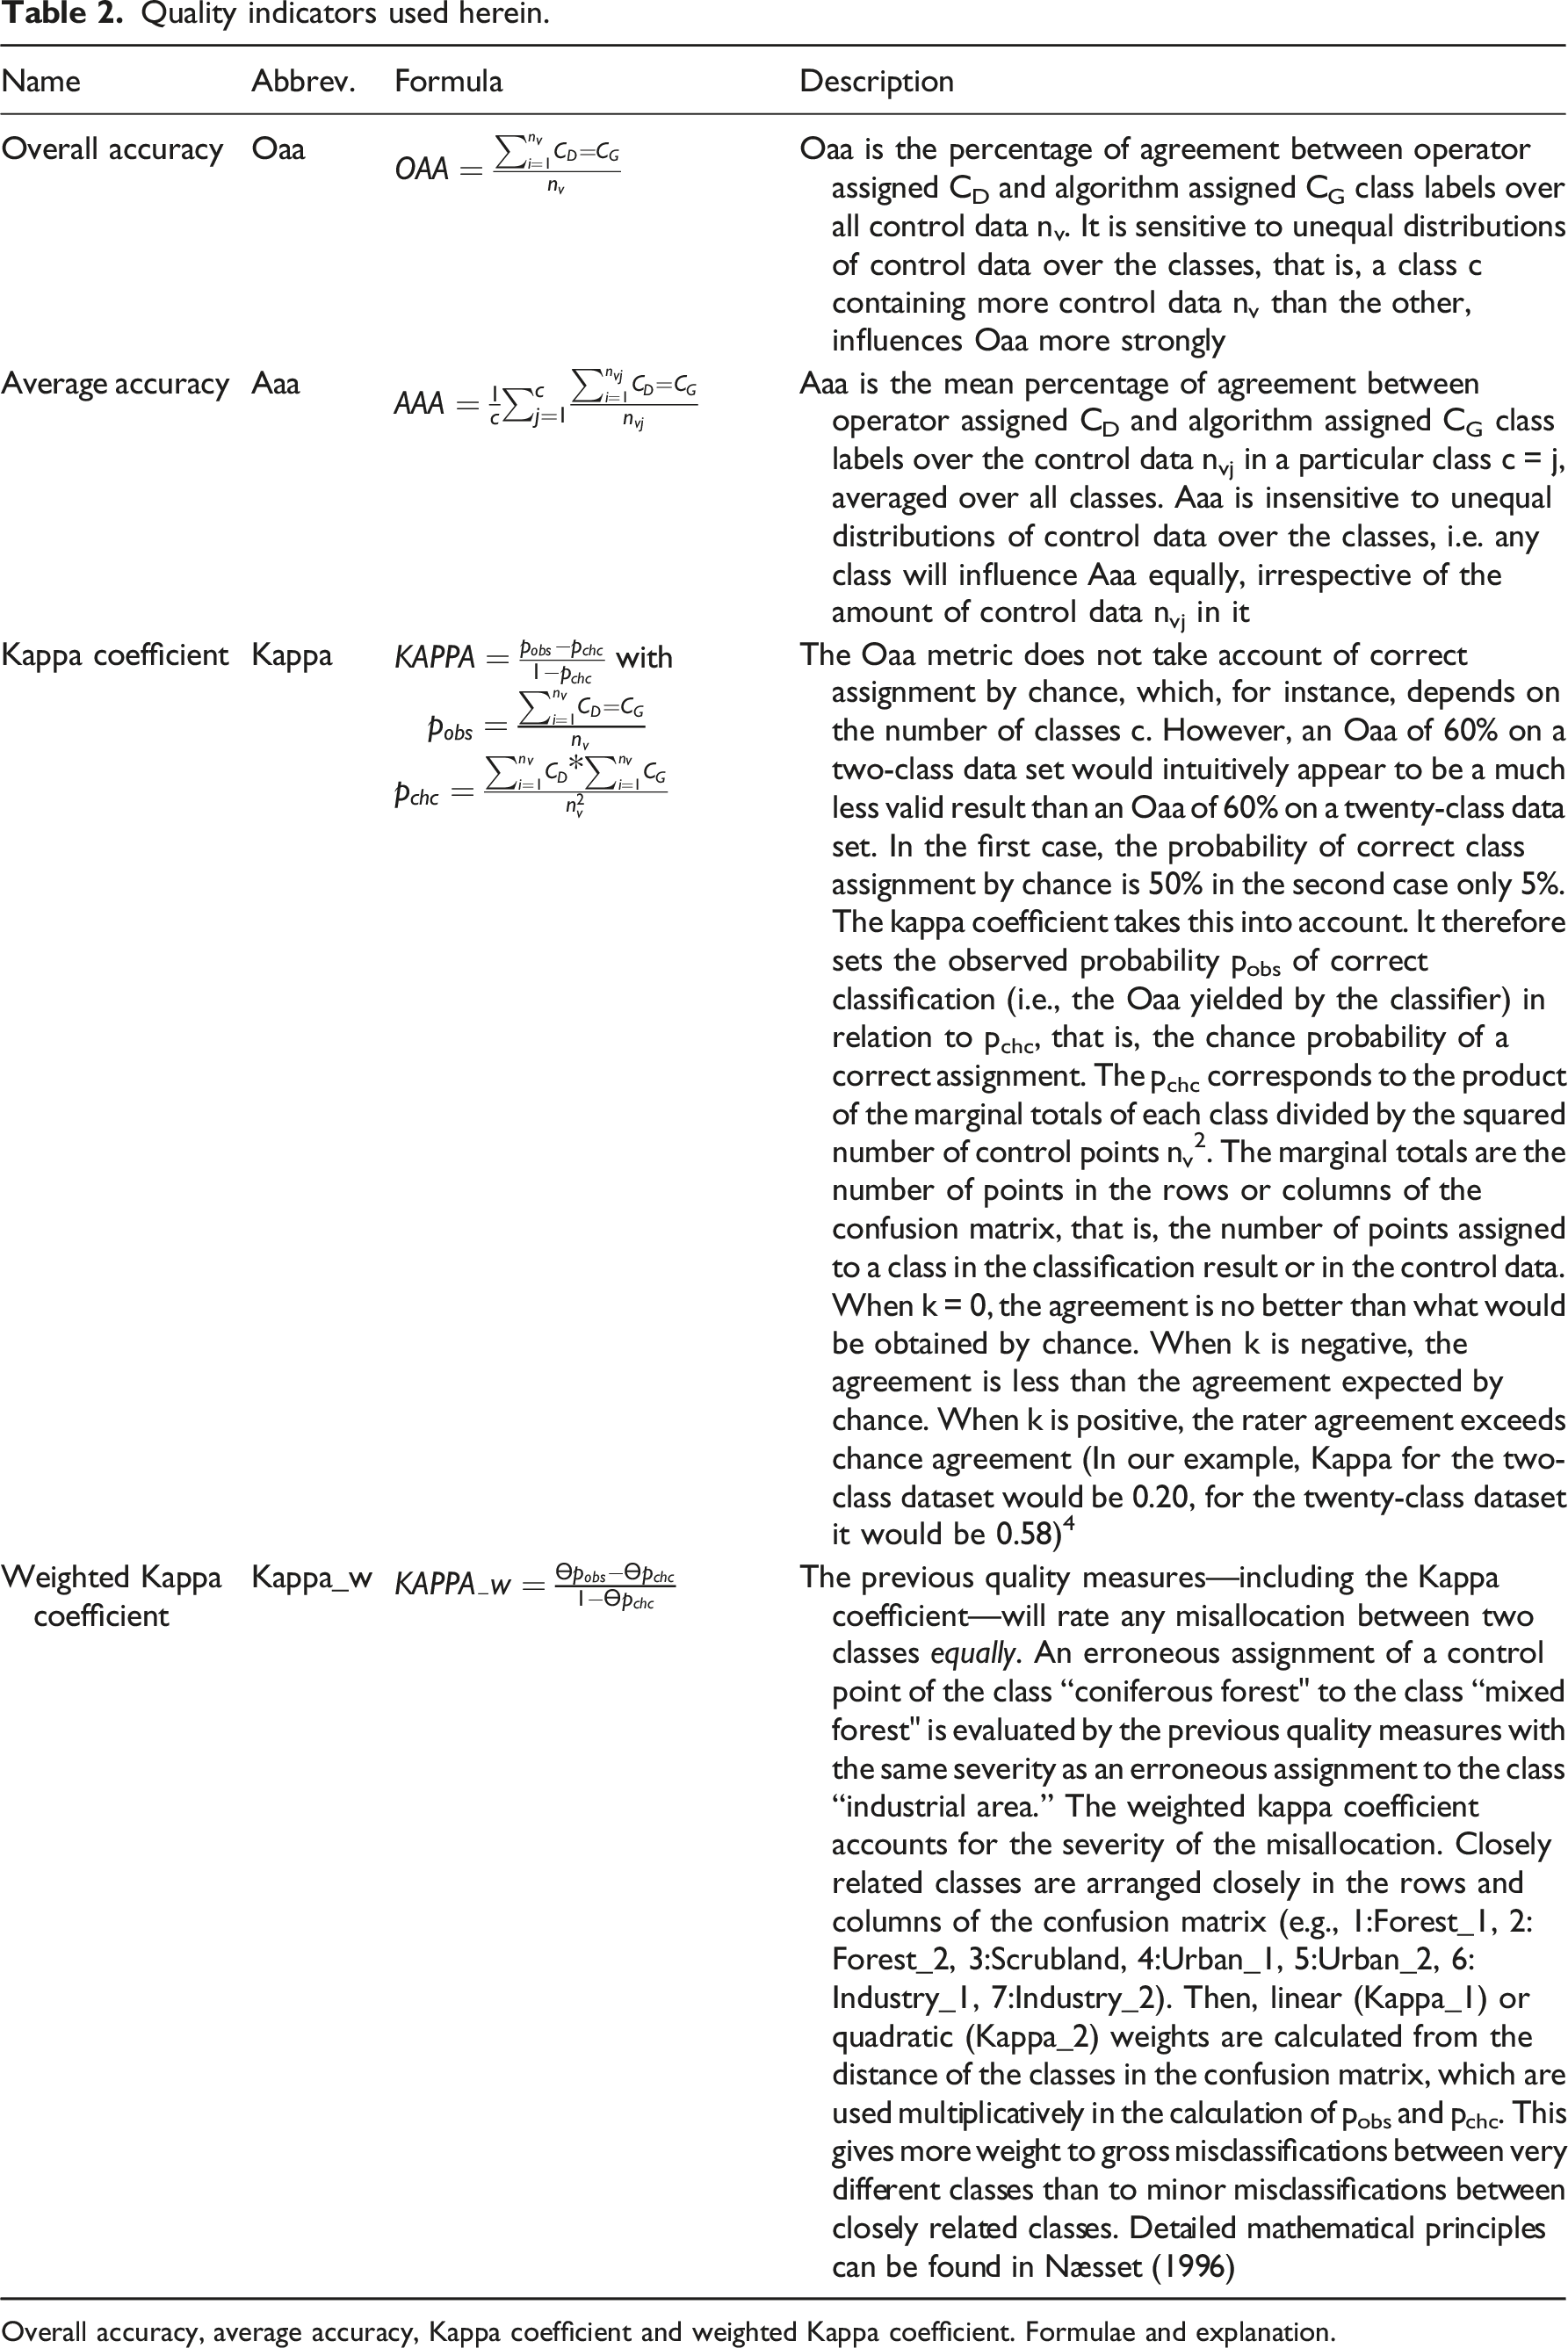
Overall accuracy, average accuracy, Kappa coefficient and weighted Kappa coefficient. Formulae and explanation.
Explanation on Kappa_w
Weight definition for Kappa_w.
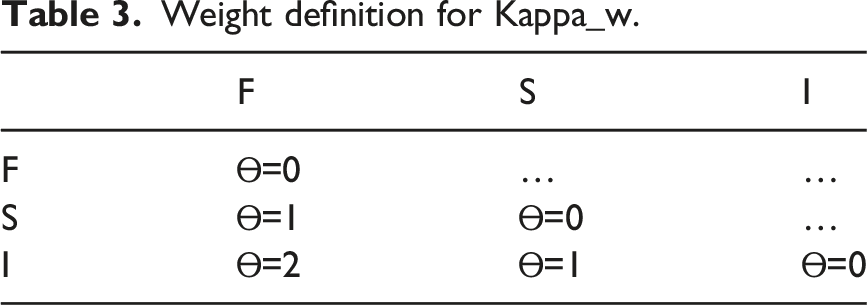
Logically, the diagonal of this matrix contains Ɵ = 0 values since no errors are committed there. Confusions between forest and scrublands are penalized moderately with Ɵ = 1, but confusions between forest/scrublands and industry are harshly penalized with Ɵ = 2. To introduce additional flexibility, an exponential factor is frequently introduced in remote sensing, making the Kappa index linear (Kappa_1: that is weights are Ɵ1) or quadratic (Kappa_2: that is weights are Ɵ2). Of course, the question is how to define the set of weights Ɵ. Several approaches exist in literature (Næsset 1996). 5
I will use two types of defining weights herein spectral weights and geographical weights. The rationale behind this is as follows, defining weights based on spectral properties would be a classical remote sensing approach, relying to immediate spectral features in the data. Defining weights based on geographical knowledge is an alternative approach, I am suggesting. It does not exploit immediate spectral properties, but reflects the cognitive representation of the landscape and its classes according to geographer’s field experiences. • •
Meaning of confusion matrix
Again, in an ideal confusion matrix K, with all elements on the main diagonal, each of these indicators would equal 1 (or 100%, respectively), indicating perfect accuracy. In Braun (2021) I have argued that this accuracy should not be mistaken for quality in terms of the geographical or environmental terms. Any quality indicator in remote sensing will merely state that the labels given by the human operator and the algorithm concur up to a certain extent. Accuracy reflects the relationship between human-operator label and algorithm label—not between algorithm label and geographical reality. Hence, this accuracy is not to say that the land-use map is meaningful in terms of geography or environmental science. The relationship between algorithm label and geographical reality—from which geographical meaning stems—is not reflected by accuracy alone. Instead, it depends on how classes are defined and treated along the process. One important aspect of class handling is the aggregation strategy (strat 0 to strat 3). As Braun (2021) has shown, the effects of the aggregation strategy are much more influential than the technical level of the classifier in boosting accuracy. By aggregating classes, accuracy thresholds can be reached when the classifier itself fails to do so (MALM effect). As explained above, researchers have claimed that quality indicators would prevent the MALM effect. In order to test this proposition, these quality metrics are applied over the different class application strategies given for the support vector machine result (Braun et al., 2010) in the results section.
Results
In Braun (2021) I classified the dataset consisting of ten classes, using different classifiers (MXL, ANN, SVM, ADA). I applied each of the four class aggregation strategies from Table 1 (strat0 – no aggregation, strar1 – class deletion, strat2 – pre-classification aggregation, strat3 – post-classification aggregation). Hence, a total of 16 different land-use maps (four classifiers × four strategies) was the result. I assessed the quality of each of these datasets with just one quality indicator (overall accuracy Oaa), and demonstrated that the MALM effect existed independently of classifier choice. Since herein, I want to elaborate the effect of quality indicator choice, I use overall accuracy (Oaa), average accuracy (Aaa), and unweighted as well as weighted Kappa index. In order to keep the set of results sufficiently small to allow for efficient explication.
Weight definition
Data-driven weight definition for weighted Kappa.
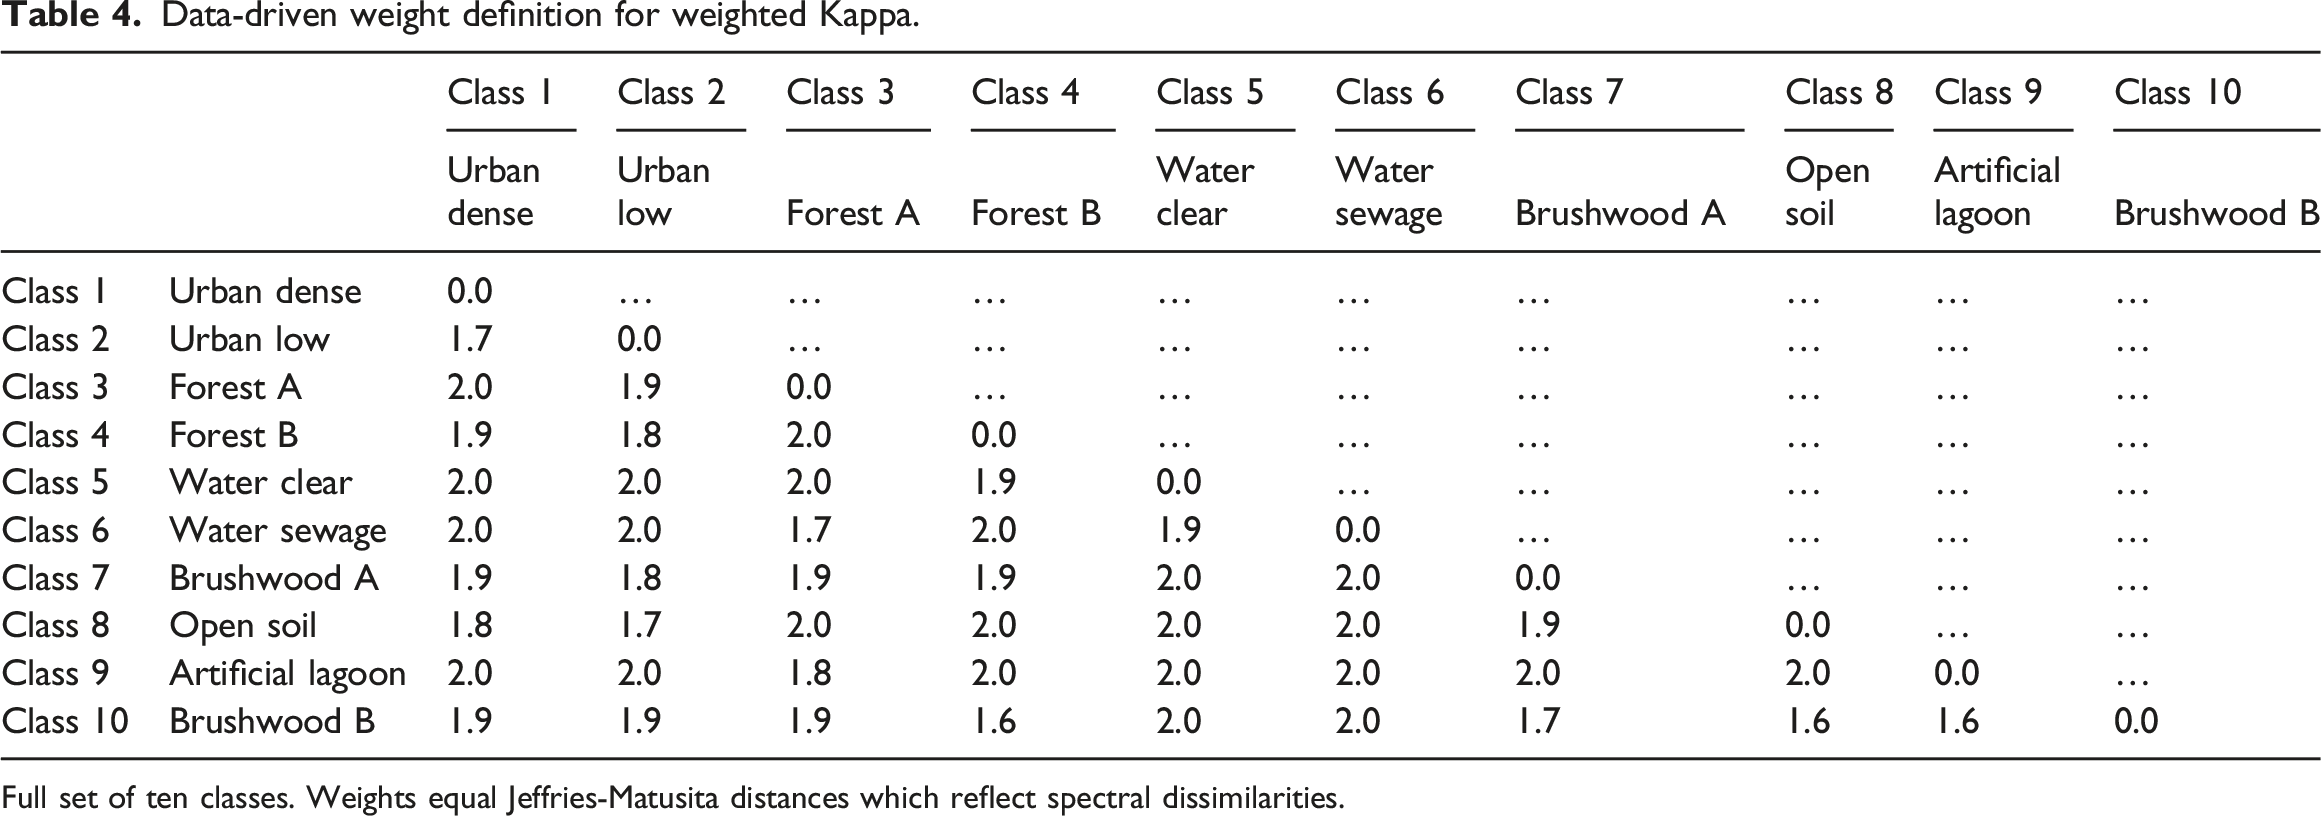
Full set of ten classes. Weights equal Jeffries-Matusita distances which reflect spectral dissimilarities.
Data-driven weight definition for weighted Kappa.
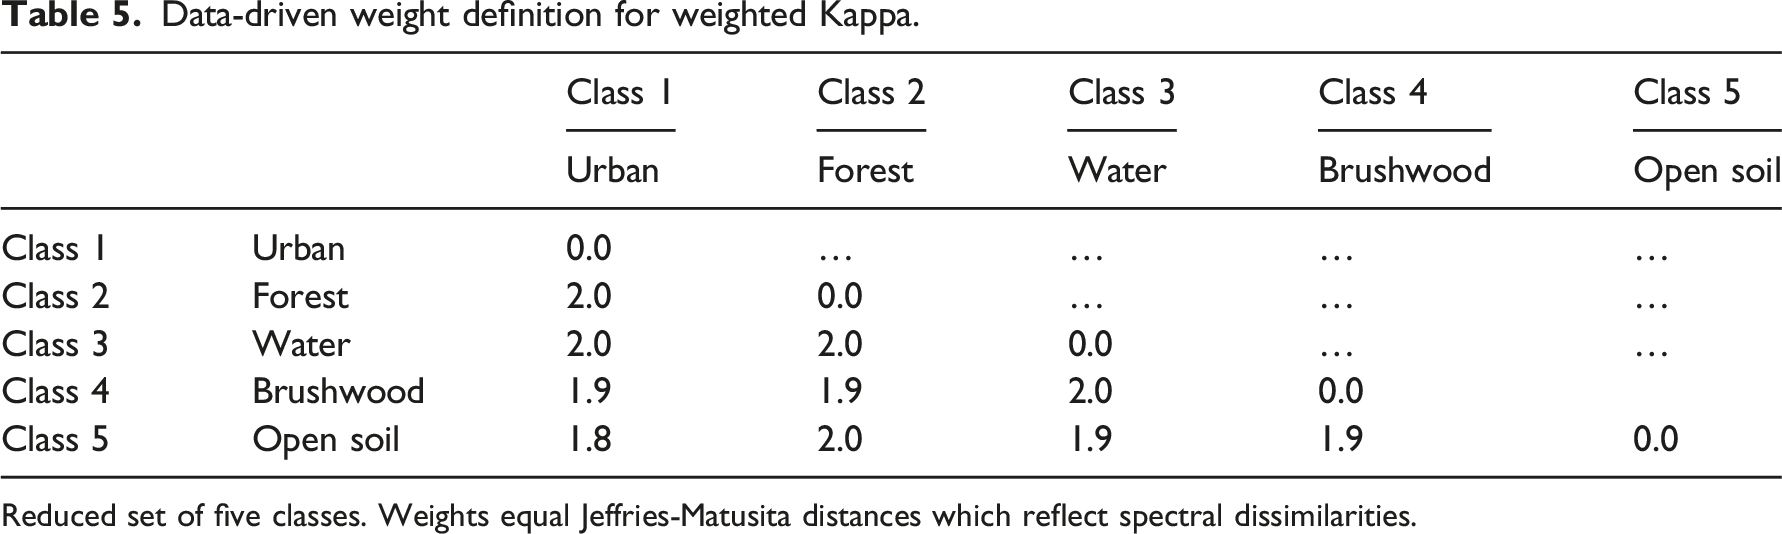
Reduced set of five classes. Weights equal Jeffries-Matusita distances which reflect spectral dissimilarities.
Knowledge-driven weight definition for weighted Kappa.
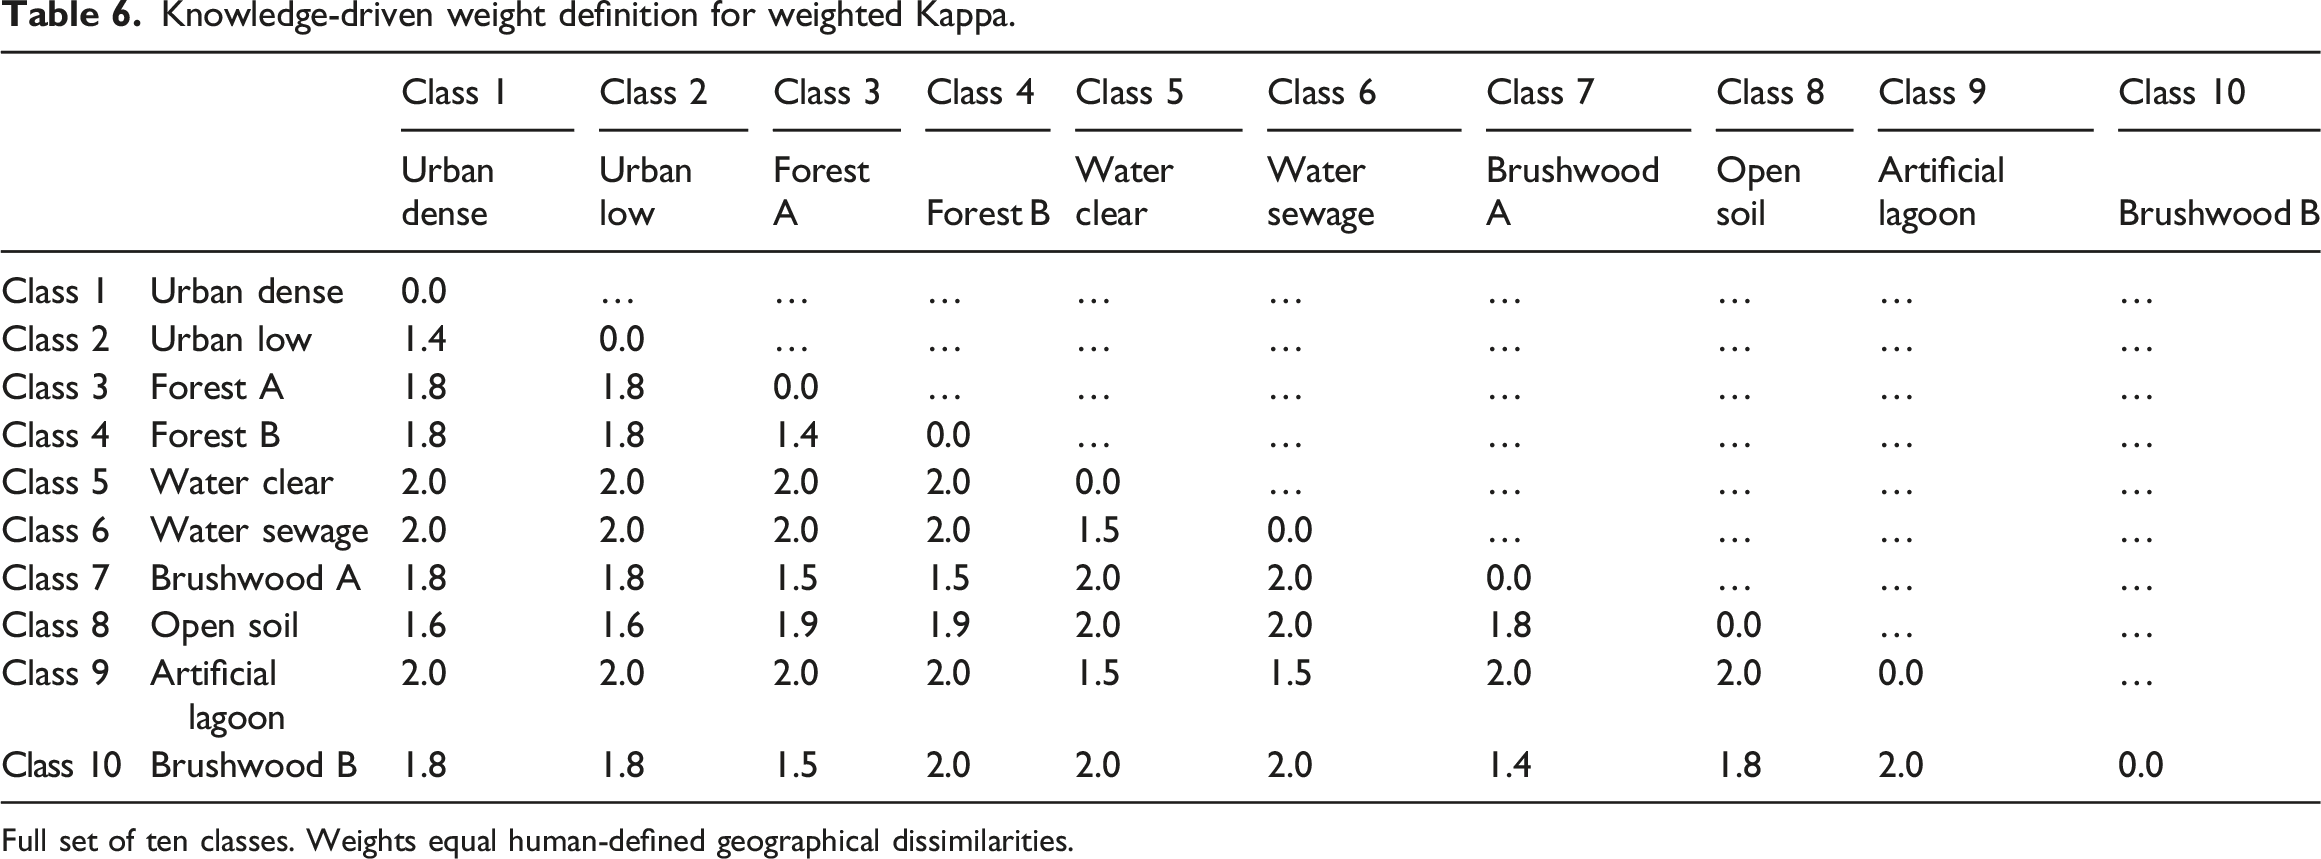
Full set of ten classes. Weights equal human-defined geographical dissimilarities.
Knowledge-driven weight definition for weighted Kappa.
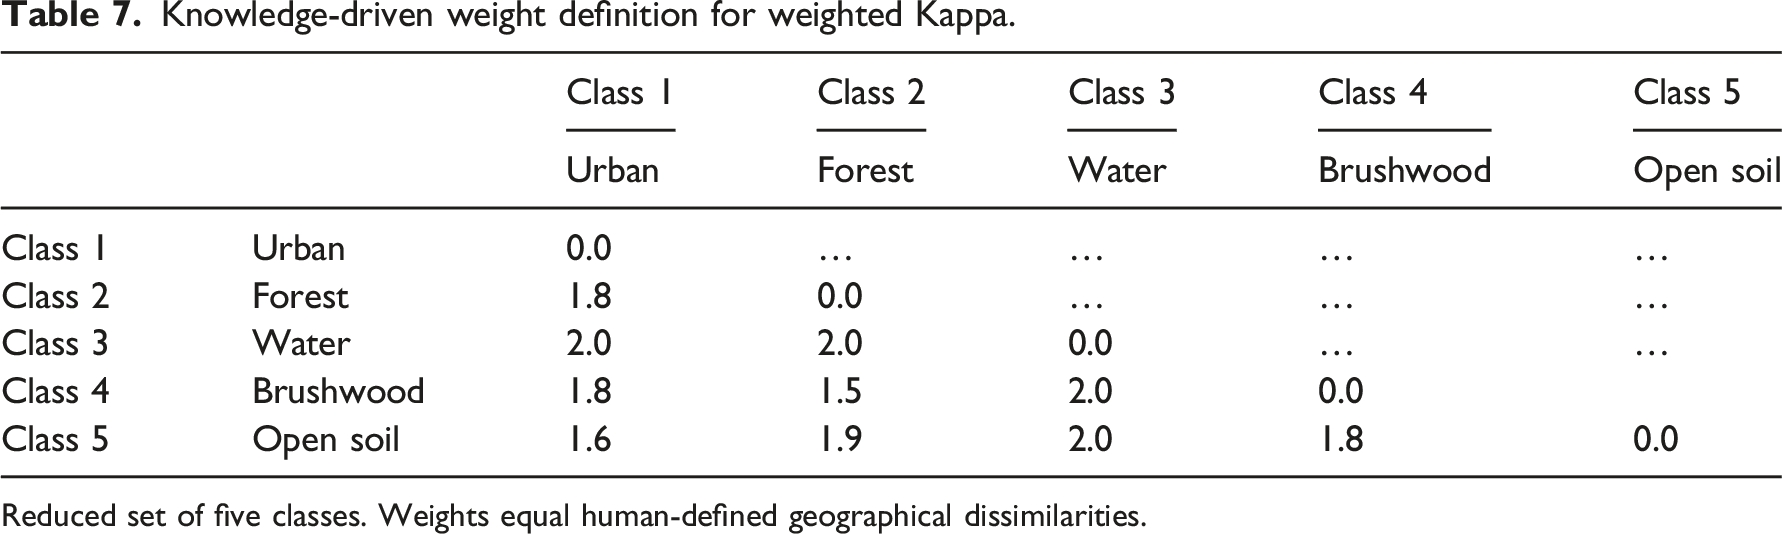
Reduced set of five classes. Weights equal human-defined geographical dissimilarities.
For the reduced class set, I proceeded as follows. Since urban areas and waterflows are very different, they receive a weight of two, since both trees, shrubs, and open soils can occur in urban areas, they are assigned lower weights. Since forest and shrublands are geographically very similar, they receive the lowest weight. Waterflows are geographically very different from vegetated areas, hence receiving high weights. For the full class set, I followed a similar logic. Particularly, I defined lowest weights to the sets of geographically similar classes (Figure 1).
Results for quality indicators
At first, I will refer to the results produced by assessing quality with Oaa, Aaa, unweighted Kappa, weighted Kappa_1, and weighted Kappa_2. For the weighted Kappa_1 and Kappa_2, I used the spectral weights in Figure 2. Figures also contain the numeric accuracy values (converted to percentages). The red column refers to strat0: no class aggregation. The blue columns refer to class aggregation strategies (strat1 – class deletion, start2, start3). As in Braun (2021) the MALM effect consists in an accuracy increase by applying class aggregation strategies which somehow rid the dataset of spectrally difficult separations of classes (either by deletion in strat1, or by pre- or post-classification aggregation in strat2 and strat3). Results are in many ways consistent. As can be observed, a MALM effect exists independently of the quality indicator used. For each indicator (Oaa, Aaa, Kappa, Kappa_1, and Kappa_2) a substantial accuracy increase results by class aggregation. For each, the class deletion (strat1) yields the strongest accuracy increase, followed by post-classification aggregation 3 (except for one case). Strat0 – no aggregation did not meet the 90% threshold by Shao and Wu (2008), regardless of which quality indicator was applied. In each case of class aggregation (strat1 – class deletion, 2 or 3) this threshold was exceeded by every quality indicator. Interestingly, the weighted Kappa was not superior to the unweighted ones. Hence, considering spectral class differences did alter accuracy values. Accuracy results for SVM-classification based on different class aggregation strategies (strat0 – no aggregation, strat1 – class deletion, strat2 – pre-classification aggregation, strat3 – post-classification aggregation) and different quality indicators (Oaa, Aaa, Kappa, Kappa_w). Data-driven weight definition for weighted Kappa (Kappa_1, Kappa_2): None of the quality measures used prevents the MALM effect, that is, accuracy increase by uncautiously adopted class aggregation strategies (cf. Accuracy increase from red to blue columns).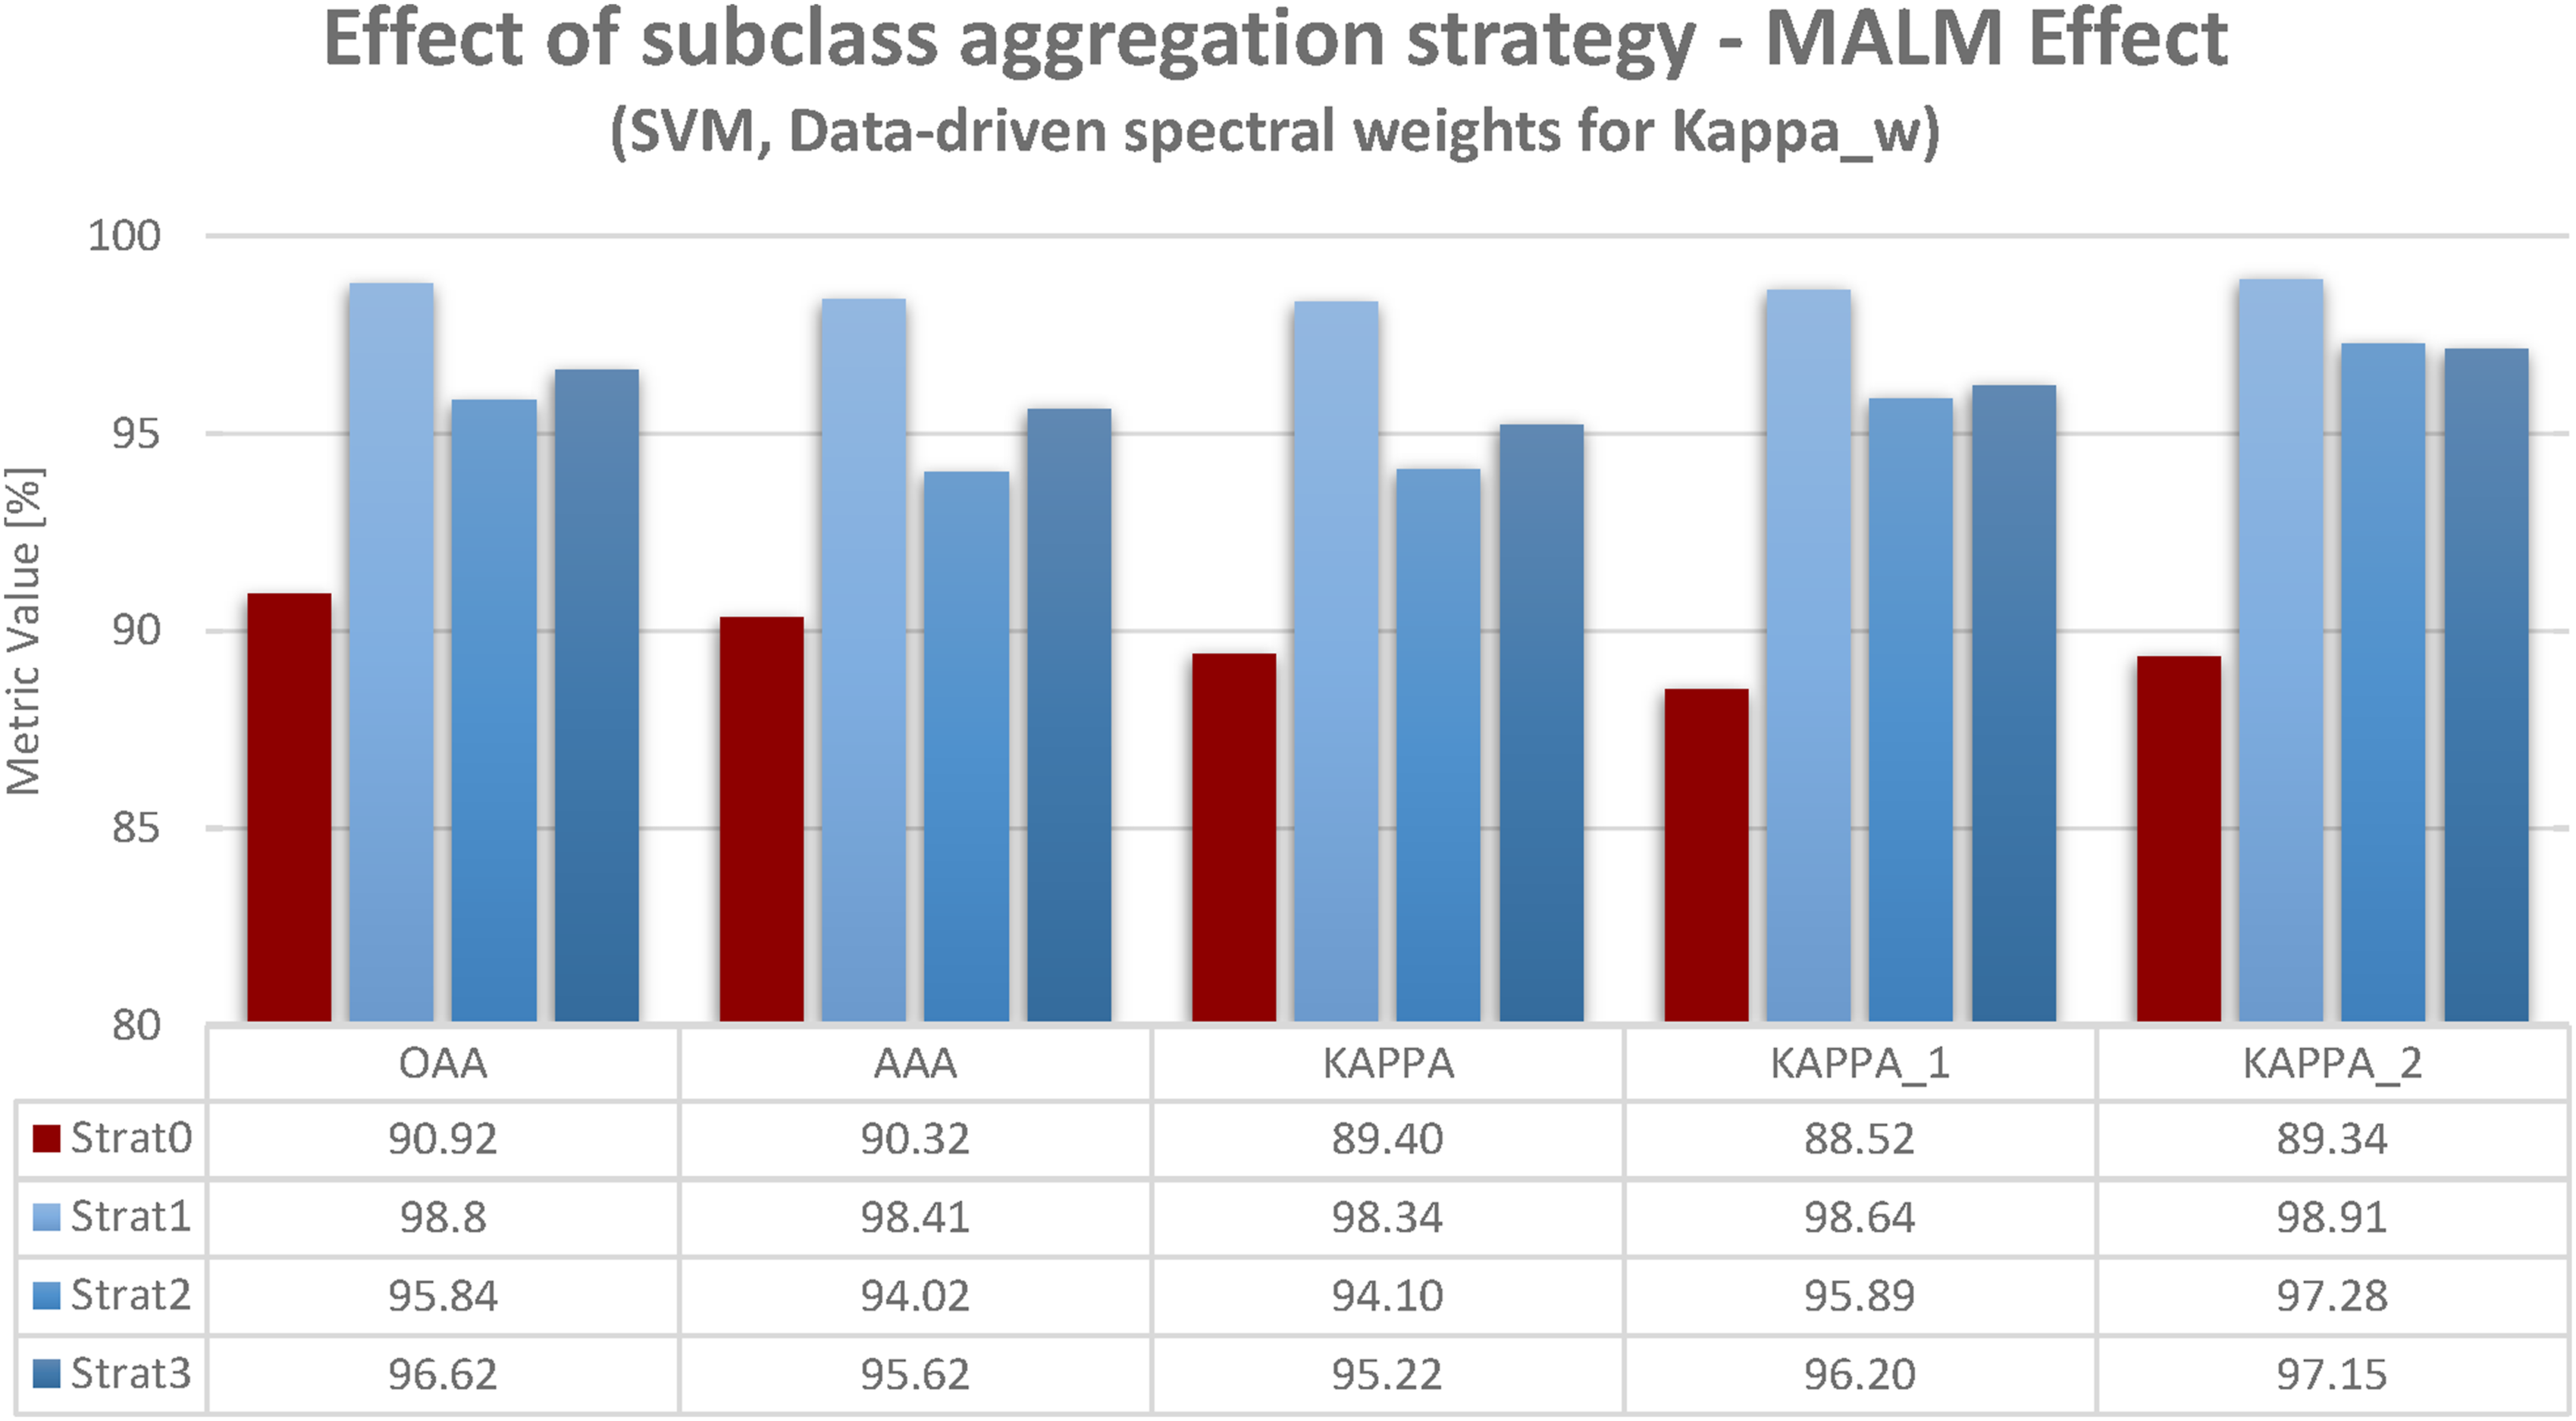
In order to elaborate on this, I used results derived using knowledge-driven geographical definition of weights for Kappa_w given in Figure 3. The difference to Figure 2 is merely the two right sets of columns (for Kappa_1 and Kappa_2). Interestingly, for this set of results, the MALM effect is not as pronounced as for data-driven spectral weighting. This is not due to class aggregation’s (strat1 – class deletion, 2, 3) accuracy values being lower, but for the no aggregation strategy (strat0) accuracy values being higher in the first place. This finding will be more explicitly elaborated in the next subsection. Accuracy results for SVM-classification based on different class aggregation strategies (strat0 – no aggregation, strat1 – class deletion, strat2 – pre-classification aggregation, strat3 – post-classification aggregation) and different quality indicators (Oaa, Aaa, Kappa, Kappa_w). Knowledge-driven weight definition for weighted Kappa (Kappa_1, Kappa_2): Using knowledge-driven Kappa_w relieves MALM by increasing initial accuracy (red column). This shows that applying our geographical knowledge—not technical sophistication—improves the usability of results.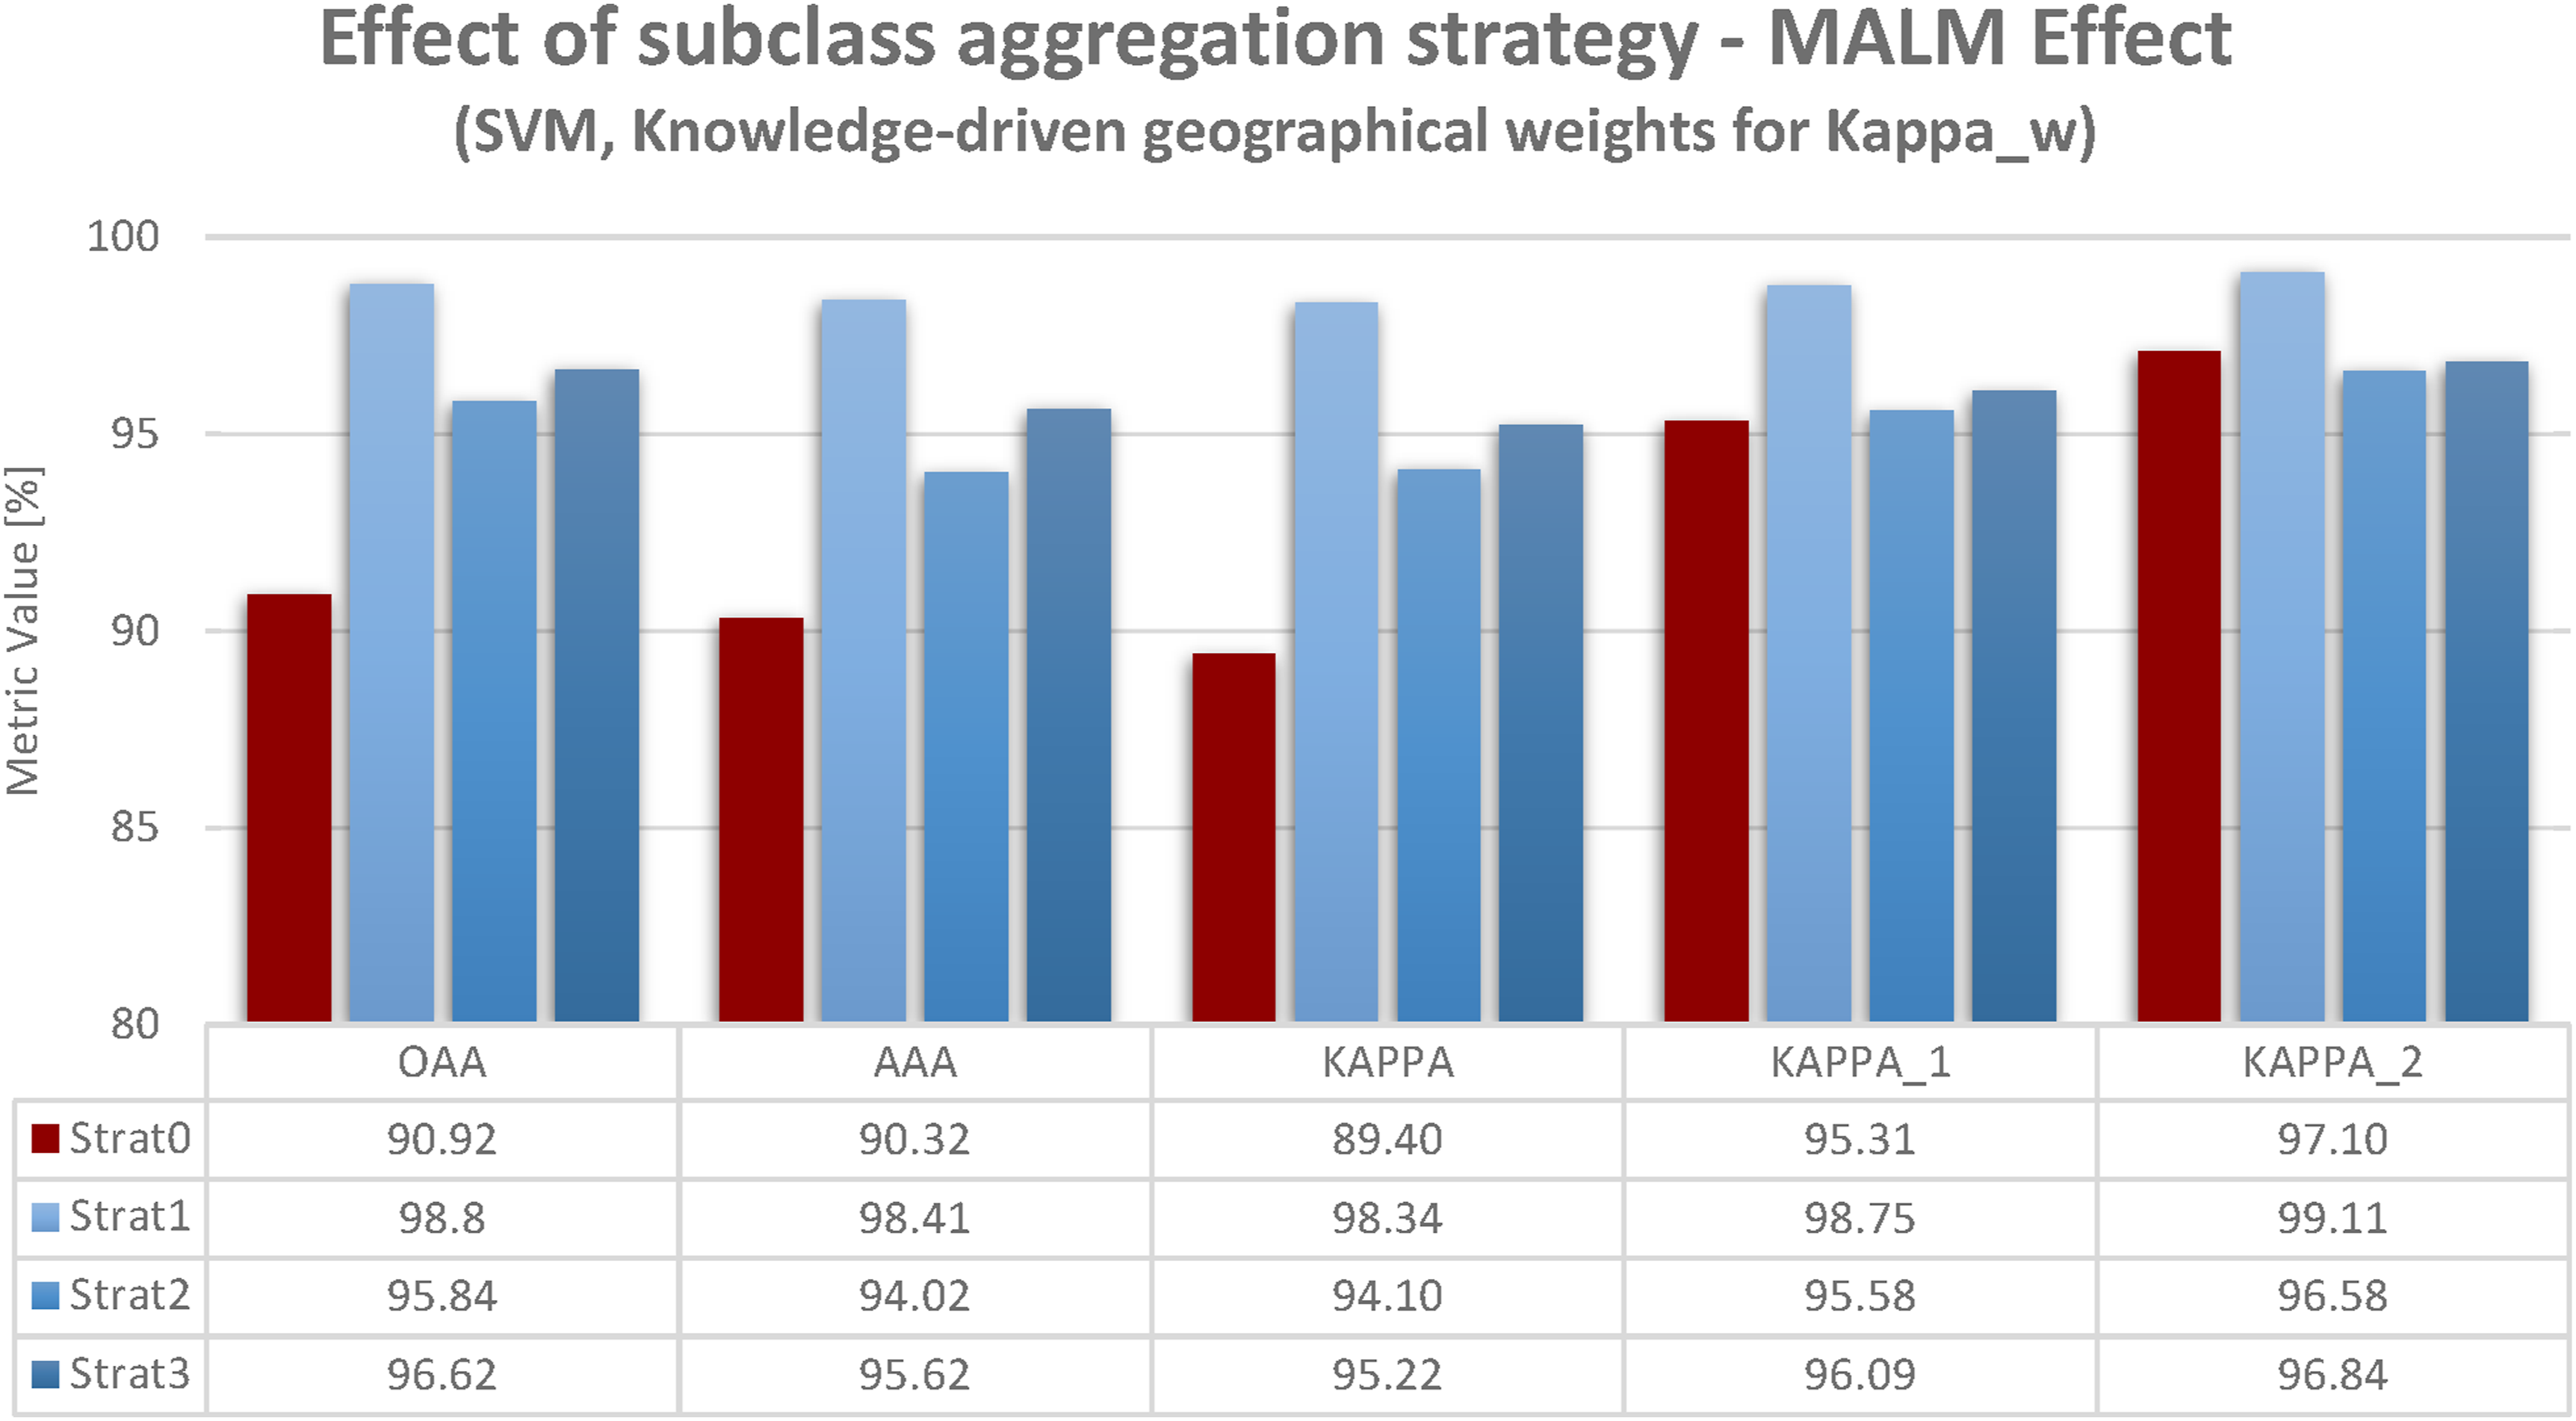
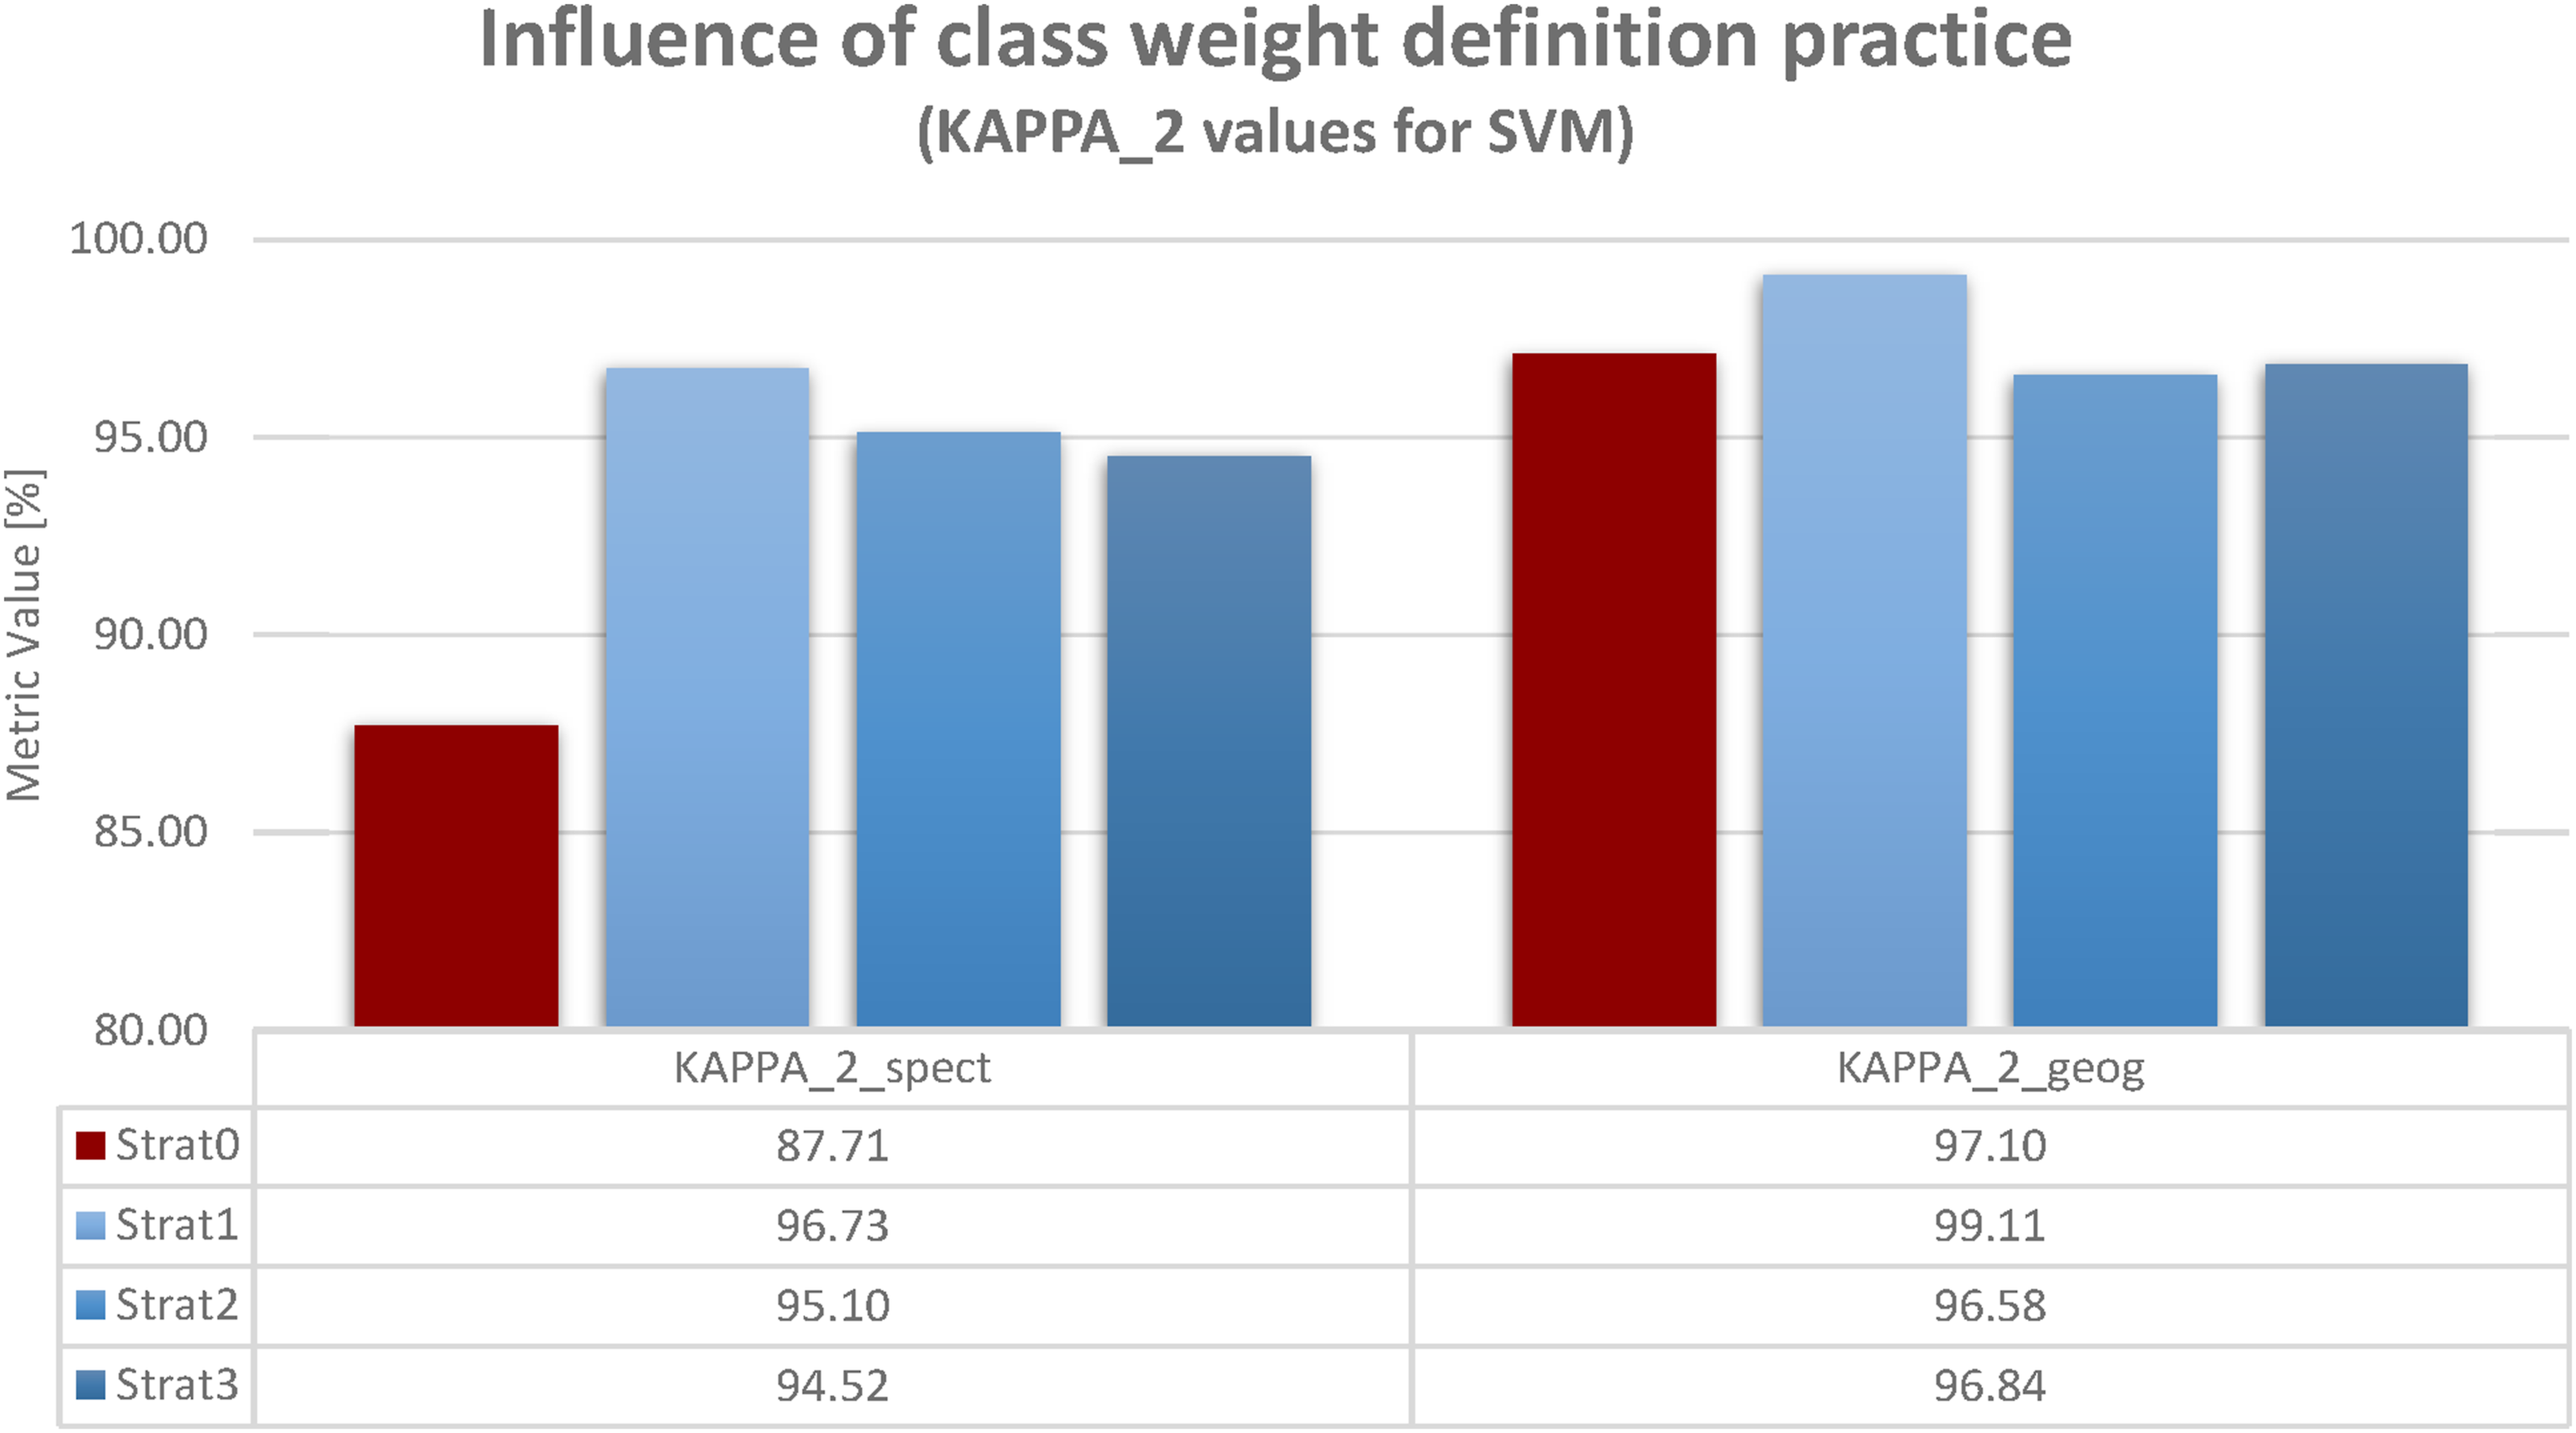
Comparison of data- and knowledge-driven weight definition
In contrast to the figures in the latter subsection, which show accuracy values for all quality indicators but just one definition type of weights (data-driven spectral weighting in Figure 2 and knowledge-driven geographical weighting in Figure 3) the figures in this subsection compare both types of weight definition, but show just one quality indicator (Kappa_1 in Figure 4 and Kappa_2 in Figure 5). Results are rather similar. This reflects two aspects. Firstly, the linear or quadratic Kappa do not make much of a difference. More importantly, for both results, MALM is far less pronounced for knowledge-driven geographical weighting. In both figures, strat0 (no class aggregation) even slightly exceeds the accuracy values achieved by some class aggregation strategies. Influence of class weight definition strategy. Weighted Kappa_1: Defining weights according to geographical knowledge reduces accuracy losses for strat0 (no aggregation) and thus relativizes MALM. The figure shows a direct comparison between spectral and geographical class weighting for Kappa_1 to emphasis the main finding: geographical knowledge makes a difference in handling MALM. Influence of class weight definition strategy. Weighted Kappa_2: Defining weights according to geographical knowledge reduces accuracy losses for strat0 (no aggregation) and thus relativizes MALM. The figure shows a direct comparison between spectral and geographical class weighting for Kappa_2 to emphasis the main finding: geographical knowledge makes a difference in handling MALM.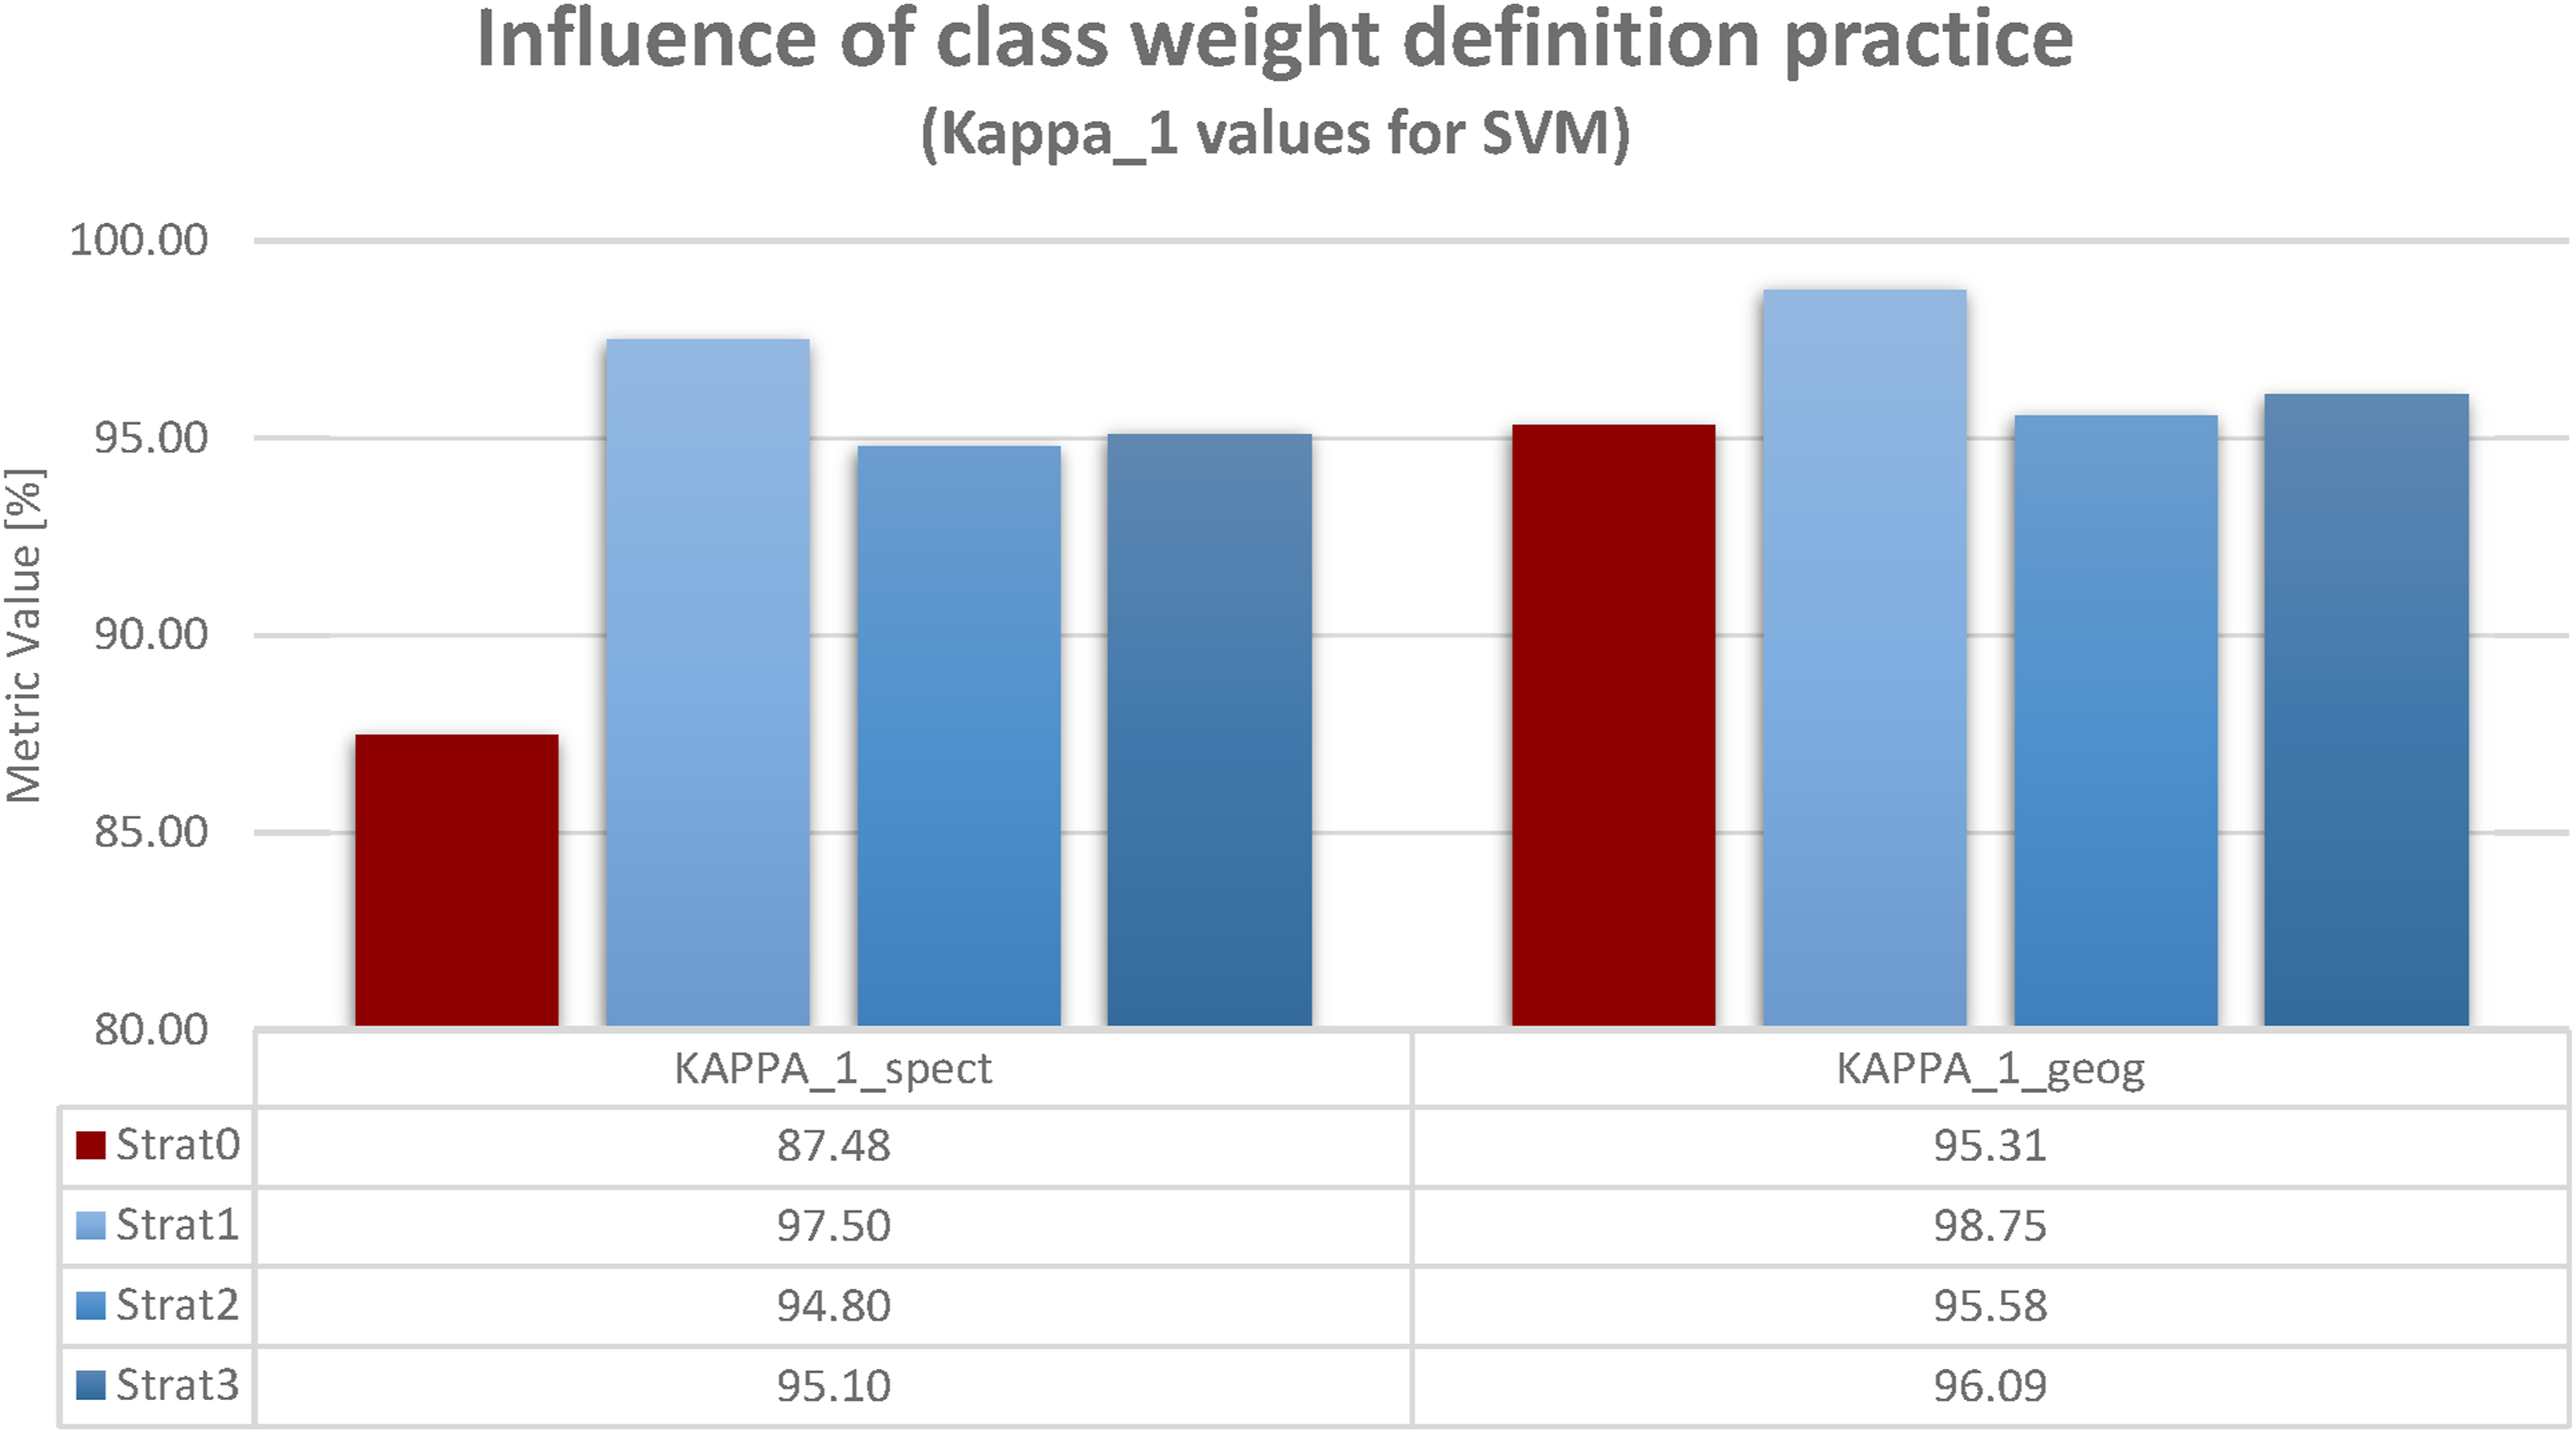
Generality of results: Summary for all classifiers
The previous sections have presented results just for SVM. This stems from my desire to highlight my main point: the influence of the quality indicator and not the classifier (which were discussed in Braun, 2021). Nevertheless, for the sake of completeness, I will summarize the results for all classifiers. Values for the metrics according to Figures 2 and 3 are given in the appendix (Figures 7 to 14). In order to present these findings efficiently, Figures 6 has been developed. As Figure 4 has shown for Kappa_1 and Figure 5 for Kappa_2, there is an important effect of integrating geographical knowledge as weights for Kappa. Consider the accuracy difference for two strategies for a particular classifier (e.g., SVM strat3 vs. SVM strat0). The accuracy difference equals accuracy(strat3)-accuracy(strat1). Comparing geographical weights with spectral weights, these differences are reduced. For instance, see Figure 4. The accuracy difference between strat3 and strat0 for spectral weights is 95.10 - 87.48 = 7.62. In contrast, for geographical weights, the accuracy difference between strat3 and strat 0 is 96,09 – 95,31 = 0.78. Hence, MALM is less pronounced for geographical weights because the accuracy is higher for strat0 in the first place. This is due to the fact that geographically less important differences are not emphasized in geographical weights. Now, Figure 6 compares accuracy differences for the strategies (strat3 vs. strat0, strat2 vs. strat0, strat1 vs. strat0) for all classifiers and for both, Kappa_1 and Kappa_2. They are depicted as spider graphs. The darker color (i.e., dark green for Kappa_1 and dark yellow for Kappa_2) represent spectral weights. The brighter color (i.e., bright green for Kappa_1 and bright yellow for Kappa_2) represent geographical weights. The absolute accuracy differences are the three dimensions of the spider web. Each gray line of the spider web is two percent absolute accuracy difference (inner line = 2%, outer line = 12%). For every classifier and either Kappa_1 and Kappa_2 the spider web of geographical weights lies completely within the spider web of spectral weights. That is, the findings from Figures 4 and 5 can be generalized. For every approach MALM is relieved by incorporating geographical knowledge instead of using purely technical procedures (spectral weights based on JM-distances). Full display of accuracy increases when using spectral vs. geographical weights for weighted Kappa. Information for all classifiers and all strategies given. Regardless of the classifier chosen (MXL, ANN, SVM, ADA) and regardless of the aggregation strategies chosen (shift from S0 to S1, shift from S0 to S2 or shift from S0 to S3) the accuracy gains yielded for Kappa_geog are always lower than the accuracy gains yielded for Kappa_spec (bright triangle always within dark triangle): This incidactes that for each classification/aggregation approach applied, MALM is always less severe when using geographical weigths, since geographical weights always increase accuracies for S0.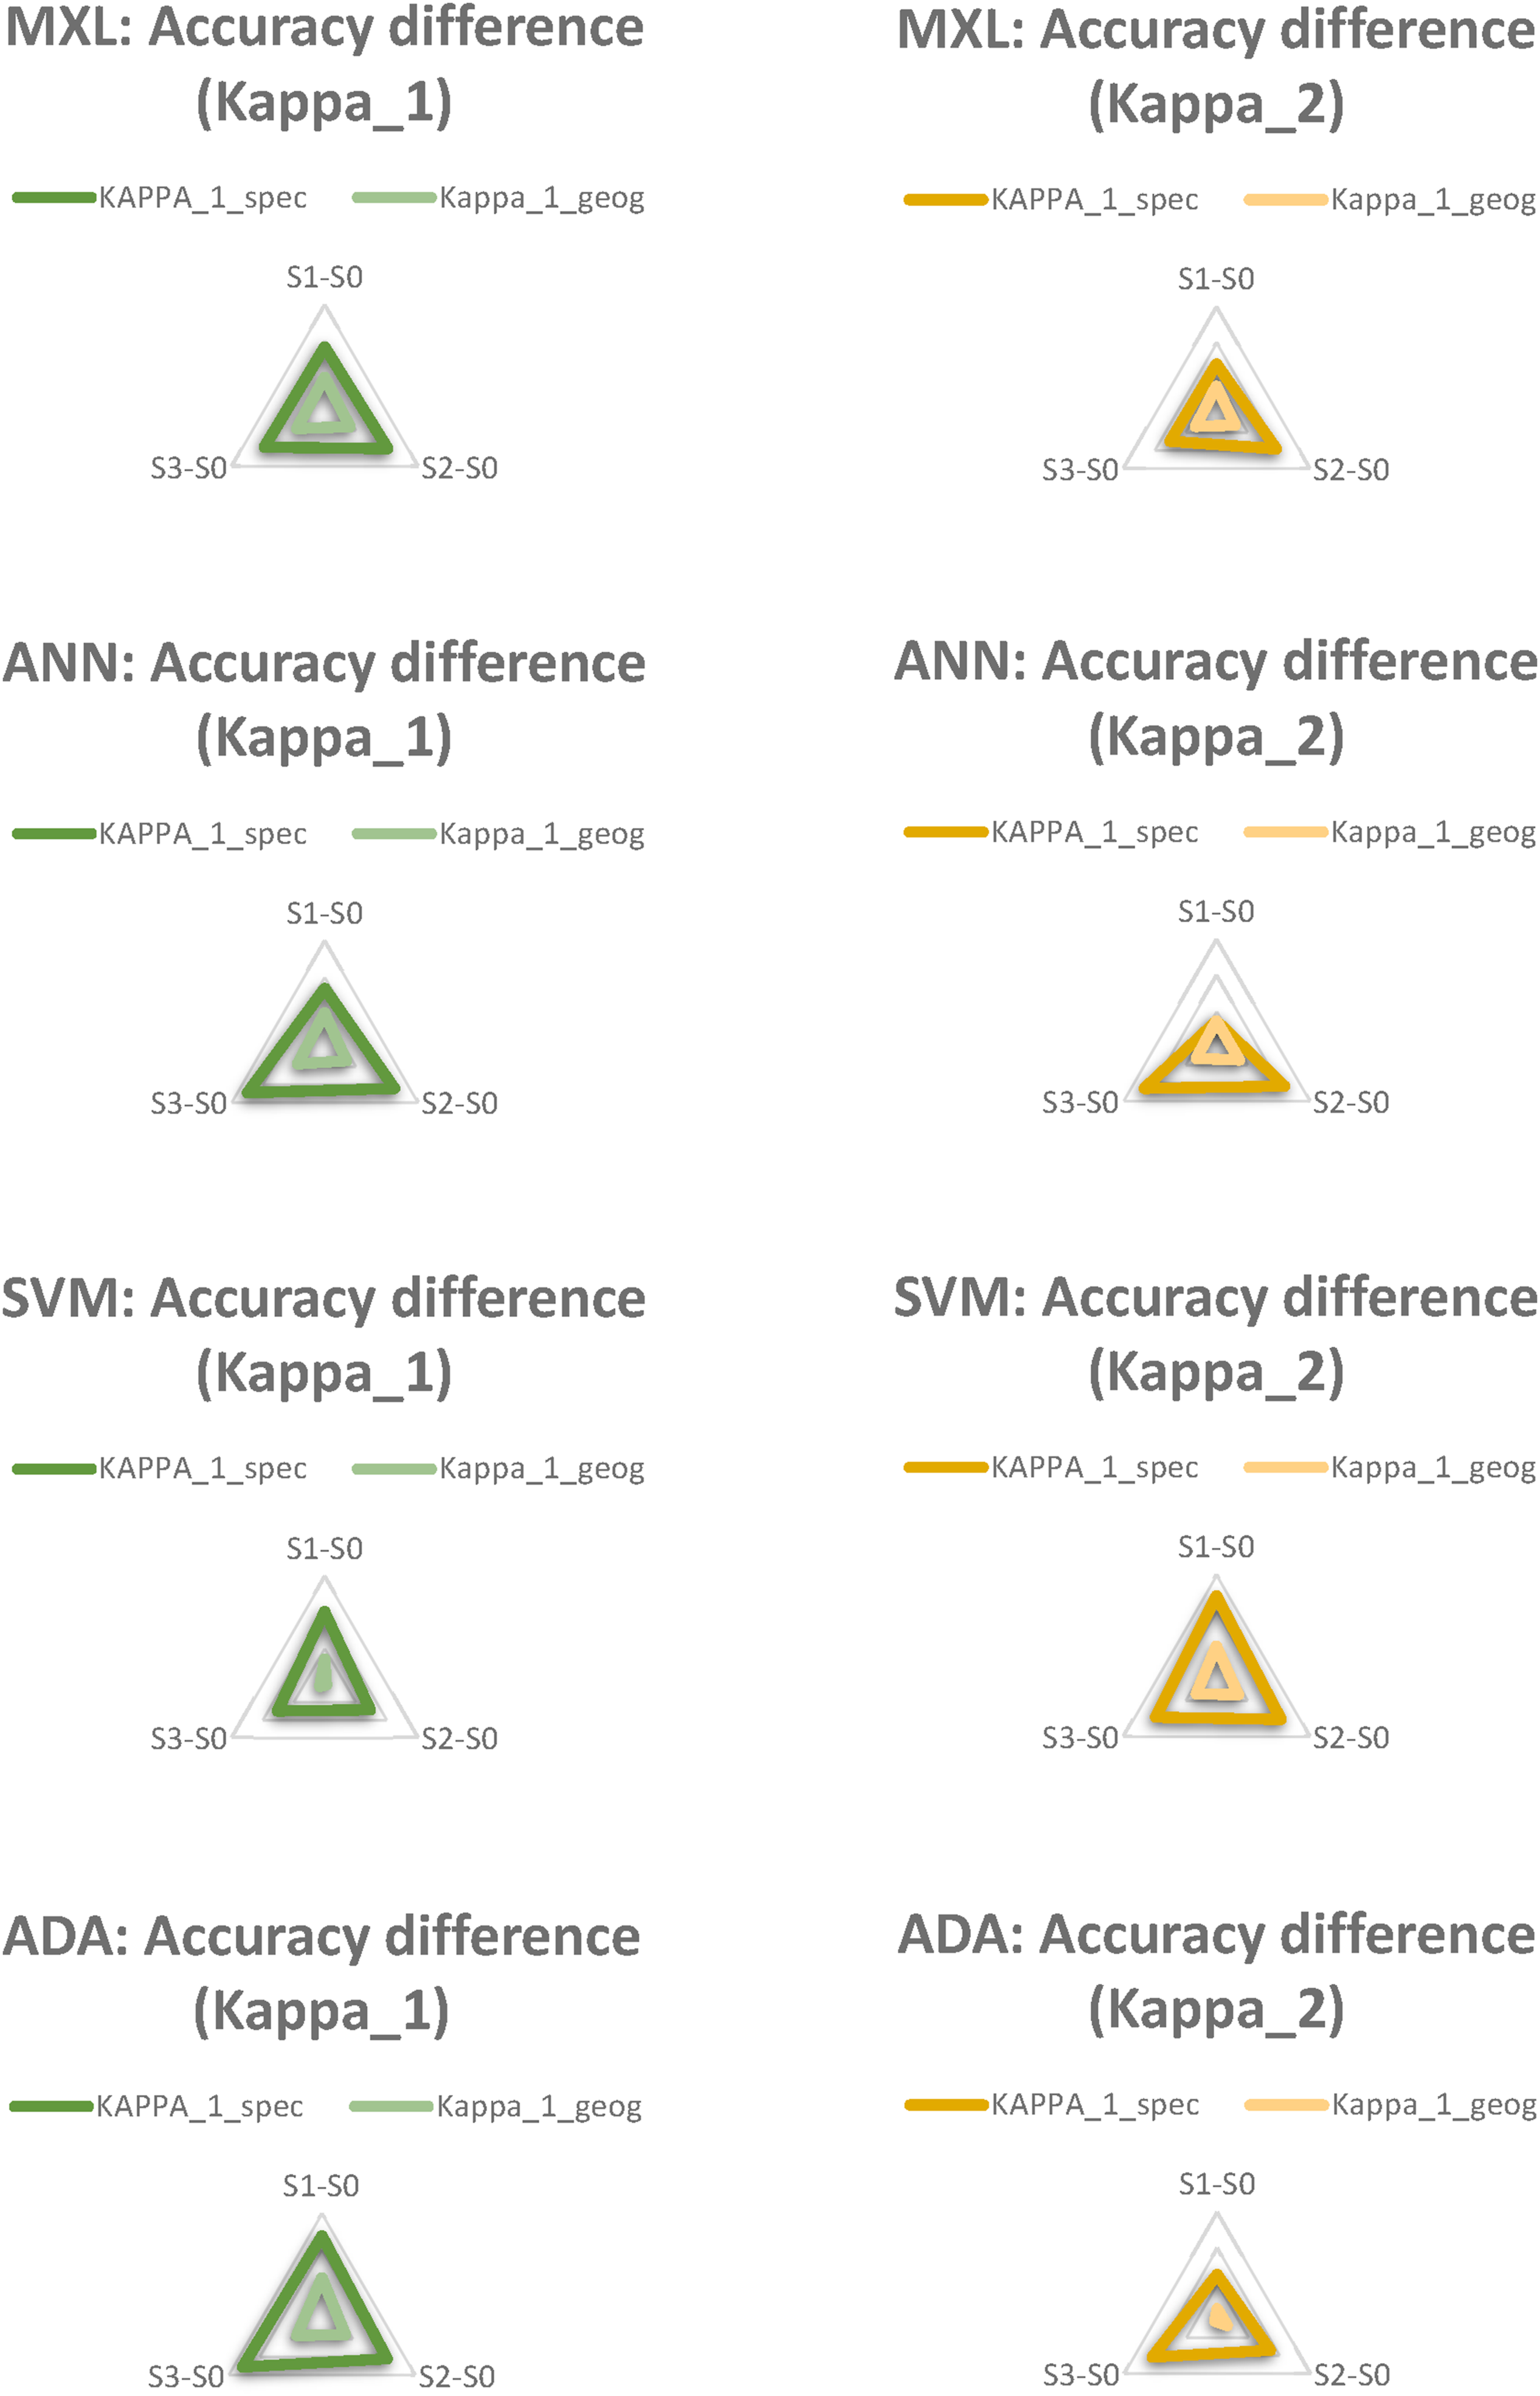
Discussion
Consistencies with previous findings
Regardless of the classifiers used, if they are incautiously applied, class aggregation strategies may lead to a boost in accuracy values, but a loss of geographical qualities. The result would be more acceptable according to the standards of the remote sensing community, but less acceptable according to the standards of the geographical or environmental community. The choice of quality indicator does not compensate for this. Just as classifier choice is affected by the MALM effect, so is choice of quality indicator. It seems to me that there was no reason to assume that the quality indicator would prevent MALM in the first place. MALM occurs due to a mismatch of class handling in relation to geographical/environmental realities. A set of relevant classes in terrain (real classes) is transferred to a set of classes in classification (digital classes). If this is done inappropriately, MALM occurs. All technical remote sensing procedures, i.e. the classification itself, but also the quality assessment, operate on the digital set of classes. They do not “know” the original classes as they appear in the terrain, nor are they aware of a “mapping function” between the original classes and the digital classes. Remote sensing method developers would immediately argue here that classification is, after all, this very “mapping function.” This is exactly the crucial point. This mapping function is created based on the spectral (sometimes spectral-spatial Braun et al., 2014) properties, but loses all other environmentally relevant properties of the classes. Since the problems associated with MALM do not occur within the domain of digital classes, but on the relationship of real classes and digital ones, no intrinsic procedure can avoid issues associated to MALM; not even theoretically. What is required to avoid MALM is to address the tension between original and digital classes. This tension is that the objects in the reality of the terrain, which are to be grouped into classes, have a large set of properties (Braun, 2021, Figure 1, p. 710). Some of these properties are spectral properties. These can be experienced both in the terrain and in the remote sensing dataset—albeit in very different ways. However, these objects also have other properties in the terrain reality than just spectral ones. These can be experienced in the remote sensing data set at most implicitly, but often not at all. For this reason alone, no direct correspondence is possible between the empirical experience of a terrain object and an image object. However, there are also emergent phenomena that have to do with the context of objects. A silver fir can either be a natural element of a conifer forest, an economic element of a tree plantation or—as a Christmas tree—a cultural element in the inner city. It is crucial to critically problematize this tension between the reality of the terrain and the reality of the image in socio-technical research practice—instead of trying to “technically slay it” by hoping that the highest algorithmic standard will somehow make it obsolete.
New revelations of recent findings
The result presented in the comparison between class weighting strategies in the Kappa index (Subsec. “Comparison of data- and knowledge driven weight definition”) presented some new and interesting findings that were unexpected to me. Data-driven spectral definition of the weights suffered as much of the MALM effect as any other procedure addressed herein or in Braun (2021). However, knowledge-driven geographical definition of weight did not suffer from this effect. This finding is not related to the fact that there was no accuracy increase due to class aggregation. Instead, accuracy values without aggregating classes were higher in the first place. A couple of questions arise from this. First, it could be asked where the difference lies, if an SVM classified map with strat0 (no aggregation) an SVM classified map with strat1 (class deletion) both yield 90% accuracy according to geographically weighted Kappa_2. The answer is straightforward. In the first map, one would see the entire set of classes defined, while the second map would omit some of them. Hence, the first map would be much more valuable to geographical fieldwork, while still yielding very high accuracy values. This is achieved by the fact the lower penalization of confusion between similar classes affects the quality measure less. The second question would be, whether this finding makes MALM obsolete. One could argue that my statement of the latter subsection (no intrinsic procedure can avoid MALM) is falsified by my own result. The opposite is the case, geographical weighting is knowledge-driven. It aims to integrate geographical knowledge on the real classes into the digital domain. By doing so, it is no longer an intrinsic procedure. Hence, this finding does not falsify, but strengthen my (and Bhaskar 2010) argument: meaningful results can be produced, as long as values and practices are considered. Weighting classes according to what I know about classes, how I value this knowledge and finding a practice to represent this, helps to produce more meaningful results; even in algorithm-based research (Braun et al., 2012). Did this produce an “easy fix” for MALM, in terms of only having to use weighted Kappa with weights appropriately defined? Unfortunately not! As shown in Braun (2021) MALM does not exclusively result from class aggregation but can potentially arise from other aspects of training data definition and handling as well. Not all of them can be easily solved by weighted Kappa with special weights. It cannot even be assumed that appropriately weighted Kappa will prevent MALM in each and every case. Weight definitions in a way assume unambiguousness of class relations. This is not generally given. Consider the case of forests. Old-growth forests are environmentally very distinct from dense urban areas and thus, should receive a high Ɵ. However, urban forest forms an integral part of many urban areas and thus, should receive a rather low Ɵ. Hence, the relationship of forests and urban areas is more complex than can be easily represented by weighted Kappa and thus would at least require higher order solutions.
Relationship with other findings
There is a body of literature that is critical of remote sensing, its underlying epistemology, and its situatedness in (environmental) policy settings. Early studies, such as that of Meyer and Werth (1990) and Litfin (1997) were already stridently critical of the changes that remote sensing might trigger in forestry. Likewise, early studies discuss the importance of remote sensing for social science. However, these approaches are more interested in how remote sensing can be technically applied to social science (e.g., Livermann et al., 1998; Pickles 1995, King and Tadaki, 2018). Some impetus comes from environmental remote sensing itself (Robbins, 2001; Robbins and Maddock, 2000). For example, Feilhauer et al. (2021) are investigating how ecological realities can be better recovered in image realities. Ecosystem boundaries are often not sharp and abrupt, but continuous and fluid (so-called ecotones), cf. Cullum et al. (2017). Land use maps, however, divide study areas into crisp classes. Thus, they can map ecosystems, so to speak, but not ecotones. Feilhauer et al. (2021) apply Lotfi A. Zadeh’s fuzzy under the heading “Let your maps be fuzzy” to map continuous transitions. Chignell et al. (2018) provide further analyses on the issue of ecotones. Gabrys et al. (2022) explain how remote sensing is not only used to describe forests, but see satellite analyses in a broad socio-technological setting that co-constitutes both forests and the (cosmo)politics related to them. Rothe and Shim (2018) critically question the role that satellite data play and can play in conflictual political settings. Glassic et al. (2024) do a remarkable job in outlining how remotely sensed data can be carefully integrated into the analysis of rivers and riverscapes thus capturing the realities of these based on a set of diverse methods, data and indicators. Bennett et al. (2022) go the furthest. They outline an agenda of critical remote sensing that would, on the one hand, explore the epistemology and political economy of remote sensing analysis and, on the other hand, demonstrate how remote sensing can be used critically.
So, in a sense, this body of literature reaches back in time. However, it is far from sufficient to date to capture the potentials and limitations of remote sensing for environmental science and policy. First, it is too widely distributed in time for that. With a rapidly evolving technology, this does not ensure topicality. Furthermore, it argues too unsystematically to provide a real counterweight to the classical discourse of accuracies, uncertainties, thresholds, benchmarks etc. Under this perspective, the state of knowledge moves between unrelated poles. Some studies focus on epistemological critiques (e.g., Pickles, 1995) and political claims (e.g., Rothe and Shim, 2018), while others work on technical workarounds (e.g., Feilhauer et al., 2021). This literature is valuable in its own right, but can be supplemented by studies such as Braun (2021) and this one. Such studies look very closely at the socio-technical practices that lead to particular outcomes. They develop foundations for a science-and-technology studies (STS) perspective on remote sensing. Such a perspective is, on the one hand, very detail-oriented with respect to the technical process, and, on the other hand, sensitive to the social practice behind the technology. It can thus provide a different foundation for the justified political critiques (e.g., Rothe and Shim, 2018 or Gabrys et al., 2022).
Relevance for scientific practice
The findings here simply point into the same general direction as the ones provided by (Braun, 2021), (Feilhauer et al., 2021) and others. We should pay more scientific attention to how we can integrate both the phenomena we observe by our geographical and environmental thinking as well as our values and practices underlying our research into both production and interpretation of remotely sensed data. One initial way to do this is try to represent our geographical and environmental knowledge within the algorithmic procedure. Just as Feilhauer et al. (2021) “let their maps be fuzzy” to acknowledge the ecological reality of ecotones, Kappa_w can in some situations help to adequately represent important and less important class differences. However, this is just one possibility to address discrepancies between what we know as geographers and what we see in the remote sensing land use map. This possibility is based on an attempt to somehow explicitly integrate our geographic thinking into technical algorithms, that is, to try to express what we know algorithmically. Another very important possibility is to change our thinking about algorithms and their results. Low class separability is generally perceived as something negative and laborious in remote sensing. It becomes productive, since remote sensing has always tried to tackle low class separability by better algorithms, admittedly coming up with impressive technical innovations. However, as stressed in (Braun, 2021) low class separability may fundamentally be the biggest source of ecological knowledge production. Ecosystems and environmental changes are frequently characterized by subtle—yet important—differences. Hence, these should be appraised and investigated more thoroughly. In some cases, low class separability may actually be something that hampers our research process. In others, however, it will reflect to exactly what is interesting to the problems we investigate into. Put bluntly, in some cases, we should appraise fuzziness as a virtue, not condemn it as a vice (cf. Wheaton et al., 2015). Again, a good example is Feilhauer et al. who, facing separability issues, do not try to boost algorithms technically, but more fundamentally shed light on the reason for low separability: the continuous nature of near-natural ecosystems, which is simply not accordingly represented by crisp classification. The approach by these authors is also relevant for “crappy landscapes” (core tenet 1 of CPG).
As pointed out by (Bennett et al., 2022), more attention should be payed to how remote sensing results influence scientific progress and policymaking. Remote sensing results are apparently technocratic, objectified, incontestable, non-social entities. Nothing could be more wrong. In fact, they implicitly contain all those value judgments, inscribed semiotics, practices, and convictions as other research results do, and are therefore not non-social at all, but subjectivized objects of human research practice. As shown by the knowledge-driven weighting, particularly the human-guided—and hence subjective—weighting has helped to remedy MALM to some extent. Substantially more research should be dedicated to how values and practices guide our remote sensing research and how the influence scientific communities and policymaking, just as claimed by CPG (Lave 2014, 2015; Lave et al., 2014). Alternative practices, approaches and ways of producing knowledge about the world should be researched in their relevance to remote sensing and then fundamentally incorporated into the education of (geography) students through to remote sensing users. There are no “quick fixes” for this requirement, the problems outlined are deeply enshrined into contemporary research practices. What is needed is a paradigm shift towards a critical theory of remote sensing, which I outline in the conclusion.
Recent developments in artificial intelligence based remote sensing (Maxwell et al., 2018; Zhu et al., 2017) do not negate this claim. Experienced remote sensing scientists will remember algorithms becoming ever less intuitive. By intuitive, I mean to what extent the parameters of the classification function are imaginable for the human brain and can even be visualized if necessary. While earliest methods such as box classifiers could easily be imagined or plotted and maximum likelihood separation could still be drawn on a whiteboard, artificial neural networks and SVMs, with their immense numbers of parameters, were already black-boxes. With the recent Deep Learning approaches building on millions of parameters and countless layers, their algorithmic decision-making is way beyond usual human cognition. All the more should there be a counter-movement which does not entirely abstract human cognition from the classification process, but reflects this knowledge production process critically. My point is that it is certainly good to develop better technical procedures that process large amounts of data, statistically and algorithmically link millions of individual observations and facilitate decisions for the human observer. However, it would be naïve to assume that the specifically human abilities 7 in experiencing reality can thereby be made increasingly superfluous. Rather, it is important to have a more open and interdisciplinary discourse about the specific role distribution between human cognition and machine learning in remote sensing.
Conclusion
This article concludes by coming back to the ontology of Artistotle. In a way, remote sensing has placed too much attention on poiesis and too little attention on practice. Moreover, it almost entirely lacks a teoria that connects both. What has been produced (land-use maps) overshadows how it has been produced (practices behind the techniques applied). In doing so, remote sensing has admittedly elaborated remarkable techniques and datasets of undeniable value to modern environmental science and geography. In the course of critical physical geography, remote sensing can benefit from an important impulse, though. Remote sensing practitioners should start to pay more attention to values and practices underlying their research and how they influence environmental and geographical knowledge production as well as environmental policies.
This article, as well as a few—yet remarkable—other ones (e.g., Feilhauer et al., Bennett et al. see above), has started to shed light on the problematic tension between fundamental epistemological qualities and how they differ in remote sensing and its “applicant communities.” Epistemological tenets such as accuracy and quality should not be incautiously treated or neglected. Although it may sound counter-intuitive, trying to maximize accuracy unthoughtfully is a way of incautious treatment. In many cases, not the maximum accuracy is required but, as Aristotle had claimed early on, the accuracy adequate for the specific problem at hand. Low accuracy values in many cases do not reflect poor technical setups, but the very ecological or environmental problem at hand. As critical realism has it, ontology precedes epistemology! What we know about a thing, depends on the ontological qualities, we ascribe to that thing. In other words: instead of fixing these low values, their nature should be addressed appropriately.
In order to so, a paradigm shift is required within the community. There is an urgent need for new strands of research in remote sensing. These would, on the one hand, shed light onto the epistemological foundations of remote sensing, maybe in terms STS. On the other hand, remote sensing needs to become much more cautious of the way it influences knowledge production and how it shapes global discourses (Law, 2018).
A critical theory of remote sensing is crucially required. This will entail a teoria that connects practice that leads to its products, and hence to poiesis. One, that overcomes the current workflow of discerning and occulting practice, once poiesis is finished. In conclusion, I would therefore like to outline four fields of endeavor that should be anchored at the heart of such a critical theory. First, concepts of accuracy must be lifted out of their purely technical interpretation and integrated into a socio-technical interpretation. The humanities, especially philosophy, are particularly called for here (initial approaches could be, e.g., the concept of de-contextualized accuracy by Tympas, 2017, basic remote sensing considerations can be found in Pickles, 1995). Second, science and technology (STS) studies are needed on how values, practices, institutions, and norms are inscribed in seemingly objective remote sensing products (possibly the monograph by Parks, 2020 is one approach). Third, it requires a better understanding of the political consequences of these socio-technical path dependencies, which Bennett et al. have labeled “Politics of Pixels” (and which follow tenet 3 of the CPG, Law, 2018). Fourth, there is a need for comprehensive considerations on the technological ethics of remote sensing, for example, with regard to responsibility, the negative consequences for people and the environment due to heavily technology-dependent decision-making systems and inclusion and exclusion relationships, to name just two aspects. Such a critical theory should not work in isolation by exclusively analyzing individual steps of data and result production, but should always keep the entire process chain from primary data acquisition to its application in view. Such a critical theory of remote sensing cannot be developed by individual authors, but would have to be developed by larger inter- and transdisciplinary research networks.
Supplemental Material
Supplemental Material - More accurate less meaningful? Why quality indicators do not unveil the socio-technical practices inscribed into land use maps
Supplemental Material for More accurate less meaningful? Why quality indicators do not unveil the socio-technical practices inscribed into land use maps by Andreas Braun in Progress in Physical Geography: Earth and Environment
Footnotes
Declaration of conflicting interests
The author(s) declared no potential conflicts of interest with respect to the research, authorship, and/or publication of this article.
Funding
The author(s) received no financial support for the research, authorship, and/or publication of this article.
Supplemental Material
Supplemental material for this article is available online.
Notes
References
Supplementary Material
Please find the following supplemental material available below.
For Open Access articles published under a Creative Commons License, all supplemental material carries the same license as the article it is associated with.
For non-Open Access articles published, all supplemental material carries a non-exclusive license, and permission requests for re-use of supplemental material or any part of supplemental material shall be sent directly to the copyright owner as specified in the copyright notice associated with the article.