
Abstract
Sea-level rise and sediment supply have influenced coastal morphology and sedimentation on Bangladesh’s southwestern Ganges‐Brahmaputra‐Meghna (GBM) delta coast. Satellite images and geological core from the Haringhata coastal region were analyzed to explain the morphological changes and to understand the influences on deposits. The results derived from satellite images indicate that the southern coastline experienced a retreat that ranges between 2.3 and 2.9 km. In contrast, the eastern and western coastline advanced. The erosion and accretion ratio was 0.29 from 1977 to 1989, while the ratio was higher 2.90–4.77 from 1989 to 2020. Two sedimentary facies were identified using 130 cm thick successions. A parallel to wavy laminated bluish gray mud facies of deeper part was deposited in a marine-influenced environment. A planar to hummocky cross stratified, gray to grayish white silty sand facies of storm overwash deposits overlies the mud facies with sharp contacts. Unimodal to bimodal grain distributions of sandy sediments suggest two sources: sand derived from the beach and mud carried by adjacent tidal rivers and resuspended offshore sediment. Coastline dynamics and sedimentation of the area were influenced by inequality of accommodation and sediment supply ratio in the river mouth. This occurs due to sea-level rise and deficit in upstream water and sediment discharge. Morphological change along the southwestern GBM delta coast was not only caused by wave energy, but also by rising sea levels which shifted sediment accommodation space landward.
I. Introduction
The coastal area of the Ganges‐Brahmaputra‐Meghna (GBM) delta was formed during the last 11,000 years and has since prograded as a series of clinoforms in the Bay of Bengal (Kuehl et al., 2005; Mikhailov and Dotsenko, 2007). The delta was built by sediment discharge from the GBM river system. Clay mineral composition and radiocarbon evidence reveal that the southwestern delta was formed by sediments carried by the Ganges River system (Allison and Kepple, 2001; Heroy et al., 2003) (Figure 1(a)). The coast facing the Bay of Bengal is highly vulnerable to subsidence, coastal erosion, and storm surges (Brammer, 2014; Nicholls et al., 2016). It is affected by wind, waves, and storms such as tropical cyclones, although the Sundarbans mangrove forest significantly mitigates these effects (Food and Agriculture Organization [FAO], 2007) (Figure 1(a)). Susceptibility of the deltaic environment to physical change also depends on upstream water and sediment discharge, and recirculation of these sediments within the delta system (Rahman et al., 2018). Shifting of the coastline is therefore an indicator of marine and terrestrial influences and the sedimentary records of these changes are well preserved, particularly in the low elevation coastal areas. Recent satellite images along the GBM delta coast reveal that net gain in land area was comparatively higher in the central delta estuary than along the southwestern coast of the delta (Brammer, 2014; Sarwar and Woodroffe, 2013) (Figure 1(a)). Periodic erosion and accretion, as well as internal changes in delta systems, are common and they can balance themselves if the systems are undisturbed, but erosion has been dominant over the last three decades, especially along the southwestern coast of the delta (Figure 1). Ahmed (1999) proposed that most of the coastal erosion was caused by both continuous wave action and storm surges, and that the rate of erosion increased with increasing wind speed (Figure 2(a); Hossain, 2012). The coast of Bangladesh has shallow offshore bathymetry. Tropical storm surges effectively eroded sediments from the coast, including the offshore, beach faces, and dunes. The eroded sediments are transported to the steep canyon walls of the Swatch of No Ground in the Bay of Bengal (Figure 1(a)) and are also deposited onto the low elevation nearshore and coastal zone (Hanebuth et al., 2013; Kudrass et al., 2018; Morton and Sallenger, 2003; Shibayama et al., 2008; Williams and Flanagan, 2009). Bhargava et al. (2021) and Rahman et al. (2011) showed that southwestern coast accretion was mainly observed along the west and east. In contrast, erosion was higher in the south to southwest direction (Figure 1(a)).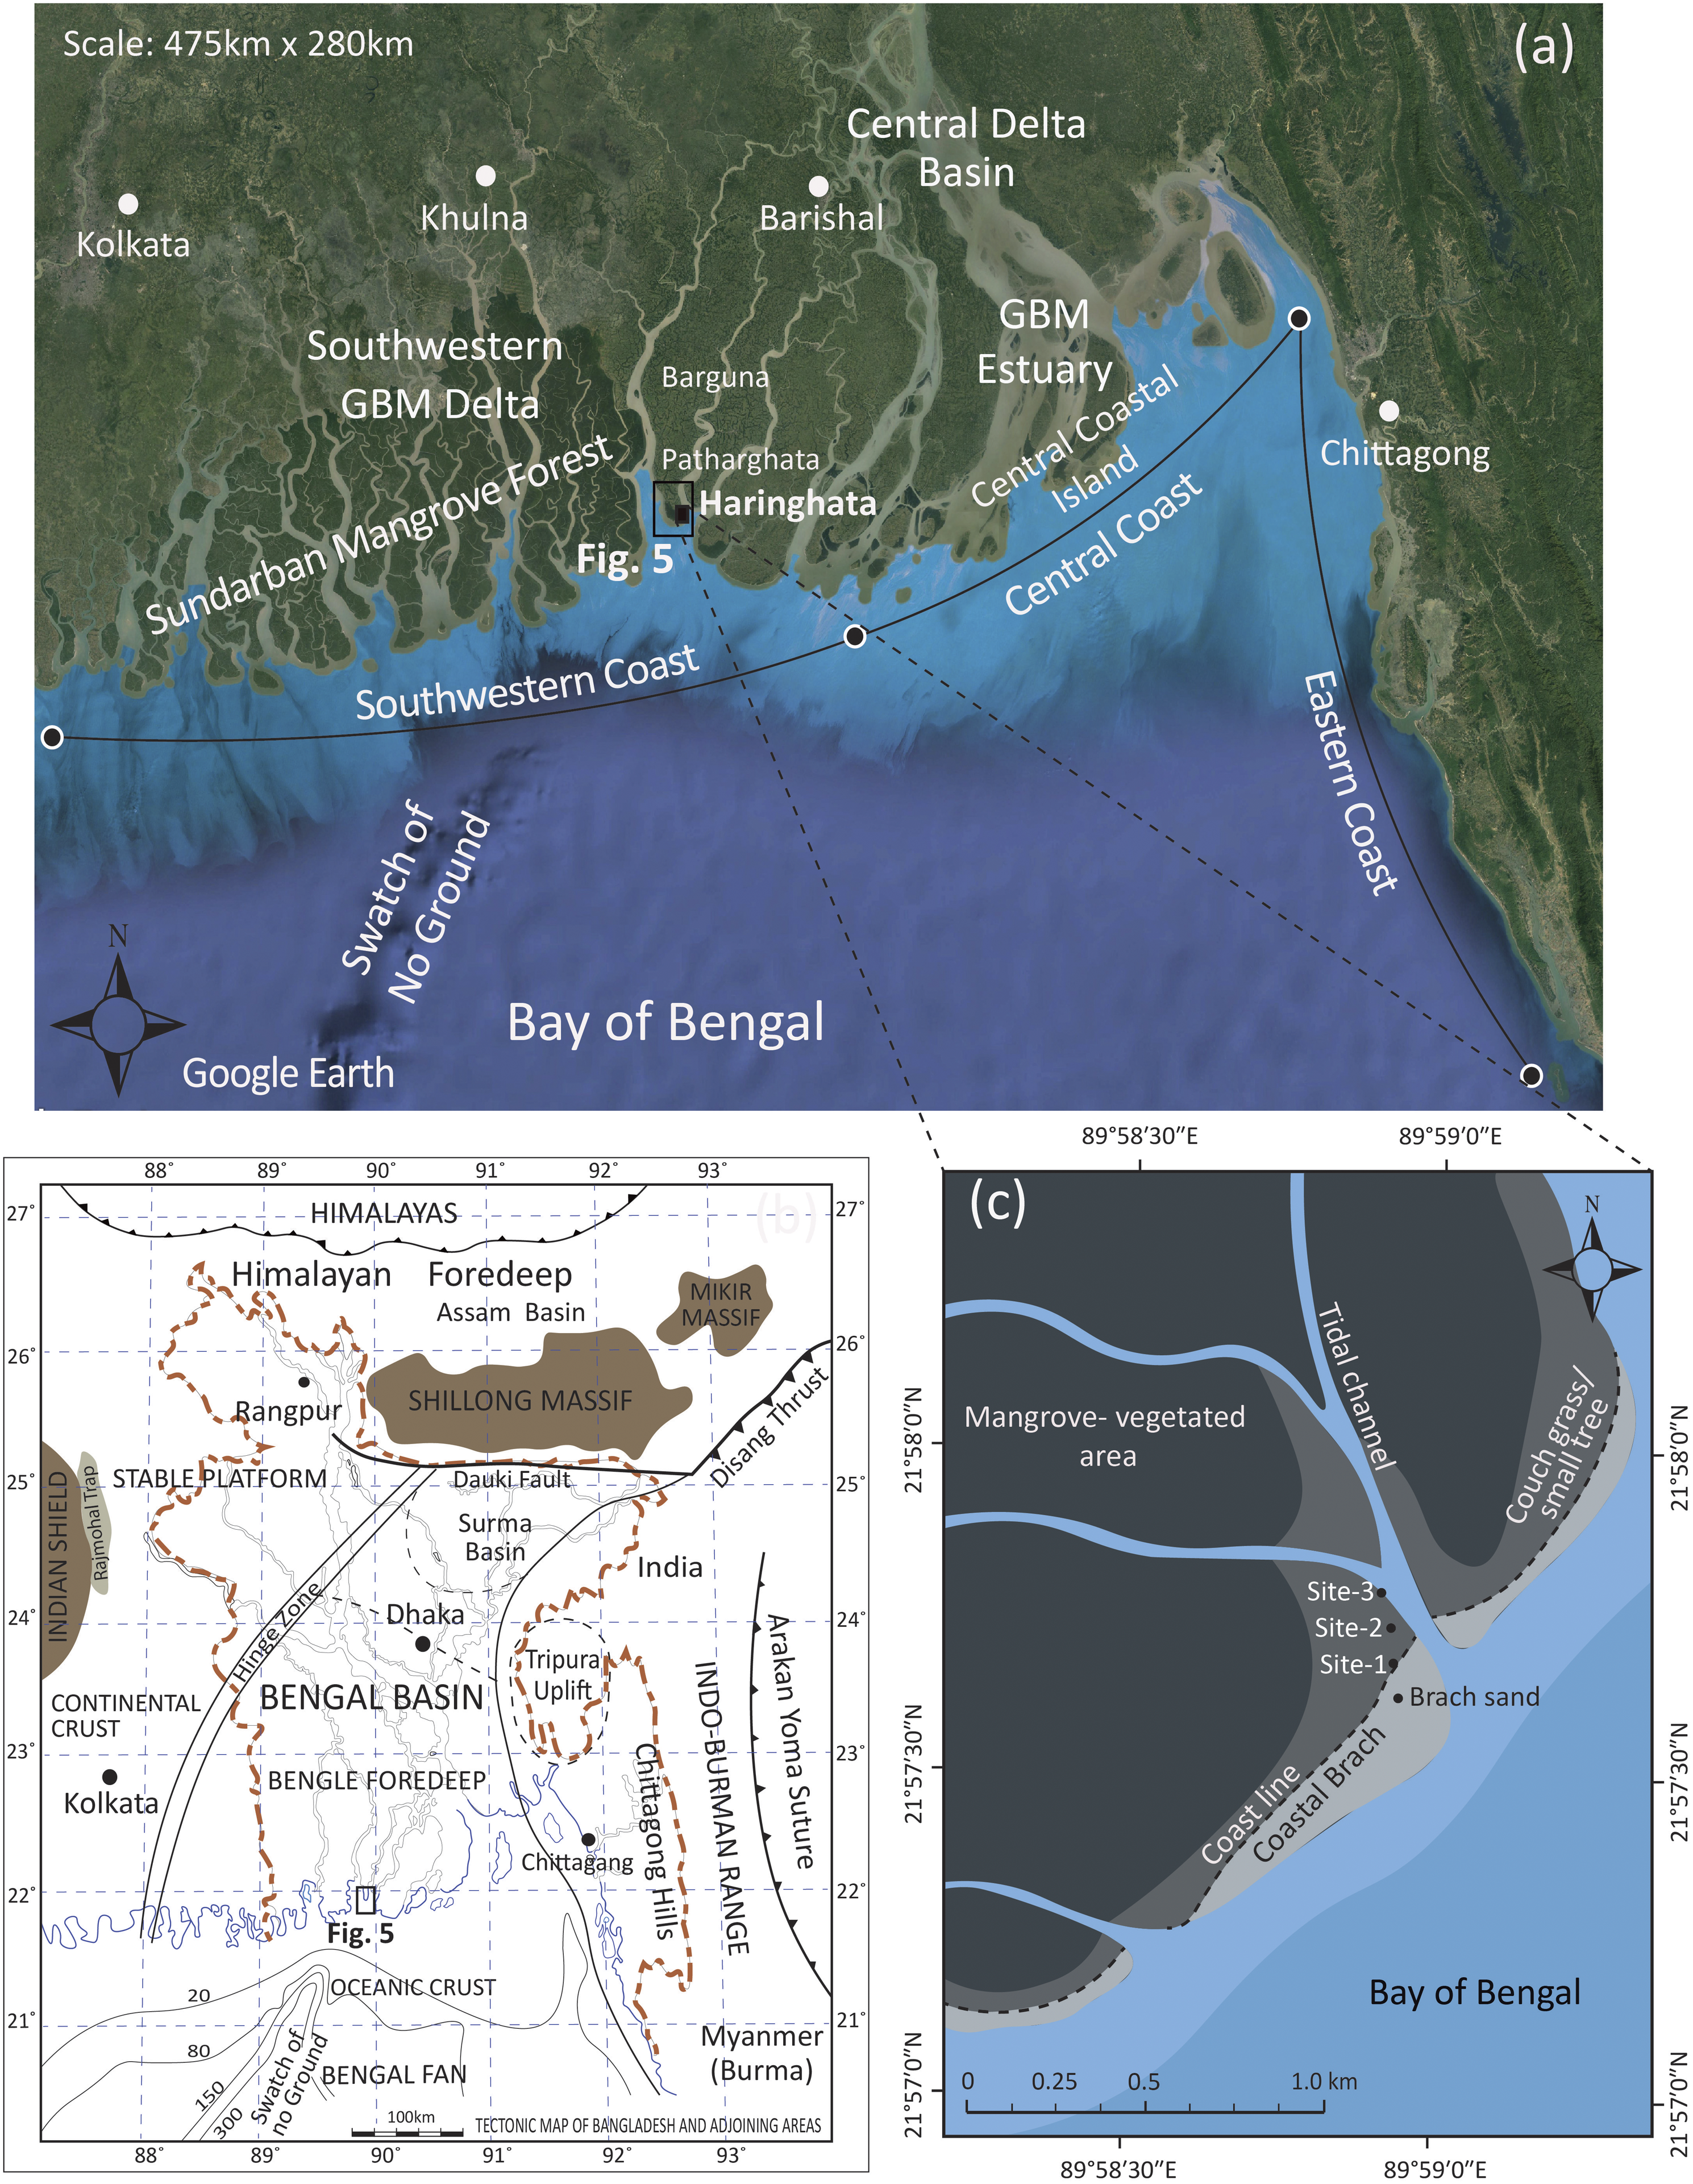
Sedimentation processes on the open tidal coasts are controlled by the input of riverine sediment and influence of offshore wind and waves (Yang et al., 2005). The landward extension and thickness of storm overwash deposits depends on wind speed and tidal surge height, and the storm builds its deposit above the spring tidal limit (Hesp, 2006). Storm deposits show different forms among the various coastal environment settings such as tidal flats, backshore, inner shelf, etc. (Xiong et al., 2018). Many diverse and comprehensive suites of proxies have been used to identify the characteristics and provenance of coastal deposits (Das et al., 2013; Lambert et al., 2008). In the GBM delta system, most sediment from upstream accumulates along the central coastal island located at the mouth of the estuary and a portion is transported southwestward and temporarily stored offshore where the water depth is less than 20 m. This sediment has been resuspended and carried west by coastal current and directed in the tidal channels by tidal currents (Allison, 1998; Allison and Kepple, 2001; Barua et al., 1994; Mikhailov and Dotsenko, 2007; Mouyen et al., 2018; Rahman et al., 2018; Wilson and Goodbred Jr, 2015) (Figure 1).
Bangladesh’s coastal area is storm-dominated and one of the most unstable deltaic coasts in the world. In this study, satellite images of different vintages have been used to find a suitable location that would represent the coast of the southwestern GBM delta of Bangladesh in terms of coastal morphology and sedimentation. Remote sensing techniques are combined with geological core analyses to understand coastal depositional processes. The specific objectives include: (1) documenting the coastal dynamics of the Haringhata region over a period of 43 years (1977–2020) using satellite images; (2) identification of depositional environments and sources of organic matter using sedimentary facies and laboratory analyses of grain size, total organic carbon (TOC), total nitrogen (TN), stable carbon isotope ratio (δ13C values), and diatom assemblages from core; and (3) understanding sedimentary processes and the causes of morphological changes.
II Geology and cyclone movement
Bangladesh has two entirely different tectonic settings: to the north lies the stable platform that comprises the foothills and alluvial fan of the Himalaya, and to the south is the Bengal Basin of the Indian Ocean (Figure 1(b)). The Bengal Basin is boarded by the Precambrian Shield of Shillong Massif to the north, the Indian Shield to the west, and Neogene sedimentaries of Chittagong hills and Tripura uplift to the east (Figure 1(b); Acharyya, 2007; Hossain et al., 2019; Mukherjee et al., 2009). The GBM river system carries sediment from different parts of the Himalaya and forms one of the world’s largest deltas. The area has undergone massive changes due to the dynamic process of accretion and erosion of land along the coast. The study area is part of the tidally active southwestern GBM lower delta plain, and it has a complex network of tidal rivers, their tributaries, and mangrove vegetated islands (Islam, 2001; Islam and Gnauck, 2008). Tectonically, the study area is located at the eastern edge of the northeastward drifting Indian Plate. The sediments deposited in the low-lying GBM delta and the southwestern delta basin have experienced higher subsidence rates than sedimentation rates (e.g., Allison and Kepple, 2001; Goodbred Jr and Kuehl, 2000; Hanebuth et al., 2013; Hossain et al., 2019; Stanley and Hait, 2000; Steckler et al., 2008).
Bangladesh’s southern coast is influenced both by tides and major cyclones with disastrous storm surges (Ali, 1996; Karim and Mimura, 2008; Kudrass et al., 1998). The cyclones that form in the Bay of Bengal move northward and northeastward and strike Bangladesh mostly during the Pre-Monsoon (March to May) and Post-Monsoon seasons (October and November) (Balaguru et al., 2014; Karim and Mimura, 2008; Kudrass et al., 2018). According to Gray (1985), Hossain et al. (2010), and Knapp et al. (2010), about 14% of tropical cyclones formed in the Bay of Bengal hit the Bangladesh coast, or 1.4% of all tropical cyclones generated in the world. Every year the Bay of Bengal coast faces five to six tropical cyclones, of which two generally reach the severe stage with high and intense precipitation (Singh, 2007).
III Materials and methods
3.1 Identification of coastal dynamics from satellite data
Satellite images from four time periods were utilized to evaluate transformations along the Haringhata coast: Landsat Multispectral Scanner (MSS) (57 m spatial resolution) obtained in February 1977, Landsat Thematic Mapper (TM) (28.5 m spatial resolution) obtained in February 1989, Enhanced Thematic Mapper (ETM) (28.5 m spatial resolution) obtained in February 2000, and Operational Land Imager (OLI) (30 m spatial resolution) acquired in February 2020.
The images were pre-processed in reference to well known remote sensing Landsat data procedure (Unger Holtz, 2007), including radiometric and atmospheric correction, co-enrollment, and resampling. The dark-object subtraction technique was utilized over the images to eliminate atmospheric effects caused by clouds, dust, smoke, etc., (Chavez, 1996) as part of the radiometric corrections. The sun azimuth and sun elevation data, which were extracted from the image header files, were utilized to complete the radiometric correction process. Following Chander and Markham (2003), all images were changed to top-of-atmosphere reflectance from digital numbers to allow comparison between images.
Relative radiometric standardization (Coppin et al., 2004; Ghosh et al., 2015; Langat et al., 2019; Mas, 1999) was likewise completed to standardize the differences arising from the sun illumination and atmospheric conditions. All images were geo-rectified using 47 ground control points (GCPs). This procedure brought about a root mean square error (RMSE) of 0.002,812 pixels. Afterward, the images were resampled to a 30 m pixel size utilizing the nearest neighbor resampling technique.
Two distinct methodologies were applied to recognize the coastline and identify changes: (1) land and water interface separation for coastline identification utilizing a water index algorithm; and (2) coastline digitization for mapping erosion/accretion patterns along the Haringhata coast. Several indices derived from satellite data for detecting water surfaces have been developed. Sensitivity of the green band to variances of turbid water and sediment make it very useful for discerning wide-ranging classes of vegetation while different portions of the infrared band strongly contrast land and water features. The Modified Normalized Difference Water Index (MNDWI) algorithm, that has been extensively utilized for land-water interface separation (Ghosh et al., 2015; Langat et al., 2019; Ma et al., 2007; Rokni et al., 2014; Sunder et al., 2017), was adopted to recognize changes of the coastline. MNDWI was assessed for TM and ETM images of 1989 and 2000 as (Green–MIR)/(Green+MIR), where Green and MIR are the appearances in the green and mid-infrared bands of these images, while for the OLI image of 2020 MNDWI was estimated as (Green–SWIR1)/(Green+SWIR1), where Green and SWIR1 are the appearances in the green and short-wave infrared bands of the OLI image. Normalized Difference Water Index (NDWI) derived from Green and Near-infrared (NIR) bands was also used for land-water interface separation. This index was applied over the 1977 MSS image as this image had only four bands and there was no option to apply the MNDWI index over this particular image. NDWI was estimated for the MSS image of 1977 as (Green–NIR)/(Green+NIR). A Boolean approach was then applied to the NDWI and MNDWI images to produce land and water classes. To extract the coastline layers, on-screen digitization of the coastline was executed. Thereafter, coastline layers were overlaid to examine the coastline position at each date. Coastline positions were highlighted to explain coastal advancement/retreat, as well as erosion/accretion prone areas and the coastline changes were calculated. Ideally, comparisons throughout extended periods of time should be made at the same tide level for the best correctness. However, data management is limited by its availability throughout such extended periods (in this case 1977–2020). Satellite passes occur at fixed times and cannot be adjusted for each capture to ensure tidal consistency. These are the source of errors in conducting this kind of research related to the use of recorded data. Dry season (December to February) and low-tide images were preferentially used in this study to minimize tidal impacts because tidal fluctuations are lower during dry seasons (Figure 3(a)–(c)). It was also expected that the variations in the water level during low tides were little contrasted with the level of the coastline shifts. Furthermore, it was ensured that the image acquisition date did not correspond with neap or spring tides. These measures can significantly improve precision and are standard methods in remote sensing work.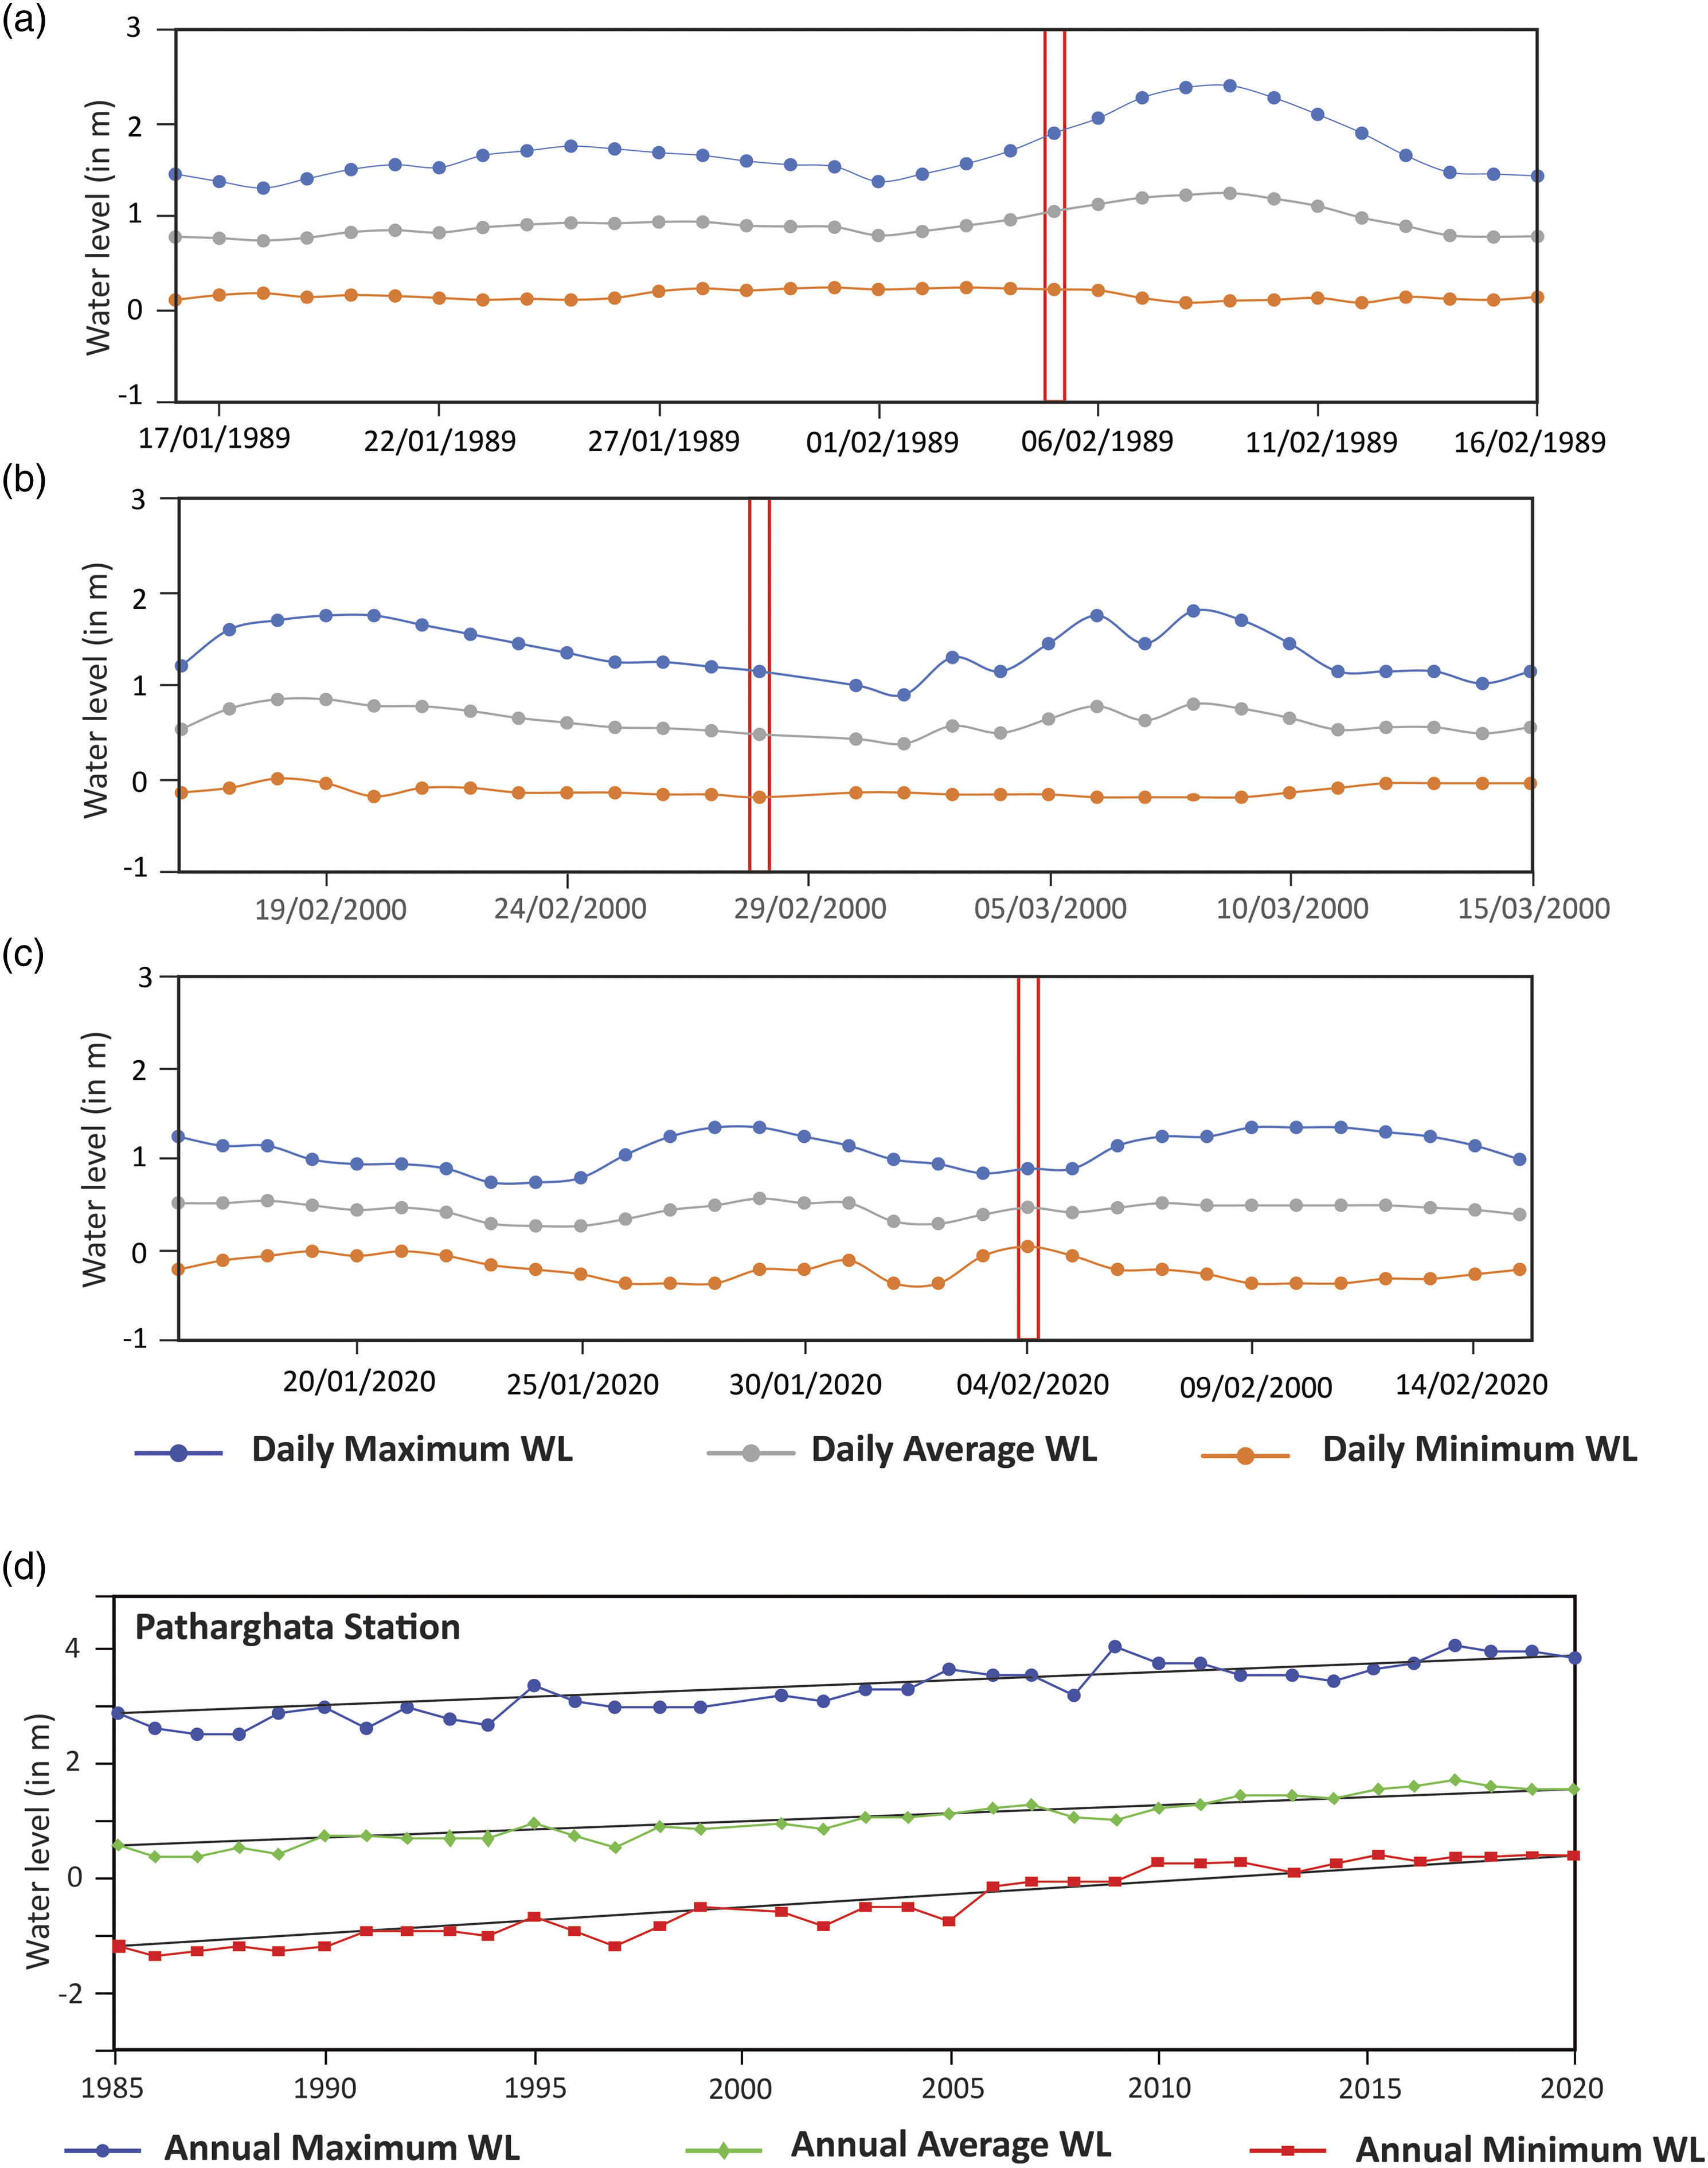
To validate the NDWI and MNDWI methods, the 1976 topographical map was used for the 1977 image, the Local Government Engineering Department (LGED) maps of 1989 and 2000 were used for the images of 1989 and 2000, respectively, and high-resolution Google Earth™ images from 2020 were used for the image of 2020 as reference data. On-screen digitizations were performed to extract the “true” boundaries between land and water from all reference data and afterward, compared with the NDWI and MNDWI generated coastline layers. To estimate the accuracy of the land/water classification for all maps, an accuracy assessment method described by Congalton and co-authors was used (Congalton, 1991; Congalton and Green, 2019; Congalton et al., 1983). The entire image processing and analysis procedure was carried out using ENVI (5.1, Esri, Colorado, CO, USA) and ArcGIS (10.2, Esri, Colorado, CO, USA) software.
3.2 Field investigation and grain size analysis
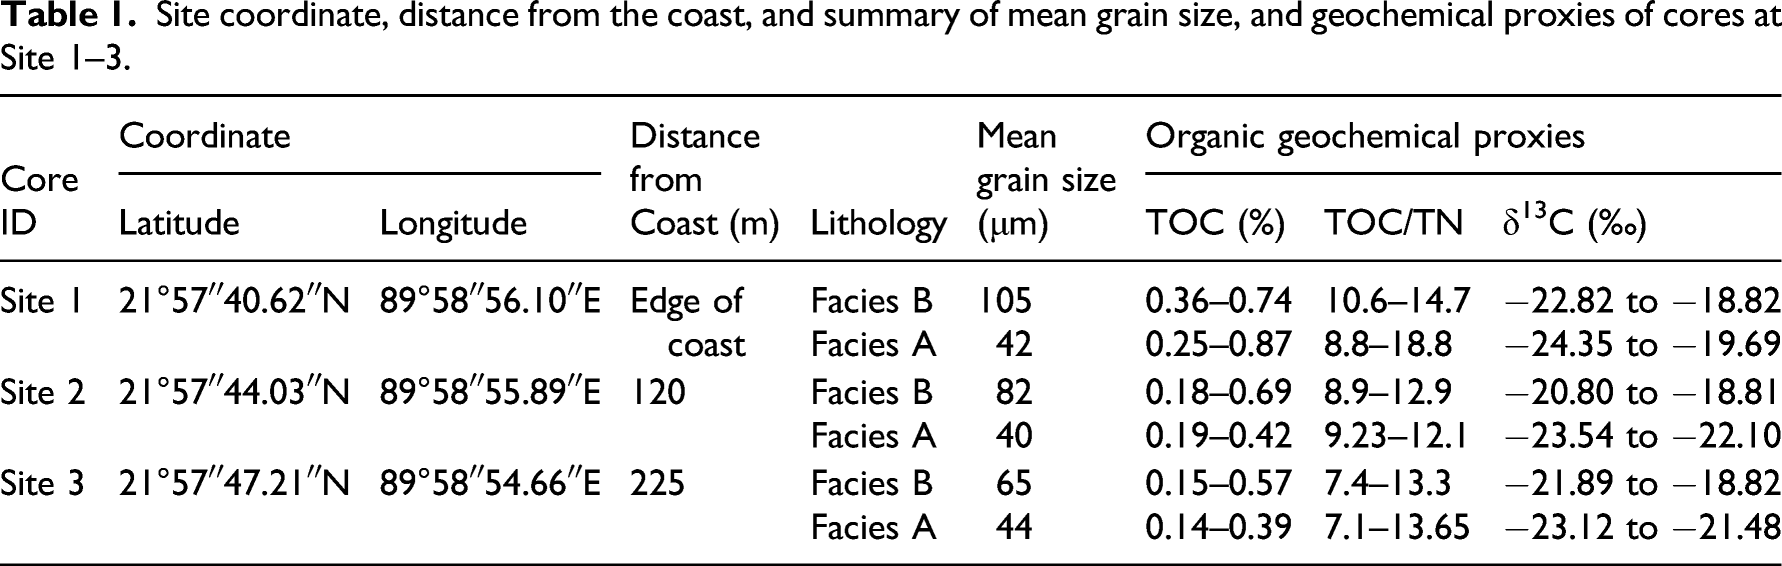
Site coordinate, distance from the coast, and summary of mean grain size, and geochemical proxies of cores at Site 1–3.
3.3 Geochemical analyses
The ratio of total organic carbon to total nitrogen (TOC/TN) and δ13C values are widely used to identify organic matter sources to assist in interpreting depositional environments. TOC/TN and δ13C values of marine sediments range between 3 and 10 and –18‰ and −22‰, respectively. In contrast, TOC/TN and δ13C values of terrestrial sediments are above 15 and between −25‰ and −28‰, respectively (Lamb et al., 2006; Meyers, 1997; Prasad et al., 2017; Ray and Shahraki, 2016; Sarkar et al., 2009; Watson and Whitfield, 1985). The samples were prepared for geochemical analyses following Haque and Hoyanagi (2021). A Flash 2000 (Thermo Fisher Scientific Co. Ltd.) was used for TOC and TN analyses, and the analytical precision was ±0.025%. An elemental analyzer (Flash EA 1122, Thermo Fisher Scientific Co. Ltd.) and a mass spectrometer (Delta V Advantage, Thermo Fisher Scientific Co. Ltd.) were used for δ13C analysis. The analytical precision of δ13C analysis was ±0.15‰. A summary of organic geochemical proxies results is shown in Table 1.
3.4 Diatom analysis
The surficial sediments at Site 1–3 and beach sand of the Haringhata coast were used for diatom analysis (Figure 1(c)). The samples (approximately 1 gram) were placed into 200 mL beakers and prepared for diatom analysis based on the methods described by Haque and Hoyanagi (2021). The prepared samples were analyzed using a 1000× magnification Olympus Microscope under oil immersion after mounting on a glass slide with an 18×18 mm cover glass. The diatoms were identified based on Krammer (2000, 2002, 2003), Large-Bertalot et al. (2000), Large-Bertalot (2001), and Lenkov (2009). Diatom assemblages present as percentages of the total count of diatoms and their ecological groups: marine, brackish, and freshwater environment (Jones, 2007; Round et al., 1990).
IV Results
4.1 Coastline dynamics and morphological change
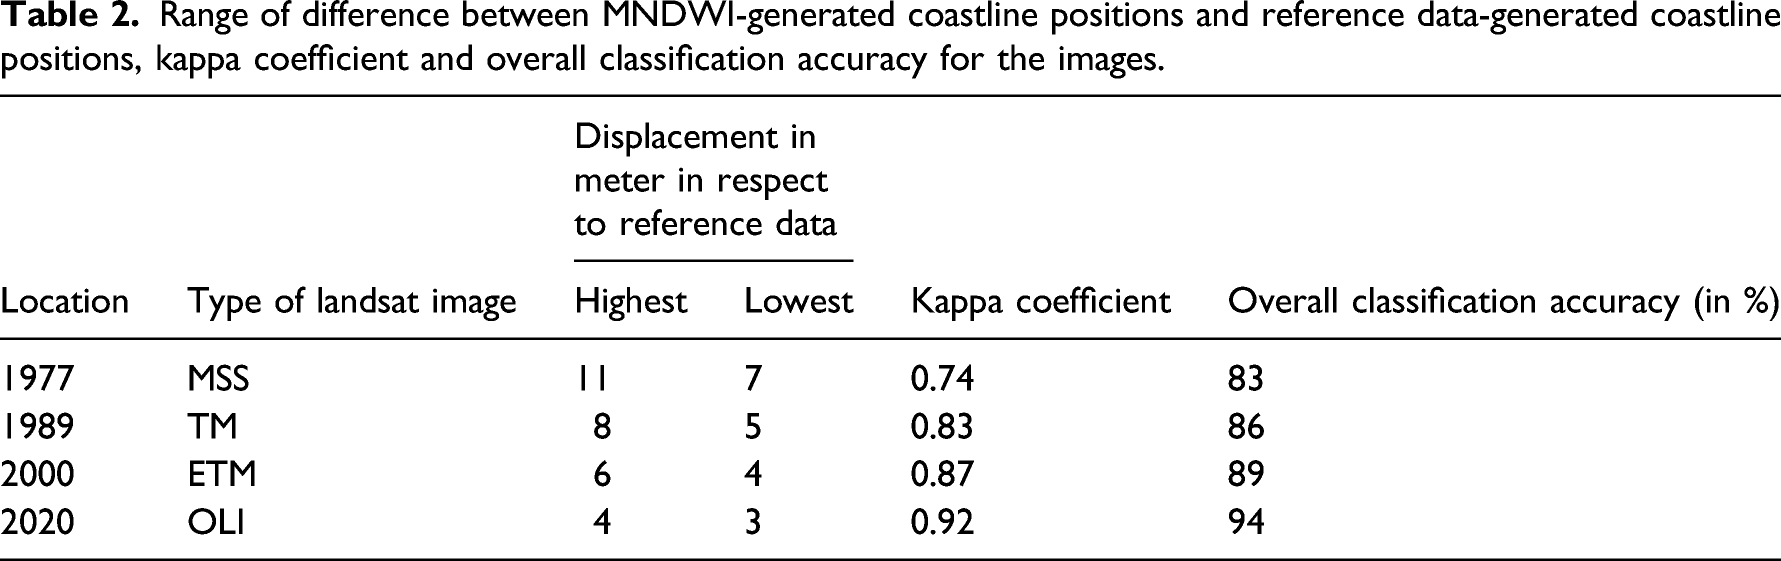
The NDWI image for 1977, and MNDWI for 1989, 2000, and 2020 are shown in Figure 4. The image classifications for land and water resulted in overall accuracies of 83%, 86%, 89%, and 94% and kappa indices of 0.74, 0.83, 0.87, and 0.92 for the images of 1977, 1989, 2000, and 2020, respectively (Table 2). The results also indicate that the difference between MNDWI-generated coastlines and the “true” coastlines digitized from reference data varies between 3 and 11 m (Table 2), indicating that the MNDWI technique is robust. MNDWI and NDWI images of Haringhata region, Bangladesh. Range of difference between MNDWI-generated coastline positions and reference data-generated coastline positions, kappa coefficient and overall classification accuracy for the images.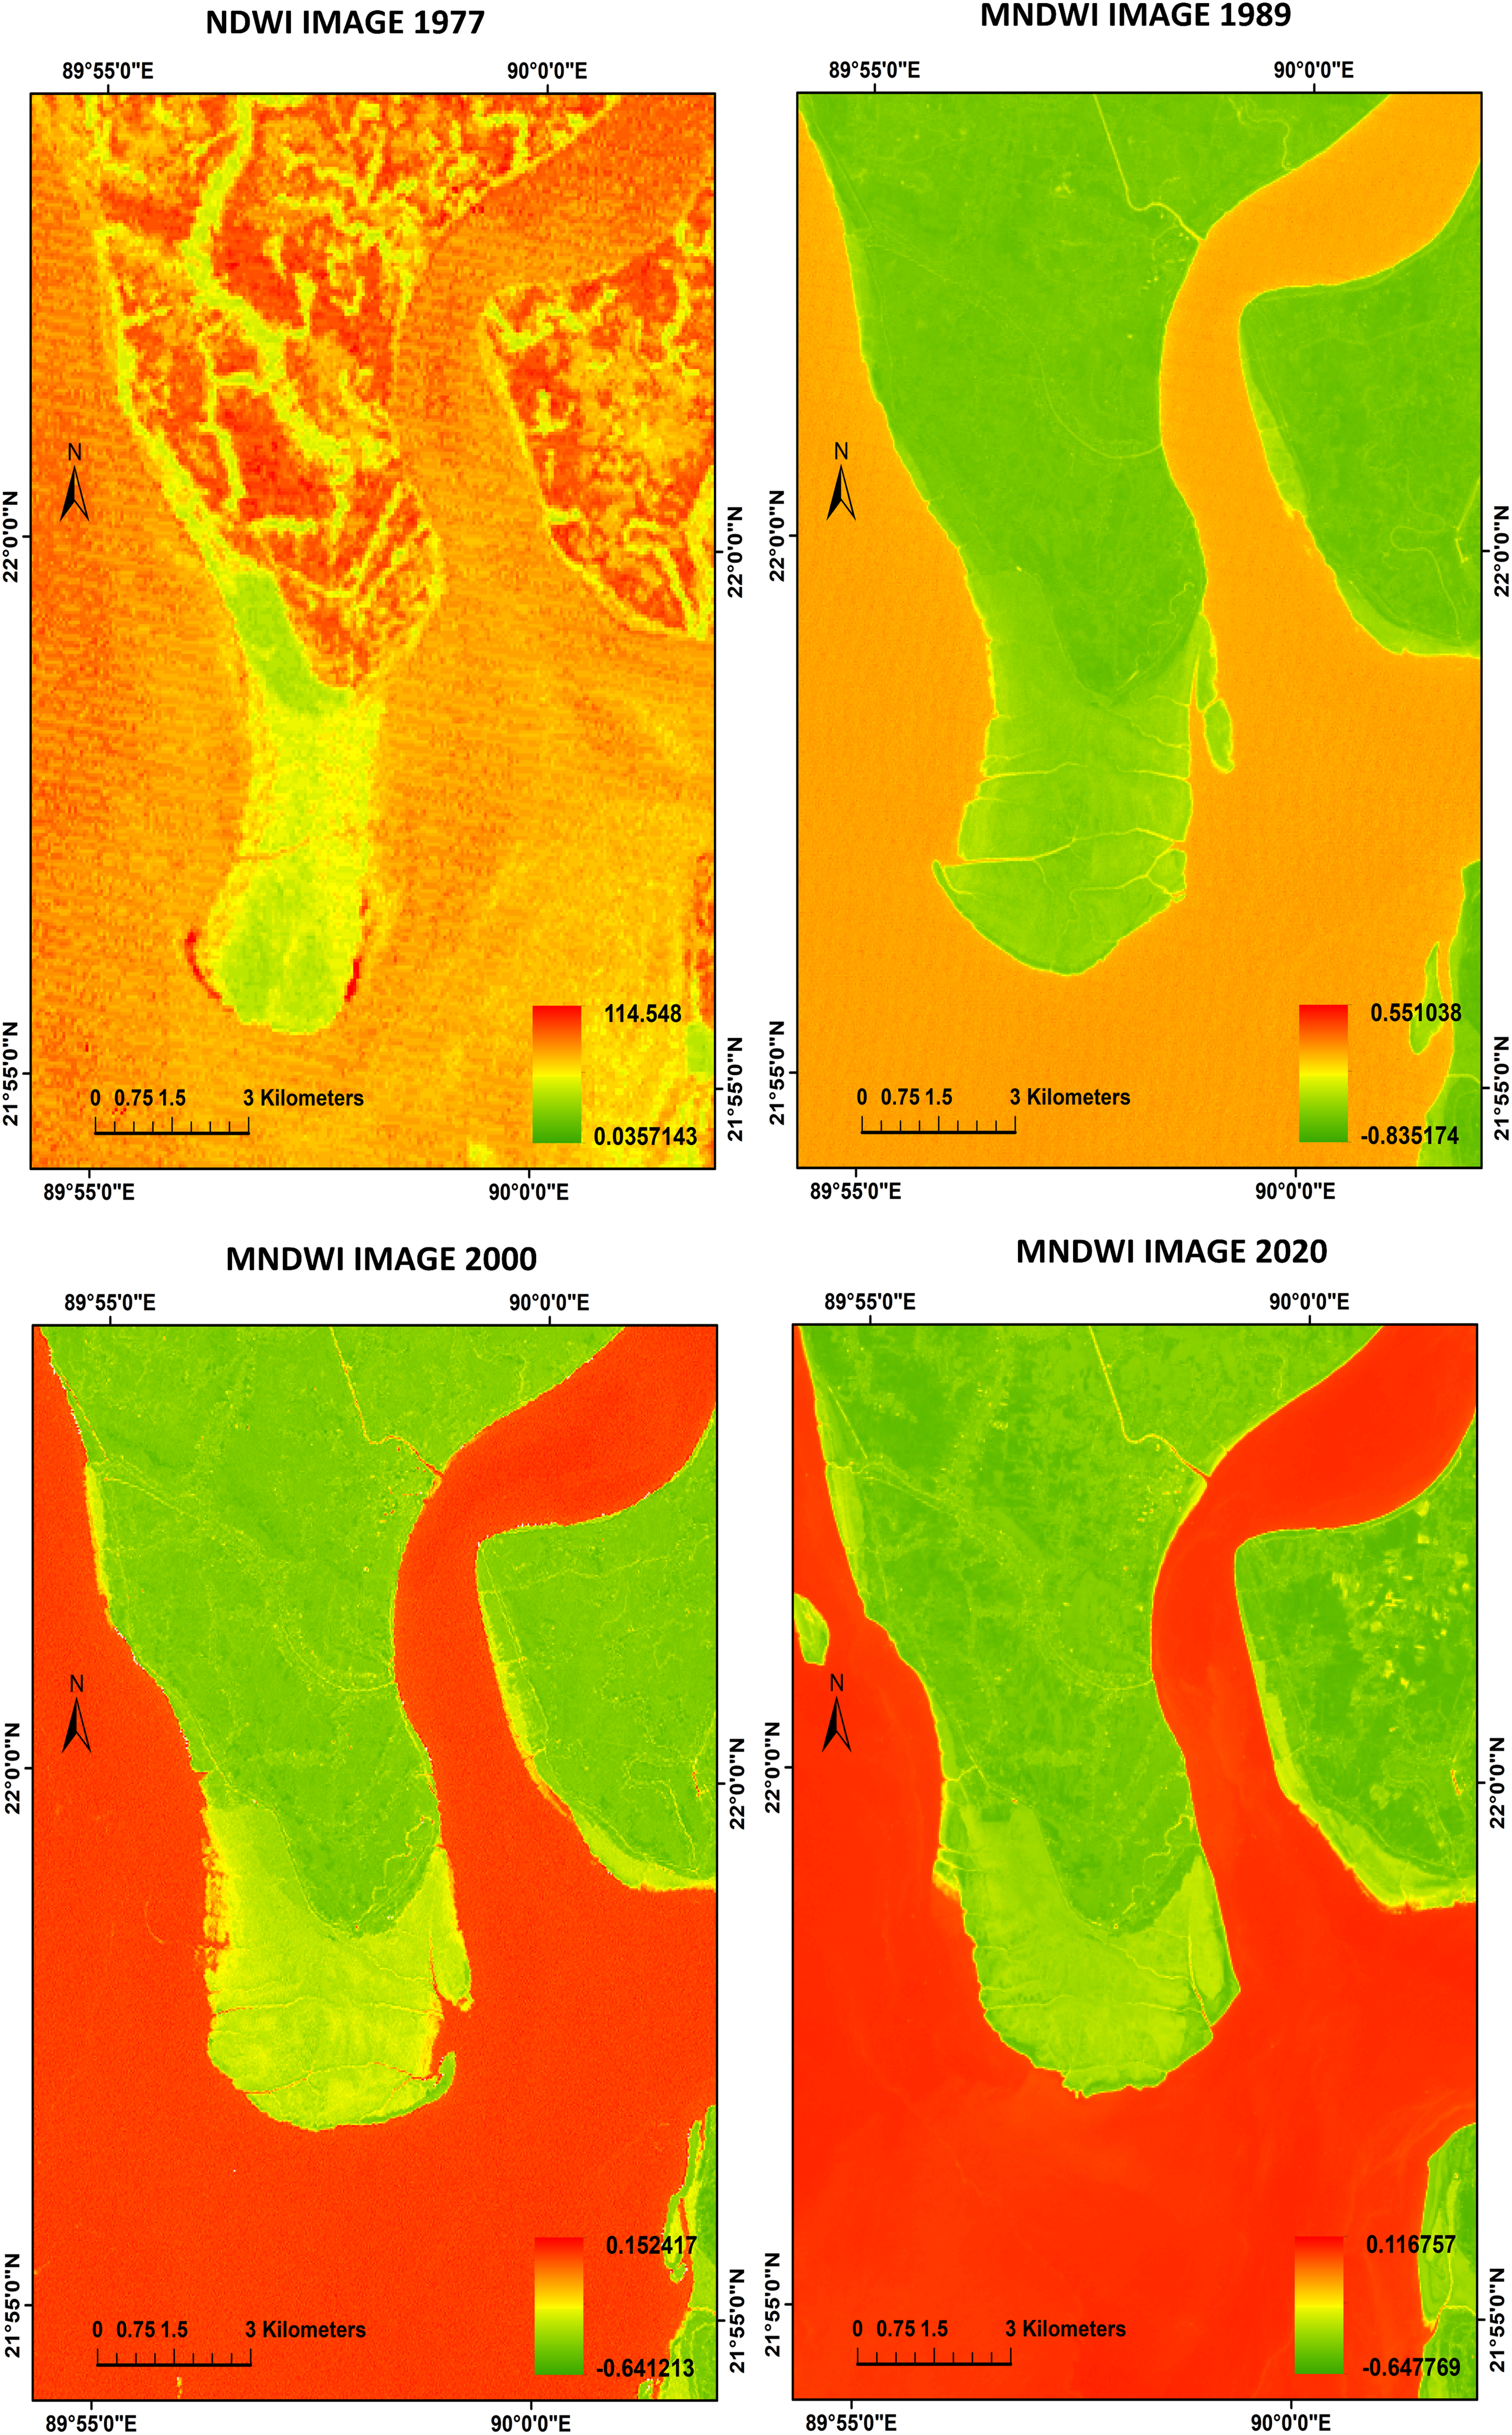
The coastline changes in the Haringhata region are shown in Figures 5 and 6(a)–(d) while the extents of erosion and sedimentation are given in Table 3. Three regions (western, southern, and eastern) of the Haringhata coast are recognized where the changes are evident. Accretion has been dominated on the western and eastern parts of the coast, whereas the southern part of the coast was subject to erosion (Table 3). In addition, some parts of the coastline were unchanged. Coastline change map of the study area, based on image analysis from 1977 to 2020. Coastline change map based on image analysis from Erosion, accretion, and E–A ratio of selected locations from 1977 to 1989, 1989 to 2000, 2000 to 2020, and 1977 to 2020 at Haringhata, Bangladesh. (+) = Accretion [A]; (−) = Erosion [E].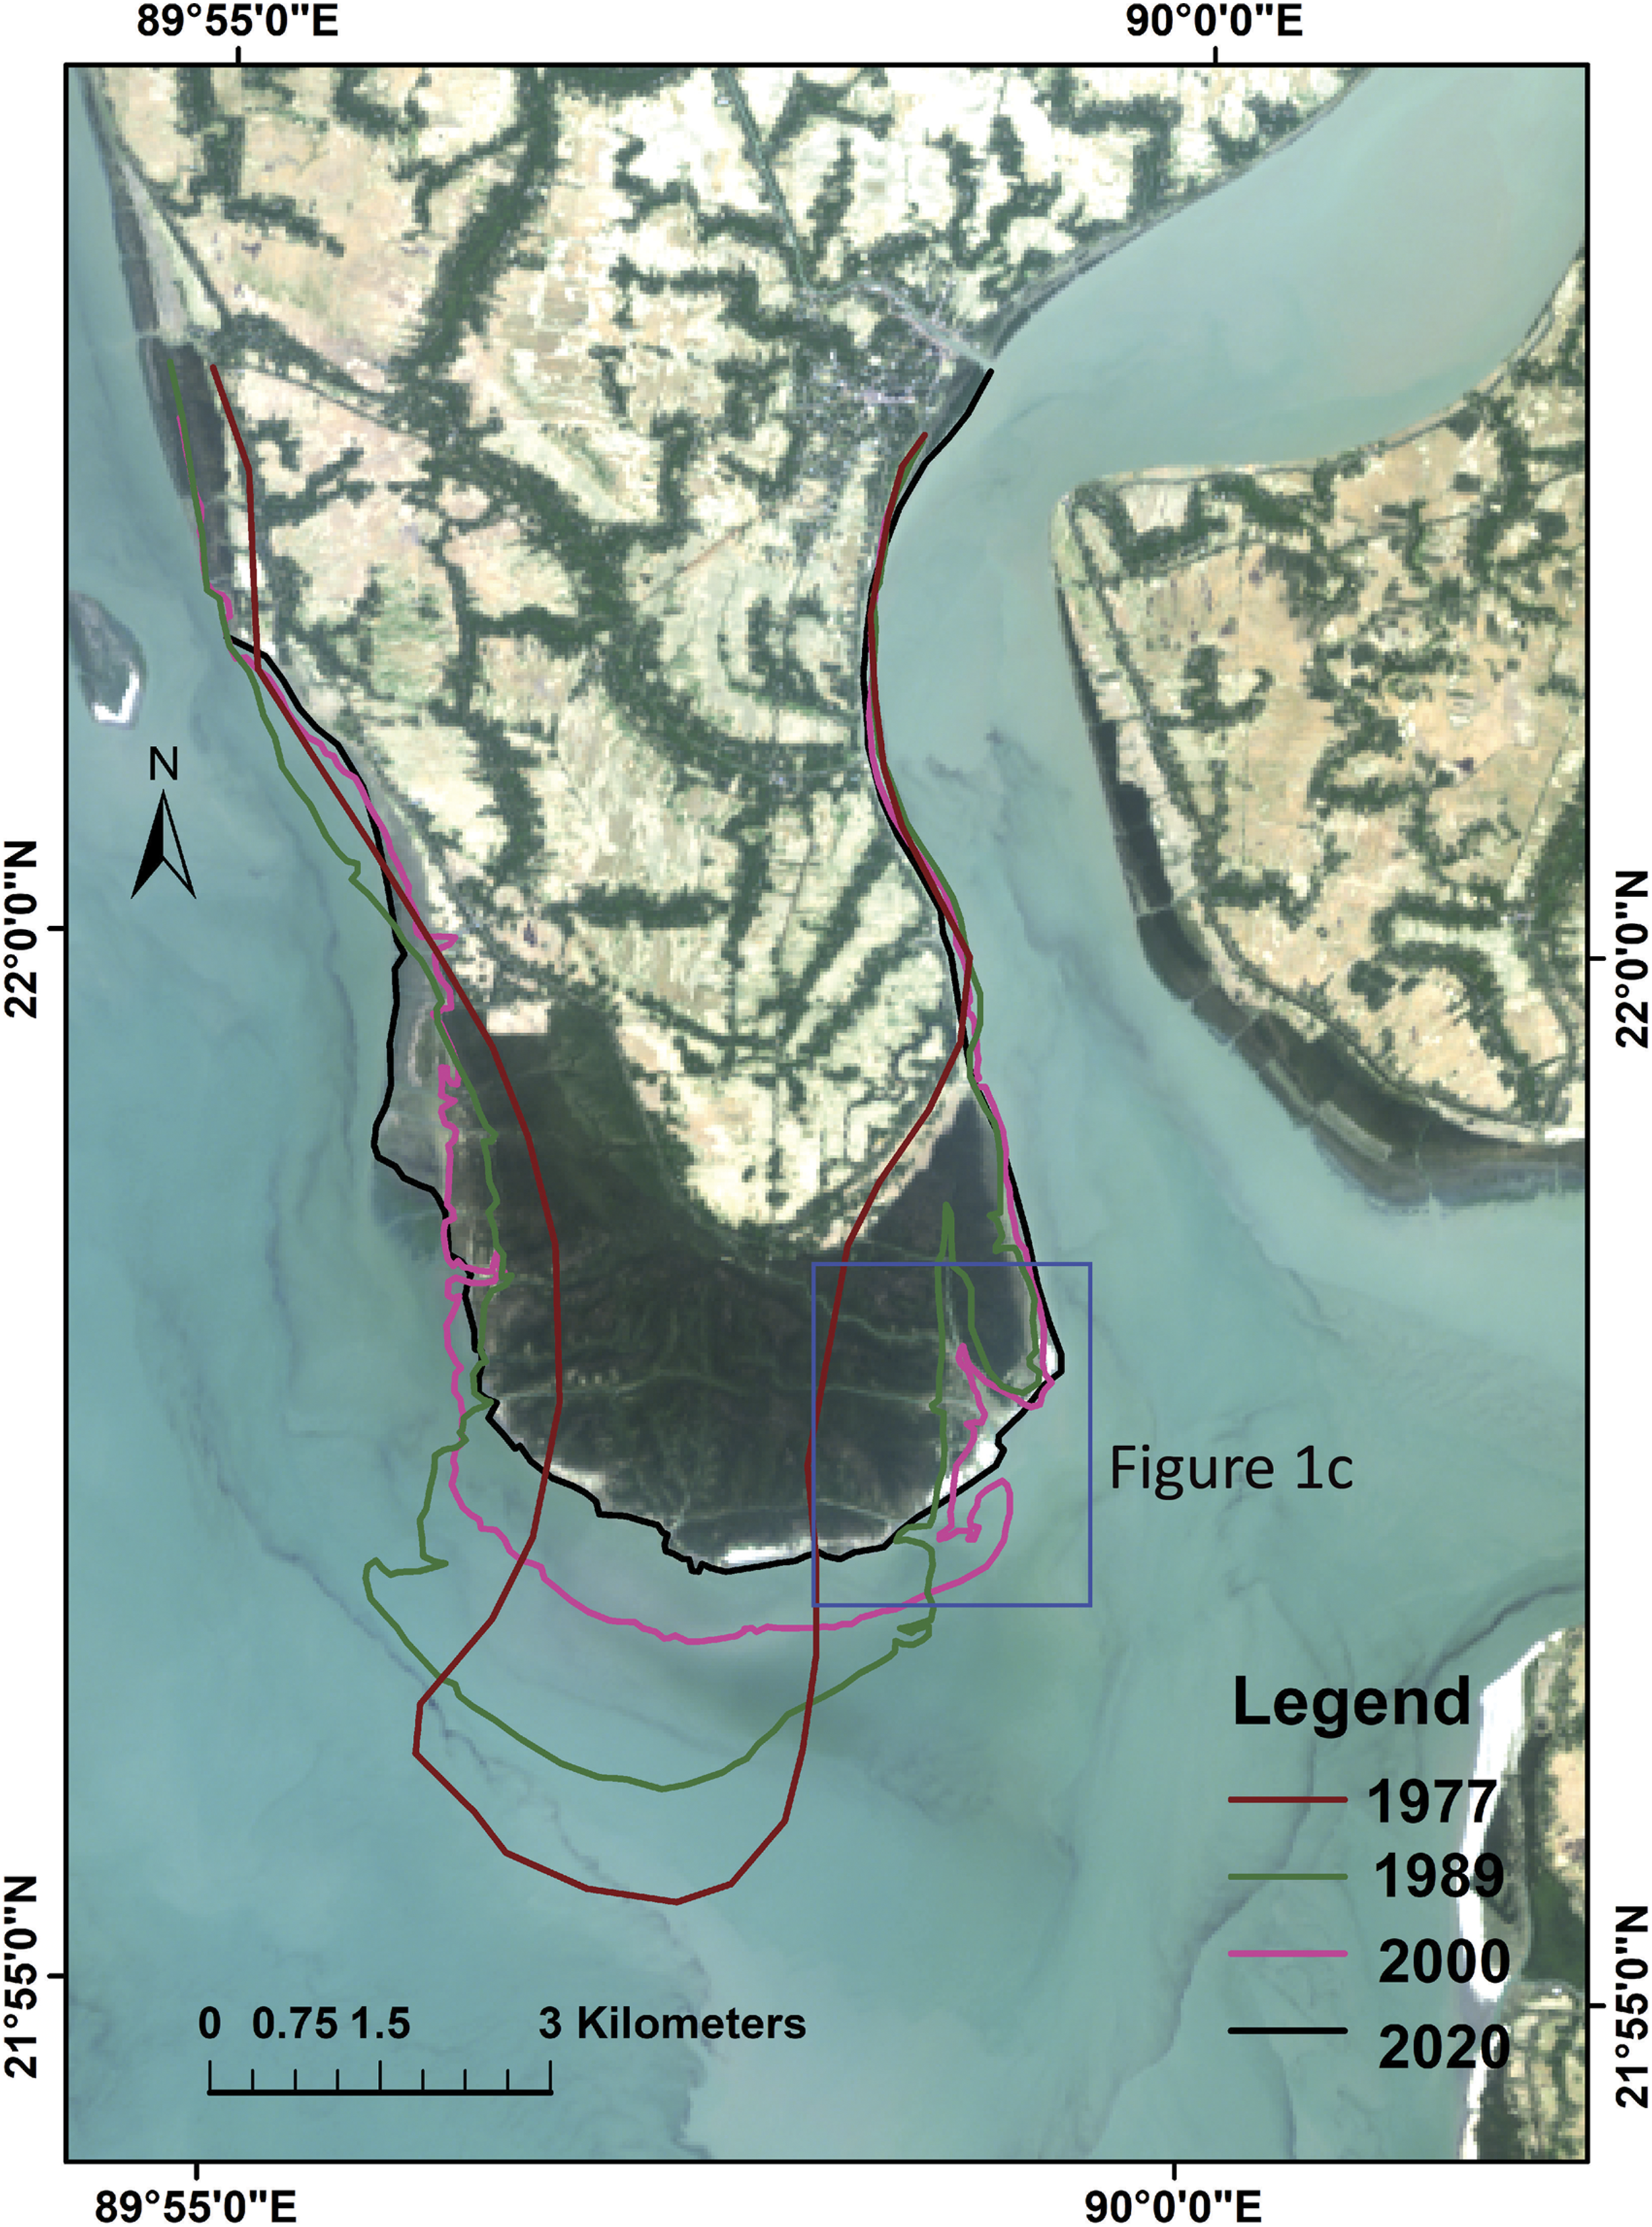
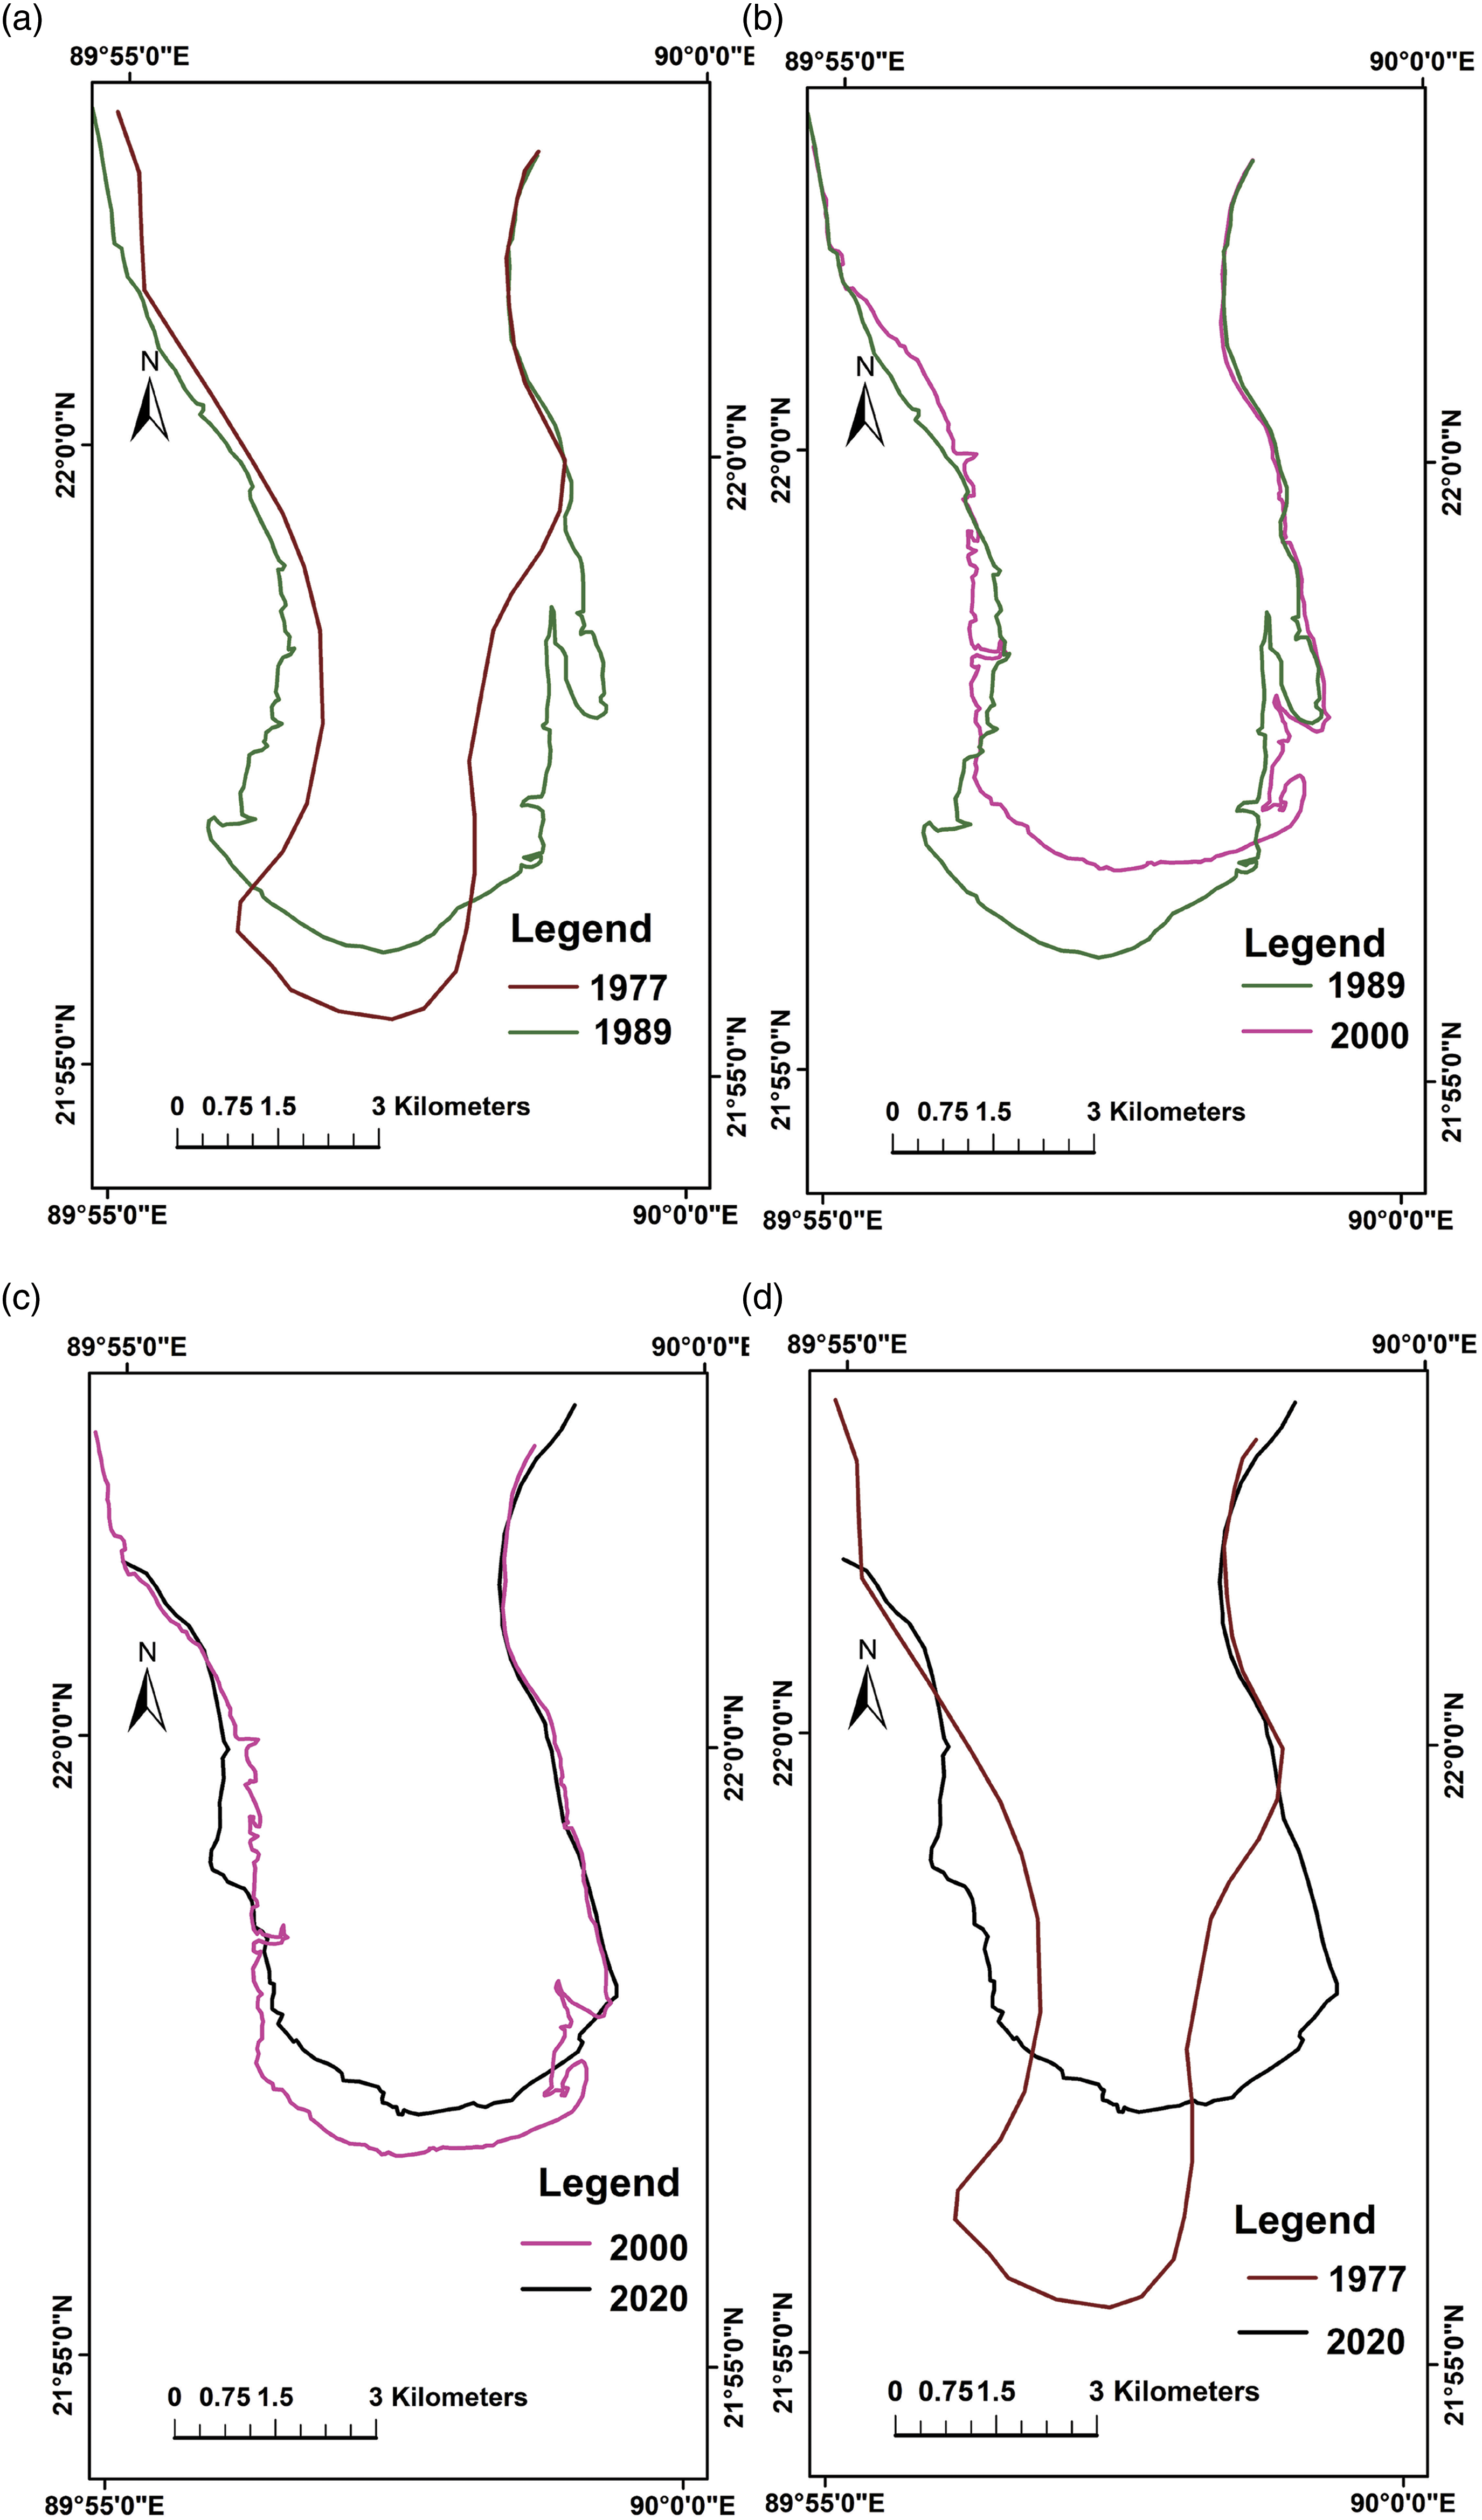
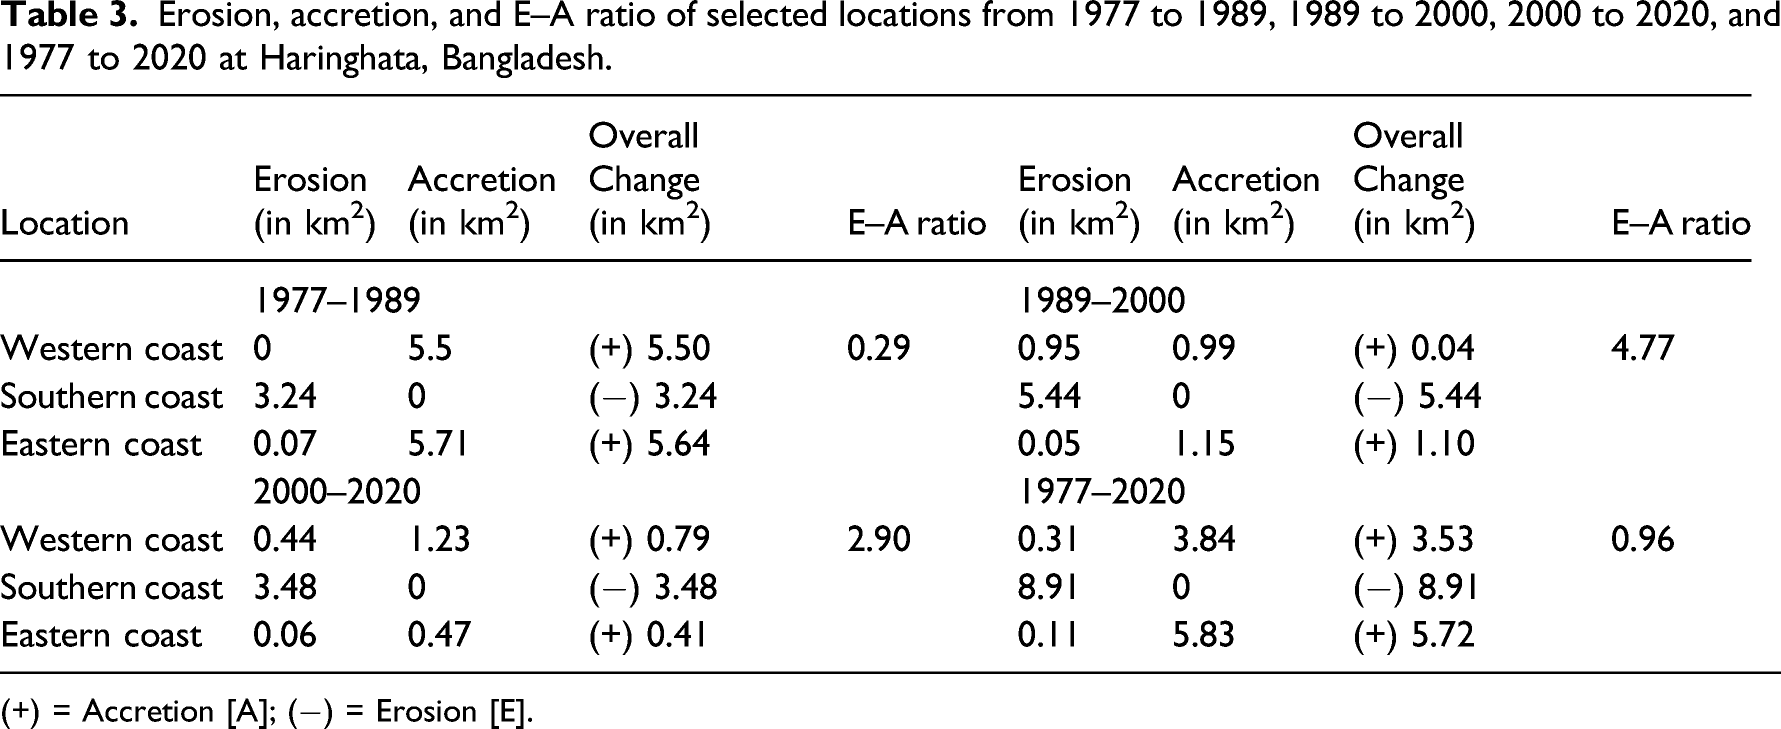
The dynamics of the coastline between 1977 and 1989 are shown in Figure 6(a). Western and eastern parts of the Haringhata coastline experienced a net accretion of 5.50 km2 and 5.64 km2, with the coastline displacement ranging between 0.15 and 1.2 km, and 0.12 and 1 km, respectively. These changes affected the coastlines for approximately 12 km along the strike in each case. In contrast, the shorter southern coast (2.7 km long) experienced net erosion of 3.24 km2 with a coastline displacement ranging between 0.7 and 1 km.
Figure 6(b) shows the coastline dynamics between 1989 and 2000. The locations that experienced accretion are again the western and eastern coast, which are 10.3 km and 11.7 km long, respectively. However, the amount of accretion is greatly reduced to the 1977–1989 period. Coastline advancement was only 0.11–0.49 km in the west and 0.05–0.66 km in the east net accretion 0.04 km2 and 1.10 km2, respectively. In contrast, the short southern coast, 4.9 km long, experienced net erosion of 5.44 km2 and coastline retreat ranging between 0.22 km and 1.4 km.
Between 2000 and 2020, the southern part of the Haringhata coastline, which extends for 4.8 km, witnessed net erosion of 3.48 km2 and coastline retreat ranging between 0.09 and 0.90 km. In contrast, the western and eastern parts of the coastline, extending for 9 and 11.3 km, respectively, experienced net accretion of 0.79 km2 and 0.41 km2, with corresponding coastline advance ranging between 0.04 km and 0.66 km, and 0.03 km and 0.76 km.
The total change in coastline position during the entire 43 years period between 1977 and 2020 is shown in Figure 6(d). Western and eastern coasts experienced net accretion of 3.53 km2 and 5.72 km2 and coastline advance ranging between 0.09 km and 1.4 km, and 0.02 km and 2.5 km, respectively. The location exposed to extended erosion is the southern coast. The total erosion in this location was 8.91 km2 with 2.3 km and 2.9 km of coastline retreat.
The erosion to accretion ratio (E–A ratio) is an indicator of shoreline dynamics, which is a measure of the degree of variation across the period from 1977 to 2020. Accretion was highest during 1977–1989 when the E–A ratio was 0.29. Landmass was lost as erosion increased from 1989 to 2000 and erosion substantially decreased from 2000 to 2020 (Table 3). Most of the accretion occurred along the western and eastern directions, whereas erosion occurred along the southern direction (Figure 5). Satellite image analysis reveals that the southern coastline experienced retreat due to erosion from 1977 to 2020, ranging between 5 and 127 m/year. In contrast, the western and eastern coastline experienced seaward advancement due to accretion, ranging between 2 and 100 m/year and 0 and 83 m/year, respectively.
4.2 Sedimentary facies and depositional environment
Lithology, grain size, and sedimentary structures in the three cores allow the definition of two sedimentary facies up to 130 cm thick (Figure 7). These sedimentary facies, together with geochemical proxies and diatom assemblages, can be used to define the origin of organic matter, provenance, and depositional environment of the sediments.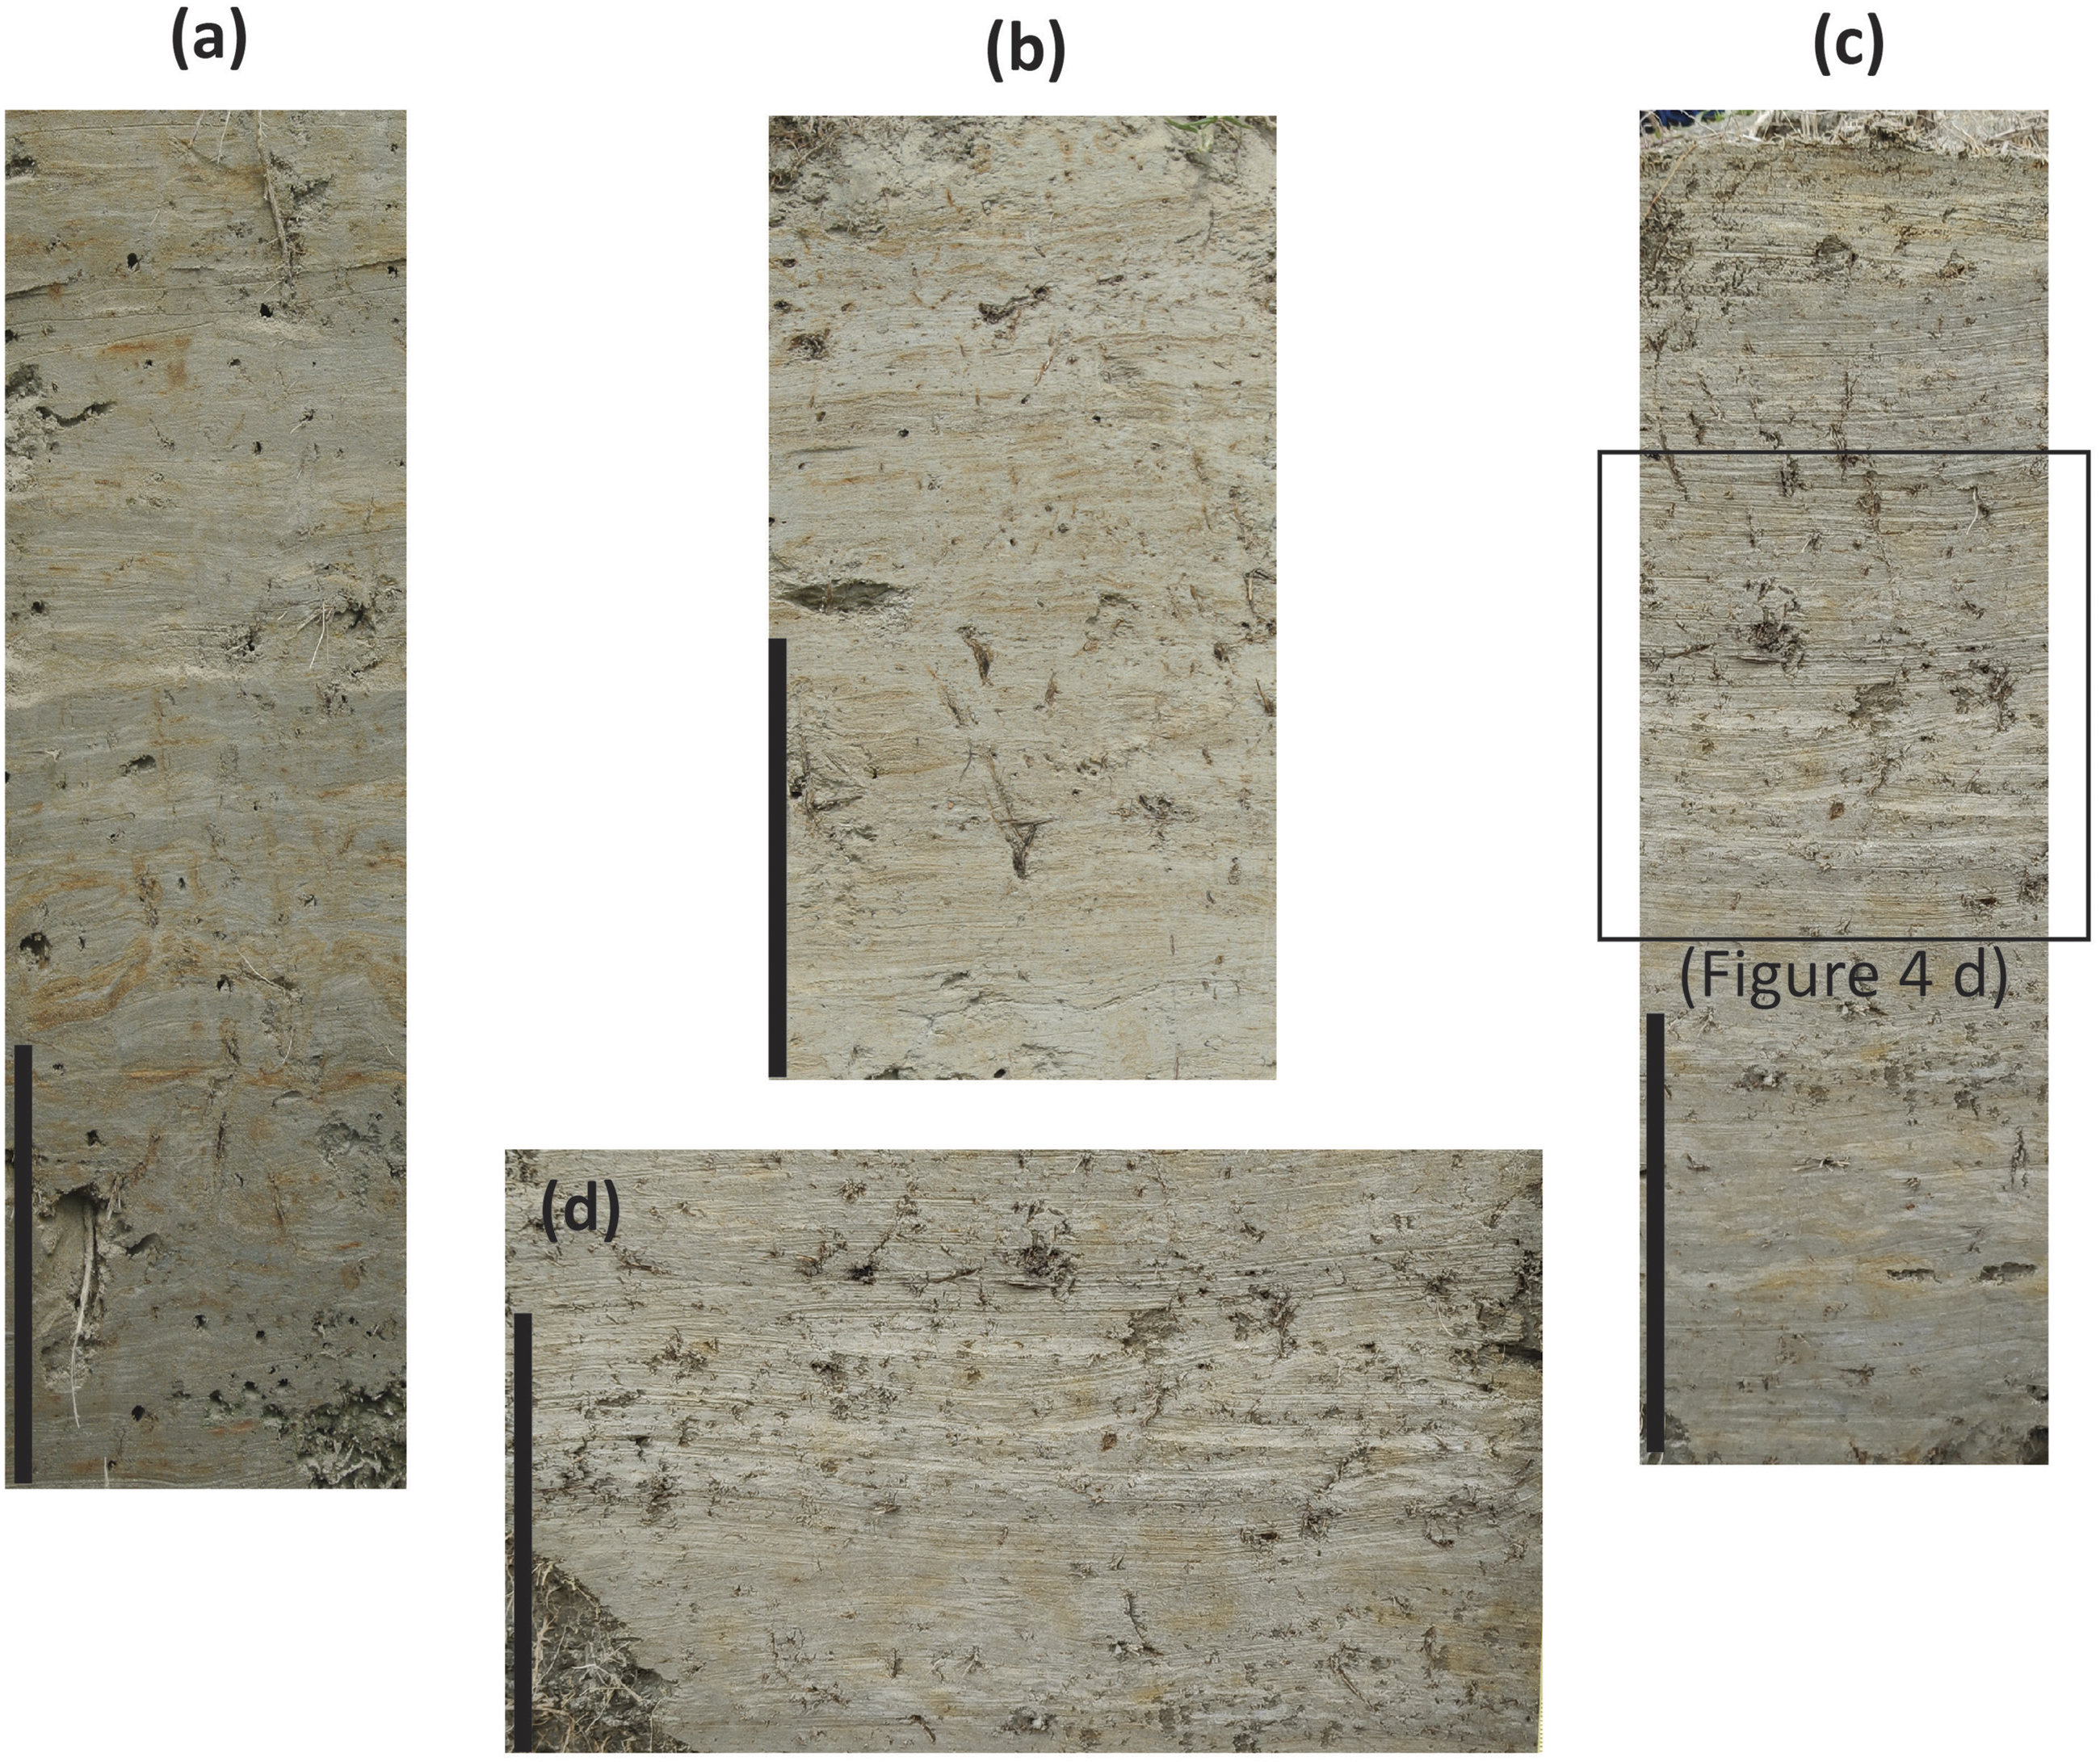
4.2.1 Facies A (bluish gray mud)
Facies A contains 72–91% mud (clay 7–11% and silt 65–80%) and 9–28% sand and occurs in the deepest part of the succession. Parallel to wavy laminated bluish gray mud is interbedded lenticular to ripple laminated yellowish gray to grayish white silty to very fine-grained sand (Figure 7(a)). Laminated mud–sand couplets are also observed in the upper part of the facies (Figure 7(b)). The bottoms of the ripples are sharp, and lenses corresponding to the ripples are asymmetric, with foresets dipping in opposite directions. Some ripples showed offshoot structure. The facies showed yellowish red to grayish red and contained plant fragments and rootlets. The average TOC and TOC/TN of the facies range between 0.14% and 0.87%, 7.1 and 18.8, respectively. The δ13C values range between −24.4‰ and −19.7‰, and the highest values at the bottom of the facies, decreasing upward (Figure 8; Table 1). Vertical distribution of mean grain size, TOC, TOC/TN, and δ13C values of cores at Site 1–3.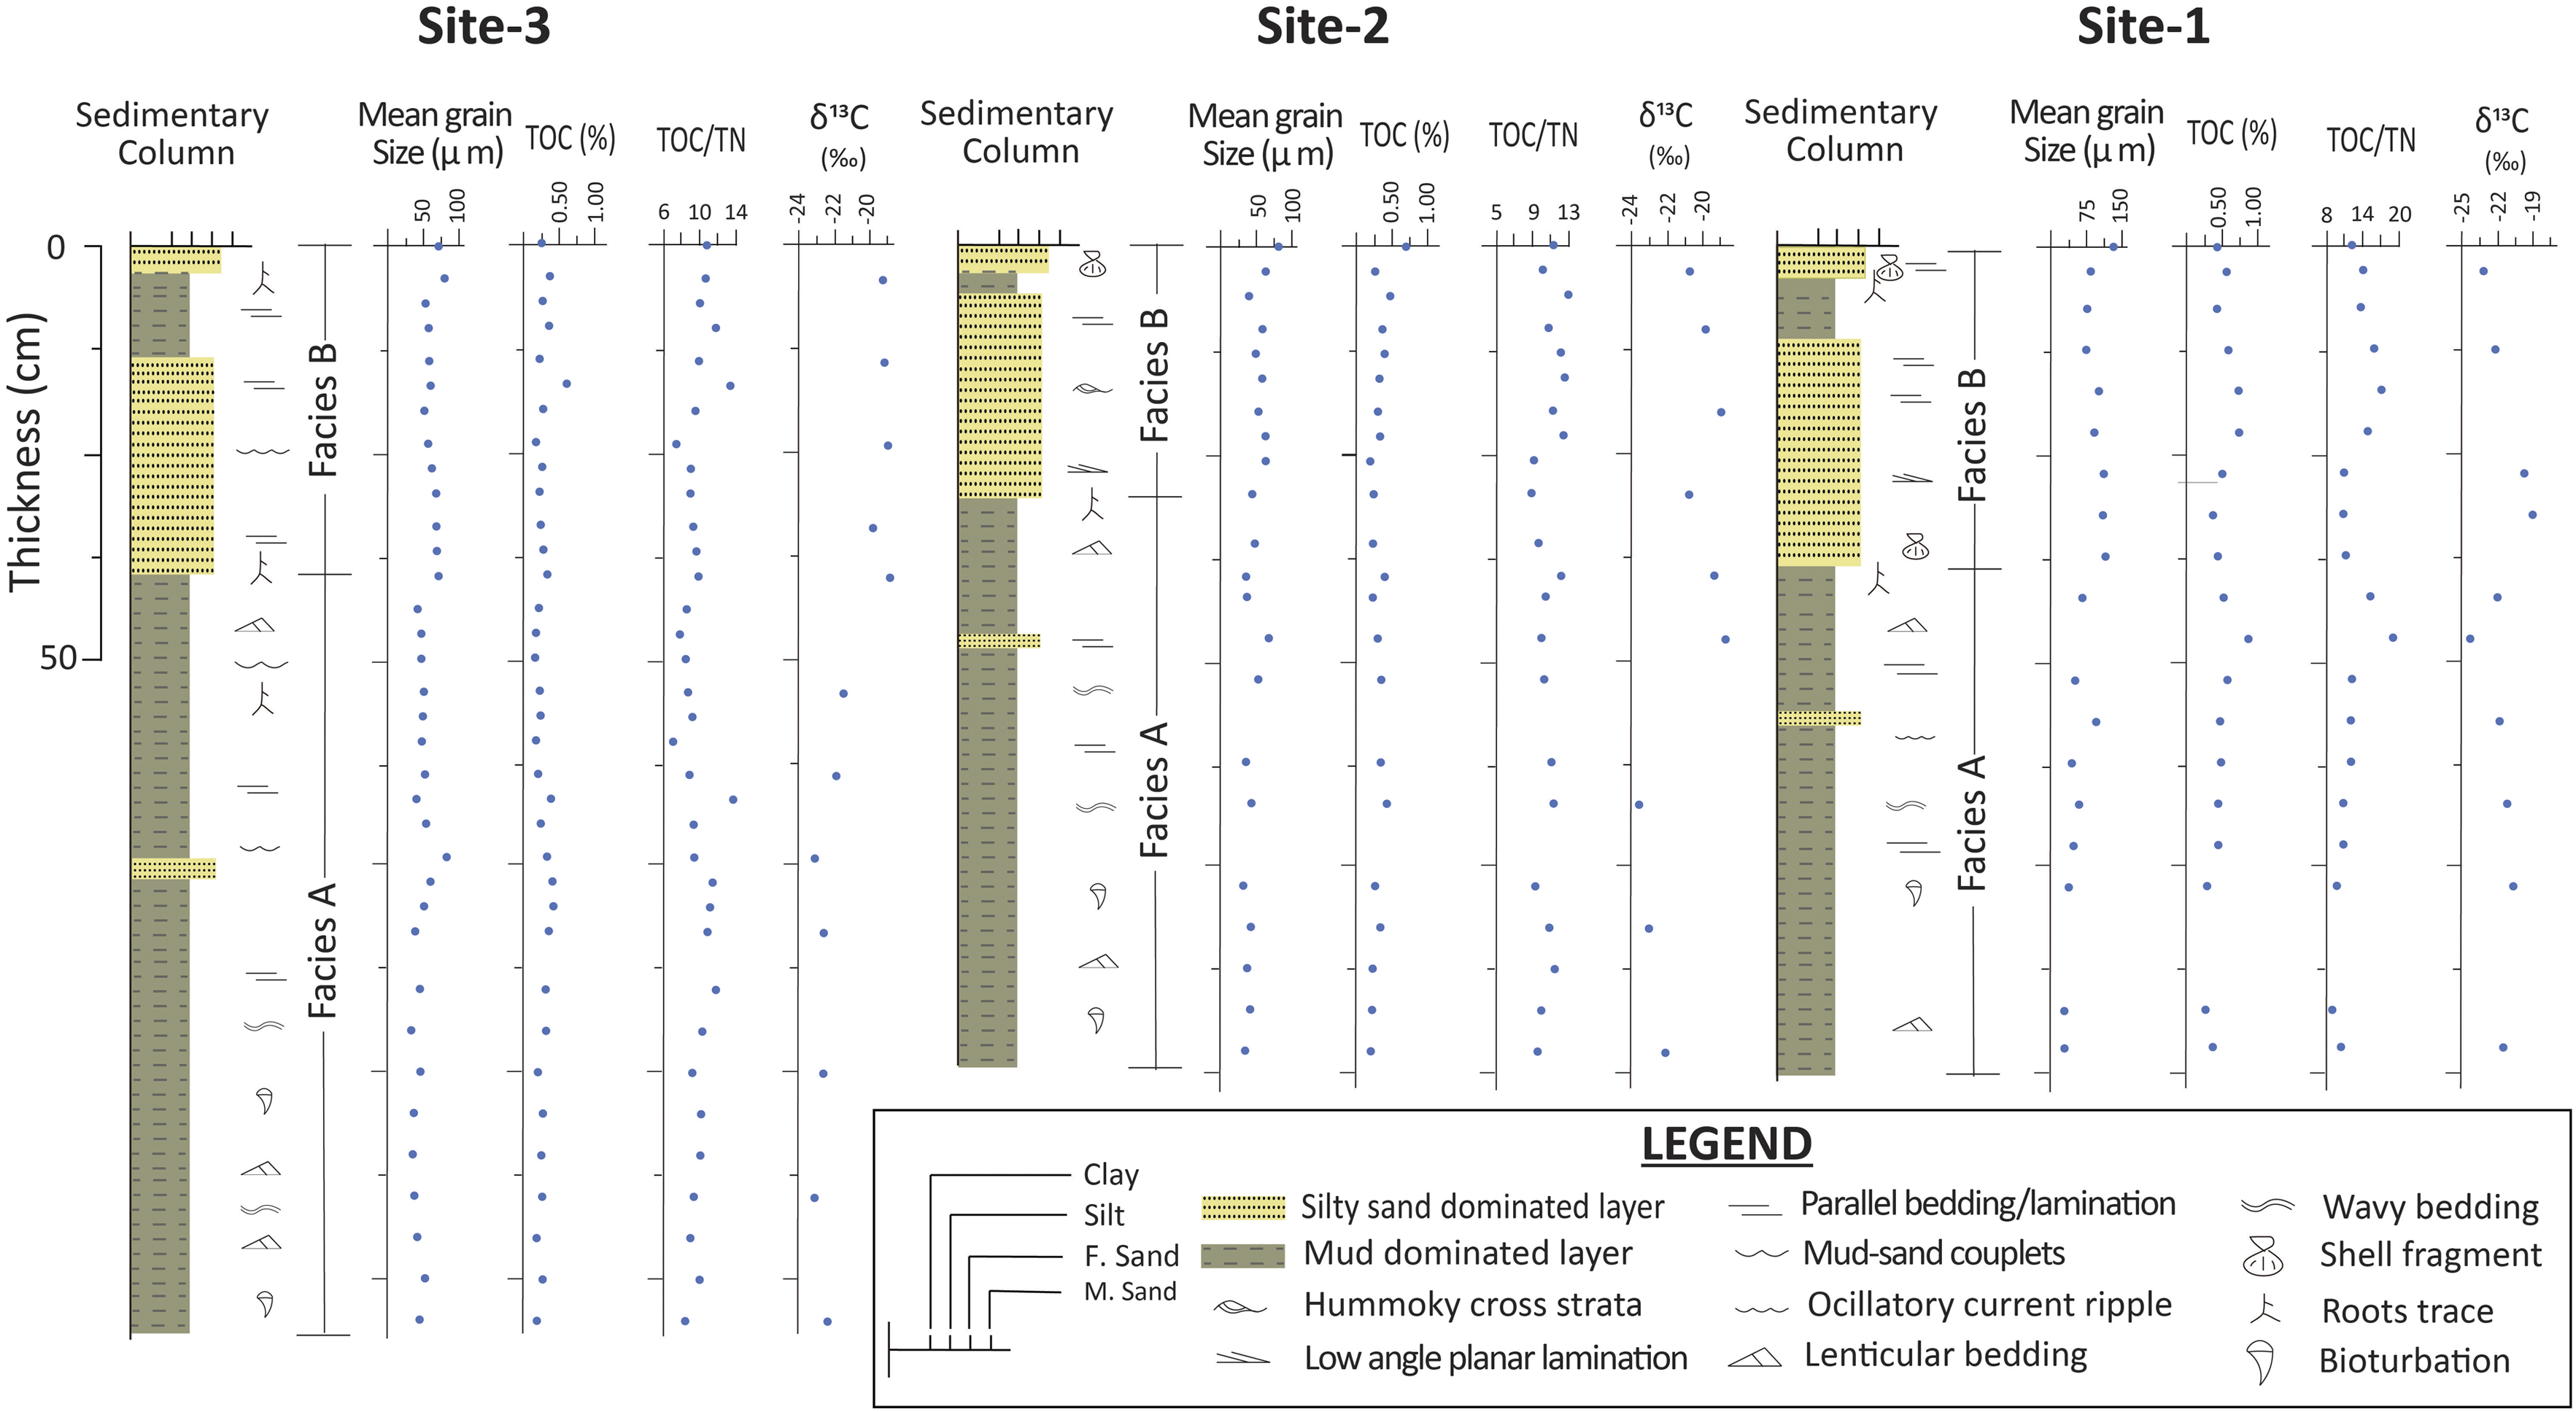
Interpretation: The abundance of mud indicates that the facies was deposited by settling in slack water, alternating with a high energy regime that permitted the transportation and deposition of very fine-grained sand (Figure 7). The presence of lenticular bedding, ripples, and asymmetric lenses with foresets dipping in opposite directions indicates tidal influence (Basilici et al., 2012; Greb and Archer, 1998; Tessier et al., 1998; Yang and Nio, 1985). The sand and mud laminae have not shown systematic thickness variation. The occurrence of sand within a muddy interval was generated by tidal current rather than the storm (Nio and Yang, 1991). The offshoot structures of the ripples indicated wave energy during the deposition of the sediment. Very fine-grained sand and mud couplets imply an upper intertidal to a supratidal flat environment where plant rootlets and yellowish to grayish red sediment suggest that the sediments were deposited above the fluctuating normal tidal limit (Hori et al., 2001, 2002) (Figure 7). The sedimentary structures and geochemical proxies indicate a transitional coastal environment of the lower delta plain where the organic matter in the sediment was primarily of marine origin (Figure 8). The amount of terrestrial influenced organic matter increases in the upper part of the facies because mangrove forests gradually covered the area after deposition (Figures 2(a) and 5).
4.2.2 Facies B (gray to grayish white silty sand)
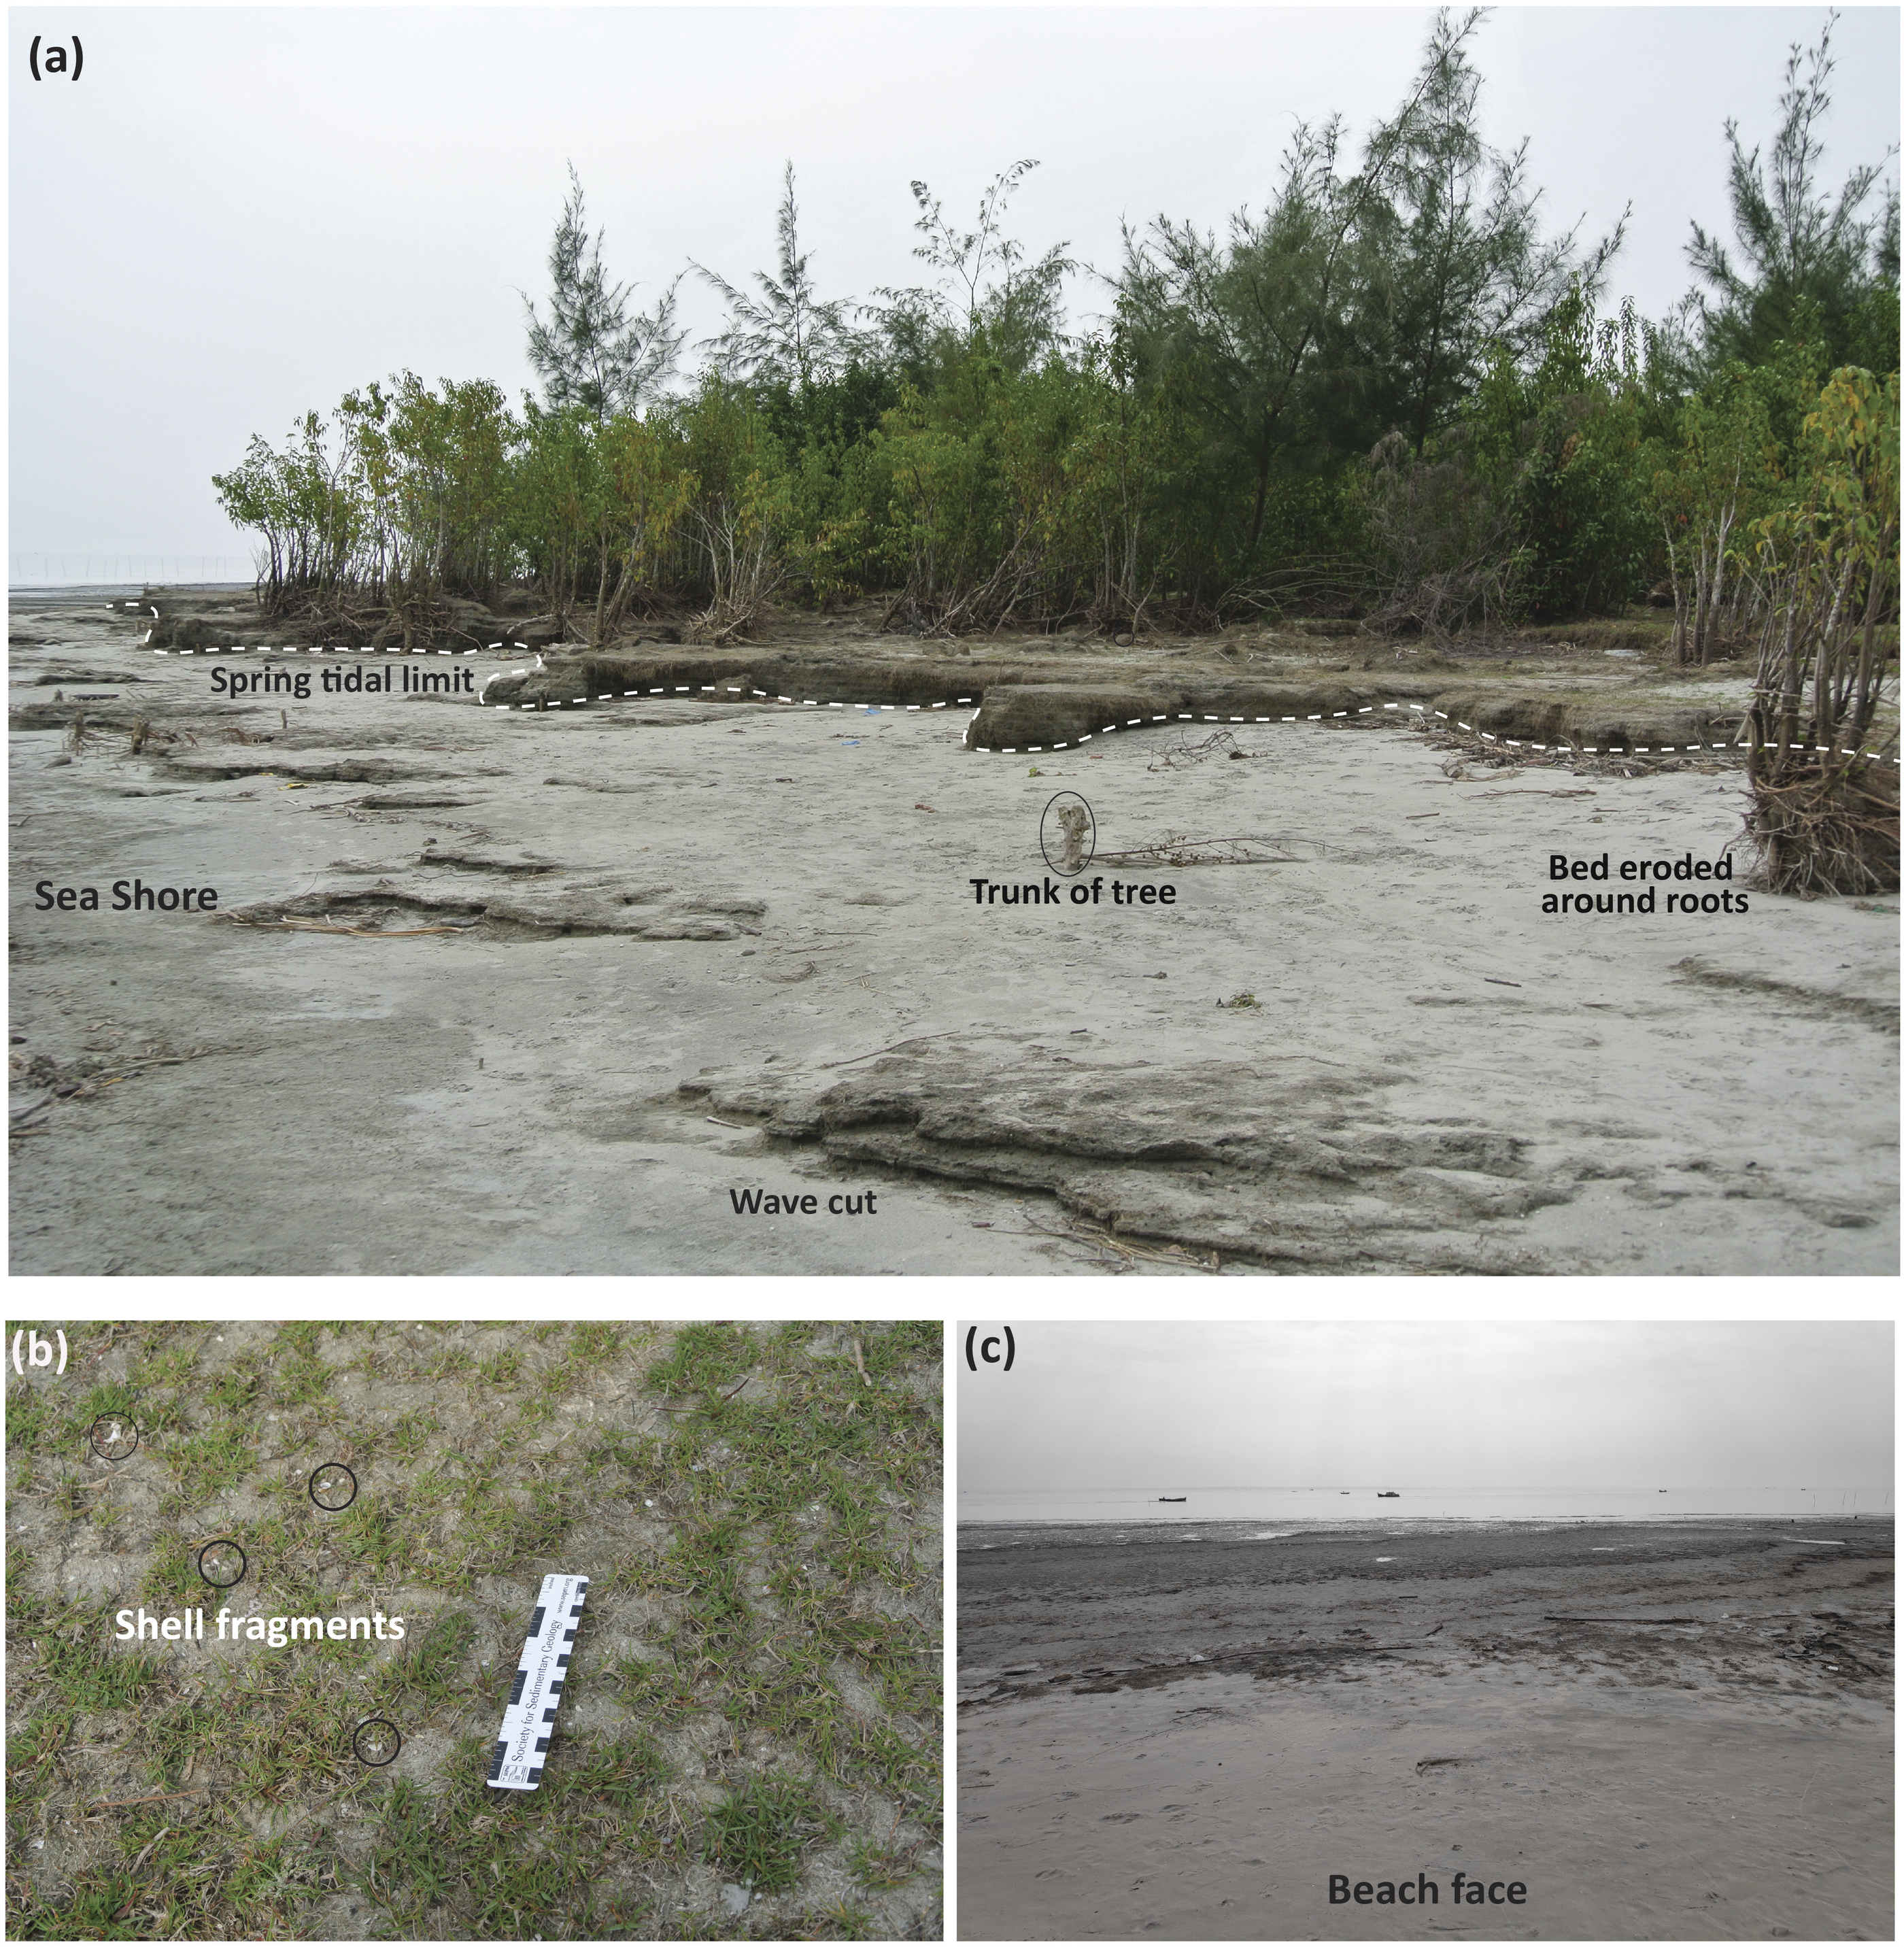
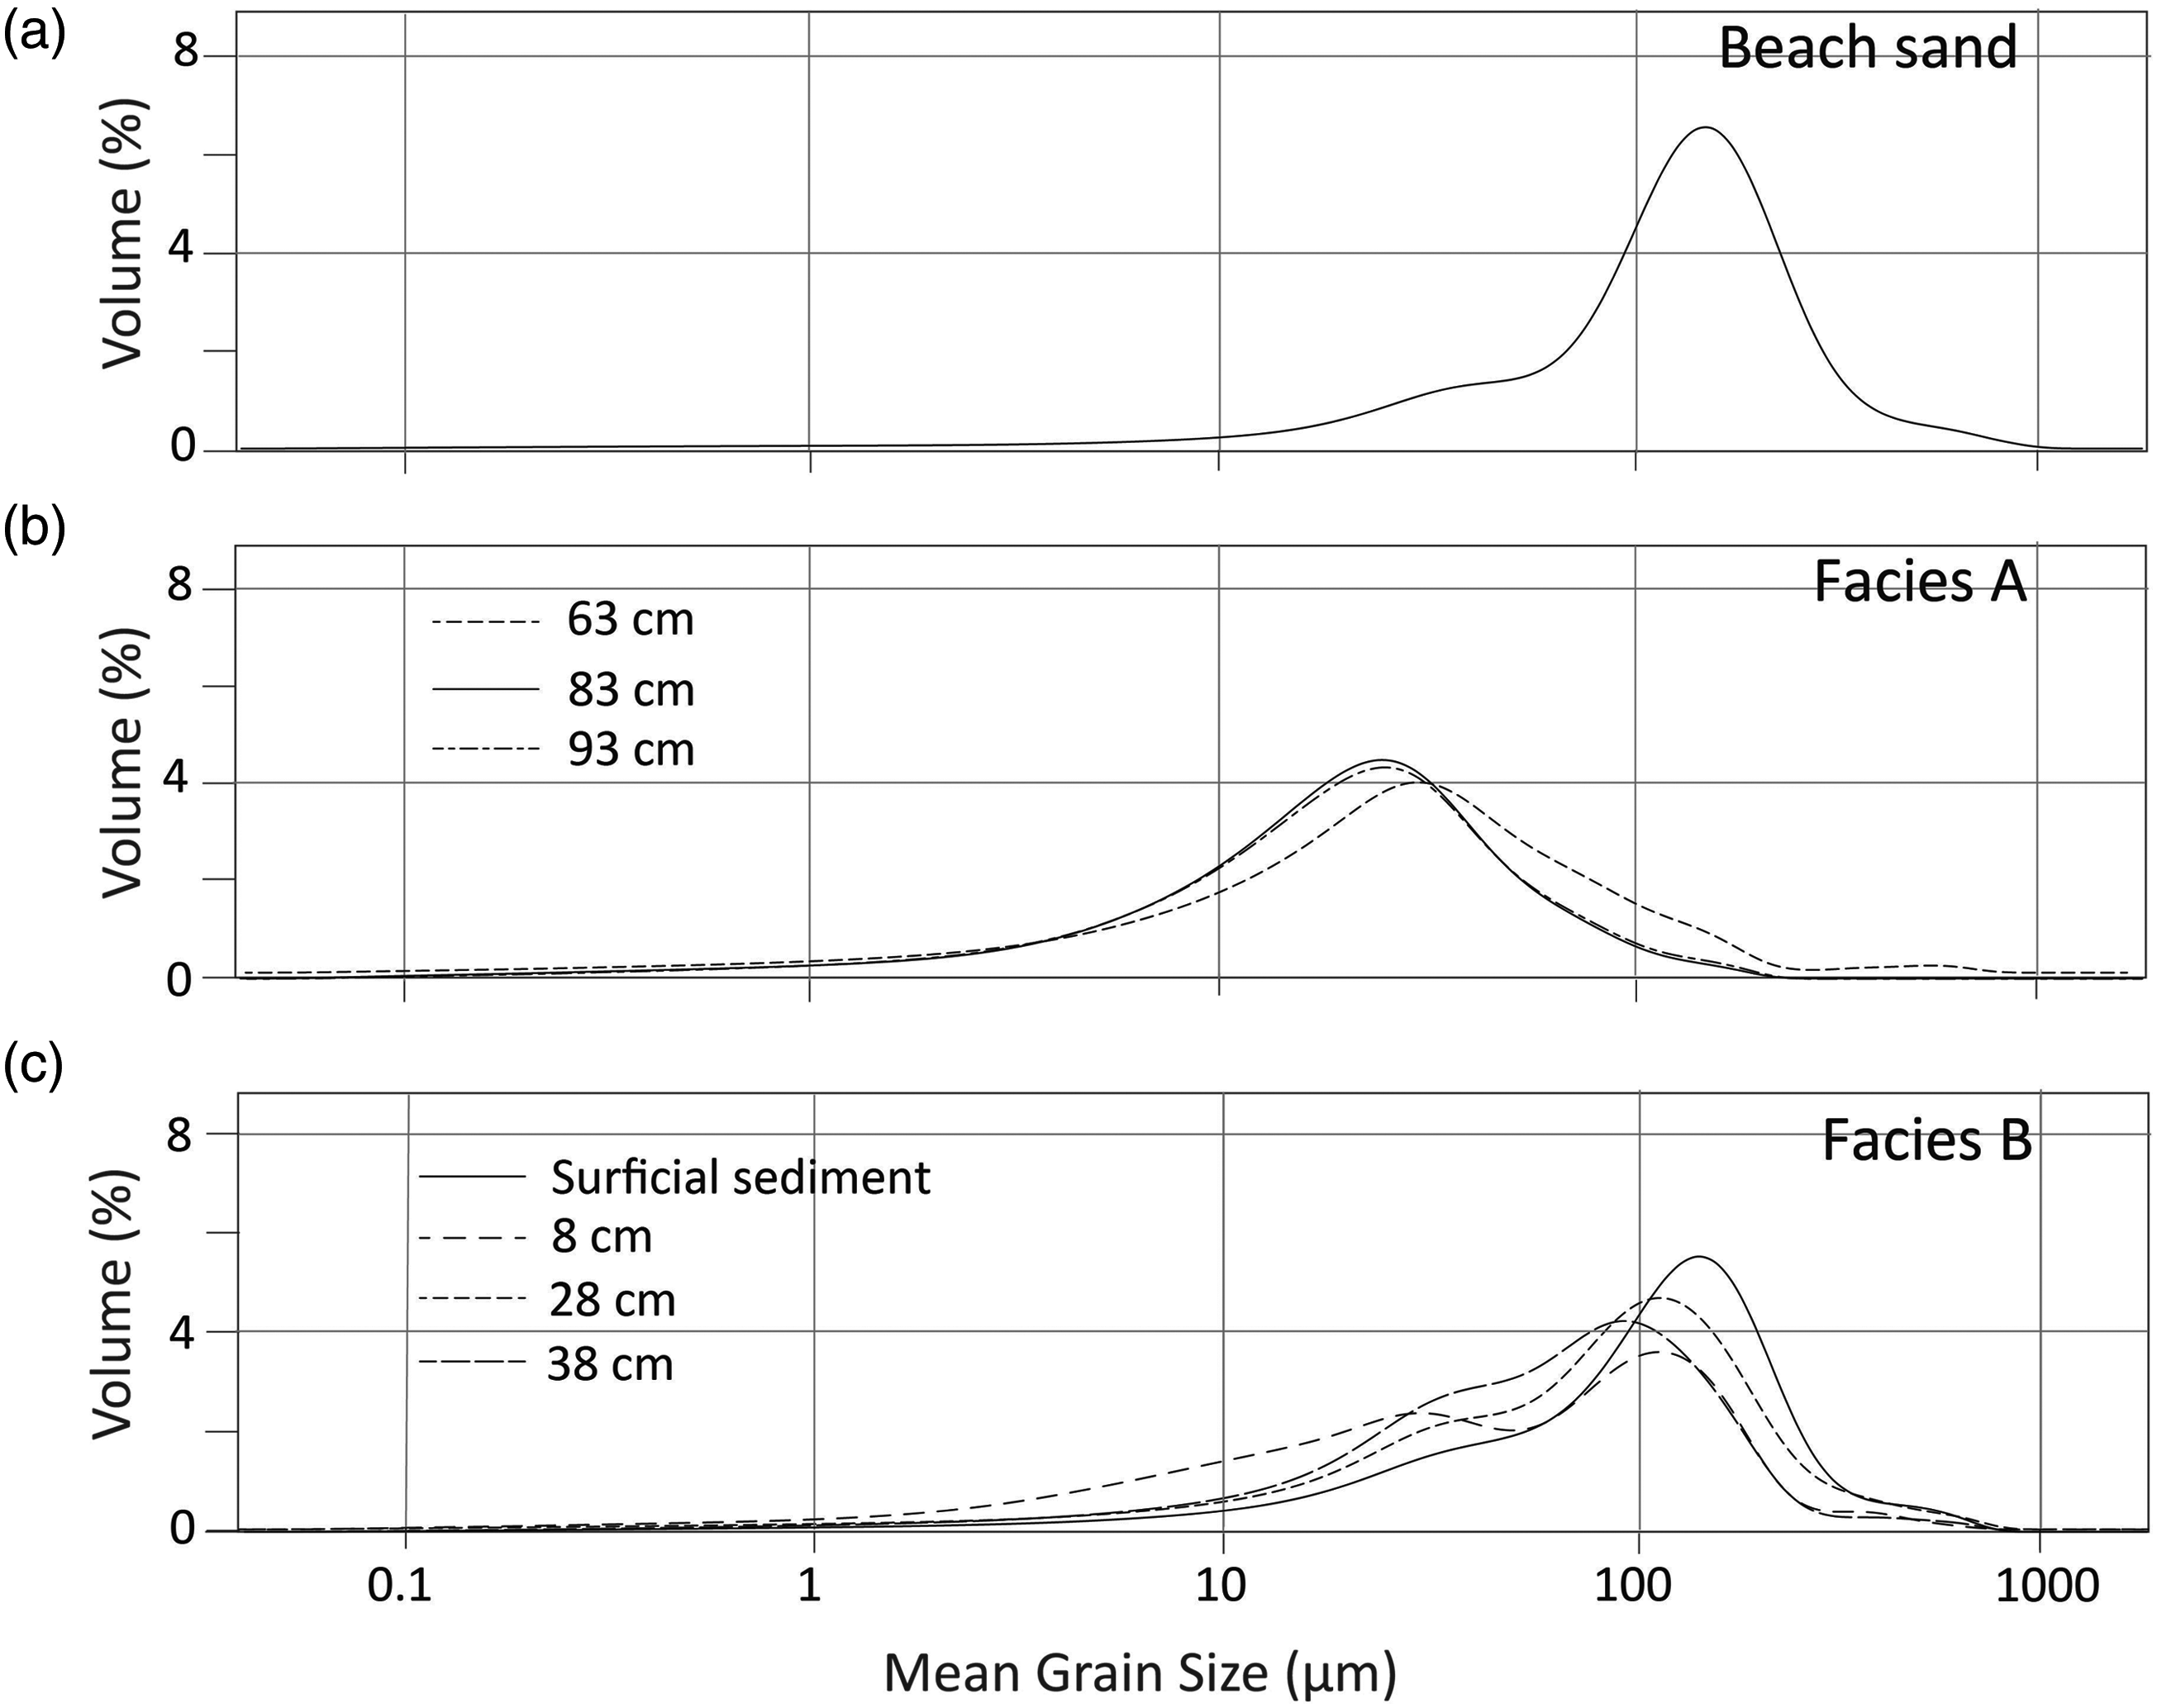
Facies B overlies the bluish gray colored mud and contains 31–62% mud (clay 3–6% and silt 28–56%) and 38–69% sand. The facies have a low angle parallel laminae at the lower part, hummocky cross-stratification (HCS) at the middle and horizontal laminae at the upper part (Figures 7(c) and (d)). HCS extends laterally up to 55 m and has had a tabular shape in outcrop. The basal surface of the facies has a sharp contact. The fieldwork was conducted after cyclone Bulbul affected the coast in November 2019 (Needs Assessment Working Group [NAWG], 2019). A sandy layer with shell fragments covered the surface of the study area (Figure 2). The grain size of these surficial sediments gradually decreases inland, whereas mud concentration and sorting value increase (Figure 9). The grain size distributions at Site-1 show that the sediments of Facies A are dominated by mud, whereas Facies B shows a bimodal population with a mixture of mud and fine-grained sand (Figure 10). The grain size distribution of Facies B shows fining upward, whereas mean grain size decreased from coast to inland (Figures 8 and 9; Table 1). The average TOC values of Facies B range between 0.15% and 0.74% and TOC/TN values are between 7.4 and 14.7. The δ13C values are high at the base of the facies (−20.2‰ to −18.8‰) and lower in the upper part (−20.7 ‰ to −22.8‰; Figure 8; Table 1). Lateral variation of (a) grain size distribution; (b) clay, silt, and sand percentage, and (c) mean grain size and sorting values of surficial sediments of Site 1–3 and beach sand. Comparison of grain size distribution among (a) beach sand, (b) Facies A, and (c) Facies B of Site-1.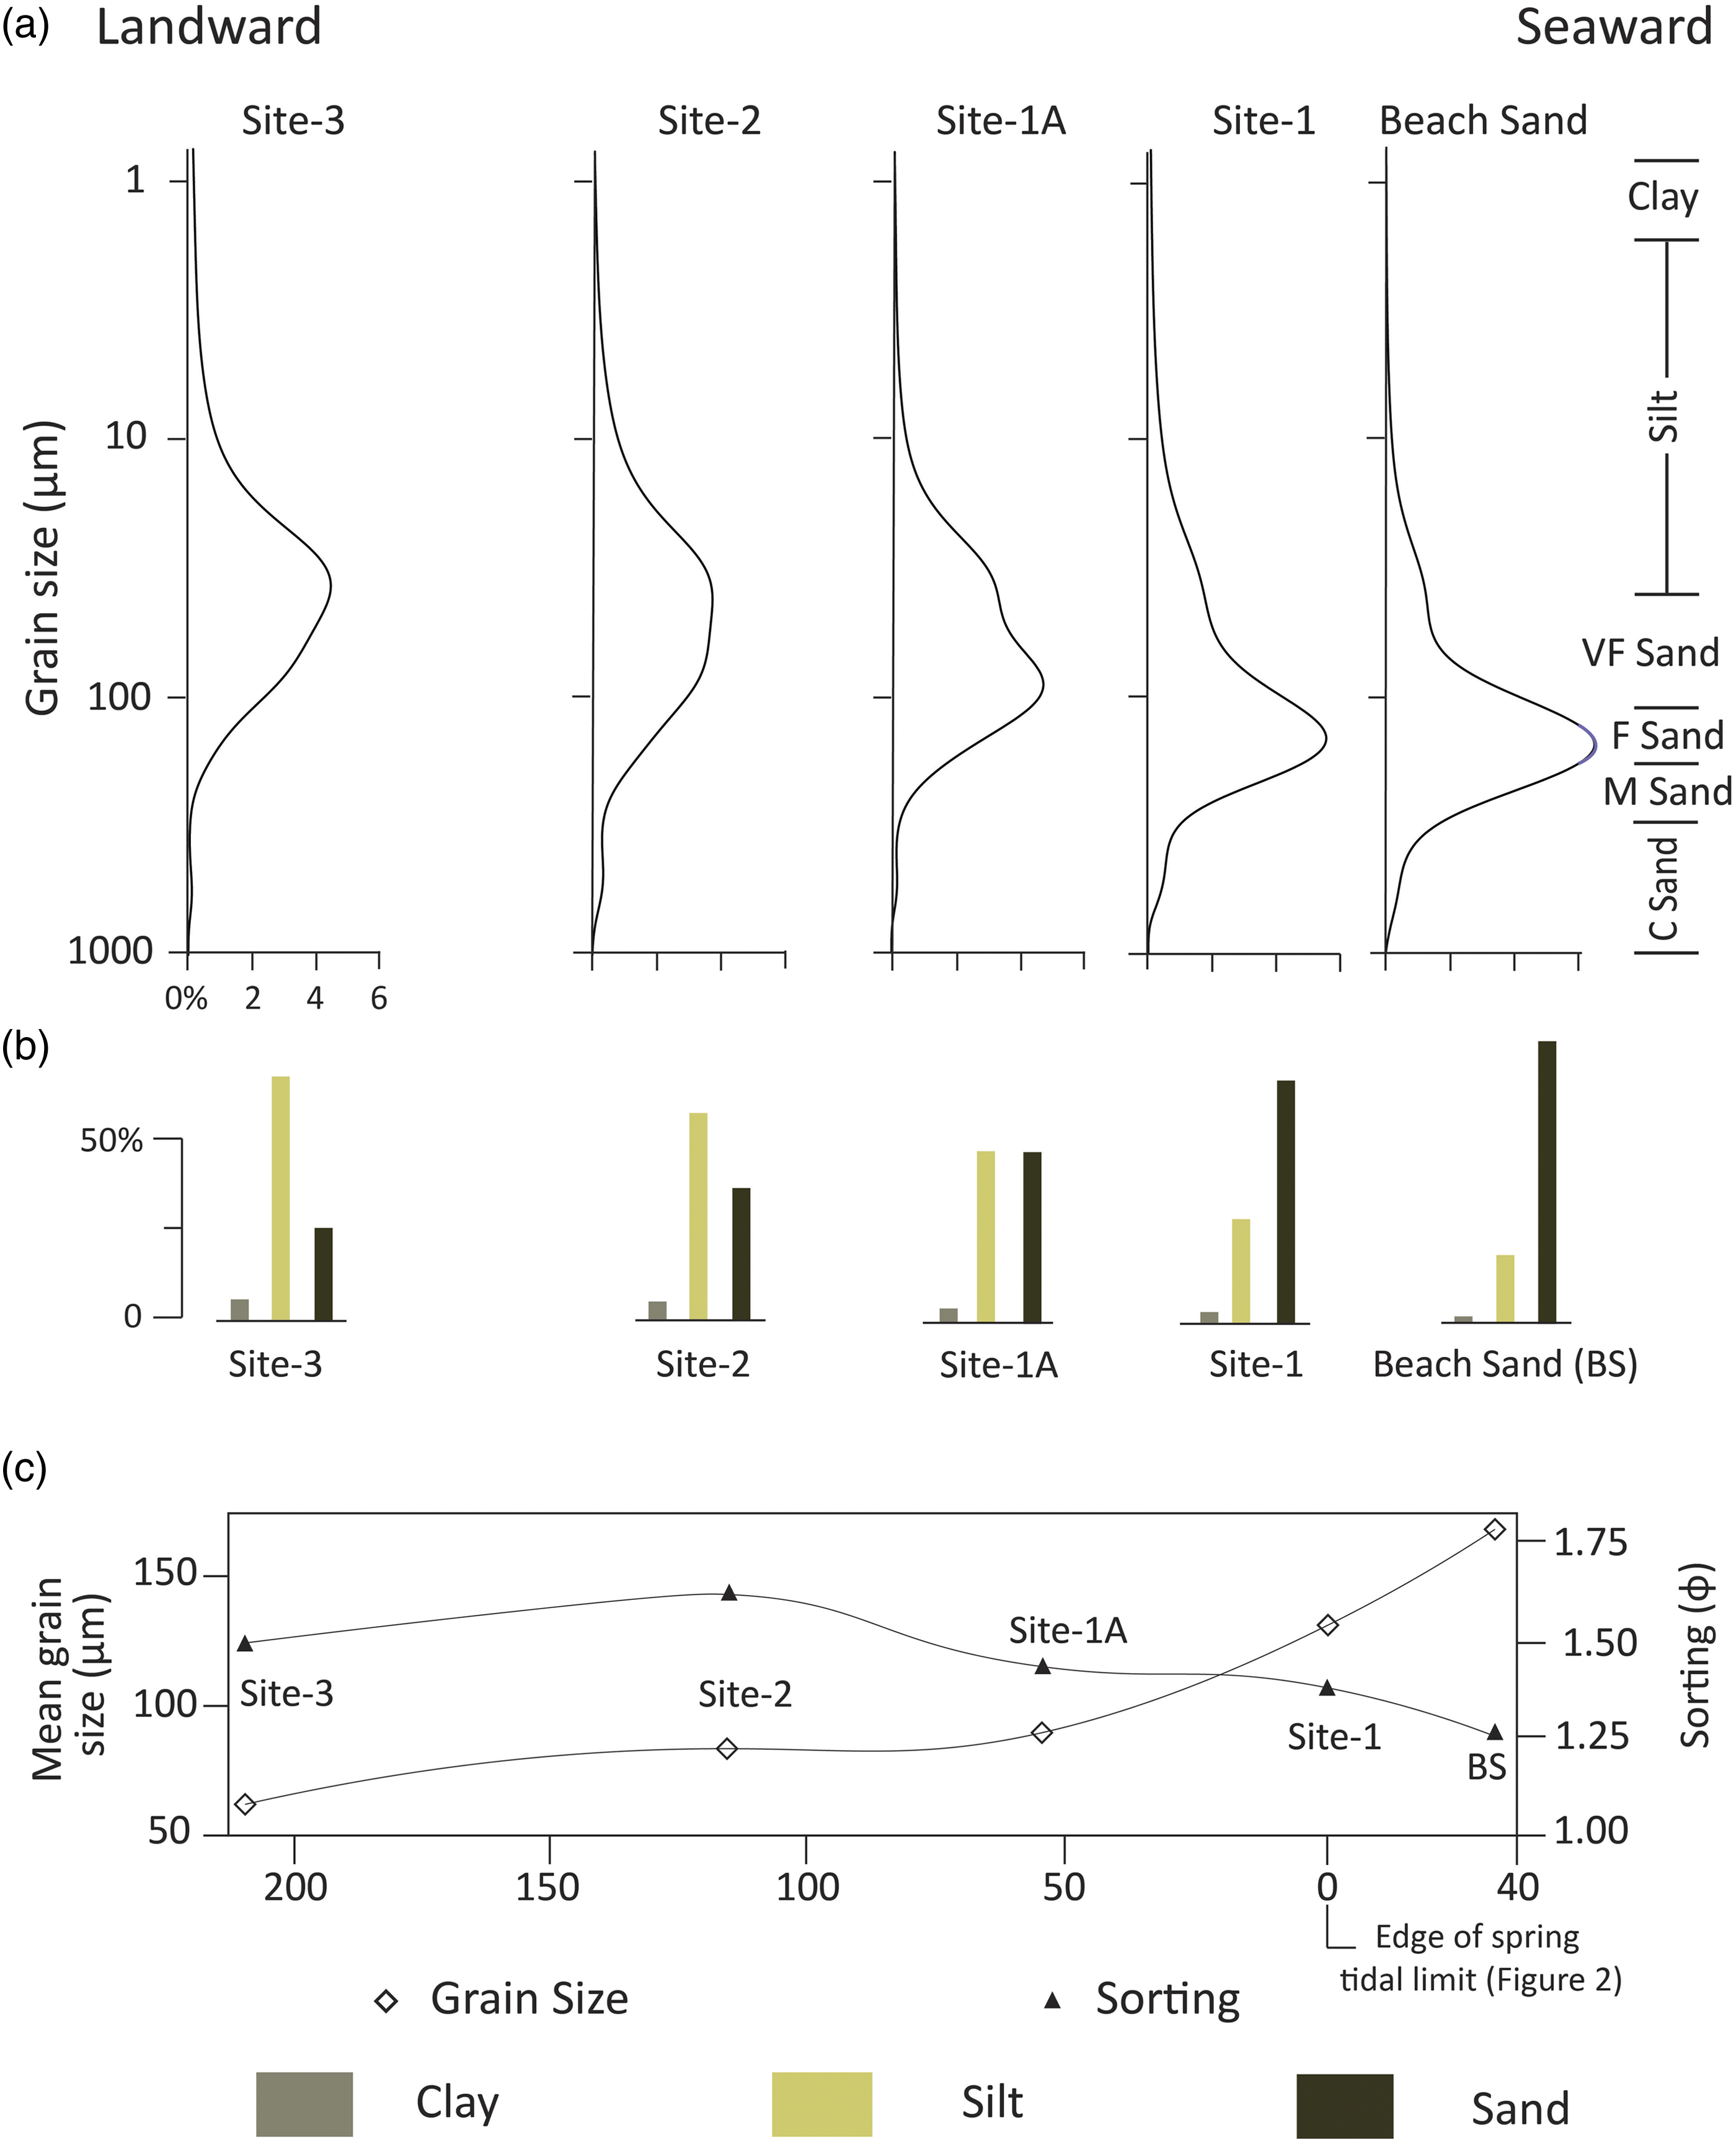
The lateral variation of diatom assemblages in the surficial sediment of Facies B is shown in Figure 11. The marine species Thalassiosira oestrupii, Bacterosira fragilis, Cyclotella stylorum and brackish species Cyclotella striata, Frafilaria fasciculata, Navicula halophila are abundant at Site-1. The brackish Navicula cryptotenella, Navicula pygmaea and Navicula perminuta, and freshwater Nitzscia recta and Cymbella pusilla diatom species are abundant at Site-3. The total relative abundance of diatoms gradually changes from marine–brackish at the more outboard Site-1 to brackish–freshwater at the more inland Site-3. The beach sediment is dominated by brackish to freshwater species. Fossil diatom assemblages of surficial sediments of Site 1–3 and beach sand.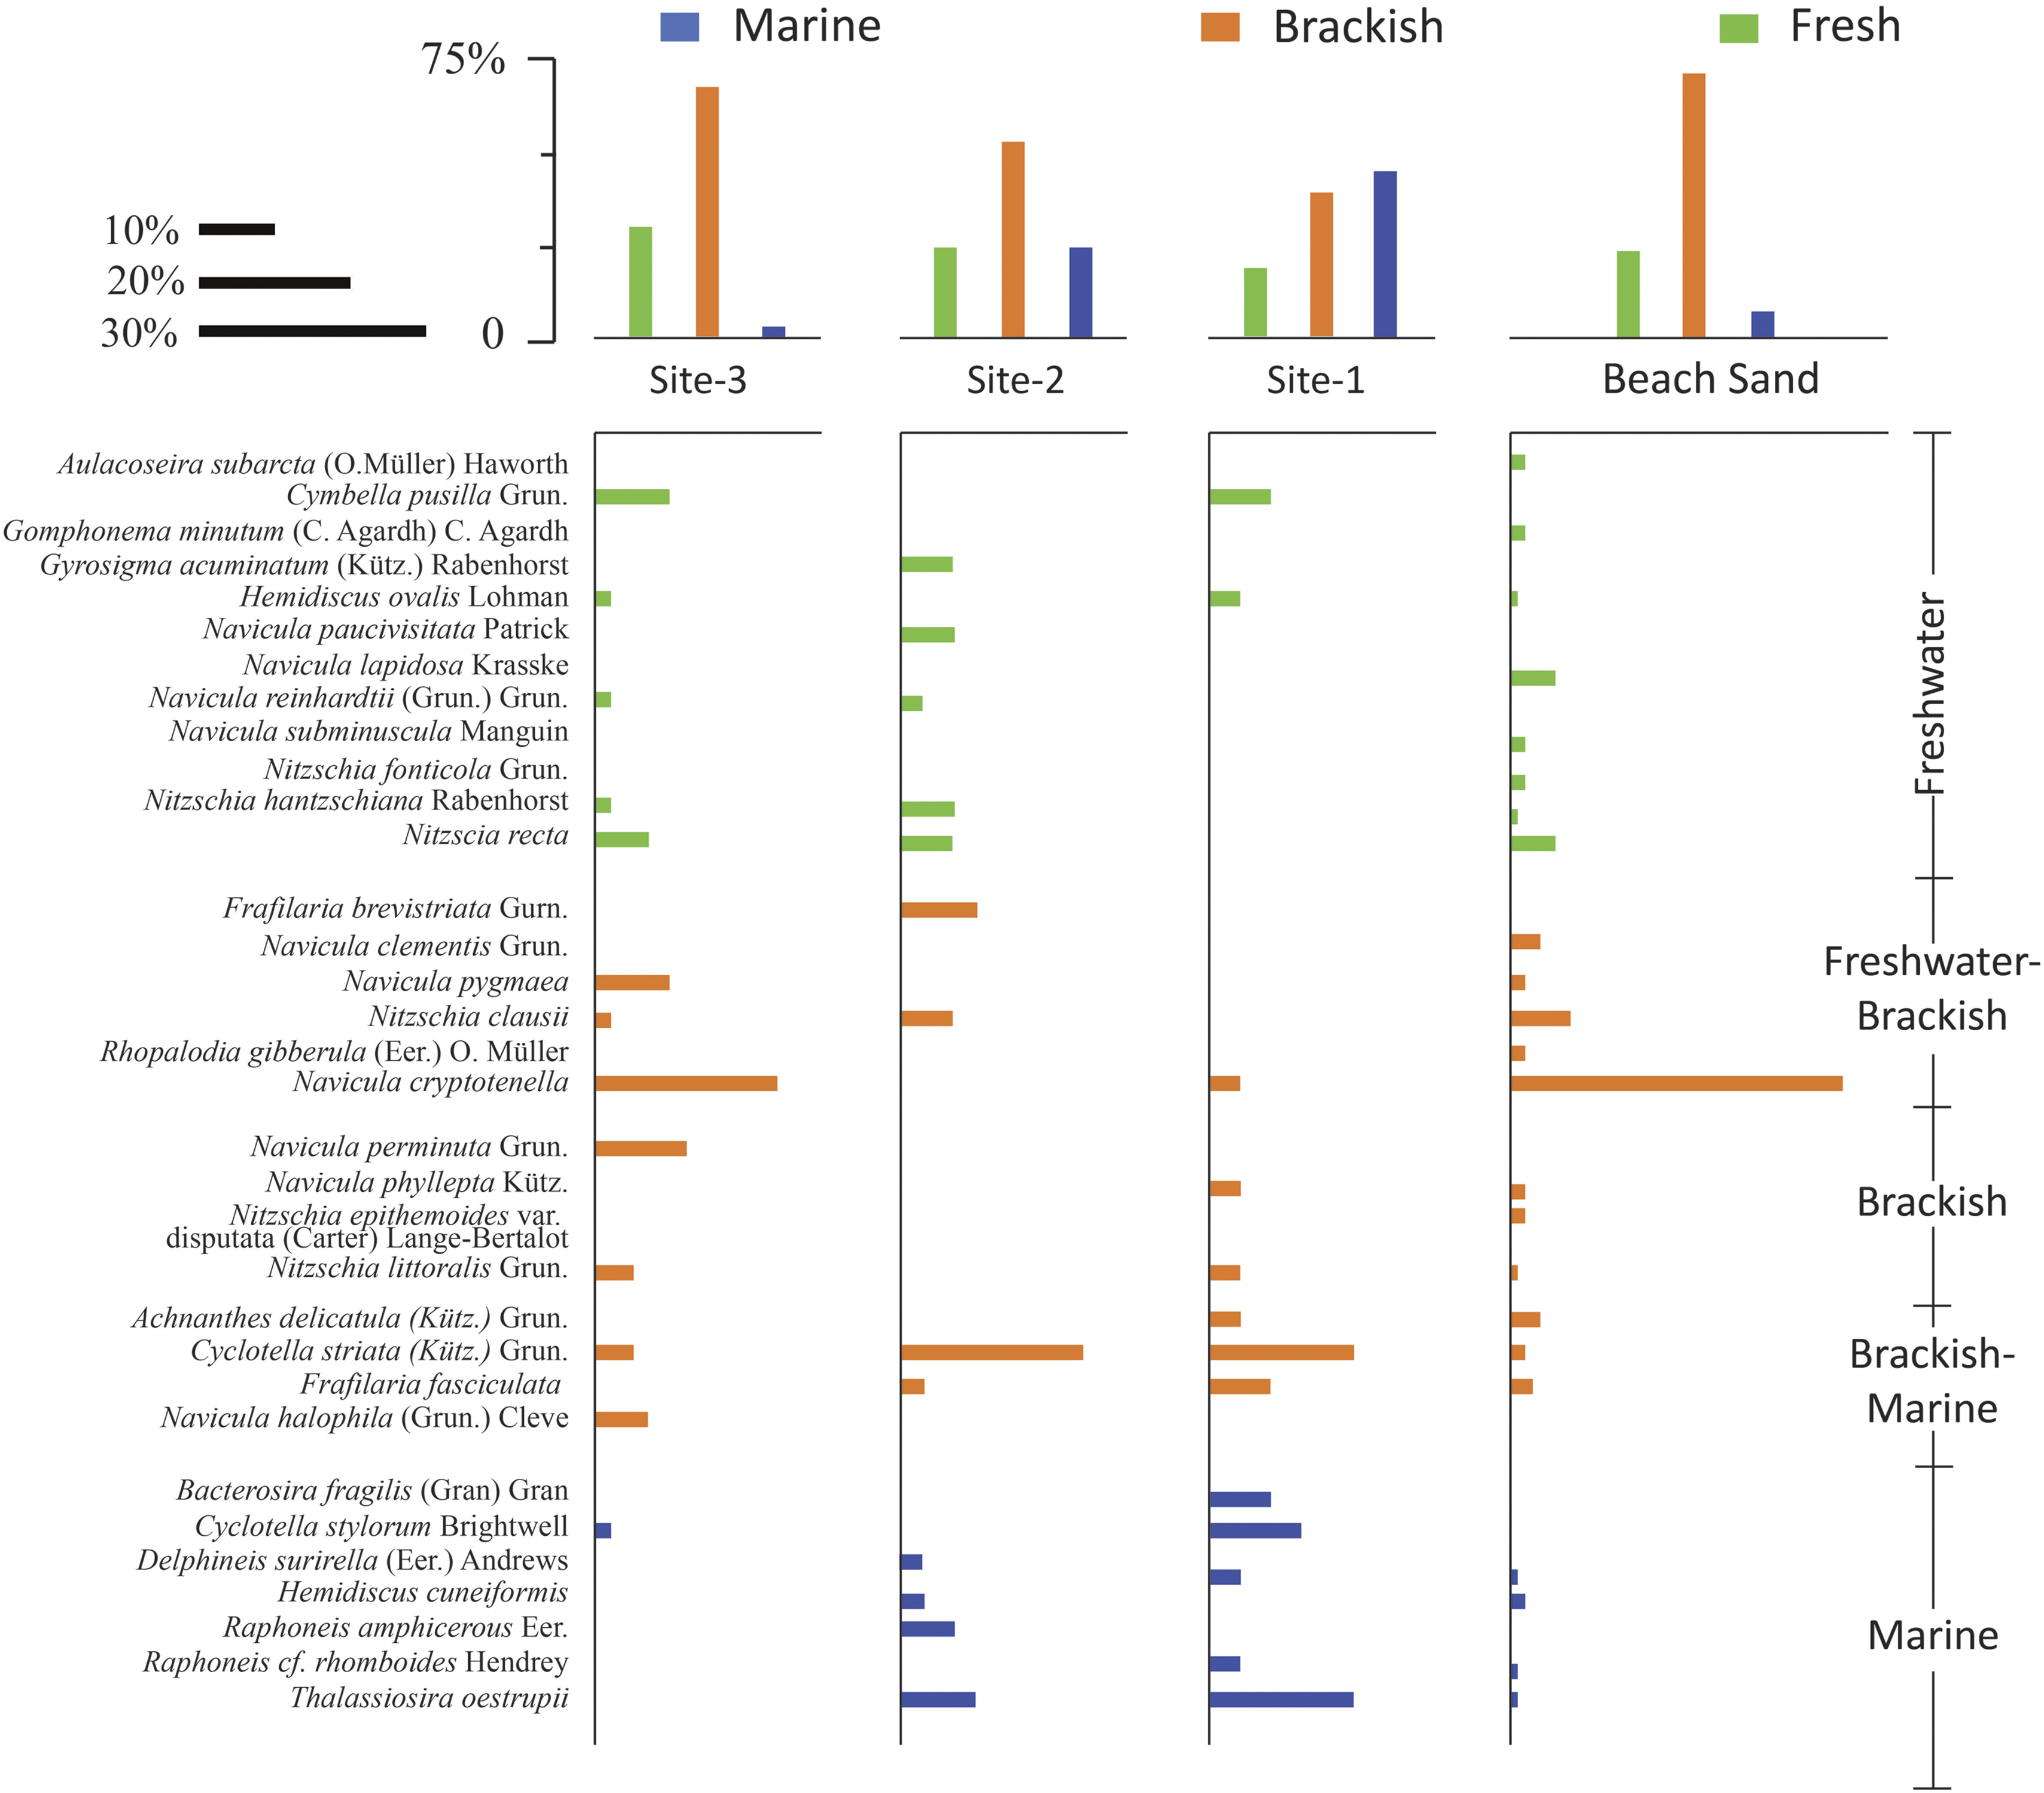
Interpretation: Facies B overlies the Facies A with planar stratification to HCS, and the depositional process is similar to tidal beaches (Daidu et al., 2013). However, HCS on open coast sandy tidal flats typically has a smaller wavelength than HCS on beaches and shelves (Yang et al., 2005). The landward extent of storm overwash deposits commonly ranges from 200 to 400 m from the shoreline with reported a maximum of 1600 m during the extreme storm wave events (Morton et al., 2007; Soria et al., 2017). Tides could have deposited the sand grain, but most of the sands were produced by oscillatory flows, either alone or combined with unidirectional flows. Continuous waves form beaches (Bird, 1960; Curray et al., 1969; Tanner, 1995) and combined wind and wave energy enhances the process that causes coastal erosion (Figure 2). In contrast, waves generated by a tropical cyclone can erode materials from foreshore to shoreface (beached, dune, etc.), and deposit them in more inland low energy depositional settings such as backshore, tidal march, swamp, lake, and above the spring tidal limit (e.g., Buynevich et al., 2004; Das et al., 2013; Donnelly et al., 2004; Hesp, 2006; Morton and Sallenger, 2003; Williams and Flanagan, 2009). Sediment eroded from the coastal beaches was the probable source of sand in storm overwash deposits. Anisotropic HCS is an indicator of fair-weather conditions, as well as physical mechanisms of tides or waves that combine with sufficient energy of an extreme wave event, such as cyclone, that affects the proximal and sheltered area of the coast (Basilici et al., 2012) (Figure 7). The combination of high intense precipitation, wind, and storm surge produces floods in the low-lying coastal region, and water levels reach up to 12 m above mean sea level during storm surge (Antony et al., 2014; Auerbach et al., 2015; Krien et al., 2017).
The grain size of the surficial sediment decreases inland and sorting increases, indicating that the beaches were the probable sources of sand in the Facies B (Figure 9) (Brill et al., 2016; Haque et al., 2021; Nott et al., 2013). The grain size distribution of Facies B shows a bimodal population where mud carried by the suspended and nearshore deposit of bay and sand sourced from the beaches are mixed (Figure 10). The negative shift TOC and TOC/TN, in conjunction with positive excursions in δ13C values, indicate the marine influence of severe storm events (Das et al., 2013; Lambert et al., 2008) (Figure 8). The TOC (%) and TOC/TN values gradually increase and δ13C values decrease in the upper parts of the facies indicating post-depositional changes due to the growth of plants and the contribution of organic matter from C3 plants from the mangrove forest as well as post-depositional growth of couch grass (δ13C values of C3 plant range between −28.33‰ and −25.26‰) (Figures 1(c) and 2).
The diatom assemblages of the surficial sediments show relative abundance of marine–brackish diatoms in the seaward samples (Site-1), gradually changing to freshwater–brackish dominated in the samples collected from 120 m (Site-2) and 225 m (Site-3) inland (Figure 11). The landward decrease of marine–brackish diatoms indicates the presence of freshwater sources during deposition of the sediment. Heavy precipitation during the storm would have flooded the adjacent river and its tributaries that carry suspended mud and freshwater diatoms toward the coast. The grain size and diatom assemblages indicate that land-derived sources were likely incorporated with storm deposits during deposition. The depositional characteristics and landward extension of sandy sediment indicate that the tropical cyclones SIDR of 2007 (Category 4 on the Saffir–Simpson scale) and Bulbul of 2019 that affected this coast were likely responsible for the overwash deposits of Facies B (Haque and Jahan, 2016; Krien et al., 2017; NAWG, 2019). The upstream freshwater mixes with seawater, creating low sea surface salinity near the coast (Behara and Vinayachandran, 2016; Benshila et al., 2014; Felton et al., 2014; Vinayachandran et al., 2002). As a result, the beach sediments contain relatively greater amount of freshwater–brackish diatoms.
V Discussion
The most remarkable outcome is the enormous change in the coastline because of the firm erosion and sedimentation impacts. Comparison of data from satellite images and cores provides new insights into, and a more thorough understanding of the morphology and stratigraphic development of the southwestern coast of the GBM delta. The trend of rising sea level along the area (Figure 3(d); CCC, 2016) and limited sediment supply from upstream (Islam and Gnauck, 2009; Rahman et al., 2018) likely caused the morphological changes observed in the area (Figure 5). Figure 12 shows the influence of sea-level rise, coastal erosion, and depositional processes on the study area. The lower part of the succession (Facies A) was deposited under marine conditions where tides and waves play an important role in transportation and reworking of sediments. The storm overwash deposits (Facies B) overlie Facies A. The coastline dynamics, sedimentary facies, geochemical proxies, and diatom assemblages provide understanding of the complex evolution of deposits and morphological change within the study area.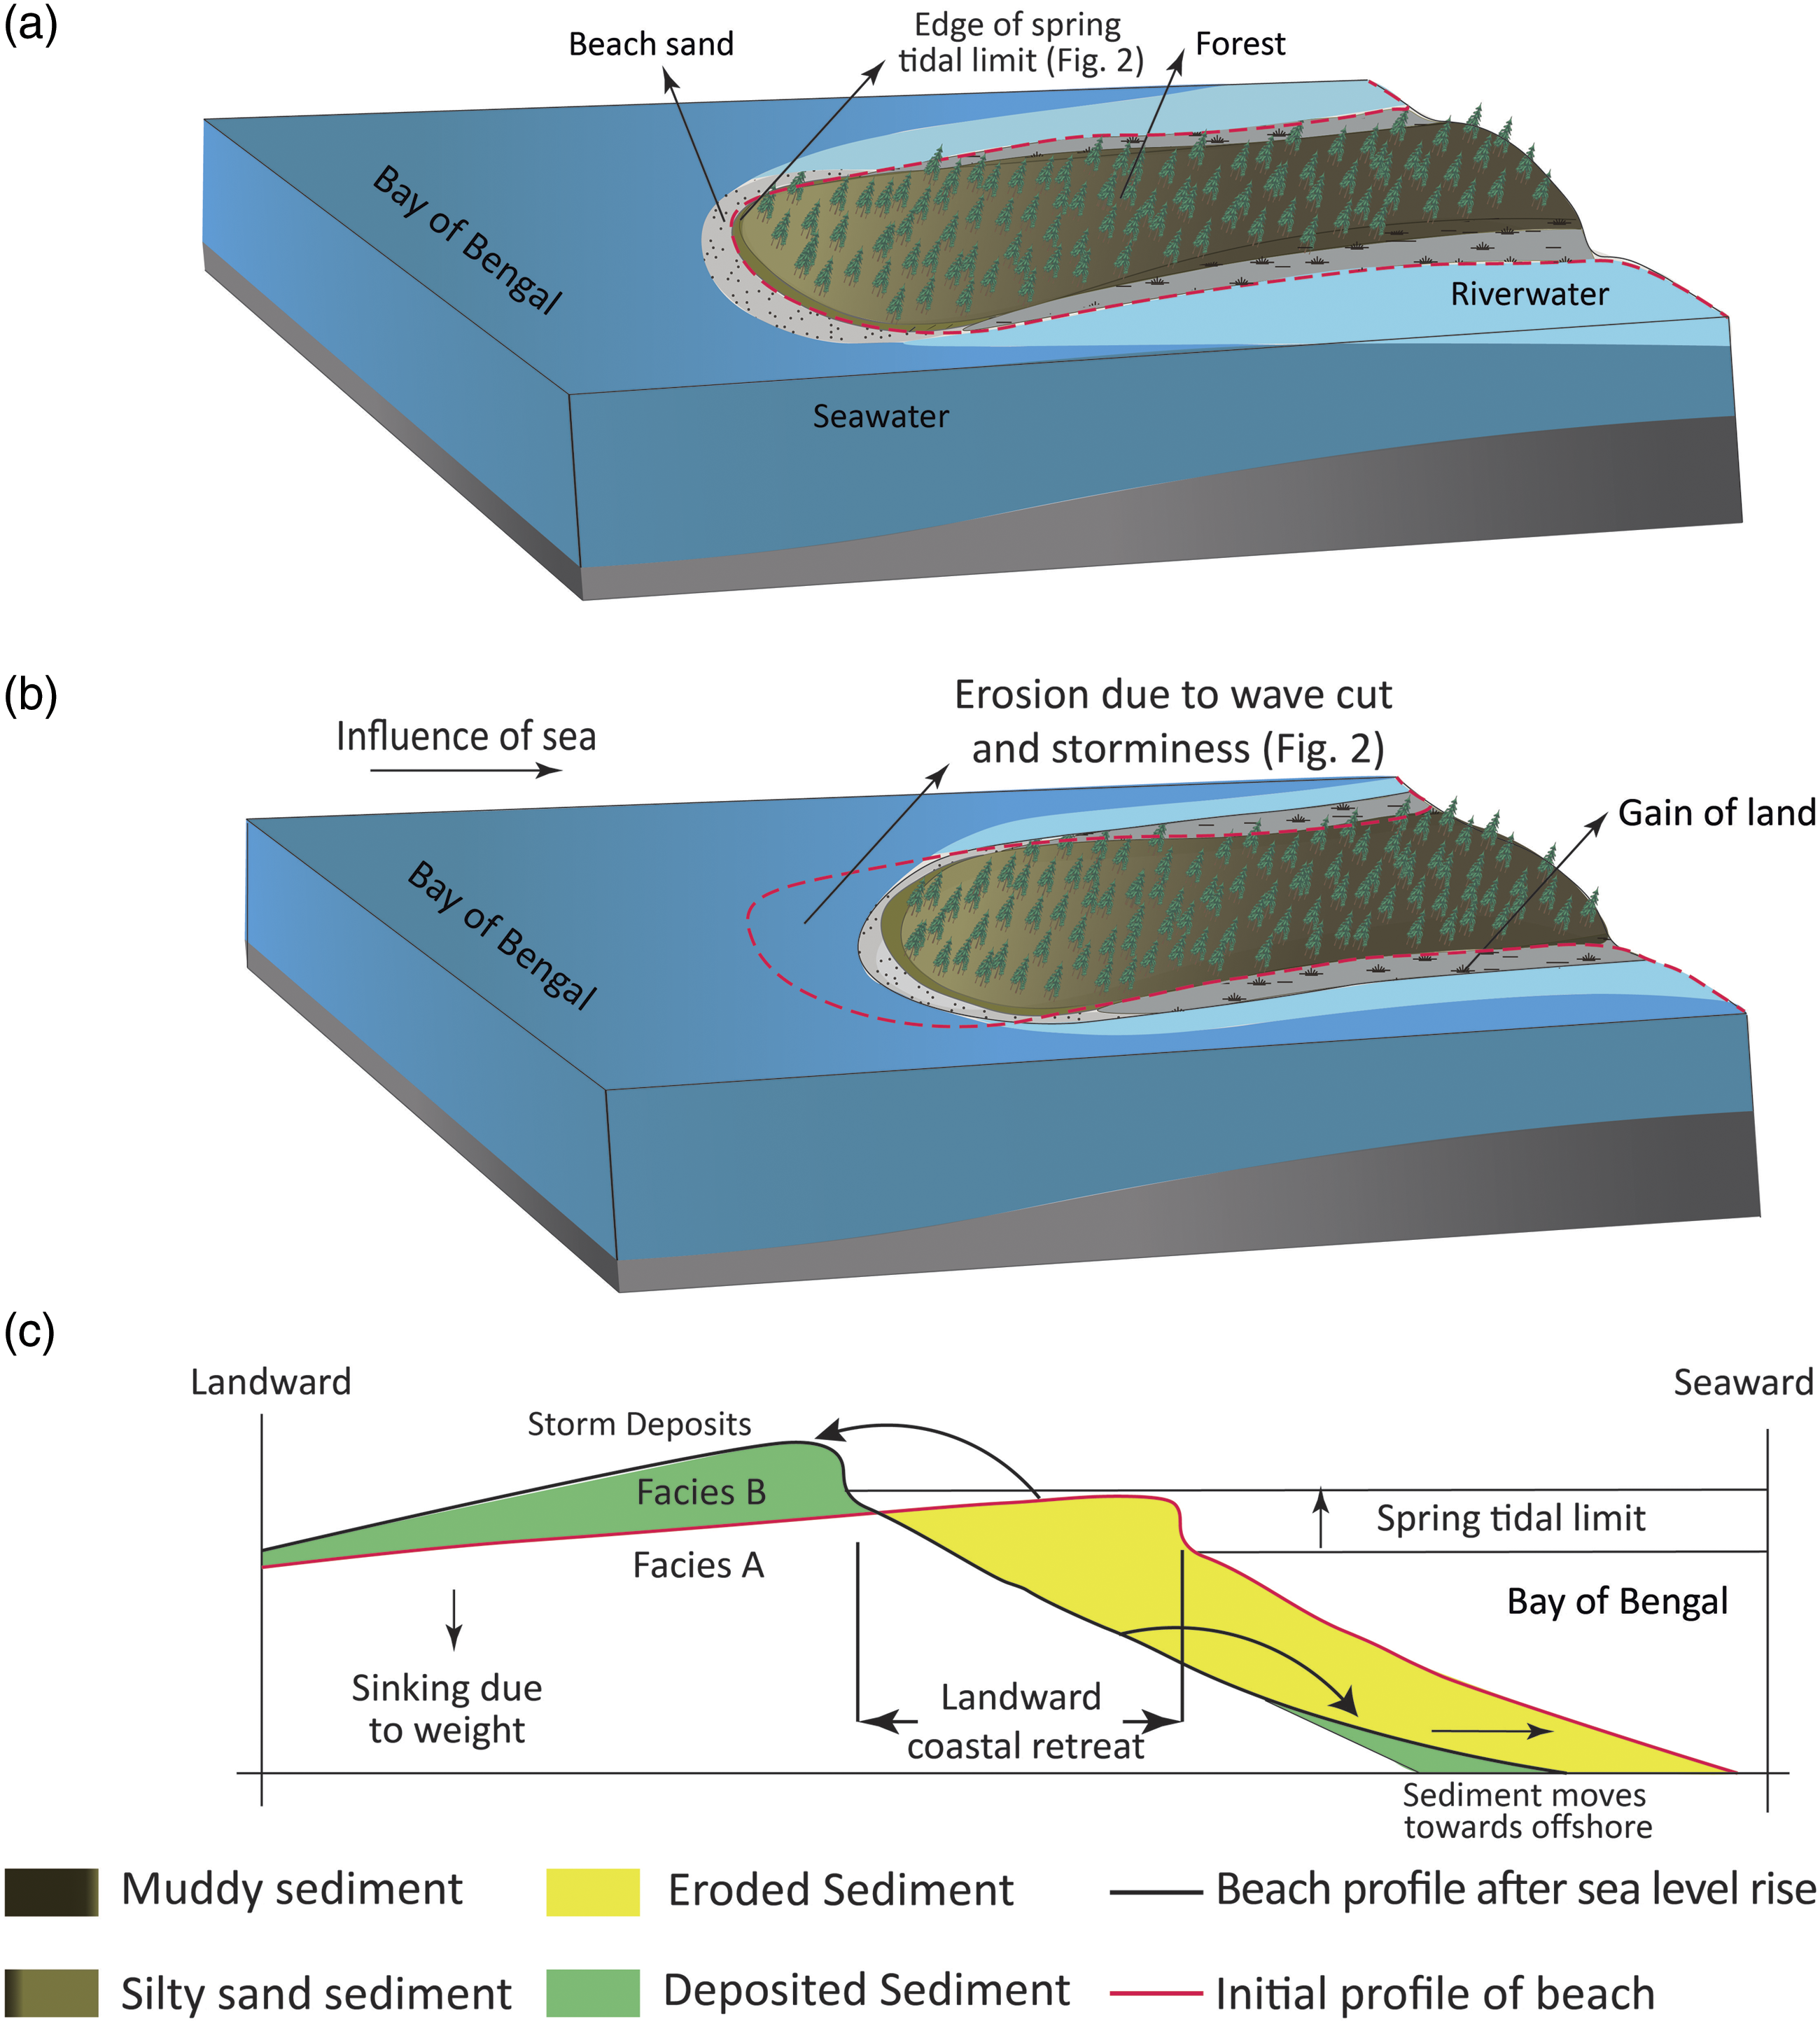
The GBM delta coastal area comprises two physiographic units—the tidally active southwestern GBM Delta, that is covered by Sundarbans mangrove forest, and the central delta basin of GBM estuary (Islam and Gnauck, 2008) (Figure 1(a)). The change of delta morphology depends on the balance between sediment added and removed from the coastal system. The morphological change of a delta system is controlled by the rate of relative sea-level rise (R), rate of sediment input from river (Q), grain size (M), and marine processes for sediment transport (D). The coastal dynamics depend on the accommodation and sediment supply ratio (R·D: Q·M) and the system is balanced if the ratio is 1. If the increased amounts of sediment (Q) are delivered to the river mouth, it can overcome the effect of rising sea level (R·D < Q·M), and the delta becomes a constructional landform (Swift and Thorne, 1991). This condition also introduces more terrestrial organic matter from upstream to the deposits (Milliman and Farnsworth, 2013). The delta lobe was constructive during the period 1977−1989 (E–A ratio is 0.29), but the ratio ranges to 2.90–4.77 during the last 30 years and the coast loses landmass (Figure 5; Table 3). Bhargava et al. (2021) reported that the E–A ratio was 2.20 in the Sundarbans mangrove forest area from 1984 to 2018, which corresponds with our study.
Rahman et al. (2018) reported that the sediment load of the GBM delta system is declining at a rate of 4 × 10⁶−10 × 106 ton/year and sediment discharge is now 50% less (500×106 ton/year) than the earlier estimate (Goodbred and Kuehl, 1999; Milliman and Meade, 1983; Milliman and Syvitski, 1992). The contribution of sediment from the Ganges River system was significantly reduced following the construction by the Indian Government in 1975 of the “Farakka” barrage to divert Ganges main streamflow. The barrage has caused a gradual decrease in flow of the Ganges River over the past 45 years (Mirza, 1998; Pethick, 2012; Shaha and Cho, 2016; Winterwerp and Giardino, 2012). The river flow over the study area is linked to the mainstream of the Ganges mainstream through the Gorai River tributaries. The Gorai River water discharge was significantly decreased from 3338 m3/sec in 1962 to 500 m3/sec in 2003 and the tributaries of the southwestern delta are not significantly connected well to carry upstream sediment (Allison and Kepple, 2001; Islam and Gnauck, 2009; Wilson and Goodbred Jr, 2015). If the sediment is directed from the adjacent river, the modern sedimentation rate probably remained constant or decreased from river to ocean. However, comparatively higher sediment accumulation rate in the lower delta plain area indicates that sediment was mainly discharged through the GBM estuary, transported, and deposited under the influences of the tides, waves, and storm surges (Allison and Kepple, 2001; Haque and Hoyanagi, 2021; Wilson and Goodbred Jr, 2015) (Figure 1).
Facies A was deposited in a marine-influenced environment along the river of the Haringhata coast (Figure 12). The sediment that is transported and deposited as modern deposits of Facies A is initially sourced from the river mouth, being dispersed onto the offshore and stored on seasonal as well as annual timescales. Wave and tidal current subsequently resuspended the stored sediment and deposited onshore (Barua 1990; Rogers et al., 2013; Stanley and Hait 2000). Such sedimentaries and environments are also observed in modern deposits along the Rupsa–Pasur river in the southwestern lower delta plain area (Haque and Hoyanagi, 2021). Planar to cross-stratified Facies B of the storm overwash deposits overlies the Facies A with sharp contacts. Core analyses (Figure 8) and lateral variation of grain size of surficial sediments (Figure 9) show normal grading as well as landward fining and thinning trends. These characters are typical of modern overwash deposits (e.g., Hawkes and Horton, 2012; Horton et al., 2009; Morton et al., 2007; Nott et al., 2013; Shigeno and Nanayama, 2016; Soria et al., 2017; Switzer and Jones, 2008; Williams and Flanagan, 2009). Presence of multiple layers/parallel laminae in storm deposits have also been observed widely (e.g., Brill et al., 2016; Phantuwongraj et al., 2013; Shigeno and Nanayama, 2016; Soria et al., 2017; Switzer and Jones, 2008). The mean grain size for suspended river sediment is approximately 6.5 φ (11.1 μm) (Datta and Subramanian, 1997) and monsoonal floods and rainfall during cyclones carries suspended mud to the ocean. In contrast, tidal advection transported suspended sediment from offshore and also reworked and eroded the nearshore and beach face sediments (Figure 2). These sediments were redeposited during storm landfalls and enhanced the sedimentation rate along the coast (Allison and Kepple, 2001).
The satellite images show that the southern coast permanently lost landmass while deposition occurred along both eastern and western flanks of Haringhata (Figures 5 and 6). The sediments carried by the GBM estuary temporally settle on the offshore and then resuspended due to tidal and coastal currents, resulting in rapid accretion along the Haringhata coast (Barua, 1990; Mikhailov and Dotsenko, 2007). The overall E–A ratio is 0.96 indicates that erosion and deposition were balanced from 1977 to 2020 (Table 3). This highlights the several factors such as tides, waves, and storm surge might be involved in the redistribution of eroded sediment to balance the sediment budget. In contrast, the area lost landmass during the last 30 years (Table 3). This loss was caused by a reduction in sediment input from upstream such that rising sea level was able to increase accommodation, and marine influences gradually increased (R·D > Q·M) (Swift and Thorne, 1991).
Waves and currents removed more sediment than was delivered to the southern coastline and it retreated throughout the period of observation (Figure 5). However, wave height and direction at 21°N, 90°E, close to the study area, did not change significantly from 1989 to 2010 (Shibly and Takewaka, 2012). Therefore, other processes may also be involved in increasing the E–A ratio at the southwestern GBM delta coast. The morphological change may be controlled by two factors: relative sea-level rise due to both local subsidence and eustatic rise, and decreasing sediment input from upstream. Subsidence is relatively rapid for the young delta sediment, ranging between 2.8 and 5.2 mm/year, and relative sea-level rise (7−8 mm/year) can significantly exceed the eustatic rise (Figure 3(d); Brown and Nicholls, 2015; CCC, 2016; Hanebuth et al., 2013; Hay et al., 2015; Karpytchev et al., 2018). The sediment supply is insufficient to balance subsidence along the southwestern coast. Both processes increase the inequality (R·D > > Q·M) leading to landward advanced of the shoreline.
The rapid sedimentation that occurred during the storm events could maintain coastal elevation in the face of sea-level rise, but these occasional events were unable to offset the physical damage caused by sea-level rise and reduced sediment supply from upstream over the last 30 years. The morphological development of the area is the result of both increased marine influence due to relative sea-level rise and decreased fluvial influence, including water flow and fluvial sediment supply caused by anthropogenic activity. The southwestern delta coast permanently lost landmass; marine influences, as well as tides, waves, and storm surges, redistributed the eroded sediments which progressively thickened toward land (Figure 12). The outcome of this study will contribute to understanding the influences on deposition and erosion at the river mouth. Factors such as upstream morphology, surface runoff, hydrology, and anthropogenic activities including increasing urbanization and land use may induce changes to coastal morphology and sedimentation. These factors must be incorporated into further research providing a clearer view of the impact of climate change on this region.
VI Conclusions
The effect of sea-level rise and fluvial sediment supply on the southwestern GBM delta development have been interpreted by integrating satellite images and core analyses. Satellite image analysis shows that the southern coastline underwent permanent land loss, while the western and eastern coastline advanced seaward. Parallel to wavy laminated bluish gray Facies A was deposited in an intertidal to supratidal coastal environment. Geochemical proxies imply that marine-influenced sediments were the major contributors of organic matter in Facies A. Planner stratification to HCS silty sand of Facies B overlies the muddy Facies A. The grain size distribution of Facies B indicates two different sedimentary components. Mud was supplied by the adjacent river and from resuspended offshore sediment, and sand was reworked from the coastal beaches. The grain size distribution and diatom assemblages of Facies B suggest that storm surge inundation occurred simultaneously with river flooding due to intense precipitation during cyclones. The geological development of the delta coast is the result of the combined effects of the increased marine influence due to sea-level rise and reduction in sediment supply from upstream. Both processes act to moved accommodation landward. Coastal erosion and accretion of the southwestern GBM delta coast was also influenced by tides and storm surges which led to significant sediment redeposition.
Combining satellite images and geological core analyses provides insights into the coastal morphology and depositional processes at the Haringhata coast river mouth. Investigation of geological data extending over longer time periods and high-resolution satellite images would further expand our understanding of delta evolution, particularly in the context of climate change.
Supplemental Material
sj-pdf-1-ppg-10.1177_03091333211046189 – Supplemental Material for Coastal development in southwestern Bangladesh: understanding the interplay between storms and sea level rise
Supplemental Material, sj-pdf-1-ppg-10.1177_03091333211046189 for Coastal development in southwestern Bangladesh: understanding the interplay between storms and sea level rise by Md. Masidul Haque, Manoj K Ghosh and Koichi Hoyanagi in Progress in Physical Geography: Earth and Environment
Footnotes
Acknowledgements
The primary author thanks Mitsubishi Corporation International Scholarship, Japan for giving financial support during the study in Japan. We are grateful to Dr. Craig S Fulthorpe, Institute for Geophysics, the University of Texas at Austin for his valuable suggestions during editing the manuscript. We thank two anonymous reviewers for providing insightful comments and suggestions. The authors also gratefully thank Shiori Uchiyama, Hiromi Sashi, and Junichi Machida, Graduate School of Science and Technology, Shinshu University, Japan for their cordial support during diatoms and geochemical analyses.
Data availability statement
All relevant data used for the research described in this article are included in the article and its supplementary files.
Declaration of conflicting interests
The author(s) declared no potential conflicts of interest with respect to the research, authorship, and/or publication of this article.
Funding
The author(s) disclosed receipt of the following financial support for the research, authorship, and/or publication of this article: The research was partly supported by Grants-in-Aid for scientific research (no. 18K03778 for KH) from the Japan Society for the Promotion of Science (JSPS).
Supplemental Material
Supplemental material for this article is available online.
References
Supplementary Material
Please find the following supplemental material available below.
For Open Access articles published under a Creative Commons License, all supplemental material carries the same license as the article it is associated with.
For non-Open Access articles published, all supplemental material carries a non-exclusive license, and permission requests for re-use of supplemental material or any part of supplemental material shall be sent directly to the copyright owner as specified in the copyright notice associated with the article.