
Abstract
Transformative interdisciplinary methods and tools are required to address crucial water-related challenges facing societies in the current era of the Anthropocene. In a community-based study in the Limpopo basin of South Africa, physical and social science methods were brought together to run interdisciplinary workshops aimed at enhancing preparedness for possible future drought. To generate storylines for the workshops, relevant scenarios were modelled using a catchment-scale hydrological model, SHETRAN. Set up using freely available data, local knowledge, and narrative-based group interviews on past experiences of drought, the model acted as a locally-relevant tool for prompting discussions about potential future drought impacts, responses and preparedness, and to stimulate the production of community future narratives. In this paper, we discuss the elements involved in the modelling process: the building of the model through an interdisciplinary approach; setting up the model with limited data; and the translation of the model results into storylines for the workshops. We found that by using this methodology scientific grounding was given to the workshop storylines, and that the local context of the model and the engaging approach of creating narratives encouraged participant involvement in discussions about the future. The method of generating these future stories was an important process for the participants in developing their thinking about possible futures, preparedness and adaptation. In this paper we show how this alternative approach of using a hydrological model has benefits and we discuss the limitations and lessons of the approach for future interdisciplinary research.
Keywords
I Introduction
Water security and sustainability are a growing key challenge for societies in the Anthropocene (McMillan et al., 2016; Sivapalan et al., 2014). Drought, which is defined as the deficit in available water compared to the norm, is a costly environmental hazard worldwide with severe socio-economic and environmental impacts, including potential losses in agriculture, damage to natural ecosystems and social disruption (Tallaksen and Van Lanen, 2004; Wilhite and Glantz, 1985). Africa is especially impacted by drought due to its geographical position and limited adaptive capacity, exacerbated by poverty, low levels of development and high sensitivity and vulnerability (CDKN, 2014). Furthermore, climate change is expected to amplify existing stresses on water availability and agriculture and will affect public health (CDKN, 2014). Future droughts are predicted to be outside of historical ranges (IPCC, 2012), exposing people to conditions worse than those they have previously experienced. Although it is not possible to eliminate drought, its impacts can be managed through preparedness planning (Edossa et al., 2014) and resilience building. Most definitions of resilience refer to notions of rebounding, or bouncing back, from disturbances or shocks (LSE, 2012, cited in Murphy et al., 2017; Plough et al., 2013) with the definition of social resilience being used here as ‘the ability of groups or communities to cope with external stresses and disturbances as a result of social, political or environmental change’ (Adger, 2000: 347). With regard to drought as an external stress on the system in general, research is mainly focusing on seasonal forecasting and early warning to provide information that is expected to increase resilience and preparedness (e.g. Pozzi et al., 2013); however, focus for preparedness can also be on behaviour change and awareness to help build social resilience.
The aim of the interdisciplinary research project ‘CreativeDrought’ was to improve the resilience to drought of a South African community at the local scale by increasing awareness, preparedness and adaptation through forward thinking in workshops stimulated by what-if future drought situations. The research was conducted in the village of Folovhodwe in the semi-arid Limpopo basin, South Africa. Folovhodwe (population of ∼2800 people, StatsSA, 2017) is located on the Nwanedi River (catchment area of 897 km2), a tributary to the Limpopo River (Figure 1). The Limpopo region was the focus of this study because of its known vulnerability to drought and dependence on agriculture and cattle farming for livelihoods (Trambauer et al., 2015).The Limpopo basin has generally low amounts of precipitation; the majority of the basin receives less than 500 mm of rainfall per year, with approximately 95% falling during the wet season of October to April (FAO, 2004). High temperatures during the summer (November–December) occur in the basin; average daily temperatures of 40° C in summer months are not uncommon (FAO, 2004). The region has experienced severe droughts in the past, resulting in crop failure, livestock mortality, economic losses and the need for humanitarian aid (Trambauer et al., 2015).
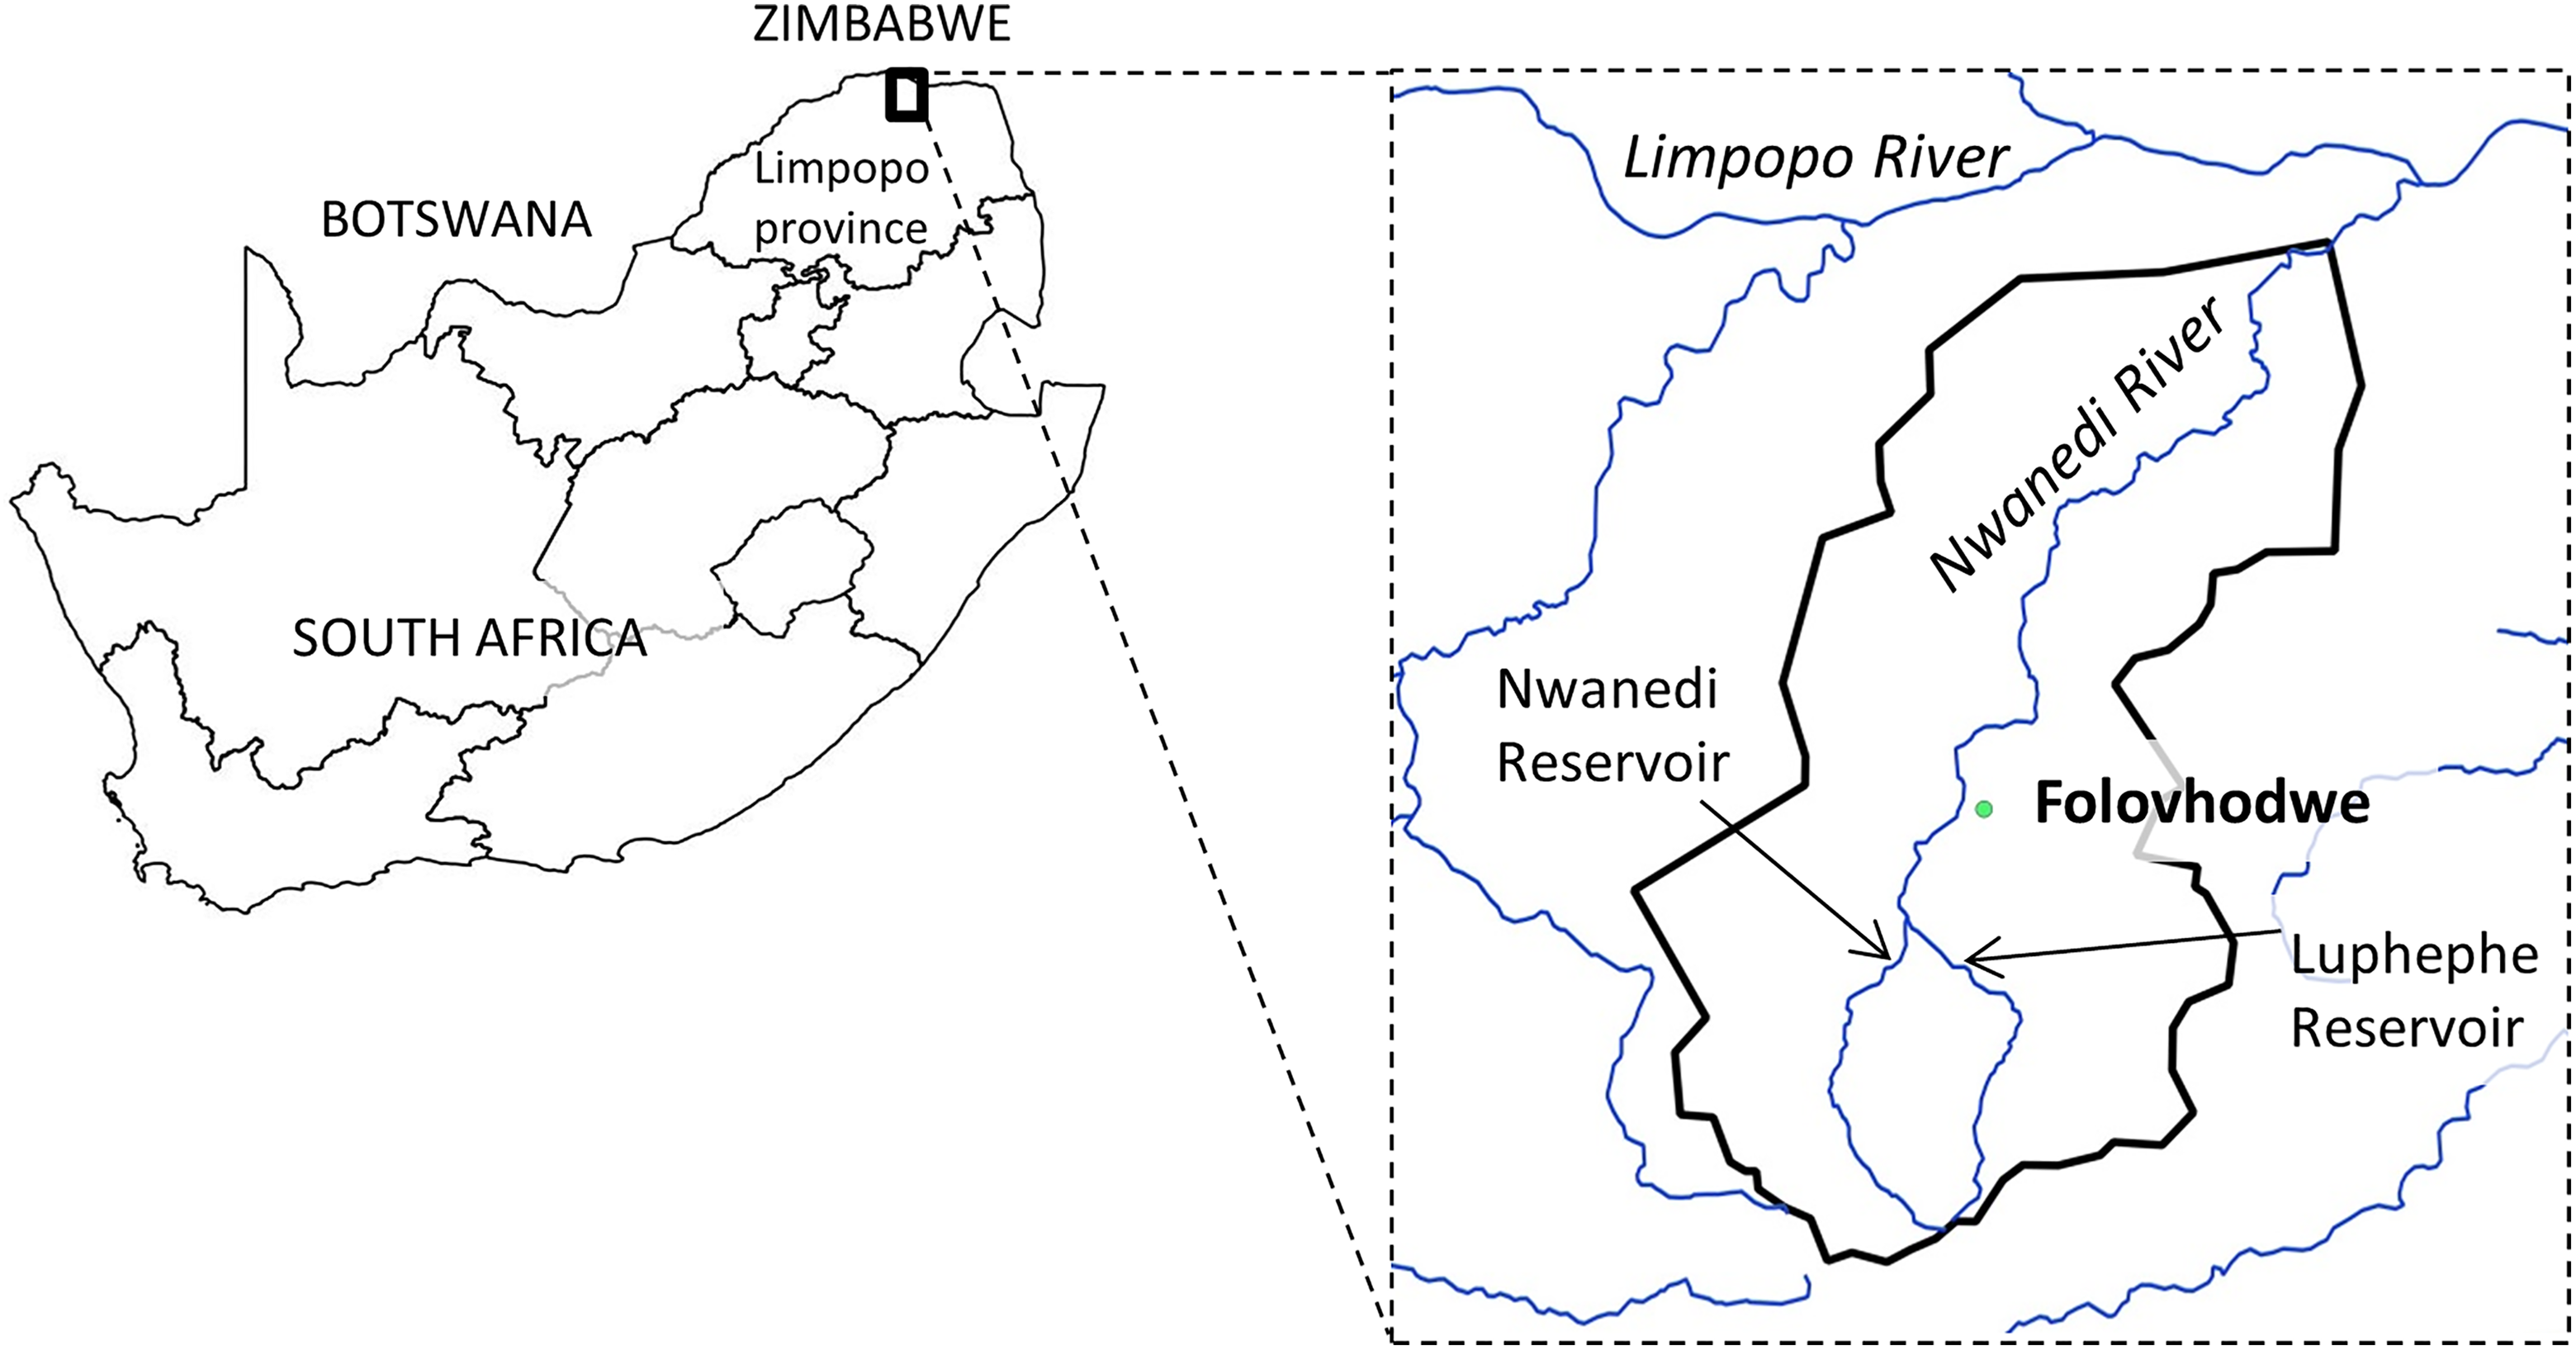
Map of the study area: Folovhodwe village within the Nwanedi catchment, Limpopo Province, South Africa.
The application of scenario modelling in participatory workshops for adaptation has been used elsewhere successfully (Etienne et al., 2011; Star et al., 2016). Rather than discussing the scenario modelling for participant engagement from the social science perspective only, or from a physical science perspective with the focus on only the model outputs, here the main emphasis of the paper is the interdisciplinary methodology developed. We consider the modelling process with a focus on the application of the model results in the community workshops. We introduce the project and its wider methodological approach of collecting and using data, before discussing the elements involved in the hydrological modelling from the input data to the communication of the modelling results in the workshops. Finally, we review the processes, limitations and future recommendations.
II Background: The CreativeDrought project outline
Using a multi-disciplinary, cross institutional and inter-cultural team of academic hydrologists and social scientists in the UK and Southern Africa, the CreativeDrought project combined hydrological modelling of hypothetical future scenarios with group narrative interviews to inform and facilitate workshops aimed at co-creating future drought narratives (Figure 2). The study involved two field visits. The first field visit gathered hydro-climatic information about the catchment and information about land use and water users as well as past experiences of drought from community members (Figure 2, top row). Past drought narratives were collected within a series of group discussions, each involving specific subgroups of the community representing different types of resource uses (e.g. livestock farmers, orchard farmers, young mothers). These followed the methodological approach of narrative interviews (Plummer, 2001; Riessman, 2007), but in small groups (3–5 people) to generate narratives of past drought events and experiences from the perspective of that community subgroup (more information about the narrative interview process can be found in the supplementary material online).
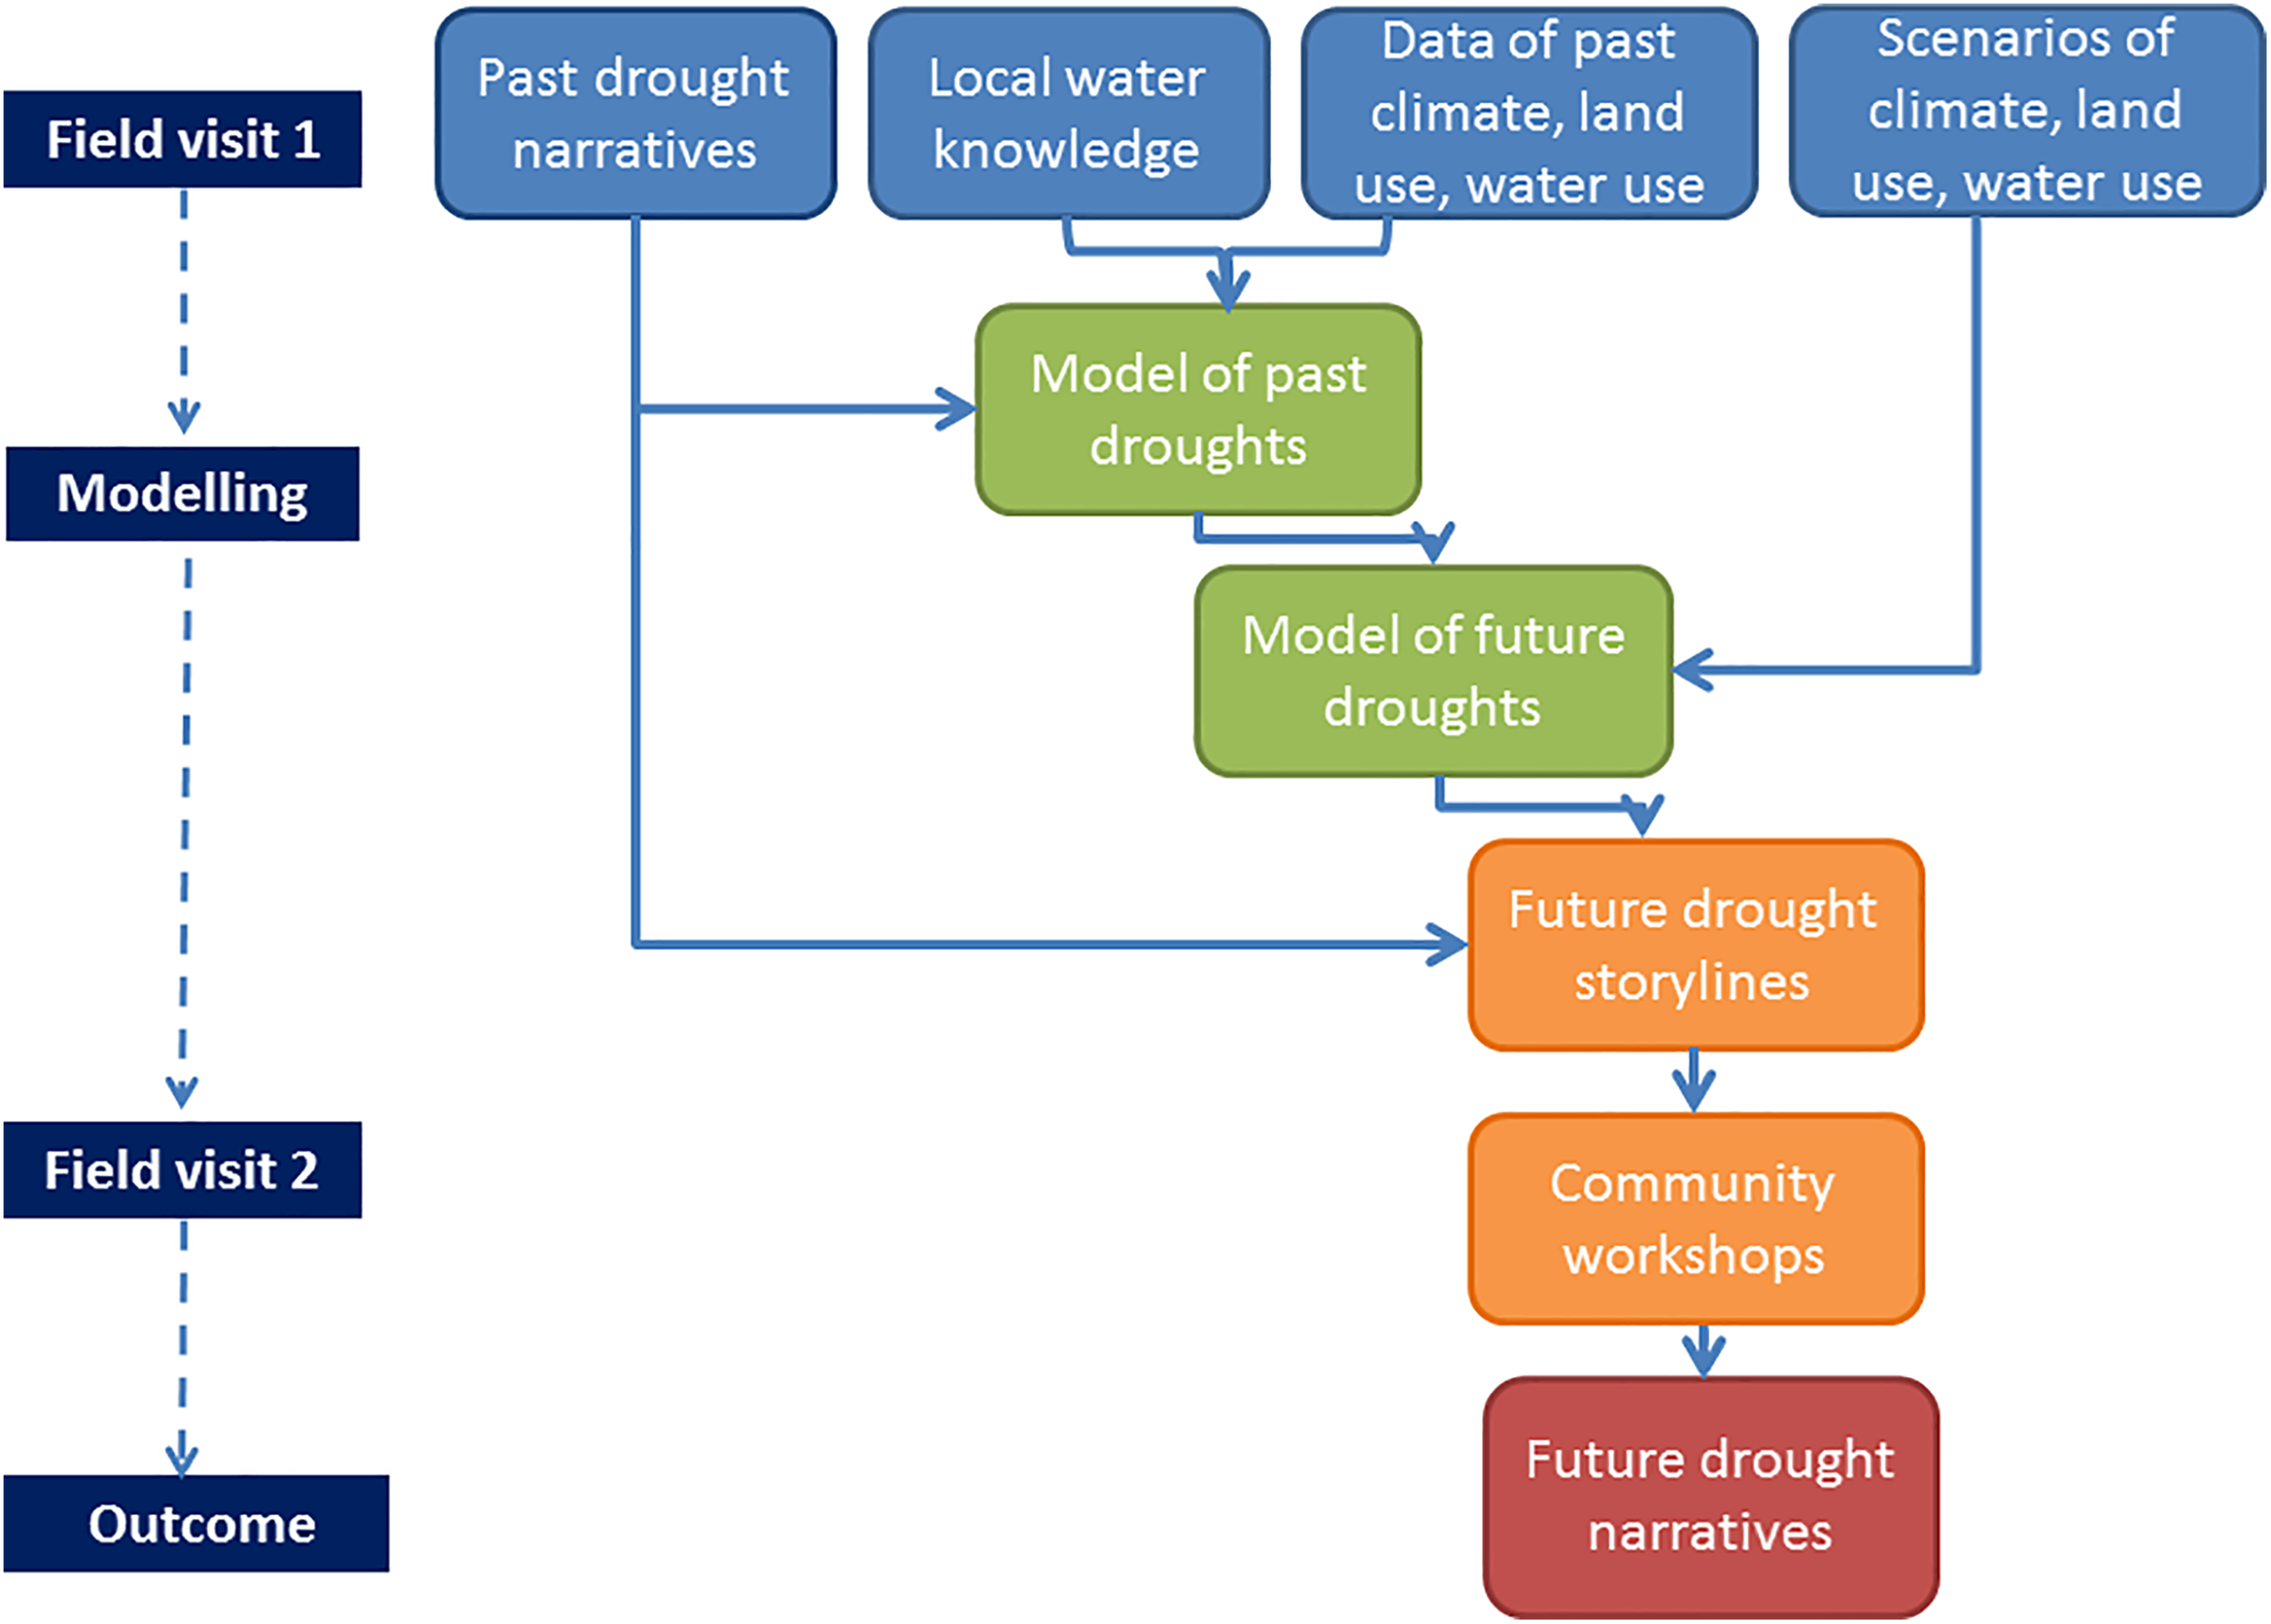
Work flow diagram for the CreativeDrought project demonstrating relationships between the different parts of the project: the hydrological modelling data inputs (blue); the modelling process (green); the generation of future drought narratives through workshops (orange); and the outcomes of future drought narratives (red).
These group narrative interviews conducted during the first field visit pointed to a lack of engagement with, and preparation for, future drought (e.g. fatalistic responses such as ‘I will be dead’ and ‘God decides’). Conceptualising and relating to the future can be difficult for individuals (Rayner et al., 2005), but narratives are known for their use in future-oriented approaches (Foran et al., 2013; Shirani et al., 2016) and scenarios based on hydrological modelling outputs can be used to provide stimuli. Scenario modelling can help characterise the future environment and allow the exploration a range of possibilities (Mallampalli et al., 2016; Rounsevell and Metzger, 2010). Therefore, the use of scenarios helps participants to explore the different ways that hypothetical future situations might occur (Foran et al., 2013), and modelling allows the exploration of these different scenarios. Consequently, workshops (in field season 2; Figure 2) were designed to help participants explore drought events outside their experienced range using hydrologically-modelled future drought scenarios and the social science technique of producing future narratives. The combination of these two methods encouraged workshop participants to engage with what-if futures, think creatively and widely about possible drought preparation and adaptation, and create their own future drought narratives (Figure 2).
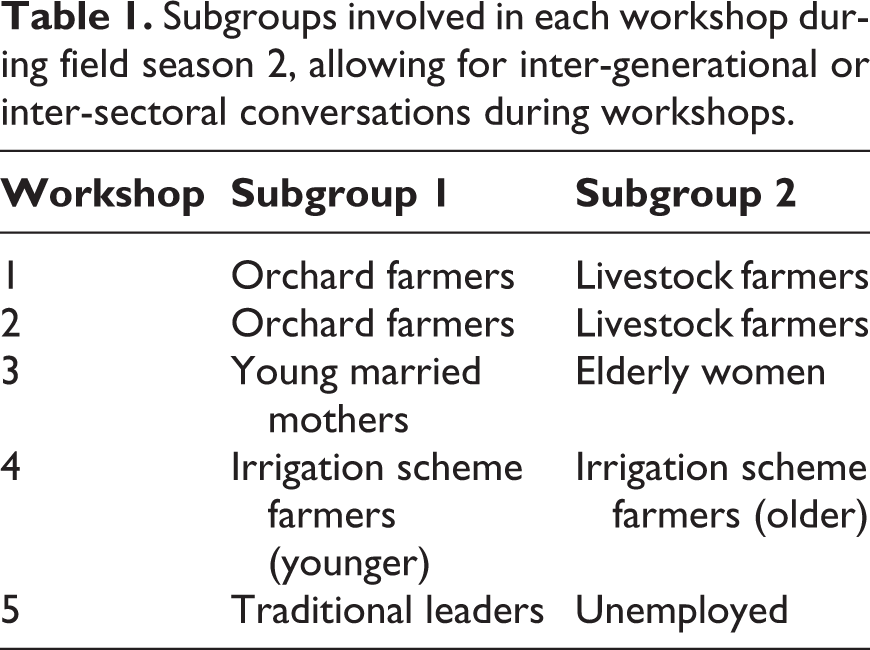
In total, five workshops were held in the community during field season 2 (Table 1). Three modelled future scenarios were co-written by the research team into short storylines describing the key hydrological conditions as a future drought event. Workshops were co-facilitated by native speaking graduate students based at the local university, University of Venda, alongside members of the UK research team. In general, each workshop involved two different community subgroups (Table 1), for example different types of farmers or different generations, allowing for inter-sectoral or inter-generational discussion and story exchanges within the two community subgroups involved, thus facilitating knowledge exchange. The outputs of the workshops were the future drought narratives generated by the participants based on the scenarios and their discussions (Figure 2), which were filmed for both internal (community) and external (local and regional water management) use. Besides these direct outputs, the method of generating these stories was an important process for the participants in developing their thinking about possible futures, preparedness and adaptation.
Subgroups involved in each workshop during field season 2, allowing for inter-generational or inter-sectoral conversations during workshops.
III Methodological approach
In a series of small group workshops, participants from Folovhodwe were invited to explore a modelled what-if future drought event outside of their lived experience, encouraging them to consider the potential impacts and the actions for preparedness that might be possible by exchanging ideas and stories. For these workshops, we needed to generate information about present day drought events and what-if future drought events.
Due to a lack of hydro-climatic observations for the catchment, and the need to represent the future, we used a hydrological model to produce simulated discharge, groundwater levels and soil moisture time series for drought analysis for the present day (1979–2013) and for hypothetical future scenarios for the community of Folovhodwe (e.g. mid-21st century). Both the past drought narratives and local knowledge gathered on field work were used to build and check the hydrological model (Figure 2). The model was run for a baseline scenario which was qualitatively compared to the past drought narratives, and then run for a number of hypothetical future scenarios. The developed scenarios were designed based on discussions with people in the community. It has been argued that for public and participant engagement and buy-in, local information, knowledge and input to the framing of scenarios, parallel to scientific inputs, are critical (Sheppard et al., 2011).
IV Hydrological modelling
Hydrological models can have many different purposes. Although the vast majority of models are used for generating predictions and forecasts, they can also be used as tools in teaching (e.g. AghaKouchak and Habib, 2010), research (Seibert, 1999), exploration (e.g. what-if scenarios, Swart et al., 2004) and to increase understanding of catchment, hydrological and anthropogenic processes (e.g. socio-hydrological model development; see review by Blair and Buytaert, 2016). Models can also be used to simulate information in both space and time when measurements are limited, not available or not possible (e.g. regarding the future).
The limited existing modelling studies for the Limpopo region have different purposes or foci from this project. For example, Smits et al. (2005) explored different modelling scenarios for water resource management in the Sand River, South Africa; however, their modelling outputs were not designed to engage with communities. Trambauer et al. (2014) used a distributed model to look at the space-time variability of historical drought across the basin; however, this study did not focus on the future. Another study in the Limpopo basin, Querner et al. (2014), modelled the effect of irrigation and fertilisation management operations on crop yields, but with a model built on a regional, rather than local, scale.
4.1 Model choice
In contrast to the existing modelling work, we needed a model to simulate variables at the catchment scale, represent groundwater-surface water interactions well, include human abstractions and storage of water, and incorporate local information on how water resources were governed and used. This therefore called for a more detailed, local scale model built for application and communication within the workshops. We used the physically-based distributed hydrological SHETRAN model to achieve this. The SHETRAN model used local observation data and local knowledge where possible, specifically looking at drought events within the Nwanedi basin and how they might be felt by different subgroups in the community. Its innovation lies in its specific local context and the use of an interdisciplinary approach, with physical and social sciences working together to shape the purpose, output and application of the model.
The SHETRAN model enabled us to simulate river flow, groundwater and reservoir levels, and soil moisture in the catchment for current baseline and future scenarios. Others have used SHETRAN for simulating water flow, sediment transfer and contamination transport in river basins (e.g. Ewen et al., 2000; Bathurst et al., 2011; Op de Hipt et al., 2017), and SHETRAN has demonstrated good capabilities for representing integrated groundwater–surface water systems (Parkin et al., 2007) and the inclusion of human activities.
4.2 Setting up the model with limited data
Knowledge gathered during the first field season increased our understanding of the catchment and its water users and water sources (Figure 2, blue). Controlling factors used in the model were topography, precipitation, potential evapotranspiration, geology, soil type, land use and main water abstractions. Due to the remote location of the study area, there was limited hydro-climatic data available at either the appropriate spatial (basin level) or temporal resolution (daily or monthly observation data), and with a long enough monitored time period (> 30 years). Local meteorological input data on the regional or local level were only available for a short period of time (2006–2017) with significant amounts of missing data. Therefore, a more complete dataset of the Climate Forecast System Reanalysis (CFSR) was favoured. The use of reanalyses as proxies for observed precipitation and temperature data is particularly useful for regions with few weather stations (Essou et al., 2016). The online CFSR global database provided daily data without missing data for the time period 1979–2013 (also used by Fuka et al., 2013). Variables used here as input data were precipitation (mm) and potential evapotranspiration (mm), which was estimated from temperature (°C) using the Thornthwaite equation.
The Nwanedi catchment contains two dams in the upper part of the catchment: Luphephe Dam (14.0 million m3 total capacity) and Nwanedi Dam (5.1 million m3 total capacity). Hydrological data for the catchment consisted of observed water levels in the dam for a very short time period, January–April 2016 (provided by the Department of Water and Sanitation) and dam releases for a longer time period (1992–2016) (Department of Water and Sanitation, 2016). The two reservoirs were included in the model set-up because their presence significantly affects the natural relationship between precipitation and discharge. River discharge downstream of the reservoirs mostly depends on the reservoir releases. This was achieved by firstly establishing a relationship between measured water levels in both reservoirs and the corresponding measured dam release. In the SHETRAN model, a dam was added by increasing the elevation of a river channel corresponding to the dam height. This caused the water to build up behind the dam as a reservoir. Water was then transferred from the reservoirs to the downstream rivers in the model depending on the measured relationship. Overtopping of both dams sometimes occurs in actuality, and this also occurred in the model.
The main water abstractions occurring in the catchment were also included in the SHETRAN model. First, water is continually diverted from the Nwanedi River spillway below the dams upstream of Folovhodwe into an irrigation canal which travels through the village to the irrigation scheme. In the model, water was abstracted from the river discharge at the spillway and brought back into the system across the irrigation scheme area downstream of the centre of Folovhodwe. Secondly, a borehole with a depth of 99 m was placed in its known physical location, withdrawing groundwater for the village with a pumping rate of 4.5 l/s for 12 hours a day. This local information was obtained during field season 1.
For the topography data we used a Digital Elevation Model (500 m resolution) extracted from the Shuttle Radar Topography Mission 90 m grid resolution dataset. Other spatial data used relating to catchment characteristics included basic geology, soil type and land use. The geology of the catchment involves two types on the top layer, Archean intrusive and metamorphic terranes and Jurassic volcanic rocks, and soils are mainly sandy and loamy. Due to limited detailed information, we used a spatial uniform distribution across the catchment and considered the aquifer down to 100 m. With regard to land use, land under the irrigation scheme (∼100 hectares) was included in the model, information also gathered during the first field visit.
4.3 Model outputs
Outputs of the SHETRAN model consisted of simulated time series for discharge, groundwater levels and soil moisture at specified locations in the catchment for the baseline present day (1979–2013) and for different hypothetical scenarios (see section VI, Scenario Modelling). Our experience in the field and through interactions with the community elders enabled us to select the most relevant locations for extracting model results to report to the participants in the workshops (e.g. the river levels and conditions in the middle of Folovhodwe community, the soil moisture on the irrigation scheme). Modelled soil moisture values were taken from the top 10 cm.
4.4 Drought analysis
A drought analysis was conducted on the input precipitation time series and the model outputs of discharge and soil moisture to identify the key drought periods in the simulated data (Figure 3). Scientifically, drought is defined as a deficit in available water in a variable (e.g. precipitation, streamflow, soil moisture) compared to the normal conditions (Tallaksen and Van Lanen, 2004; Wilhite and Glantz, 1985). ‘Normal’ is based on an average over a certain period (usually more than 30 years) or a defined level (e.g. certain soil moisture levels). The type of drought investigated depends on which variable is used: precipitation data represents meteorological droughts; soil moisture analysis represents agricultural drought; and streamflow or groundwater levels represent hydrological droughts.
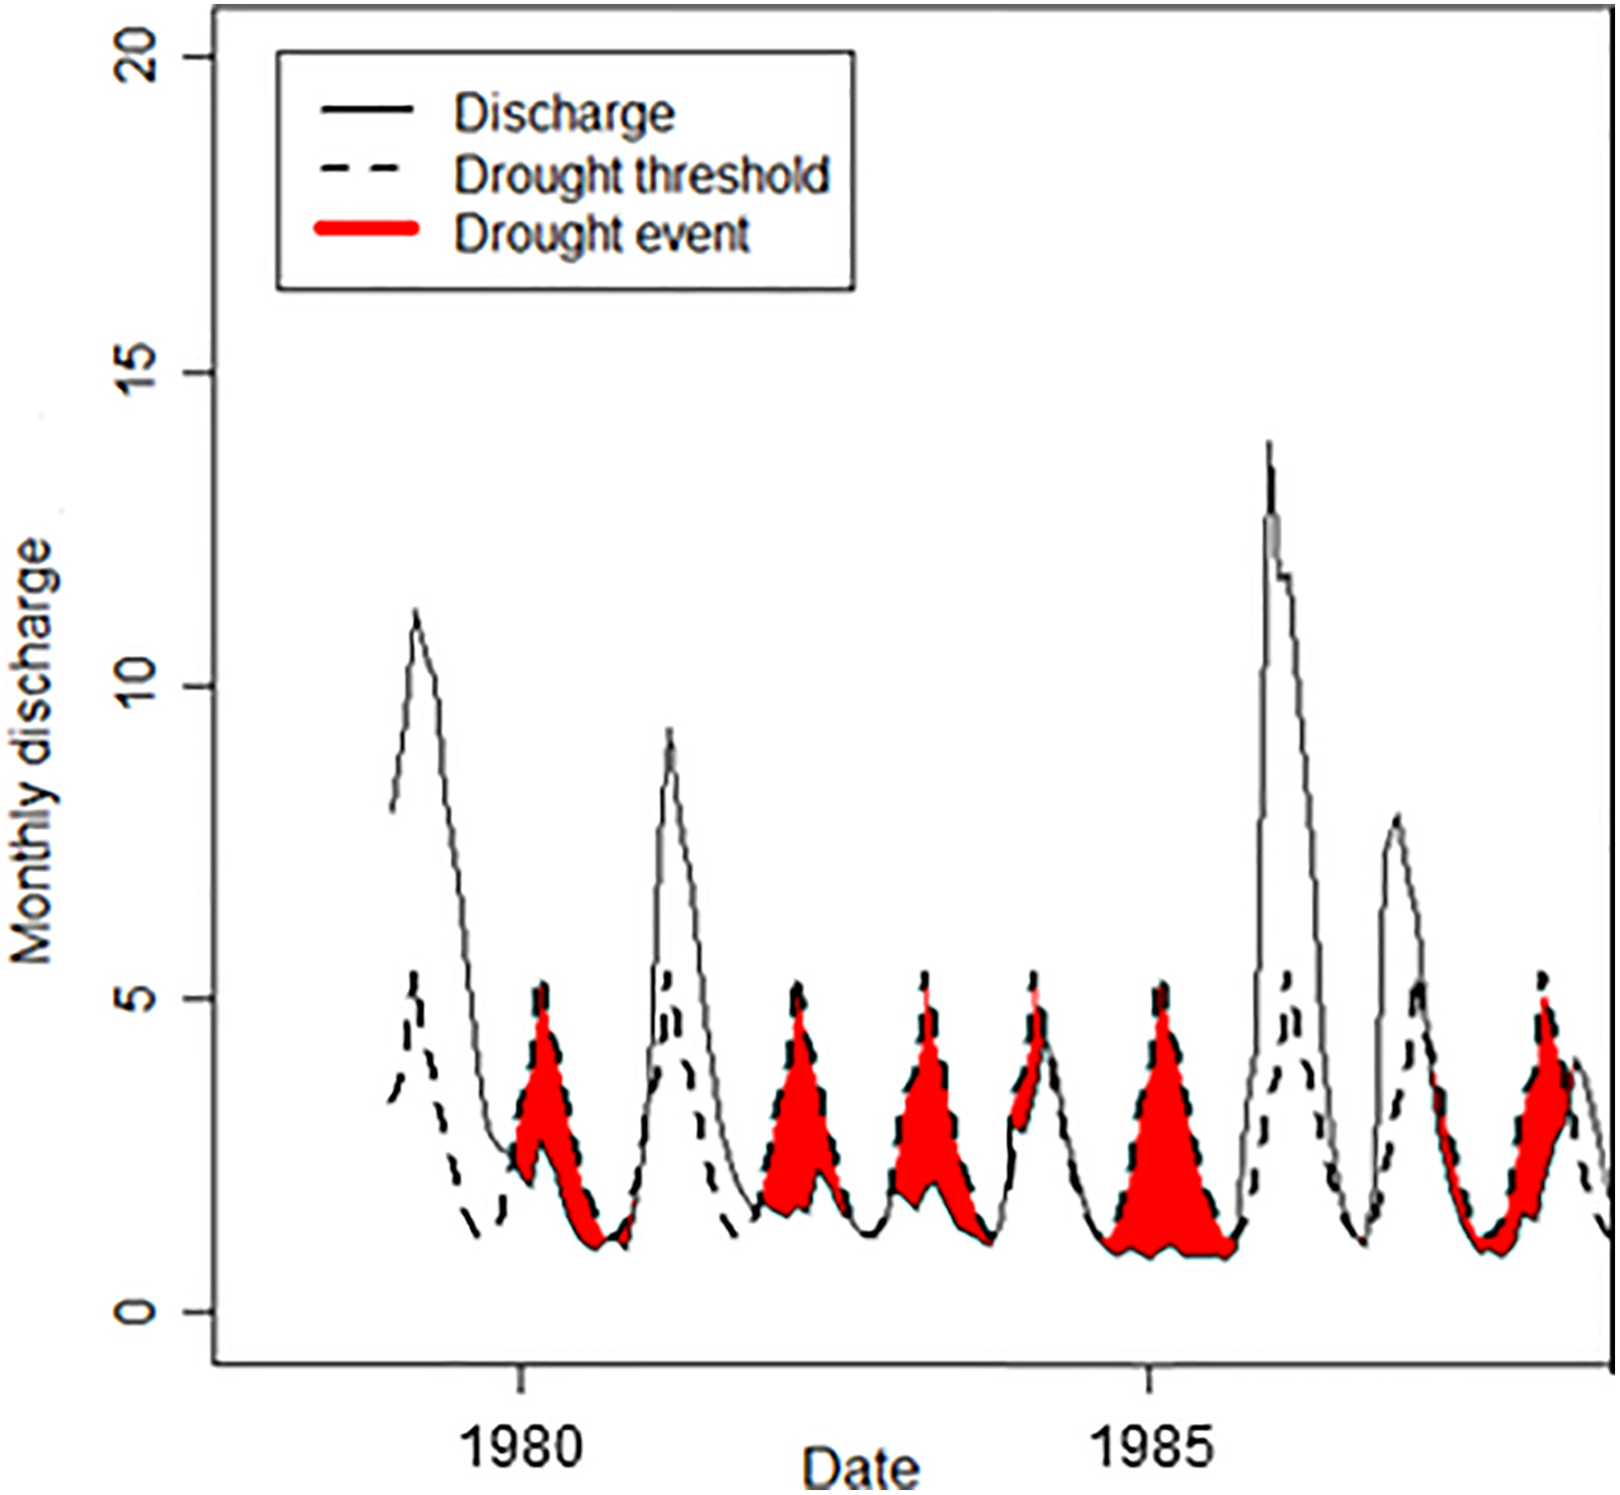
Conceptual diagram illustrating the identification of hydrological drought events using the threshold level method; periods when discharge goes below the expected lowest 20% discharge threshold (threshold indicated with a black dotted line).
The drought analysis method used in this study was the threshold level method (Yevjevich, 1967: e.g. Figure 3). The threshold used for meteorological and hydrological drought analysis was a variable threshold at the 80th percentile, a commonly used threshold (Fleig et al., 2006; Hisdal and Tallaksen, 2000; Heudorfer and Stahl, 2016; Van Loon, 2015). The threshold of the baseline run was used as the baseline for all drought analysis on the scenario runs to quantify the difference between the scenario and the baseline. For the soil moisture drought analysis, a fixed threshold was used with a value chosen to represent crop wilting point, a standard soil moisture tension of –1500 kPa (Hillel, 1998).
Descriptive statistics on identified drought events were extracted, including start dates, end dates, duration (in months), and drought deficit volumes. Deficit characteristics indicate the severity of drought events (Van Loon et al., 2014). These characteristics could then be analysed across the whole time period (34 years) to generate summary statistics such as average drought frequencies (how often drought occurs), durations and deficit volumes. The total number of months in drought for the whole time period was also established to show the overall exposure to drought conditions. Details about chosen individual modelled drought events were used in the workshops.
4.5 Model uncertainty, calibration and validation
Hydrological models are typically calibrated by comparing the model output against observation data, and are then usually validated by evaluating their performance against additional observation data, often including uncertainties. Hydrological models are prone to uncertainty for several reasons, including measurement errors in the input data such as rainfall observations and potential evapotranspiration estimates (Wagener et al., 2004) and measurement errors in the discharge data used for calibration and validation. Model calibration and uncertainty analysis are useful when using models for predictions or forecasts (Melsen, 2017); yet, when using a model as a conceptual tool, less accurate numerical agreement between simulations and observations are required (Seibert, 1999) and a calibration period is not as important.
In this project, we did not seek to make accurate predictions, but to provide what-if future scenarios and use the model results in the workshops. Therefore, the model was used to perform sensitivity tests through changing the parameters and input data relevant for future drought risk, rather than providing a set of plausible scenarios. Furthermore, data availability and quality were poor, which made calibration and validation impossible. Consequently, we ended up with what-if future scenarios produced by the model, which are realistic but with large uncertainties.
Issues with confidence in the observation data in the region were demonstrated by Boroto (2001), who found that where South Africa and Zimbabwe each had a stream gauging station at Beit Bridge on the Limpopo River, discrepancies as large as 60% between the two nations’ discharge observation records were discovered for selected periods. Due to the aforementioned input data issues, simulated discharge was not calibrated on measurements due to lack of observation data, and poor data availability and quality when available (e.g. missing data of significantly long time periods). Simulated dam discharges were compared to the limited measured dam information available. The model’s baseline run was also validated qualitatively against past drought narratives. The results of this validation exercise are shown in the next section.
V Baseline run
River discharge, soil moisture and groundwater levels were simulated for the past ∼30 years as a baseline run (1979–2013) using the input data to represent ‘present day’. The baseline run time series was subjected to drought analysis for the identification of drought events (Figure 4). This allowed a qualitative comparison between the simulated drought events and the information gathered through field season 1 narrative group interviews about previously experienced drought events and impacts in the community (Table 2). The baseline run identified these drought events well with most of the main drought events represented in the model (Table 2). In some cases, drought events were identified in the model but not mentioned in the group narrative interviews, but this could have been because not all experienced drought events were discussed. In the narrative interviews we asked participants to describe a past drought experience in the village in order to gain more in-depth understanding of these experiences rather than requesting participants to list all of the past drought events in their memories (see supplementary material online). Discrepancies may also be present because certain drought events may not have been felt by the different subgroups. In some cases, drought events were mentioned in the narrative interviews which were not visible in the model. This could be due to the perceived impacts of the drought lasting longer than the suggested physical drought itself (e.g. a drought event being mentioned by some groups in 1985, which could be the continued impacts from the 1981–83 drought; Table 2).
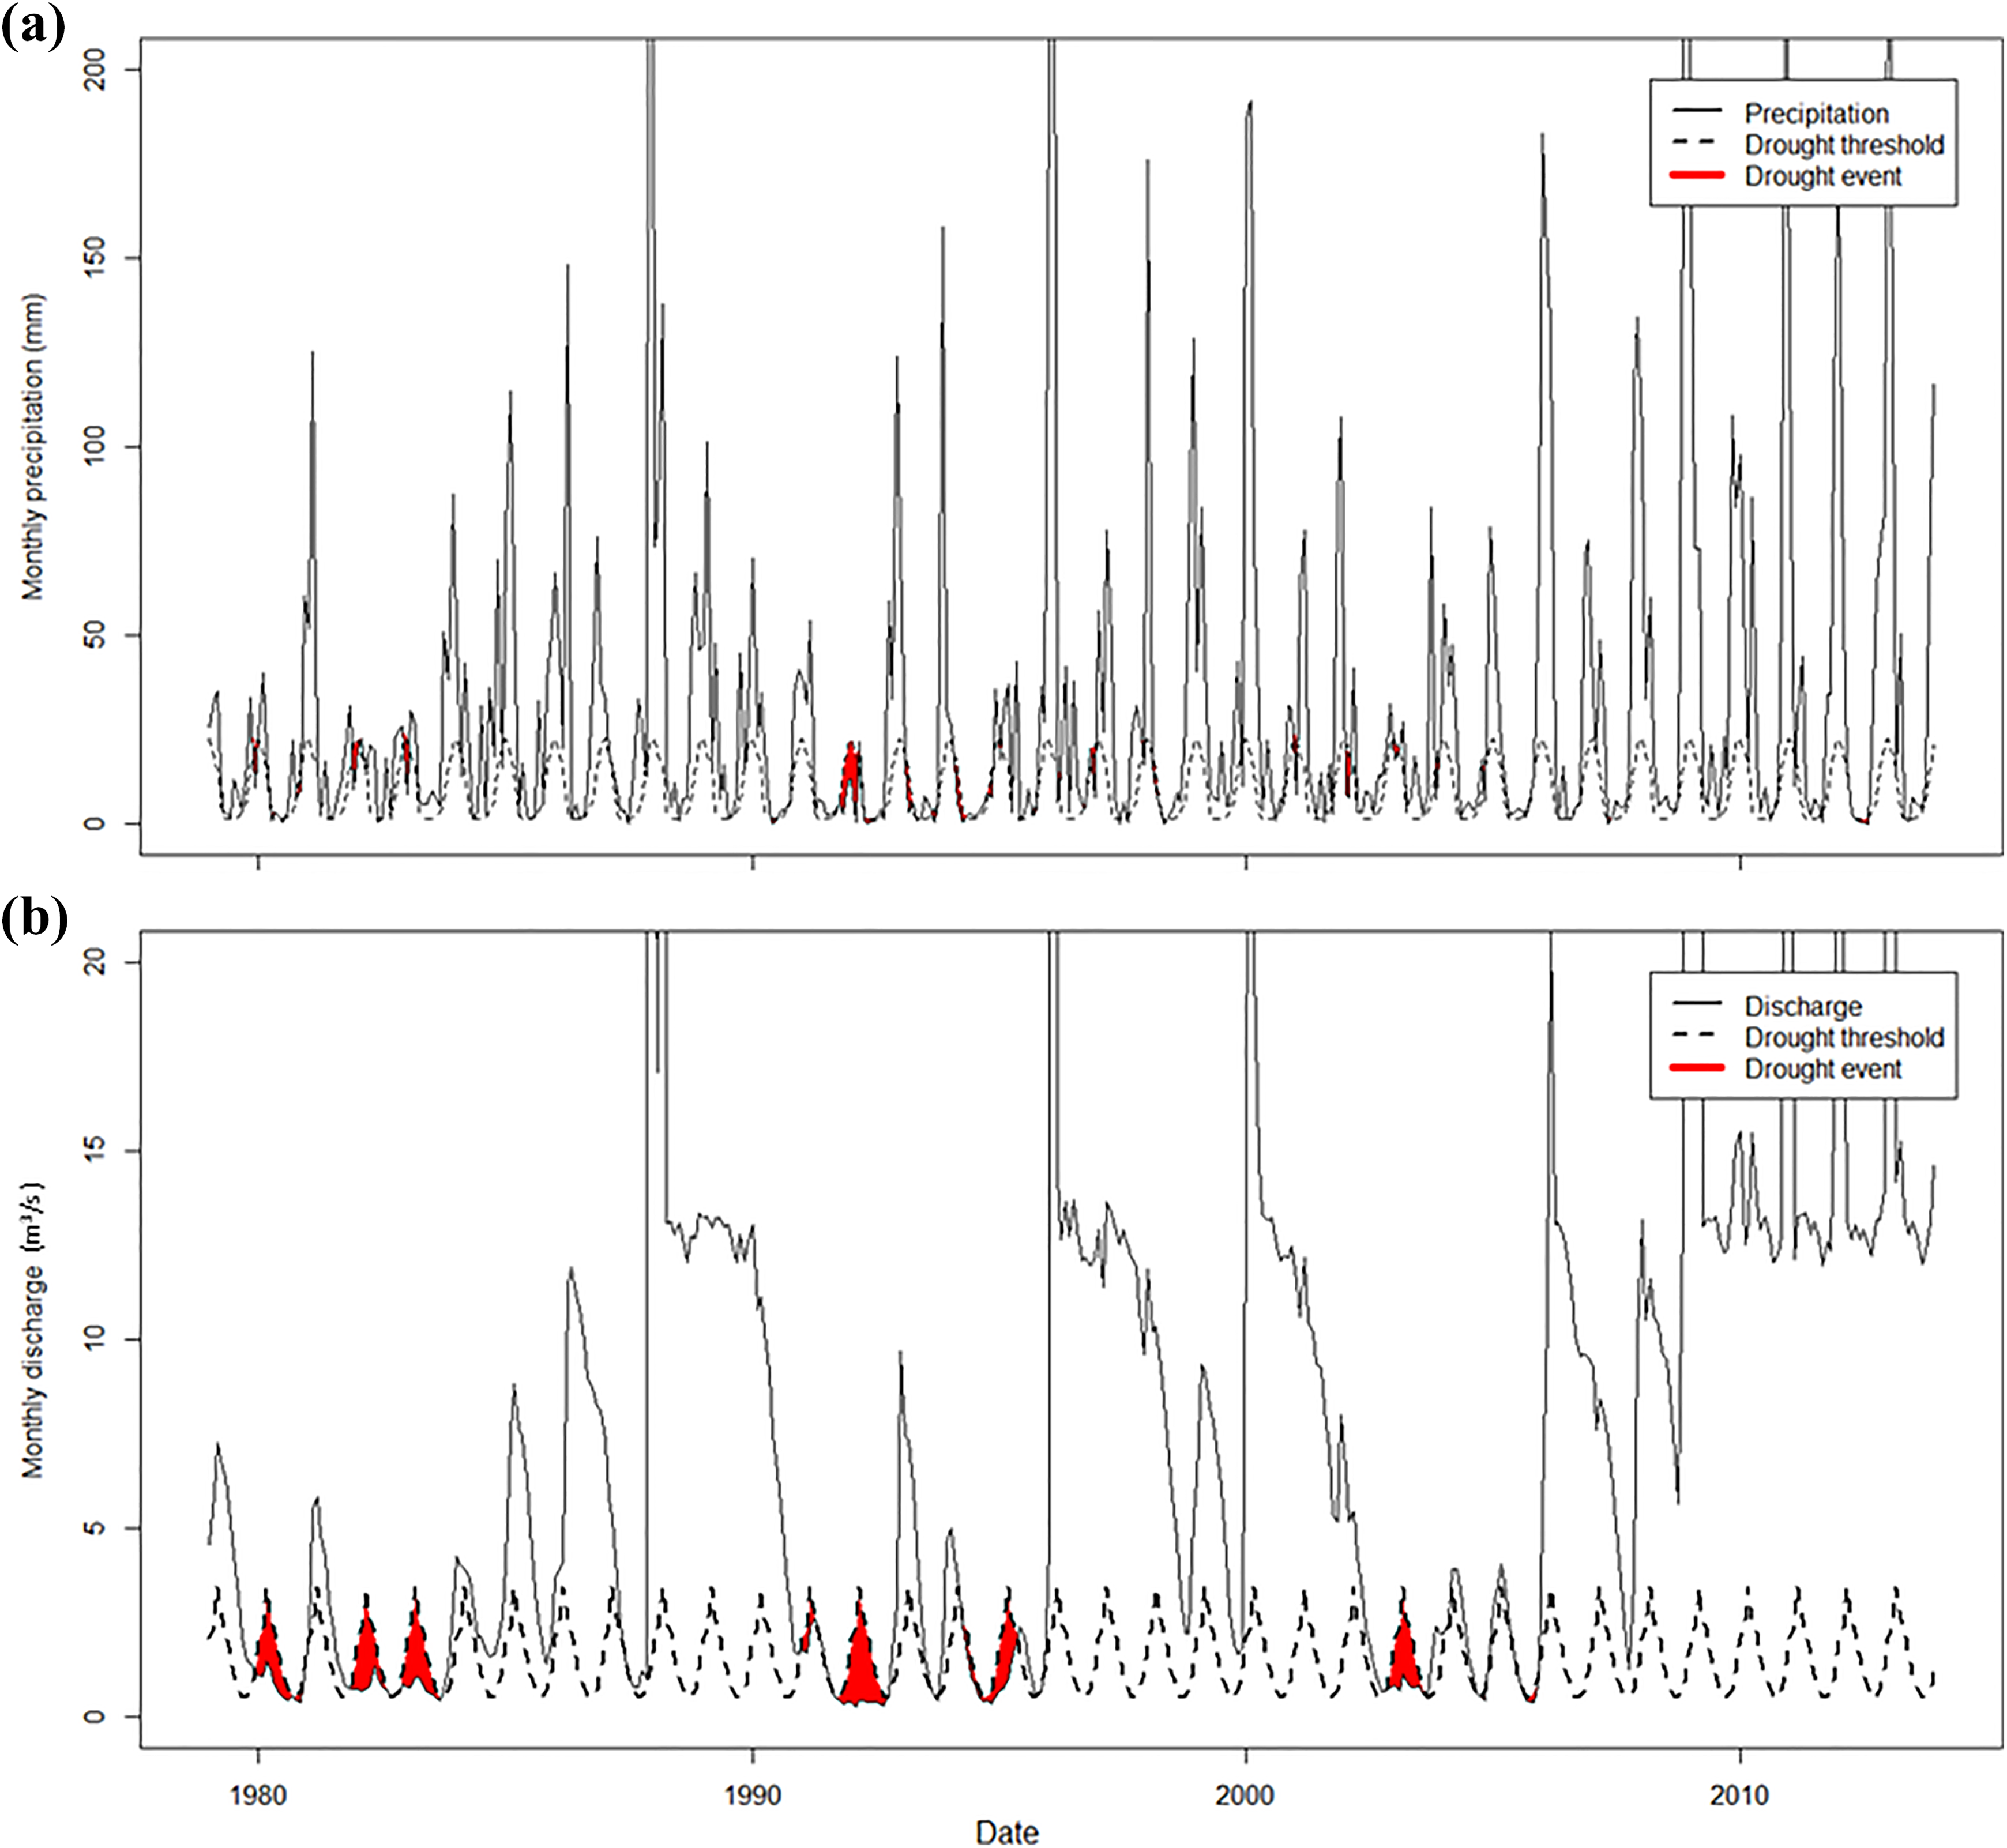
Baseline run drought events identified: a) meteorological droughts and b) hydrological droughts in the river located at the centre of the community.
The main drought events identified for the time period 1979–2013 by the hydrological model in the baseline run (top three rows) and the main drought events mentioned by community members in the first field season group narrative interviews.
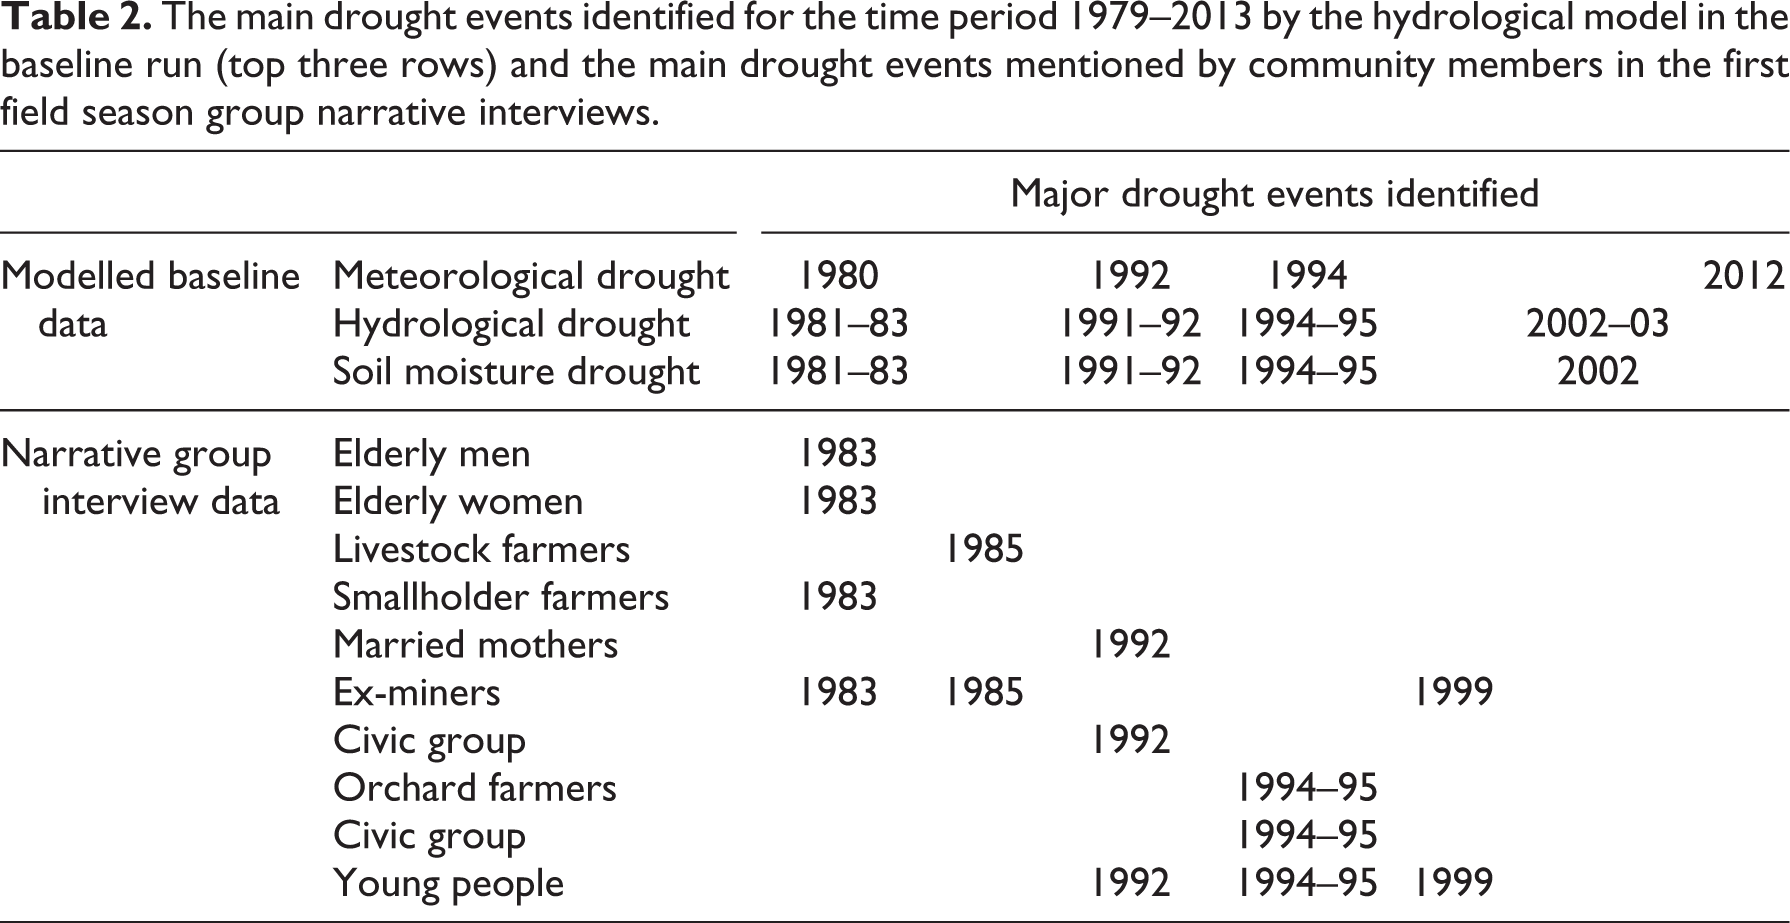
Quotes from the narrative interviews illustrate some of the hydrological impacts of droughts experienced by the participants. The most severe hydrological drought in the last 40 years seen in the data, the 1981–83 drought event (Figure 4), was mentioned by a number of groups (Table 2). The group narrative interview with the elderly men provided descriptions such as ‘dry river’, ‘no rain’, ‘the village was pale’ and ‘livestock died’ during the 1981–83 drought event, and smallholder farmers mentioned that they were ‘unable to do farming; no water for irrigation’. The civic group explained that during the 1992 drought they had to ‘dig for water at the river’ and for the 1994–95 drought event the orchard farmers said that they had to ‘get water from a spring in the mountain’ because there was no water available in the village. Narrative interviews conducted during field season 1 (Table 2) helped to inform the planning for the workshops, with a focus on specific subgroups for the workshops (Table 1). Therefore, not all of the subgroups were involved in field season 2.
VI Scenario modelling
With the baseline run established, the next step was scenario modelling of locally-relevant future what-if drought scenarios (Figure 2). The SHETRAN model was run for three hypothetical future scenarios as input for the workshops. These scenarios were decided based upon interactions with local stakeholders and knowledge of the catchment from field work and were discussed with the community elders to ensure local relevance. This interim stage of community engagement is important in informing the choice of scenarios for the workshops and generating buy-in (Sheppard et al., 2011). The final three scenarios developed were: 1) warmer temperatures in the region due to climate change; 2) a larger irrigation scheme in Folovhodwe; and 3) no dams in the catchment. These scenarios included indirect anthropogenic influence (e.g. temperature increase), and direct anthropogenic influence (e.g. increasing irrigated land, removal of dams). For each scenario, limited variables from the baseline run were changed to be able to enable attribution and easy communication. Only one scenario was presented in each workshop, with the most relevant scenario for the workshop subgroups decided during a pre-workshop training day.
6.1 Use of scenarios
The use of scenarios allows potential pathways to be examined and a range of possibilities to be considered, without an attempt to make precise or probabilistic predictions (Mallampalli et al., 2016). In the project, scenario analysis was applied to stimulate, provoke and communicate the future environment with imaginative and related thinking and a scientific basis (Rounsevell and Metzger, 2010). Scenarios can be qualitative or quantitative, or a mixture of both. The true value of scenario planning can be maximised when the creativity of qualitative scenarios is combined with the specificity of quantitative modelling (Mallampalli et al., 2016). Therefore, here we have used quantitative modelling as the basis of the scenarios, but we used a more qualitative approach to apply them in the workshops.
The application of scenario modelling in participatory workshops for adaptation has been used elsewhere successfully (Etienne et al., 2011; Star et al., 2016), and it has been argued that methodologies combining researcher-driven and participatory scenario processes have great potential for addressing climate change adaptation (Star et al., 2016). Despite its complexity, environmental change and the impact of human actions can be applied to the community level through use of simplified and accessible scenarios. However, these need to be localised in order to be ‘real’, understandable and meaningful to participants (Sheppard et al., 2011).
6.2 Storylines to communicate model scenario results
To achieve meaningful communication of scenarios, scenario droughts were translated into ‘storylines’ in order for information to be relevant and comprehensible in the community in the workshops. Storylines can help to create images of future worlds and describe the consequences or outcomes of a scenario (Rounsevell and Metzger, 2010). Here, to generate storylines based on the hydrological modelling, a ‘translation’ step was necessary to transform specific simulated model outputs into qualitative stories. As well as participant involvement and local level data, the narratives of past drought events collected in the first field season were used in this translation process to generate locally-relevant storylines for the workshop participants. This translation step was essential in communicating the scenarios in the workshops.
Each of the three hypothetical future scenarios was compared with the baseline run, and a specific drought event was used to stimulate the workshop participants’ discussions and their building of future drought narratives. This was important for background understanding of how different the drought events within the scenario would be compared to the present day, although the numeric comparison was not used fully in the workshops themselves.
Within the workshop, the chosen scenario was introduced using a brief overview of how, on average, droughts in the scenario would compare to present day. In some cases, this resulted in the communication of the concept of future droughts being outside the participant’s historical range of experience, an important aspect for preparation. The storylines generated for each of the workshops translated the output of the hydrological modelling to describe one specific scenario drought chronologically in how it would manifest itself in streamflow and soil conditions. However, the storyline was presented without reference to specific dates of the event, in order to help communicate and reinforce that the scenario was not a prediction of something that was actually going to happen, but rather a what-if future. For example, the description of the drought event in the storyline included statements, such as ‘In October the river will start to run dry [Year 1]. This will last for 2 years’, to illustrate the hydrological drought event in which there would be very low river flow or no river flow. For soil moisture droughts, statements such as ‘In June the soil will become too dry for crops. This will last for 2.5 years’ were used to give a time frame for crop failure conditions. Although some details were stripped away from the storyline to enable effective communication with the participants, the quantitative basis of the scenarios from the modelling gave a scientific grounding to the storyline.
We chose not to compare directly with participants’ previous experiences for two reasons. First, we did not know in advance which individuals would be taking part in the workshops, as these were organised through community structures, therefore we could not guarantee that they would remember a benchmark drought event if we used it (e.g. if they were too young or they did not live in Folovhodwe at that time). Second, every drought event happens within a specific economic, political, social and cultural context, which means that whilst the catchment and hydrological characteristics could be similar in the future to, for instance, the 1981–83 drought, the socio-economic setting and potential impacts would likely be different, leading to impacts being felt differently. We did not include changes in the socio-economic landscape in the scenario events, allowing the participants to discuss those if they so wished.
6.3 Warmer temperatures scenario
For this first scenario, the only variable changed compared to the baseline run was the average temperature, with an increase of 3° C compared to present day input. This average temperature increase directly affected the input variable of potential evapotranspiration, translating as a 17% increase in potential evapotranspiration compared to the baseline run (using the Thornthwaite equation). It is expected that temperatures may be up to 3° C warmer on average based upon climate change projections for the region by 2050 (IPCC, 2012; USAID, 2015) under an unconstrained emissions pathway (UNU-WIDER, 2016). A medium-term time period (2050) was chosen to be within one or two generations from the participants, encouraging relevance and engagement with the scenario. Precipitation data remained the same as baseline input as there is much less agreement in the direction and magnitude of projected precipitation change in the region (Engelbrecht et al., 2015; USAID, 2015). Whilst this temperature increase is on the higher end of projections, it helped to illustrate a clear, simple impact of future warmer temperatures. It is important to note that we have not included any changes in variability in temperature, changes in related climate variables such as precipitation, relative humidity, and wind, or other non-linear effects of climate change. This simplistic version of only assessing average temperature increase also helps to avoid downscaling bias and modelling issues related to climate change modelling and projections. The work here was also focused on simpler techniques that the workshop participants could engage with.
The results of this warmer temperature scenario (+3° C) showed an aggravation of drought characteristics across all variables. Compared to the baseline run, longer droughts in streamflow were seen in the village (+13%), and droughts were more frequent (+46%) in the scenario run. Soil outside the irrigation scheme saw more soil moisture droughts (also referred to as crop failure occurrences) (+54%), and the irrigation scheme soil moisture also suffered, with much longer droughts experienced (+50%) and much larger deficits (+70%).
The drought event described in the workshop storyline for the warmer temperatures scenario was based on the 1981–83 drought event (Table 2, Figures 4 and 5). Using the hydrological model outputs, it was established that the scenario drought event had a longer duration than any hydrological droughts experienced in the village over the past three decades. Similarly, no soil moisture droughts in the village (1979–2013) had lasted as long as the scenario drought (Figure 5).
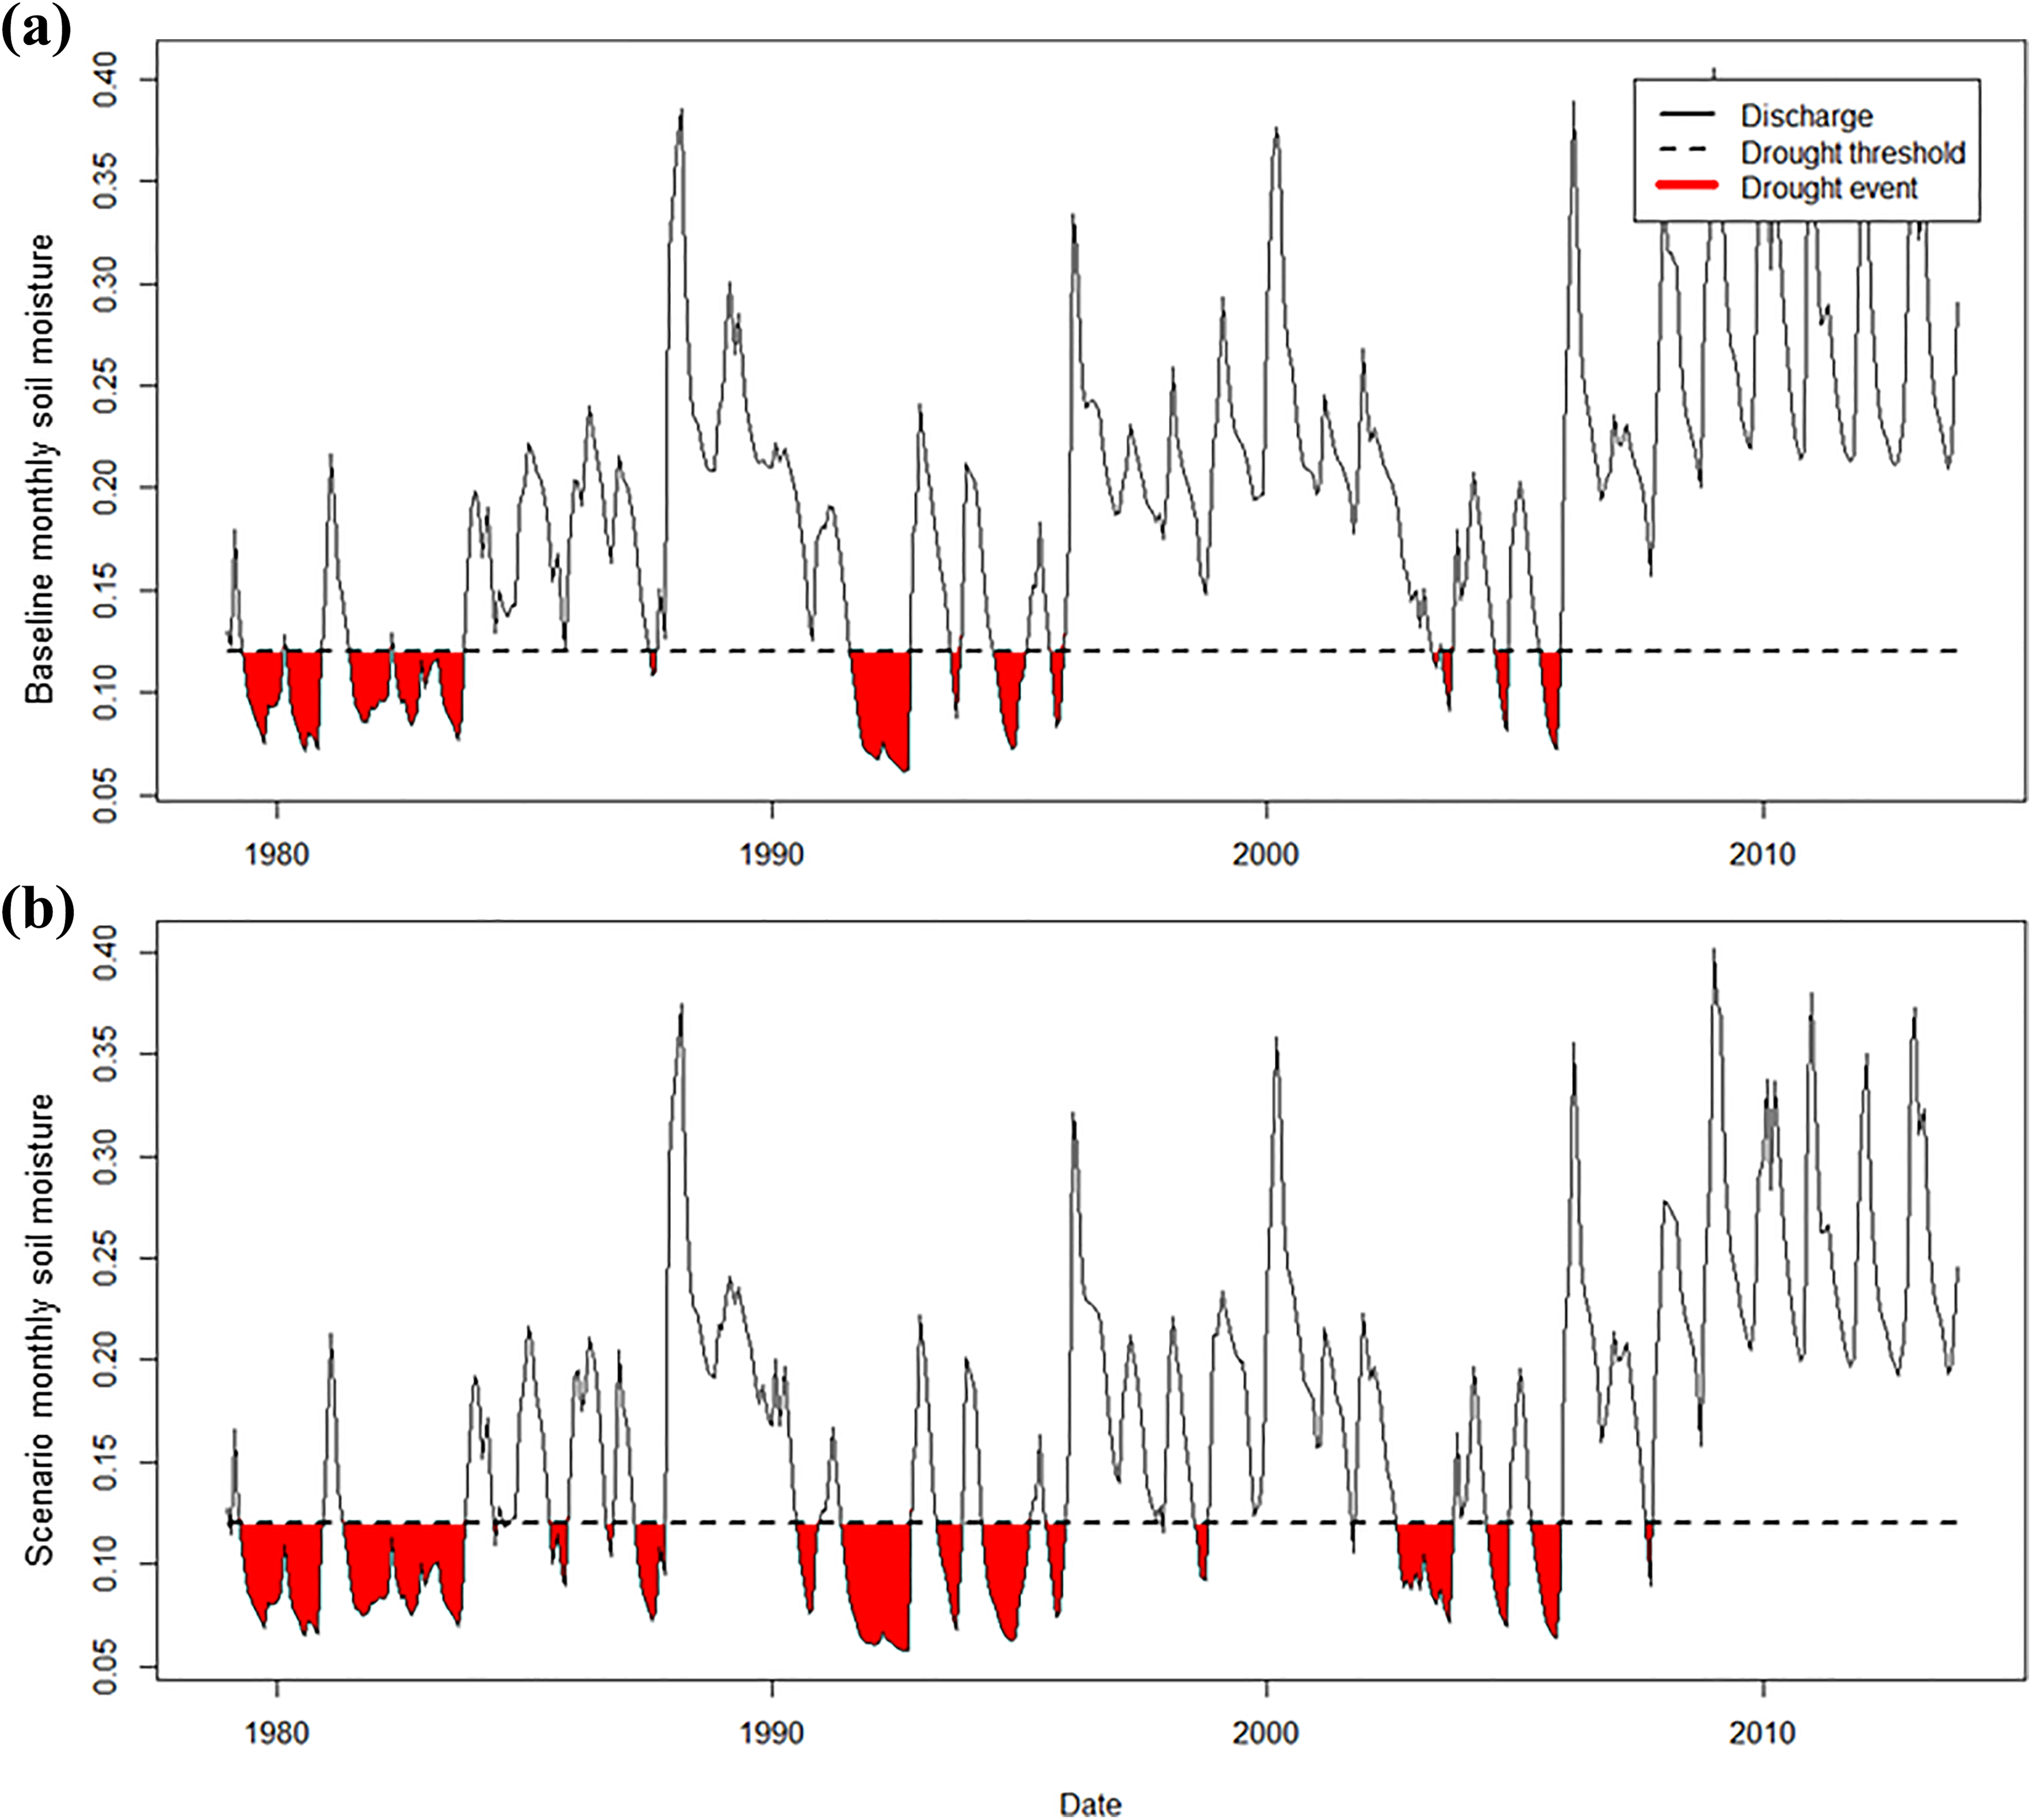
Soil moisture droughts in the centre of Folovhodwe for a) the baseline run and b) the warmer temperatures scenario (+3° C) illustrating the difference between the two model runs. Aggravation in the drought events in the warmer temperatures scenario can clearly be seen.
6.4 Larger irrigation scheme scenario
In the second scenario, the meteorological input data remained the same as the baseline, but land use and associated water use variables were changed. The irrigation scheme area was expanded to be twice as large as present day, with twice the amount of water being diverted from the river (when available) and used to irrigate the irrigation scheme land. This scenario was designed to represent the possible increase in irrigated land due to the current limited space for community members to be on the irrigation scheme. Furthermore, this scenario in general represents the anthropogenic changes in droughts due to increased water use for irrigation in the system.
Results showed an aggravation of drought characteristics for hydrological droughts in the village due to this extra water diversion. Longer droughts in streamflow were seen in the village (+30%), and droughts were slightly more frequent (+8%), with larger deficits (+36%). Overall, the river in the village experienced nearly 1.5 times as many months in drought as the baseline run (40%). The workshop drought event was based on the 1991–95 drought event. No hydrological droughts in the baseline run lasted as long as the major drought event in the scenario (22 months in duration). Scenario soil conditions in the village and the irrigation scheme showed soil moisture droughts to be similar to those experienced in the early 1990s.
6.5 The no dams scenario
The third scenario developed for the workshops had a similar model set-up to the baseline run with respect to its meteorological inputs, land use and water abstraction data. The variable that was changed was catchment storage, with the two large dams in the upper catchment (Luphephe Dam and Nwanedi Dam) removed from the model. The dams were built in the 1960s and, according to local information, require maintenance. Exploring the effect of the dams’ absence served to illustrate the impact of the extra storage capacity in the catchment provided by the dams, and potentially to underline the importance of their maintenance and upkeep to the community and stakeholders.
The removal of the dams resulted in a shift of the drought characteristics for hydrological droughts in the village. Shorter droughts in streamflow were seen in the village (−25%), but these droughts were much more frequent (+85%), with larger deficits (+36%) in the scenario. Soil outside the irrigation scheme witnessed no change, but soil on the irrigation scheme experienced an increase in soil moisture droughts (+62%) which were slightly shorter drought events (−5%), but overall a large increase in the number of months in soil moisture drought (+54%). Major drought events remain the same (showing that dams cannot help to protect against larger droughts events), but the number of extra, smaller drought events occurring in the scenario would mean less time for recovery between droughts.
The scenario drought event was scientifically compared to the 1991–95 drought event. No hydrological droughts in the baseline run in the village have lasted as long as the major scenario one (1.5 years). Scenario soil conditions on the irrigation scheme showed that the smaller soil moisture drought events in the scenario were similar to those experienced in 1993–95, whereas no soil moisture drought events on the irrigation scheme in the baseline run have lasted as long as the major scenario soil moisture drought event in the scenario (1.5 years).
VII Use of scenario modelling in the workshops
Workshops were designed to get groups within the community to creatively engage with the future prompted by the scenario modelling storylines, explore preparedness and adaptation strategies, and encourage inter-generational and cross-sectoral exchange. During the workshops, the facilitators explained the wider topic and the aims of the workshops first, before introducing the specific storylines for the scenario. The Venda speaking co-facilitators were able to give further details or repeat the information if needed. The communication of this information was refined during the pre-workshop training day and through practice. Post-workshop debriefing allowed us to assess how the scenario drought events were being received by the participants and what information we were gaining through the process. The Venda speaking co-facilitators confirmed that ‘the participants engaged themselves willingly in the workshop’. Evidently, this methodological approach allowed people to actively participate in conversations despite the topic of future droughts.
For each workshop, the two subgroups (based on sector or generation; Table 1) considered what the impacts of the scenarios would be on their personal and professional lives within their subgroup only. Groups were then combined for a discussion of how the challenges and impacts could be overcome. Finally, the participants went back into their subgroups to think about how they would transform the discussion into a story, potentially incorporating any chosen adaptation strategies or practices. Overall, the workshops were successful in bringing together a range of people who may not always have opportunities to talk and exchange ideas within the village, and feedback suggested that participants valued this opportunity.
Participants easily engaged in discussions about what impacts may happen associated with the scenario droughts, and possible actions on an individual and community level. Different strategies for preparation and adaptation were discussed, which could be categorised into three different viewpoints. The first was about what they might be able to do themselves individually; for example, ‘we can bring back the previous strategies that elderly people used to practice back then, for us to prepare for the future we can build where we can store food inside for future use’ (Workshop 6: Young farmers and older farmers on the irrigation scheme). Second was what they could do as a community, such as ‘as farmers we can contribute money to buy pipes and to build dams for irrigation’ (Workshop 6: Young farmers and older farmers on the irrigation scheme). Finally, the third was what they might need from the government, with stories including new boreholes being drilled for them.
We found that the translation step from the model results to the workshop storyline was extremely important for communicating the information in the workshops. We also explored different methods of transferring the storyline information to the participants, originally thinking that visual would be most useful (such as through a drawn-out timeline or map), but we learnt that just a short descriptive story in chronological order was most effective. This was learnt through preliminary attempts of communicating through visual data on fieldwork and in the pre-workshop training. It was the collaborative working with the local facilitators which helped to identify cultural norms and appropriateness in communication.
VIII Limitations and lessons learnt
8.1 Model limitations
The hydrological model is a simplified version of the actual situation. It is extremely difficult to model future situations to encompass both changes in climate and changes in society and its relationship with water, nationally and locally. Furthermore, hydrological models currently do not typically achieve full socio-hydrological feedbacks (Srinivasan et al., 2017). Given that numerous social and institutional contexts may be different in the future from the present day, this project opted for a more simple version of modelling what-if future situations by just changing physical variables (e.g. temperature, water use, land use) for each model run. Therefore, a number of other socio-hydrological interactions are not included in the model. For example, field work gathered information that there was a working mineral mine in the community with its own borehole until the 1990s; however, without any abstraction data from this activity, this water abstraction could not be accounted for in the model. Thus, the model is potentially over-simulating river discharges for this period.
8.2 Language barriers and lessons
A range of issues in communication emerged during the modelling process and workshop design and delivery (some anticipated and some not), in the form of the local language, use of scientific terminology, and working between physical and social science language and methodologies.
8.3 English to local language translation
Working in the local language proved a challenge in that some English words and concepts did not have direct translations to the local language, Venda. We overcame this issue by working closely with our South African partners and spending the time to discuss these. Our co-facilitators were all native speaking physical science graduate students based at the local university. Prior to the workshops, we had discussions with our co-facilitators to talk through the scenarios. The storylines underwent a process of translation into Venda during this preparation for the workshops; and through pre-workshop discussions, meanings and definitions were explored and translations were refined.
8.4 Shifting from science terminology to layman’s terms
We found issues with the use of scientific terminology when translating from natural science to community-level storylines. We looked to avoid scientific terminology such as ‘hydrological drought’ and used the phrase ‘river running limited or dry’ instead, and we replaced ‘soil moisture drought’ with the phrase ‘crop failure conditions’ to help communicate the different types of drought with a direct relevance to the participants. To enable the correct translations, the UK team had discussions during fieldwork phase 1 with local partners about how people spoke about drought in the region and what were appropriate phrases. These were then incorporated into the narrative interviews, storylines and workshops.
8.5 Communication of the model purpose
A real challenge that we came across was communicating the purpose and output of the hydrological model, i.e. to effectively communicate to participants and stakeholders that the model was not for prediction or forecasting. Through pre-workshop discussions with our Venda co-facilitators, we were able to communicate to the participants the concept that the scenario in the workshop was not a prediction, but a possible future, and not what will definitely occur. Facilitators also placed emphasis on explaining that the future is more complex than the scenario that was being introduced in the workshop to help avoid the association with forecasting and prediction. Based on pre-workshop discussions, we also actively avoided the use of the term ‘computer model’ to help combat this issue of associating the hydrological model outputs to predictions. We believe that using more than one scenario within a workshop might possibly help participants to not view the scenarios as predictions. However, this can be time consuming within the workshop, and working within the context of the Folovhodwe community we knew that it was important to design the workshops to fit within a limited timeframe for participation and engagement.
8.6 Communicating across physical and social science
Interdisciplinary working is generally agreed to be an essential way forward in addressing real world issues and complex research questions that are beyond the expertise of individual disciplines (Nissani, 1997, and Bruce et al., 2004, cited in Bracken and Oughton, 2006). However, terminology barriers between physical and social sciences were also discovered in this project during the process. ‘Science is increasingly specialised, talks different languages and has different areas of interest’ (Dalgaard et al., 2003: 41) and therefore it can be difficult to merge the two languages when working in an interdisciplinary project. To mitigate this, we invested time within the UK team for discussions, and explored the different terminology used by the physical and social scientists to develop a shared vocabulary and understanding, enabling more holistic progress and outputs. It is recommended by Bracken and Oughton (2006) that longer start-up phases should be factored into interdisciplinary projects to promote this cohesion and to enable a deeper understanding of the contributions from different disciplines and how they may be integrated.
IX Conclusions
Transformative interdisciplinary methods and tools are required to address the many and varied water-related challenges in the Anthropocene (Sivapalan et al., 2014). We used a combination of physical sciences hydrological modelling and a social science narratives approach to provide scientific background and qualitative depth in order to shape community workshops in Folovhodwe, South Africa. Enabling participants to create their own future narratives during the workshops allowed them to explore uncertain events and think outside their range of experiences. Here, the hydrological model was built and applied as a tool for interdisciplinary workshops and community-level communication rather than for prediction or forecasting. This led to a different approach to the modelling process and set-up. We had to be critical and flexible in the hydrological modelling process due to uncertainties and limitations surrounding observations and input data. However, the use of the hydrological model gave scientific grounding to workshop storylines and the ability to compare simulated scenario data with simulated baseline data, two key strengths for the delivery of the workshops. The translation step between the model output and the workshop storylines was extremely important, but challenging. Language barriers discovered during the process were occasioned by the local language, use of scientific terminology, understanding of communication preferences and norms, and vocabulary differences between physical and social sciences. These were overcome through the process of working in a truly interdisciplinary setting and by co-working with local partners. We found that it was extremely important that the scenarios and storylines were relevant and set in a local context to enable participants to connect easily with the information and participate in the discussions and tasks of the workshops. Despite the difficulties around communities engaging with the future, we found that participants were able to actively engage with discussions about possible futures using this interdisciplinary methodology, suggesting its potential for bottom-up community-based research.
Supplemental material
Supplementary_material - Hydrological modelling as a tool for interdisciplinary workshops on future drought
Supplementary_material for Hydrological modelling as a tool for interdisciplinary workshops on future drought by S Rangecroft, S Birkinshaw, M Rohse, R Day, L McEwen, E Makaya, AF Van Loon in Progress in Physical Geography: Earth and Environment
Footnotes
Acknowledgements
Authors would like to thank their local partners and co-facilitators in South Africa for helping with the field seasons: Professor Edward Nesamvuni, Livhuwani Ludick Khobo, Tshimangadzo Mandoma, Ndivhuwo Makhalimela and Khutadzo Ndwambi. The authors also thank Professor Lyla Mehta and Professor Coleen Vogel for discussions in an earlier phase of this research; Micha Werner (UNESCO-IHE) for helping with data provision and for commenting on an earlier version of the manuscript; and Girma Ebrahim at CGIAR for helping with data provision. The authors would also like to thank the Panta Rhei Droughts in the Anthropocene working group. Following the review process, the authors are grateful to the anonymous reviewers for the positive feedback and constructive insight. Finally, the authors are indebted to the chief and the community of Folovhodwe for welcoming them into the community for the study.
Declaration of Conflicting Interests
The author(s) declared no potential conflicts of interest with respect to the research, authorship and/or publication of this article.
Funding
The author(s) disclosed receipt of the following financial support for the research, authorship, and/or publication of this article: CreativeDrought is a GCRF Building Resilience project funded by NERC, ESRC and AHRC under grant number NE/P016049/1.
Supplemental material
Supplementary material for this article is available online.
References
Supplementary Material
Please find the following supplemental material available below.
For Open Access articles published under a Creative Commons License, all supplemental material carries the same license as the article it is associated with.
For non-Open Access articles published, all supplemental material carries a non-exclusive license, and permission requests for re-use of supplemental material or any part of supplemental material shall be sent directly to the copyright owner as specified in the copyright notice associated with the article.