
Abstract
The COVID-19 pandemic has caused unprecedented losses for small businesses in cities across the globe. Policymakers have relied on a wide range of measures to support firms and sustain business continuity. However, significant concerns have been expressed about the degree of equity in the distribution and efficiency of government assistance during the pandemic disruption. Drawing on the case of the Paycheck Protection Program (PPP) and its implementation in inland Southern California, this study examines the spatial distribution of PPP loans at the neighborhood level. Based on spatial regressions and in-depth interviews with small businesses, banks, government agencies, and nonprofit organizations, the study finds that, in terms of their total number and value, the PPP loans have roughly succeeded in reaching their small business targets. However, communities with higher shares of pandemic-vulnerable businesses or higher levels of socioeconomic vulnerability are less likely to have received PPP loans. There have also been spatial spillover effects of community vulnerability when it comes to receiving PPP loans at the neighborhood level. The correlation between fewer PPP loans and community vulnerability also reflects both short-term needs and longstanding challenges facing entrepreneurship and business development in socioeconomically disadvantaged communities. Moreover, small business resilience and community resilience are inseparable, and thus government business assistance must be considered in the context of local communities.
Introduction
The COVID-19 pandemic has triggered unprecedented financial losses across the world. As a key component of urban economic viability, small businesses suffer badly if they lack access to public financial markets or other ways of managng short-term financial challenges. Policymakers around the world have created a wide range of measures, such as wage subsidies, small business grants, and guaranteed business loan schemes to support firms and mitigate the negative economic consequences of the pandemic. In the U.S., small businesses received immediate assistance from the Federal Emergency Management Agency (FEMA), the Small Business Administration (SBA), and other federal and local government agencies. However, both the general public and academic researchers have expressed concerns about the degree of equity in the distribution and efficiency of government assistance programs. For instance, these programs may have disproportionately benefitted certain businesses over others, with the latter including extremely small businesses that have experienced a high level of pandemic disruption, minority- and women-owned businesses, and those in communities that have traditionally lacked investment (Office of Evaluation Science, 2021; Santellano, 2021). Researchers even argue that these programs may have widened pre-pandemic economic inequalities across racial groups (Ong et al., 2021).
As part of the U.S. Coronavirus Aid, Relief, and Economic Security (CARES) Act, the Paycheck Protection Program (PPP) offers guaranteed, forgivable loans to provide liquidity to small and mid-sized businesses to help prevent job losses. The PPP deployed more than $500 billion within just four months of its passage into law, making it one of the largest firm-based fiscal policy programs in U.S. history. Our study investigates the spatial distribution of PPP loans by addressing the following questions. How have PPP loans been distributed across neighborhoods? What are the neighborhood characteristics associated with PPP loan distribution? What does the experience of the program suggest about policymaking to assist small businesses with their recovery from pandemic-like disruptions?
We conducted our study in the Riverside-San Bernardino-Ontario metropolitan area in inland Southern California, an area with a population of 4.5 million – about 12% of California residents. Based on spatial analyses of PPP loans across census tracts, and in-depth interviews, we find that if the distribution of these loans was measured by their total number and their aggregate value, they seemed to have reached their small business targets. However, communities with more vulnerable businesses and higher socioeconomic vulnerability were less likely to have received the loans. The results suggest that both short-term needs and longstanding challenges facing entrepreneurship and business development in disadvantaged communities; moreover, small business resilience and community resilience were inseparable and should be jointly considered in designing and implementing government assistance programs like the PPP.
This is one of the first systematic analyses of the spatial distribution of COVID-related government business-aid programs at the community level in U.S. cities. First, research had demonstrated significant changes in health, social, and political urban landscapes under the impact of COVID (Florida et al., 2021); but knowledge of the experiences of small businesses during these changes was extremely limited. This study expanded the scholarship on urban resilience to include the experiences of small businesses in underserved communities, and thus highlighted the role of public policies in community resilience-building, as well as their intended and unintended consequences.
Second, the interaction of economic, social, racial, urban, and territorial inequalities had been reinforced by the uneven impact of the pandemic across urban communities along the lines of race, ethnicity, gender, class, and other aspects of socioeconomic status (Bambra et al., 2021; Dokhov and Topnikov, 2021). Our study directly examined the relationship between access to government assistance and community vulnerability. In particular, by triangulating the perspectives from both supply and demand sides, we identified the challenges facing socioeconomically disadvantaged communities.
Third, existing literature suggested a gap in understanding the links between business resilience and community resilience in responding to emergencies (Xiao and Peacock, 2014; Xiao and Van Zandt, 2012). Our findings reflected the relationship between economic and social, and between business and community resilience, and thus they contributed to interdisciplinary scholarship on resilience, economic and community development, and equitable recovery and growth. The findings also had important practical and policymaking implications for organizations and government agencies seeking to foster small business development and community resilience.
Literature review
The payroll protection program (PPP) under COVID
The PPP was established by the U.S. CARES Act in March 2020. It was designed to help small businesses, roughly those defined as having 500 or fewer employees. By providing federally guaranteed loans to small businesses with no fees and an interest rate of 1%, the PPP was intended to provide a direct incentive for small businesses to keep their workers on the payroll, to stabilize the rate of small business closures, and to control the rise in unemployment rates. The loans have a maturity rate of two years and repayment may be forgiven in certain circumstances. A small business may be eligible to apply for up to two draws of PPP loans.
First Draw PPP loans to eligible borrowers qualify for full loan forgiveness if the following requirements are satisfied during the 8- to 24-week period following loan disbursement: employee and compensation levels are maintained; and the loan is spent on payroll costs (at least 60% of it) and other eligible expenses. Small businesses that have previously received a First Draw PPP loan can apply for a Second Draw loan. These loans qualify for full loan forgiveness if the same requirements are satisfied during the 8- to 24-week period following loan disbursement (SBA, 2021b).
To apply for a PPP loan, small business owners must go through an SBA 7(a) lender or a federally insured depository institution, a federally insured credit union, or an institution participating in the Farm Credit System. The total amount approved as of October 23, 2021, was about 11.5 million dollars, and by that date, there had been applications for 7.9 million dollars of forgiveness. Most of the loans were small, with the average amount being 67,647 dollars (SBA, 2021a).
Existing studies of the PPP under COVID-19
Extant literature has revealed that the spread of the COVID-19 pandemic and its impact on businesses had been unevenly distributed geographically (Bartik et al., 2020; Kim, 2021; Zhai et al., 2021). Some studies particularly suggested that the PPP had benefited small businesses that were able to obtain the loans, enabling them to retain workers and pay for utilities, rent, supplies, insurance, and other costs (Bartik et al., 2020). However, these studies also pointed out that, despite the unprecedented amount of aid, funds had not reached the businesses that needed assistance the most. At the same time, many businesses had been reluctant to apply because of distrust and concerns about administrative complexity and eligibility, insufficient knowledge about program conditions and application procedures, bureaucratic hassles, and difficulties establishing eligibility (Bartik et al., 2020; Fairlie and Fossen, 2022).
These issues had particularly limited access to emergency resources for minority and women-owned businesses (Fairlie and Fossen, 2022; Office of Evaluation Science, 2021). Kickul et al. (2021) found that significant differences existed between male- and female-owned businesses, with male-owned firms receiving over 80% of the PPP loans made during the COVID-19 pandemic. Similarly, small business owners of color reported having difficulty accessing PPP funds (Gamboa, 2020; Santellano, 2021). According to another nationwide survey, only 12% of Black and Latino small business owners who had applied for funds through the SBA, mostly PPP loans, reported receiving the amount asked for, while 26% reported receiving only a fraction of the amount applied for (Unidos US, 2020).
Research also found spatial differences in access to PPP loans. Atkins et al. (2022) found that Black-White disparities in PPP loans appeared (marginally) greater in areas with fewer bank branches, because Black business owners might have been less likely to have prior relationships with SBA-approved lenders. Borawski and Schweitzer (2021) found that PPP loans had had a broad distribution to small businesses in low- and moderate-income (LMI) communities; however, they had reached higher-income communities to a greater extent than areas with Black, Hispanic, and American Indian or Alaska Native majorities. Furthermore, having examined the distribution of PPP loans across California's 53 congressional districts, Ong et al. (2021) argued that disparities in PPP lending had widened pre-pandemic economic inequalities across racial groups.
Overall, existing studies suggested significant unevenness in access to government assistance. However, based on data from the early stages of the pandemic, most of these studies had focused mainly on descriptions rather than detailed spatial analyses at the community level. As a result, these studies failed to link their descriptions to a broader understanding of small business resilience, especially in socioeconomically disadvantaged communities.
Small business resilience and government assistance
Existing literature on small business resilience has highlighted different factors that influence business preparedness for, and recovery from, hazardous events (Bartoloni et al., 2021; Marshall and Schrank, 2014; Tibay et al., 2018). For example, firm-level characteristics include business size, industrial sector, age of business, emergency planning, financial situation, occupancy of premises, and market range (Adekola and Clelland, 2020; Haynes et al., 2019; Orhan, 2016; Webb et al., 2000). Further, pre-disaster conditions, prior experiences with disasters, leadership and management, the core competence of staff, and effective planning all contribute significantly to businesses’ post-disaster recovery (Marshall and Schrank, 2014; Nowell et al., 2017; Webb et al., 2000). In addition, social capital and social networks enable households, businesses, and communities to overcome shocks, and can provide financial and non-financial capital to build resilience. They often offer resources in the form of information, technological knowledge, market access, physical resources, and emotional resources to keep small businesses resilient (Aldrich, 2012; Danes et al., 2009).
Researchers have also suggested that public policies are of the utmost importance in shielding a region against a crisis, mitigating a crisis's worst impacts, and transforming and reorientating a region toward recovery (Adekola and Clelland, 2020; Torres et al., 2019; Xiao and Peacock, 2014). Governments often provide grants or low-interest loans to assist households, businesses, and communities to recover from disastrous events. For example, businesses impacted by Hurricane Katrina, in 2005, received SBA loans of varying amounts, depending on the likely repayment ability of the owners, and the businesses’ locations and structures. All of this suggests that government assistance has played a positive role in business survival.
However, not every business in need receives government support. Even in a healthy economy, racial and ethnic minority- and women-owned businesses have greater difficulties in obtaining financial capital to launch their businesses and sustain them, in addition to a wide range of other challenges (Bates and Robb, 2015; Bates et al., 2018; Teixeira, 2001). Disastrous events further exacerbate conditions for traditionally disadvantaged groups (Cutter et al., 2000; Peacock et al., 2014; Wang, 2022). For instance, studies on past disasters have identified that access to government assistance is not evenly spread. Based on data from more than 120,000 firms in 60 countries, Cirera et al. (2021) find that government support has been especially limited for the most vulnerable firms and countries. There are mismatches between the number of firms in need and available resources, between the firms most urgently in need and the recipients of aid, and between policies reported as most needed by firms and policies that firms are most likely to encounter. In the U.S., research also finds that access to government assistance differs according to the level at which firms operate, business owners’ characteristics, industrial sector, location, and other factors. For example, Josephson and Marshall (2016) find that in Mississippi post-Katrina the likelihood of receiving a loan guarantee from the SBA increased with the amount of damage, the amount of revenue the business usually received, the age of the business, whether the owner was white, and how much experience of the industry the owner had.
Furthermore, as small businesses are embedded in their social and spatial communities, small business owners who are able to bridge and receive help from community networks are more likely to be economically resilient, and links with family and friends, community leaders, and institutions can help small businesses thrive after a natural disaster (Lo et al., 2019; Torres et al., 2019). This indicates the vulnerability of small businesses that are traditionally disadvantaged, including both ethnic minority- and women-owned businesses and businesses located in geographic areas that lack infrastructure and resources (Bates et al., 2018; Rubin, 2010). Therefore, we expect that businesses located in different communities differ in their access to government assistance, and that socioeconomically disadvantaged locations face greater challenges; it is critical to understand the implementation of this program and the factors that shape small business resilience at different levels.
Data and method
We conducted our study in Riverside-San Bernardino-Ontario, a metropolitan statistical area (MSA) in inland Southern California. This region ranks among the 15 most populous MSAs in the U.S. It is socially and demographically diverse, being home to a plurality of Hispanic/Latino (51%), white (32%), Black (6.9%), and Asian (6.6%) populations. This demographic and racial diversity is significant because disaster disruptions, including COVID-19, disproportionately impact and penalize poor people and communities of color (Bambra et al., 2021; Dokhov and Topnikov, 2021). The Census Bureau's Small Business Pulse Survey (SBPS) indicated that 89% of the small businesses in this region had reported a moderate to large negative effect from the COVID-19 pandemic in early May 2020. By April 2021, the percentage was still as high as 67%.
To address the research questions, we investigated how PPP loans were allocated to neighborhoods and identified neighborhood-level characteristics that were associated with the number and value of loans allocated. The descriptions of all the variables and data sources are provided in Supplementary File 1. To examine the process of implementation at the local level, we conducted in-depth interviews with both small businesses and small business service providers from different sectors.
Data
PPP loans
Complete microdata for PPP loans is available to the general public from the SBA (SBA, 2021a). The data set covers the entire lifecycle of these loans, starting on April 3, 2020, and ending on May 31, 2021. The total of loans received by businesses in the study area was 19,540 (7.568 billion dollars). As shown in Table 1, a total of 90,977 small businesses received First Draw PPP loans while 31.4% of these small businesses received a Second Draw PPP loan. Of First Draw loans, 59.12% went to small businesses reporting only one job, and of Second Draw loans 48.55%, went to such businesses. Of First Draw loans, 12.21% went to businesses with only 2–4 paid employees, 24% went to businesses with only 5–49 paid employees, and 2.68% went to businesses with at least 50 paid employees. Businesses with 5–49 paid employees that received a PPP loan were more likely to obtain another one.
Characteristics of first draw and second draw PPP loans.
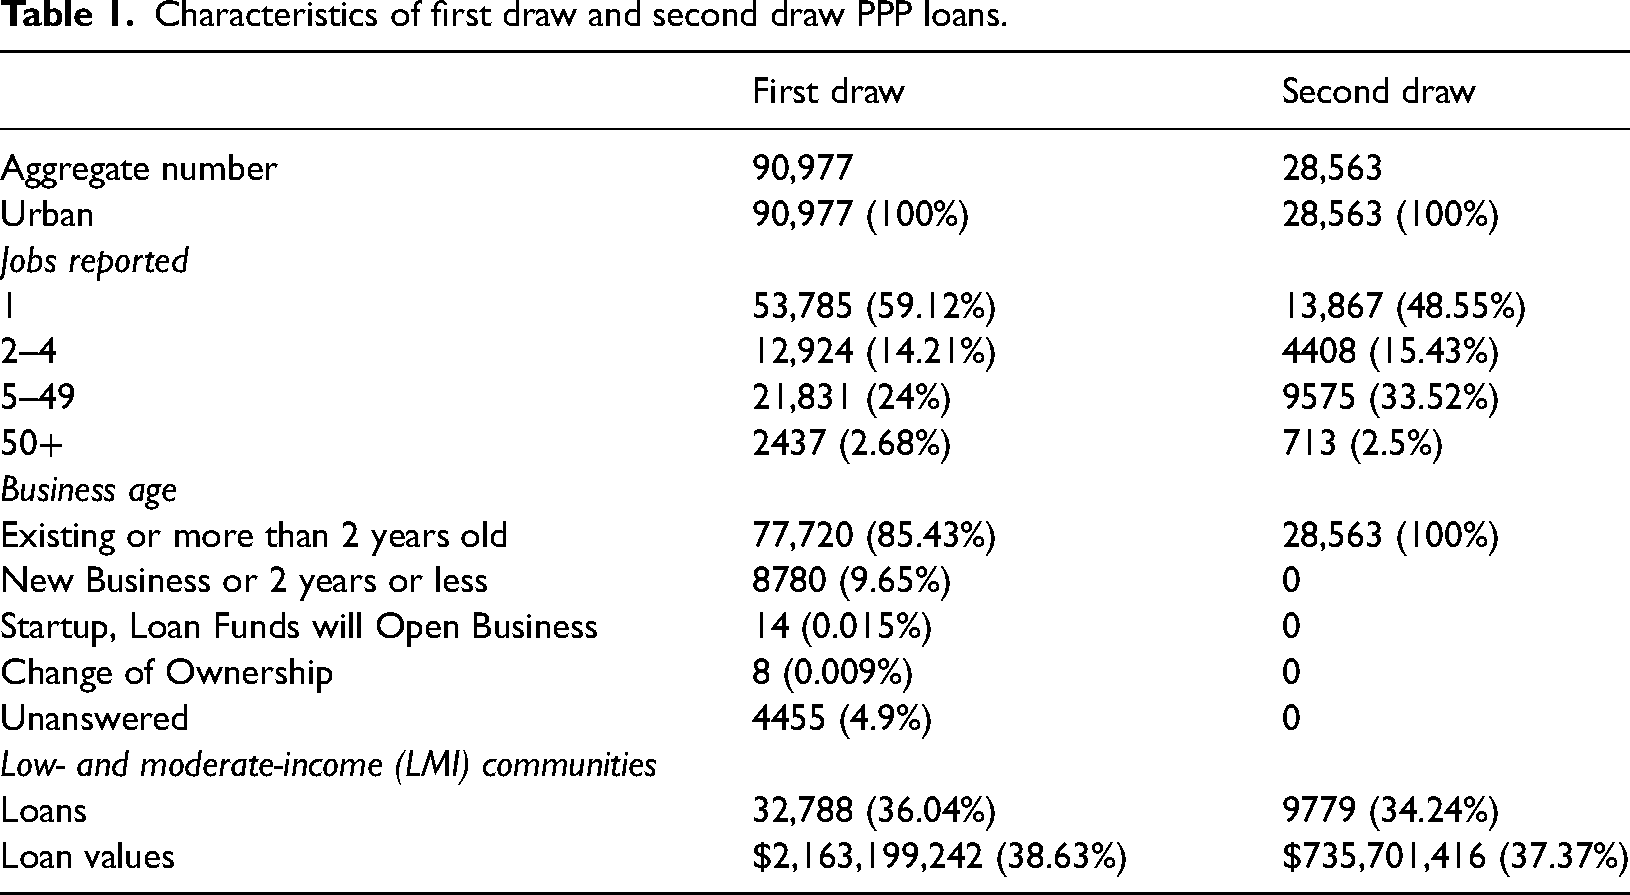
The general pattern indicates that the number of jobs reported is positively associated with the number of PPP loans approved (Pearson's correlation coefficient = 0.763, p-value = 0). In other words, among businesses that received a PPP loan, those reporting more jobs were likely to be approved for larger loans. This positive relationship holds when turning to tract-level statistics. The number of businesses that received PPP loans and report only one job is negatively related to the average loan value in the tract (Pearson's correlation coefficient = −0.688, p-value = 0).
Businesses existing for more than 2 years accounted for 86.43% of First Draw loans, whereas only 9.65% (8780) of newer businesses (defined as existing less than 2 years) received First Draw loans; and newer businesses did not receive Second Draw loans. In addition, 32,788 small businesses, or 36% of total recipients, that received First Draw loans were in low- and moderate-income (LMI) communities. A similar pattern holds for the Second Draw–out of all small businesses receiving Second Draw loans, about 34% were in LMI communities.
Since each loan record provides a detailed address, we further geocoded the addresses to census tracts for aggregation. Out of a total of 822 tracts in the region under study, three did not receive any PPP loans. For all the census tracts which received PPP loans (Supplementary File 2), the average number of loans was 146 and the median was 111. The distribution had a wide range [2, 1832] and was highly skewed to the right, meaning that most tracts received only a small number of loans. Only three tracts received more than 1000 loans. This pattern holds if we differentiate First from Second Draw PPP loans (Supplementary File 3).
For 269 tracts, not a single business that received a PPP loan was in an LMI community, while for another 104 tracts, all the businesses receiving a PPP loan were in LMI communities. An average tract received Second Draw loans totaling 30.4% of its First Draw loans. Only two tracts that received loans from the First Draw (two and five loans) did not receive any from the Second Draw. Of all the tracts that received Second Draw loans, one tract in unincorporated San Bernardino County received 16 loans, accounting for 84% of First Draw loans received – the largest percentage. Tracts receiving a larger number of PPP loans from the First Draw were likely to receive Second Draw loans (Pearson's correlation coefficient = 0.958, p-value = 0). This makes sense, as only borrowers that had already received a PPP loan were eligible for a Second Draw PPP loan. The percentage of businesses receiving PPP loans in LMI communities is not significantly associated with any other variables (e.g., the aggregate number of loans or average loan values). This suggests that PPP loans are likely to be equally or randomly distributed across high-income and LMI communities.
Small businesses
We acquired the distribution of small businesses from the County Business Pattern (CBP) for 2019, the most recent report available for our data analyses. The 2019 CBP reported a total of 77,626 business establishments in inland Southern California, which was fewer than the total number of First Draw PPP loans in this region. Besides the fact that our CBP data was slightly out of date, since new businesses were constantly being formed, the CBP series does not include data on self-employed individuals, who accounted for about 56.6% of PPP loans and represented 81.6% of all business establishments, based on the 2018 Nonemployer Statistics.
The CBP does not provide data at the census tract level. The smallest geographical unit at which CBP data is released is the ZIP Code area. Out of 170 ZIP Code areas that intersected with the study area, the 2019 CBP report suggested that 162 had business establishments. We used the U.S. Department of Housing and Urban Development (HUD) United States Postal Service (USPS) ZIP Code crosswalk files to allocate ZIP Code-level data from the CBP to census tracts. These crosswalk files contained the ratios of three address types for the census tracts each ZIP Code overlapped with: residential, business, and other (Wilson and Din, 2018).
According to the 2019 CBP, the aggregate number of small businesses in this region ranged from 0 to 1772, with a standard deviation of 158. The indicator of business vulnerability in the community was not defined for the seven tracts that had no businesses. The rate for the remaining 815 tracts varied from 0 to 33.3%, with smaller rates largely distributed in the west of the region.
Neighborhood-level characteristics and key measurements
We measured community vulnerability at the census level from two dimensions. First, an economic sectoral perspective: if a census tract had a higher percentage of businesses that were vulnerable to the pandemic, we regarded that neighborhood as more vulnerable. Based on the SBPS, we identified three sectors that had been most severely impacted by the pandemic: Accommodation and Food Services (72), Educational Services (61), and Arts, Entertainment, and Recreation (71). These sectors ranked the highest based on the average of four indices – Overall Sentiment Index, Operational Challenges Index, Financial Stress Index, and Expected Recovery Index – each of which is calculated and released by the Census Bureau. The percentage of small businesses in these sectors was used as an indicator of small business vulnerability in existing studies (e.g., Wang and Kang, 2021).
The second dimension was measured through a residential perspective: a neighborhood or community was more vulnerable if it had a higher percentage of residents with risk factors that made them more vulnerable to the pandemic. We adopted the Community Resilience Estimates (CREs) – a metric developed by the U.S. Census Bureau during the pandemic – for 2019 to help identify communities where resources and information might have effectively mitigated the impact of disasters. The 2019 CREs used the 2019 American Community Survey (ACS) and the Census Bureau's Population Estimates Program (PEP) to provide estimates at the census tract level. Ten Risk Factors (RFs) were considered in constructing each CRE, including the income-to-poverty ratio (total family income divided by the poverty threshold <130), the number of single or zero caregiver households, housing overcrowding, communication barriers, unemployment, disability, lack of health insurance, the number of inhabitants 65 years or older, lack of access to a vehicle, and lack of access to broadband internet. CRE3 (i.e., the proportion of individuals with three or more risk factors) was used in our models as an indicator of community vulnerability. Supplementary File 4 provides the descriptive statistics for key and control independent variables.
Additionally, the racial and ethnic composition of neighborhoods, as well as the other demographic, socioeconomic, and housing variables, were sourced from the 2019 ACS 5-year estimates. These variables were checked using diagnostic tests, model fit comparisons, and multicollinearity checks (Supplementary File 5).
Spatial analysis
The distribution of PPP loans was examined in both the aggregate number of loans and the aggregate value of loans across census tracts. First Draw and Second Draw loans were modeled separately as adjustments had been made to the second draw (e.g., a more stringent eligibility requirement and the expansion of SBA-approved lenders). We further differentiated employer businesses from self-employed businesses.
Exploratory spatial analysis
Spatial analyses were adopted to examine the spatial distribution of the PPP loans (aggregate number and value). We used the widely used indicator of global spatial autocorrelation, Moran's I, to formally examine whether neighborhoods receiving a higher number/value of PPP loans were closer to each other. Moran's I statistic is defined in Equation (1):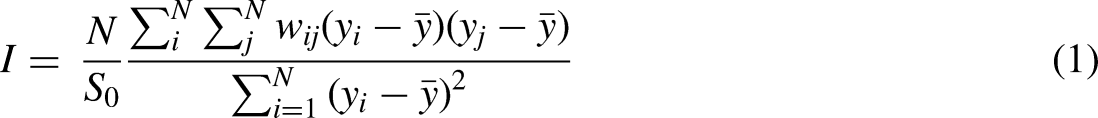
Spatial regression models
To examine the role of community vulnerability in determining PPP loan distributions, we started with the standard linear regression model, which is displayed as follows:
We further conducted diagnostic tests to assess potential spatial dependence in our regression models. The spatial interaction effect was considered in four potential spatial regression models: the spatial lag model (SAR) incorporated a spatially lagged dependent variable, the spatial error model (SEM) contained a spatially autoregressive error term, the spatial lag of X (SLX) model contained spatially lagged independent variables, while the spatial Durbin model (SDM) incorporated both spatially lagged dependent and independent variables.
With 81.6% of all business establishments in this region being nonemployer businesses, it was critical to look at both employer and nonemployer businesses, but in separate models. Therefore, we ran four sets of regression models for each of the two draws of PPP loans: the first two examined the aggregate number and the loan values received by all the businesses; the second two examined the subsample of employer businesses with more than one person working.
We used the hybrid specification strategy outlined in the methodology section to search for the most appropriate spatial regression specifications. It turned out that the SDM was the most appropriate for all cases except for the models for the total numbers of second-draw PPP loans and the total values of first-draw PPP loans. For these two models, a SAR specification was adopted. Supplementary File 6 documents how we chose different models for the current study.
We relied on the direct, indirect, and total effects as proposed by Lesage and Pace (2009) for our interpretation of the spatial regression models, as these models might include spatial lags of dependent (and independent) variables and thus require special consideration to properly incorporate the spatial spillover effect in their interpretation. Specifically, the average direct impact for an independent variable represented the average response of the dependent variable to the independent variable. Because of the inclusion of the spatial lag of the dependent variable in the SDM and SAR, the average direct impact included the effect of feedback loops where the PPP loan/value of a community i affected the PPP loan/value of a neighboring community j, and the PPP loan/value of j affected that of i (also including longer paths and feedback loops).
The average indirect impact was related to the spatial spillover effects. Specifically, for an independent variable, its average indirect impact was interpreted as its impact on a community's PPP loan/value because of a unit change in that variable across all other communities. It could also be interpreted as the impact of a unit change in that variable in a community on the PPP loan/value of all other communities. Therefore, if the average indirect impact of community vulnerability was significant, a community's geographical neighbors’ community vulnerability levels mattered to the PPP loan/value this focal community received.
The average total impact of an activity is the sum of the average direct and indirect impacts. For an OLS model, the average indirect impact is 0 and the average total impact is equal to the average direct impact. These impact statistics have been demonstrated to be more suitable for spatial regression models than the coefficients appearing in our model specifications, since the latter are not real partial derivatives. It is likely that the coefficient of the spatially lagged independent variable is insignificant, while its spatial spillover effect (indirect impact) is significant. For spatial diagnostic tests and spatial regression model estimation and inference, we used the open-source R package, spatialreg (Bivand, 2022).
Qualitative method
To examine how PPPs are received in communities, we conducted 114 in-depth interviews with small businesses (97) and community stakeholders (17) who worked closely with small businesses. Supplementary file 7 provides a summary of the composition of the interviewees. In-depth interviews with small business owners were conducted to gain a comprehensive understanding of the coping mechanisms businesses utilized during the current pandemic. Each interview lasted from 40–100 min and was conducted via zoom or phone, in English or Spanish as preferred by the participants. The in-depth interviews with community stakeholders focused on their roles and activities in small business development, especially in underserved communities. Each interview with stakeholders lasted about 30–50 min and was conducted via zoom or phone. The process followed the IRB protocol that had been approved by the leading author's institution. To keep confidentiality, we use aliases for the participants in this paper.
Using the qualitative software package QSR NVivo, we employed the techniques of narrative analysis outlined by Strauss and Corbin (1998) and Smith (2000) to analyze the interview transcripts and notes. The results were based on common themes reflected by multiple community stakeholders, which allowed us to examine the process comprehensively. However, the scope of the entire project was broader than that of the current paper, in which we are presenting only findings that are relevant to the research questions for this study.
Findings
Spatial distribution of PPP loans
Supplementary File 8 shows the spatial distribution of PPP loans at the census tract level. In general, neighborhoods in southwestern San Bernardino County and western Riverside County received a larger number of PPP loans than other areas. This applied to both First and Second Draw PPP loans. The pattern is slightly different if self-employed businesses (defined as reporting 1 worker) are excluded – the PPP loans are a bit more widely dispersed – but, still, census tracts in southwestern San Bernardino County and western Riverside County received more PPP loans. Similar patterns apply to the aggregate values of loans. Our global spatial autocorrelation tests indicated a spatial clustering effect for all the dependent variables (Supplementary File 8). For instance, the estimates of Moran's I statistic for the number and value of First draw PPP loans across neighborhoods in inland southern California are 0.2696 and 0.1799, respectively, both statistically significant at the 5% level based on permutation-based inference (999 random spatial permutations). In other words, the larger the number or the higher the value of loans received by a census tract, the larger the number or the higher the value of loans received by its neighboring tracts. This clustering effect in the dependent variables warranted special treatment with spatial econometric models in the regression analyses.
Relationship between neighborhood characteristics and distribution of PPP loans
We discussed the direct, indirect, and total effects due to the endogenous and/or exogenous spatial interaction effects in the methodology section (LeSage and Pace, 2009). Table 2 displays the results for average direct effects, which represent the average response of the dependent variable to each independent variable, with the effect of feedback loops incorporated. The average direct effect of the proportion of small businesses vulnerable to the pandemic (RateVSB) is negative and significant for all cases except for the First Draw for employer businesses (both value and aggregate number of loans). Specifically, a unit increase in the proportion of small businesses vulnerable to the pandemic in one community is associated with a 0.98% decrease in the number of First Draw PPP loans and a 1.46% decrease in the value of First Draw PPP loans in this community, other conditions being constant. This also applies to Second Draw PPP loans allocated to employer small businesses in terms of either the value or the aggregate number of loans.
Average direct effects.
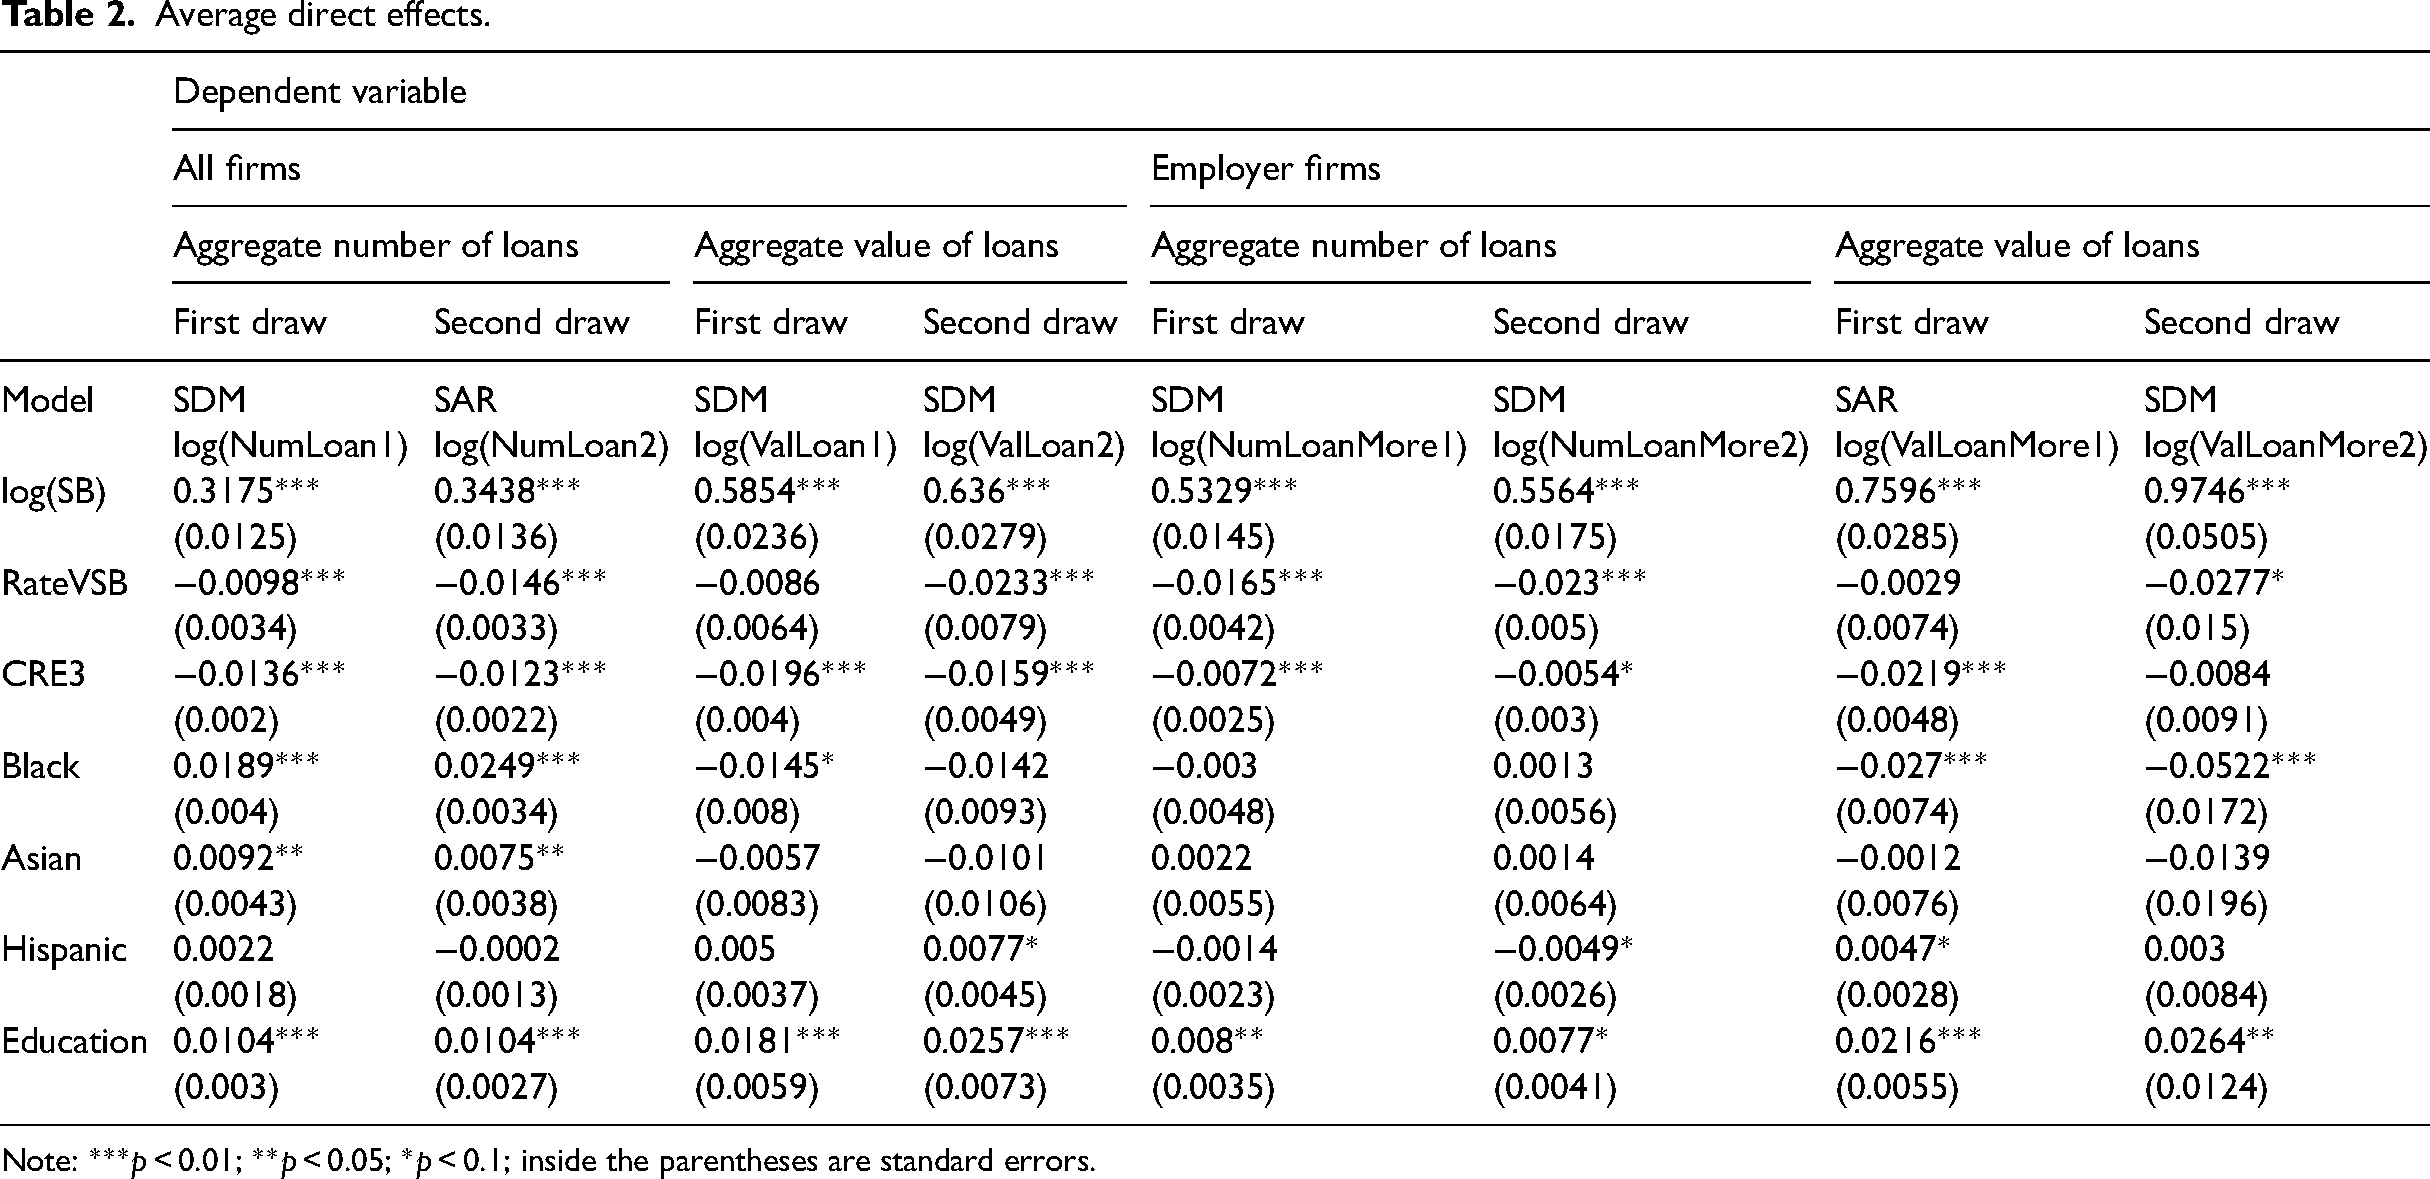
Note: ***p < 0.01; **p < 0.05; *p < 0.1; inside the parentheses are standard errors.
Community household vulnerability (CRE3) also has a negative effect on loan distribution. Except for Second Draw PPP loans to employer businesses, a higher level of community vulnerability predicts a lower number and value of PPP loans received by that community, ceteris paribus, suggesting that vulnerable communities are less resourceful in obtaining financial assistance. Community household vulnerability plays a larger role in determining overall First Draw loan allocations than community business vulnerability, while that tendency is reversed for the Second Draw. Specifically, a unit increase in the level of community household vulnerability in one community is associated with a 1.36% decrease in the number of First Draw PPP loans and a 1.96% decrease in the value of First Draw PPP loans in this community, other conditions being constant. These are much larger than the 0.98% and 0.86% (insignificant) decrease respectively associated with a unit increase in community business vulnerability. However, the opposite is true for Second Draw PPP loans: community business vulnerability is more important in helping access PPP loans, both in terms of the total number and total value.
Spatial spillover effects are summarized as average indirect effects in Table 3. The proportion of small businesses vulnerable to the pandemic (RateVSB) is negative and statistically significant for the aggregate number of Second Draw PPP loans, pointing to negative spatial spillover effects. That is, a unit increase in the rate of vulnerable small businesses in a neighborhood is related to an 8.2% decrease in Second Draw PPP loans received by all other neighborhoods, with geographically closer neighborhoods impacted to a greater extent, ceteris paribus. In contrast, the positive and statistically significant estimated average indirect effect on Second Draw PPP loan to employer small businesses suggests positive spatial spillovers. A unit increase in the proportion of vulnerable small businesses in a community is related to a 4.75% increase in the total value of Second Draw PPP loans received by employer businesses in its neighboring communities, ceteris paribus.
Average indirect effects.
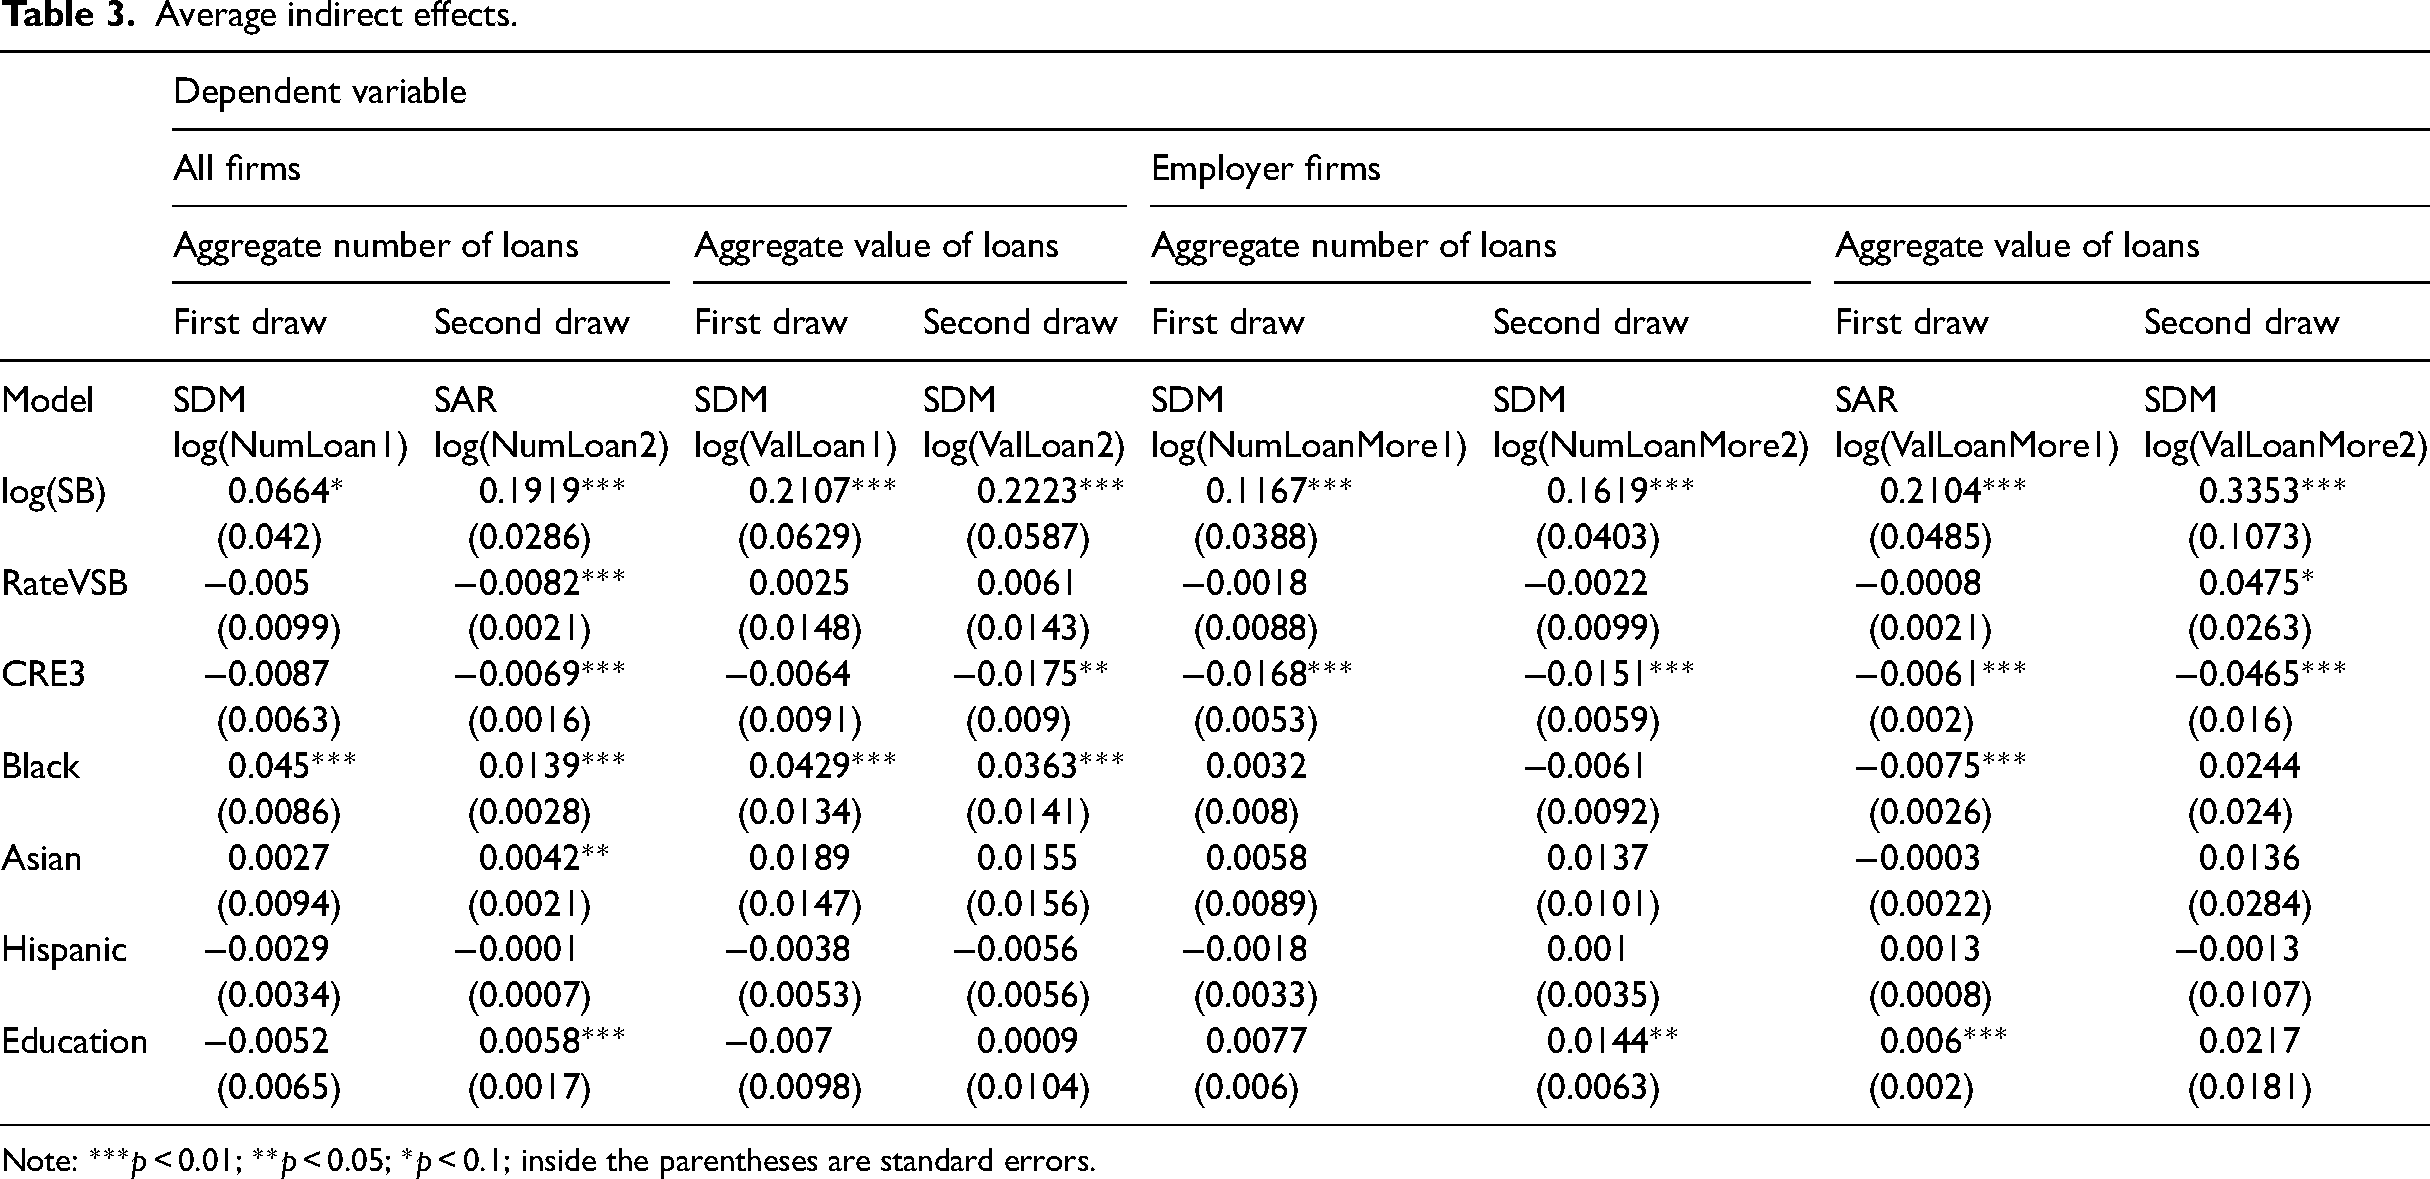
Note: ***p < 0.01; **p < 0.05; *p < 0.1; inside the parentheses are standard errors.
At the same time, community household vulnerability has more of a negative spatial spillover effect, as indicated by the many negative and statistically significant average indirect effects in all the models except for the First Draw. This means that a more vulnerable residential community is associated with a lower number and value of PPP loans received by other neighborhoods and geographically closer neighborhoods were influenced to a greater extent. The negative spatial spillover effect is strongest for second draw PPP loan values: a unit increase in household vulnerability in a community is associated with a 4.65% decrease in second draw PPP loan values received by other neighborhoods.
Combining the average indirect and direct effects gives us the average total effect, as shown in Table 4. The average total effect for an independent variable indicates the change in the dependent variable if the independent variable undergoes a unit change in all the communities being scrutinized, other characteristics being constant. Due to the strong negative spatial spillover effect on the number of Second Draw PPP loans caused by the proportion of small businesses vulnerable to the pandemic (RateVSB), the average total effect of RateVSB is strengthened, from −0.0146 (average direct effect) to −0.0228. That is, a unit increase in the proportion of small businesses vulnerable to the pandemic in all communities leads to a decrease of about 2.28% in the number of Second Draw PPP loans made to these neighborhoods, other conditions being constant. Similarly, the average total effect of RateVSB is negative and significant for the number of First and Second Draw PPP loans allocated to employer businesses. On the other hand, the average total effect for the level of community household vulnerability (CRE3) is negative and significant in all models. The negative spatial spillover effects worsened the situation of neighborhoods with underlying vulnerabilities.
Average total effects.
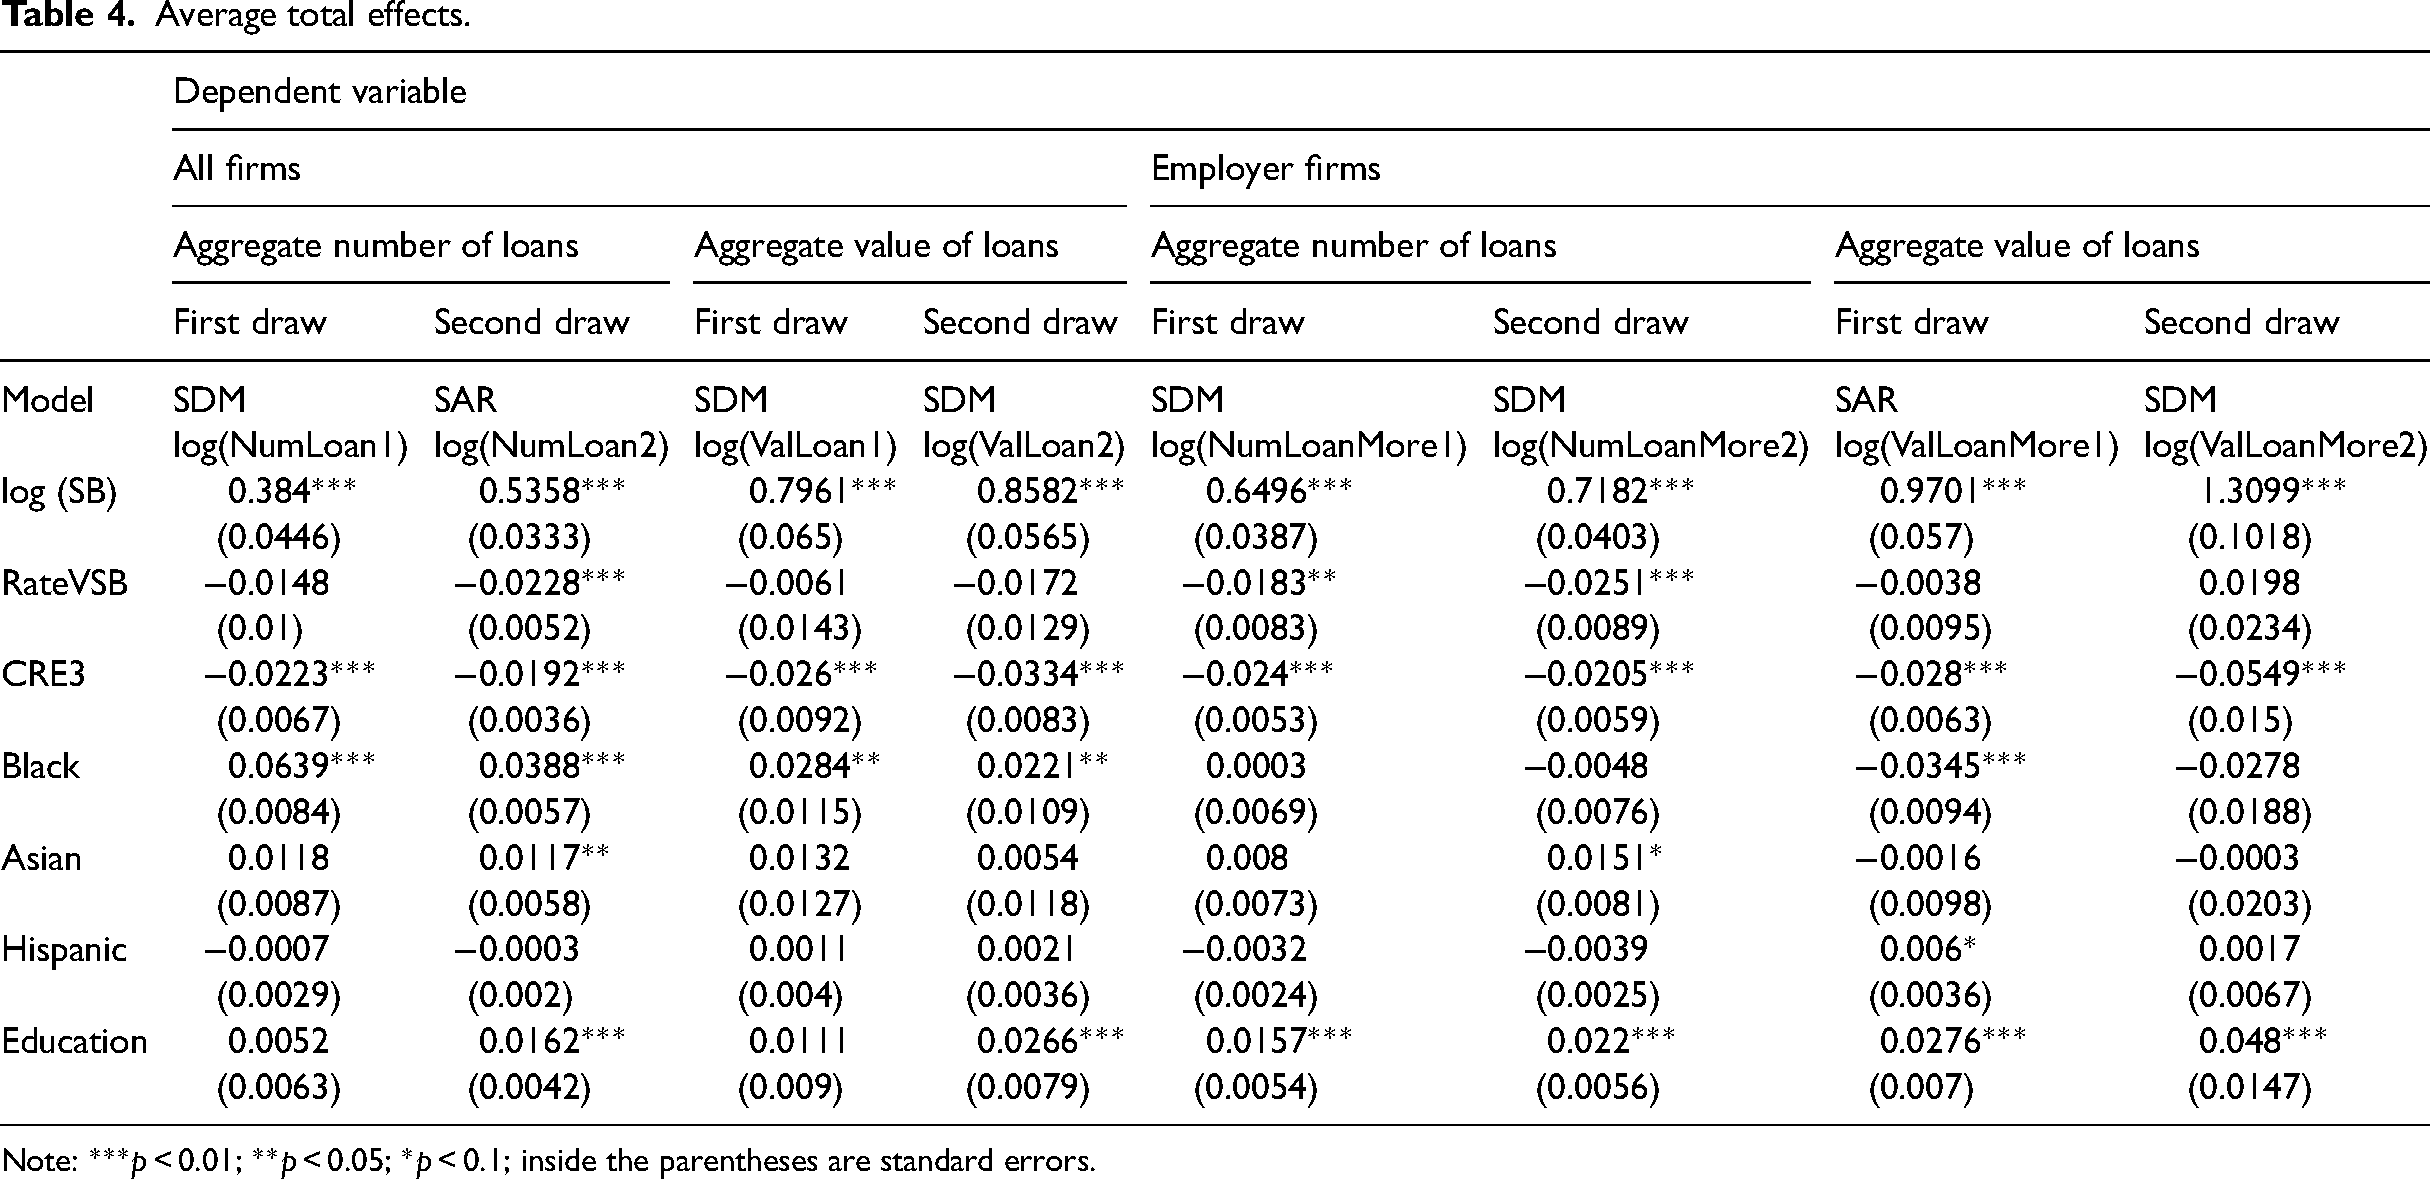
Note: ***p < 0.01; **p < 0.05; *p < 0.1; inside the parentheses are standard errors.
How PPP is received at the community level
Previous studies have suggested that government assistance is crucial to recovery from disastrous events (Haynes et al., 2019; Josephson and Marshall, 2016). Consistently, the qualitative data suggest that PPP loans directly help retain employees, pay the rent and the cost of PPE, keep the business running, and provide certainty and a backup plan. In addition to addressing short-term needs, PPP assistance has indirect and possible long-term effects. For instance, business owners use the assistance to improve physical infrastructure and equipment, streamline the structure of the labor force for the long term, and hire website developers for digital branding and marketing. As Bella explains, “… the help I did already receive honestly was such a huge help because that actually allowed me to invest more in my marketing strategy. So that was for me what really like pushed us to the next level of my business … It gave me an opportunity to get my employees raises and then invest in advertising.”
Supplementary File 9 summarizes the main themes that are related to small businesses’ experiences in access to the PPP loans. However, needs far exceed the available funds; furthermore, not every business qualifies for these programs. Even business owners who do qualify have difficulty accessing the PPP (Bartik et al. 2020). As such, PPP assistance may not reach those communities in the most need (Ong et al., 2021; Santellano, 2021). The statistical analyses demonstrate that both the proportion of pandemic-vulnerable businesses and the vulnerability of residential communities are negatively related to the number and value of loans received. The qualitative analysis clearly identifies the challenges facing local communities. With 81.6% of all small business establishments in this region being nonemployers, many businesses may not qualify for the PPP at all. Furthermore, qualification is only half the battle. Unfamiliarity with how the programs work, confusion about paperwork, and fear of additional debt may deter business owners from seeking help. The following experiences are representative of the challenges encountered:
“I didn't know how to fill out the application. I think I fill it out wrong because I did it on my own and it was a lot of like questions, and I didn't understand a lot of the stuff.” (Betty)
“… it was still kind of like a process of understanding what it was. How did it work? Um, you know, what's at stake too, because, you know, the forgiveness part am I going to be able to repay it? Are we going to still be in business long enough to be able to repay that? Or is it now going to become, you know, a personal debt that I'm going to carry on with my business? If I just, if I'm not able to stay open and close, you know, those were all questions that came through my mind.” (Bella)
The businesses’ experiences are consistent with the comments made by community stakeholders. For example, one representative from the federal government said that,
“[…] in some instances, it's just the inability of our federal relief programs of really getting to the hands of the people that need it the most. I think another challenge is, we don't have a lever on additional stimulus packages. […] Businesses have been struggling with receiving additional support from the federal government. While the state has stepped in to offer some relief for small businesses, it's still not enough.” (SBM-4)
Before COVID-19, both businesses and stakeholders in these communities emphasized the need for training and education in basic procedures such as initiating paperwork for starting a business, financial literacy, certification, creating a business plan, and industry-specific knowledge. Moreover, negative perceptions of place and opportunity and lack of resources have long frustrated economic resilience and entrepreneurship. When Covid-19 hit, the pandemic disruption simply exacerbated the challenges at both local and regional levels. As one stakeholder representative commented, “… it's what COVID did, you know, the crisis is a great, great revealer. It revealed the exacerbation of the problems that existed way before COVID. […] It's important for us to know.” (HK1223, lender) A federal government agency participant echoed this complaint, “Covid-19 has really laid bare the disparities that exist for businesses owned by people of color, and women, and other and other minorities.” (SBM-4)
Discussion
First, does the PPP reach its targets? The short answer is yes. The regression results indicate that the total number of businesses significantly predicts the total number and values of PPP loans received by census tracts in the inland Southern Californian region. Consistent with existing studies (Bartik et al., 2020), the qualitative analyses indicate that the PPP is key to coping with the pandemic disruption of small businesses; however, as both regression results and interview data have shown, businesses in the most need and/or vulnerable communities may not be able to access PPP assistance.
Second, the mismatch between the receiving of PPP loans and community vulnerability reflects both the short-term needs and the long-term challenges facing entrepreneurship and business development in disadvantaged communities (Bates et al., 2018; Fairlie and Robb, 2008; Wang, 2022). Qualitative analyses suggest that information about, and understanding of, the programs are critical for accessing government assistance. Successful recipients are bigger employers, have a higher level of human capital, including financial literacy, have good relationships with banks, are well-connected to business communities and business service sectors, and/or use social media. Stakeholders also suggest that federal government agencies and big corporations’ work with small businesses is mainly executed through collaborations with local organizations and small business development partners, using various databases of certified small businesses (e.g., minority-, women-, and veteran-owned businesses). This means that as information, capital, and resources are allocated and transferred through these networks, those who are not part of them will be excluded. To complicate matters, most government agencies do not have a budget for marketing themselves. Community-based organizations also face stringent financial constraints and language limitations for non-English speaking communities. Therefore, under COVID-19, it is largely up to the businesses themselves to reach for support through their social networks. Thus, access to information and resources is largely determined by businesses’ pre-pandemic connections to different networks.
Third, there is a close relationship between business recovery and community socioeconomic conditions (Wang, 2022). The significant spatial spillover effects that the statistical analyses reveal indicate that vulnerability at the community level is negatively associated with the number and total value of PPP loans granted in neighboring communities. In other words, the implementation of government aid programs reaches far beyond the individual business and neighborhood level. Qualitative analyses also suggest the blurring of boundaries between work and home, family responsibilities, and childcare during the pandemic. Access to government programs like the PPP offers more than mere assistance with business operations; it also alleviates business owners’ personal challenges, which are intertwined with their business careers. The intertwining relationship between small businesses and their local communities suggests that the design and implementation of government assistance like PPPs can be improved by including additional factors at the business owner level and their geographic location characteristics.
The current program was explicitly designed to focus on emergency relief for small businesses, instead of targeting local residential communities (e.g., individual households). Should the program be designed to fulfill both business and community needs? This is a fundamental issue for policymakers to consider before designing such a program. If business assistance is not considered as providing a framework for the residential community, it may cause unintended consequences, including increased racial inequality or neighborhood disparities, as argued by existing studies (e.g., Ong et al. 2021; Santellano, 2021).
Conclusion
The case of inland Southern California suggests that PPP loans have reached small businesses in general, whether we measure distribution by the total number or the total value of loans, as business counts are strongly associated with both loan counts and total values. However, communities with more pandemic-vulnerable businesses, or those with higher socioeconomic vulnerabilities, are less likely to receive PPP loans. This indicates that these loans may fail to reach the communities in most need. Furthermore, neighborhoods with neighboring communities that are vulnerable also tend to receive lower numbers and lower values of PPP loans. This suggests the implementation and delivery process of government aid is closely related to the socioeconomic characteristics of local communities. It calls for policymaking that assists small business recovery from a holistic perspective, one that considers multiple factors at the business owner, business, and community levels.
Findings from this study have important implications for small businesses, government agencies, and nonprofit organizations. Small businesses need to keep themselves as well informed as possible by proactively researching information on financial assistance; maintaining contact with professionals, banks, business organizations, and local government agencies; and having a social media presence. Government agencies need to maintain a flow of accurate, timely, and consistent information and guidance; communicate through social media; reach out to local people, especially to traditionally hard-to-reach communities; and provide information in multiple languages. Governments also need to innovate to adapt to new situations; listen to and understand their communities’ needs; streamline government services; and incorporate public input and needs into sensible policies. At the same time, services from nonprofit organizations have a more urgent role during the pandemic disruption. These organizations should advocate for, and promote, their mission and services in local communities; and stay relevant by suppressing misinformation and disseminating accurate information. For traditionally underserved communities, inclusive entrepreneurship ecosystems are crucial for the region to grow. Providing readily available services to help with education, technological developments, business strategy, and investment in social and financial support will open up the entrepreneurship ecosystem to traditionally underserved communities.
Supplemental Material
sj-docx-1-epn-10.1177_0308518X231166407 - Supplemental material for Small businesses and government assistance during COVID-19: Evidence from the paycheck protection program in the U.S.
Supplemental material, sj-docx-1-epn-10.1177_0308518X231166407 for Small businesses and government assistance during COVID-19: Evidence from the paycheck protection program in the U.S. by Qingfang Wang and Wei Kang in Environment and Planning A: Economy and Space
Footnotes
Declaration of conflicting interests
The author(s) declared no potential conflicts of interest with respect to the research, authorship, and/or publication of this article.
Funding
The author(s) disclosed receipt of the following financial support for the research, authorship and/or publication of this article: The research for this study was supported by the NSF [2151970].
Supplemental material
Supplemental material for this article is available online.
References
Supplementary Material
Please find the following supplemental material available below.
For Open Access articles published under a Creative Commons License, all supplemental material carries the same license as the article it is associated with.
For non-Open Access articles published, all supplemental material carries a non-exclusive license, and permission requests for re-use of supplemental material or any part of supplemental material shall be sent directly to the copyright owner as specified in the copyright notice associated with the article.