
Abstract
Investing in accessible, affordable and sustainable modes of transportation is increasingly seen as an important policy tool for fostering the development of more inclusive cities and combating the rise in inequality. In this article, we review how the concept of inclusive growth has gained traction at the local level framed within a discourse of building more equitable and sustainable cities with a particular emphasis on transportation infrastructure projects as a way of operationalizing the concept as a policy tool. Using Montreal as a case study, we then proceed to evaluate two competing proposals for major public transit infrastructure projects (the Pink line and the REM Phase II) to see if one may potentially offer more inclusive outcomes in terms of transit access and mobility. We do so by first examining changes in the spatial configurations of neighbourhood income disparities in the city between 1981 and 2016. After identifying a pattern of growing spatial polarization between higher- and lower-income neighbourhoods, we use a buffer analysis of transit stations to assess which of the two proposed transit infrastructure projects is best positioned to curb the growth of neighbourhood disparities. Our results suggest the proposed Pink line project provides more coverage in terms of accessibility and connecting economically disadvantaged neighbourhoods from Montreal Nord to Lachine with the downtown core.
Keywords
Introduction
The concept of inclusive growth has garnered considerable attention in economic development policy circles of late. Faced with the twin challenges of slower economic growth and rising levels of inequality, the idea that growth should be distributed more fairly to improve living standards and provide better opportunities for all has become a central objective of policy makers at various levels of government (Evenhuis et al., 2021; Lee, 2019; OECD, 2016; Waite et al., 2020). While appealing to many, how inclusive growth is being operationalized appears to be a ‘murkier’ affair as the concept remains rather broad and fuzzy (Lee, 2019; Waite et al., 2020; Waite and Roy, 2022).
Cities are seen as particularly fertile laboratories for the development of inclusive growth policies (Brookings, 2017; Essletzbichler, 2022; Waite and Roy, 2022). Larger cities are often the foci of higher levels of inequality (Castells-Quintana et al., 2020; Suss, 2023), and improving physical access to employment, education and health opportunities by investing in transit infrastructures is seen as an important tool to make cities more inclusive (Karner et al., 2020; Sheller, 2018; Waite et al., 2020).
In this article, we provide a case study of how the concept of inclusive growth has crystallized in the city of Montreal around two proposed major public transit infrastructure investments, both of which are seen as important policy tools to provide better transit accessibility to jobs for those in economically disadvantaged neighbourhoods with currently limited public transit options. Though there are many possible outcomes to consider for inclusive growth, focusing on a narrower perspective of how transit investments can play an important role in integrating populations into the labour market more effectively offers the advantage of focusing on a well-defined problematic and set of metrics to assess inclusiveness (Waite et al., 2020; Waite and Roy, 2022).
Montreal was one of the first cities to sign on to the OECD's ‘inclusive cities campaign’ in 2016. The year after it did so, the main battle lines for the municipal elections were drawn around making the city a more accessible and inclusive place. For newly elected Projet Montreal candidates and mayor Valérie Plante, the key policy tool to do so was the proposal to build a new metro line – known as the Pink line – that would span 29 km in length, stretching diagonally across the city to connect neighbourhoods currently underserved by public transit infrastructure in the Northeast and Southwest boroughs to its central business district (CBD).
Despite the Pink line's popularity at the local level, shortly after Projet Montreal came to power, a competing vision of public transit infrastructure development for the city emerged, one articulated primarily by the province and the Caisse de Dépôt et de Placement du Québec (CDPQ), it's institutional investment arm. The CDPQ is the financial backer of the Réseau express métropolitain (REM), the initial phase of which is already under construction and will see the city's first automated light rail network begin operating over a predominantly South–North–West axis in 2023. The province and CDPQ have more recently championed the idea of a Phase II development for the REM in the city's East and North sectors (regions more closely aligned with the proposed Pink metro line). While metro and transit ridership levels are gradually recovering after their collapse during the pandemic (Statistics Canada, 2020), both the Pink line and REM phase II proposals are seen as important investments to support the region's future transit needs and powerful policy tools to foster greater inclusiveness by improving access and connecting residents to better employment opportunities in the CBD.
Our goals in this article are threefold. First, we begin by reviewing the concept of inclusive growth, from its inception in international development theory to its more recent adoption in metropolitan policy frameworks where it is often found in the discourse on sustainable and equitable urbanism. As we will see, within such policy frameworks, public transit infrastructure investments are considered as one of the key levers required to achieve more inclusive growth at the local level. Second, drawing on Montreal as a case study, we set out to examine how income disparities between neighbourhoods have evolved over the 1981–2016 period. At the local level, while the need to provide better transit options to economically disadvantaged neighbourhoods is often touted as the principal barrier for inclusive growth, to the best of our knowledge there are no detailed studies of the changing spatial configurations of neighbourhood income disparities in Montreal over the long run. After producing a diagnostic of the problem, our third objective is to assess which of the two public transit investment projects has the potential to better serve those economically disadvantaged neighbourhoods.
Results show there is indeed a pattern of increasing spatial polarisation (or divergence) between higher- and lower-income neighbourhoods across the city. By 2016, roughly half of the 80 or so neighbourhoods identified as belonging to low-low (LL) income clusters are located in Montreal's Northeast and East boroughs, parts of the city that are not currently served by existing metro lines or the nearly complete REM phase I of the new light rail system. Of the two proposed Pink line and REM phase II investment projects, a buffer analysis of planned transit stations shows that the Pink line would provide more coverage in terms of accessibility and connecting economically disadvantaged neighbourhoods across the city. As a policy tool, we thus conclude that the Pink line is the most ‘inclusive’ of the two proposed projects.
The rest of the paper is organized as follows. After a literature review of the concept of inclusive growth, we discuss the research design adopted in the and then present the main results from the analysis carried out. Finally, we conclude with a brief discussion of the implications of our findings.
Literature review
A new policy paradigm: the rise of the concept of inclusive growth
Although the concept of inclusive growth has been around for several decades, it is only recently that it has emerged as a new policy paradigm in countries of the Global North. Its antecedents, as Turok (2011) and Lee (2019) remind us, are rooted in international development theory within debates over how best to achieve poverty reduction in Global South countries. As the ‘trickle down’ approaches applied to developing countries for most of the 1960s and 1970s failed to deliver benefits to the poor, new ideas began to emerge around notions of the need for ‘broad-based growth’ (World Bank, 1990). These included policy strategies designed to facilitate income generation and employment opportunities for the poor that came to be known as pro-poor growth programs (Kakwani and Pernia, 2000). Widely adopted throughout the 1990s and early-2000s, the popularity of pro-poor growth policies and their emphasis on supply-side instruments began to wane in the face of continued increases in inequality and broader concerns over the global commitment to shared prosperity writ-large.
With the emphasis still on Global South countries, the publication of the World Development Report (WDR) in 2009 served to reframe the policy debate more sharply around place and prosperity, recognizing that economic growth was inherently unbalanced, and that more inclusive development was needed moving forward. Greater economic integration and the provision of basic services, including ‘infrastructure that connects’ (p. xxiii), were to be cornerstone policy instruments to achieve greater inclusiveness. While the WDR was far from perfect and raised a number of criticisms (for a review of these see Rodriguez-Pose, 2010), it did succeed in its goal of reshaping the policy discussion around the desirability of more ‘inclusive growth’.
Interestingly, the reframing of the policy discussion around the need for more inclusive growth has since happened mainly within the context of Global North countries where (i) income inequality has continued to rise and (ii) the new normal is lower economic growth (Chancel et al., 2022; Milanovic, 2016; Piketty, 2014). In May of 2014, the OECD organized a high-level conference in Paris to outline a new agenda shaped around building more resilient economies and inclusive societies. This led to the OECD's (2014) report ‘All on board: Making inclusive growth happen’, which defined inclusive growth as ‘economic growth that creates opportunity for all segments of the population and distributes the dividends of increased prosperity, [more …] fairly across society (p. 80)’. While broad, the OECD's definition of inclusive growth proved appealing because it provides for a flexible and multidimensional policy framework while emphasizing the link between distributional outcomes and policy actions. It also recognizes the importance of considering the spatial dimensions of the design and implementation of inclusive growth strategies. From an urban perspective, this means ensuring greater coordination between the different levels of government but also adopting more integrated strategies that link sectoral policies, from skills development to housing, transportation and the environment. Here, comprehensive investments in public transit systems are seen as key in terms of opening up new employment and training opportunities for the most disadvantaged in cities, leading to the promotion of both growth and equity objectives.
The recognition that transport networks can act as a powerful policy tool for fostering more inclusive growth in cities by having a significant and lasting impact on the most economically disadvantaged has indeed been gaining steam (Foth et al., 2014; Zuk et al., 2018). From an inclusionary and social justice perspective, focusing on accessibility and mobility for disadvantaged groups means removing barriers to greater work, school, and health related opportunities, all of which tie into the concept of mobility justice that has become a growing concern among both academics and practitioners (Lucas, 2012; Martens, 2016; Pereira et al., 2017; Sheller, 2018). For employment in particular, better transit accessibility to jobs in disadvantaged neighbourhoods has been shown to increase a worker's chances of being employed and working on a full-time basis (Kawabata, 2003). Within this emerging body of work, there remains a lack of conceptual clarity as to what social justice truly means in the urban transportation context though a growing consensus is forming around the need to focus on issues of accessibility and the prioritization of disadvantaged neighbourhoods when developing major public transit infrastructure projects (Pereira et al., 2017; Wiesel and Liu, 2021). Particularly relevant here is Sen's (2009) idea of social justice, which adapted for a planning context means that it is the enhancement of the relational condition of those in such disadvantaged neighbourhoods that matters most (see also Basta, 2016).
From an applied urban perspective, the Brookings Institute in the US recently launched a series of new initiatives to track the progress of American cities in achieving more inclusive growth and prosperity. Billed as delivering inclusive access, the new framework proposed for urban leaders is built around the ‘need to plan, design, and deliver transportation services and develop land in a way that prioritizes inclusive access (Brookings, 2017: 3)’. PolicyLink also set out targets and best practices for what it called ‘all-in cities’ that are inclusive and equitable (see Treuhaft, 2015). Of the eight policy goals outlined by PolicyLink, one centres specifically on the need for more infrastructure resources targeting low-income communities to improve accessibility and ensure economic vitality for people living in underserved neighbourhoods.
With an emerging consensus at the international level that growth and greater social inclusion are no longer unrelated or competing goals (Berg and Ostry, 2011), the inclusive growth agenda arrived rather suddenly in Canadian policy circles with the election of the Liberal's Trudeau government in 2015 (St-Hilaire, 2017). While campaigning in the fall of that year, the central message of the Liberal Party's electoral platform was the need to invest in strengthening the middle class (Liberal Party of Canada, 2015). This required a number of different strategies, including the development of more inclusive (i) wage policies, (ii) benefits for caregivers and (iii) child care support programs. More broadly, the platform also outlined goals to achieve greater inclusiveness in terms of gender equality and first-nations education and treaties recognition. The following years would see the government's inclusive growth agenda take shape across a series of policy fields (see Table 1). From the government's first budget (Department of Finance, 2016) to its innovation agenda (Innovation, Science and Economic Development, 2016), monetary policy discourse (Wilkins, 2018) and regional development strategies (ACOA, 2018), inclusive growth quickly became the new policy mantra. Inclusive growth also permeated the policy discourse of provincial and municipal governments, particularly in the case of Montreal where the city's progressive Projet Montreal party (under the leadership of Valérie Plante), won a majority of seats on city council in 2017 running a platform of sustainable and inclusive urbanism.
Key (policy) documents referring to ‘inclusive growth’ concept in Canada.
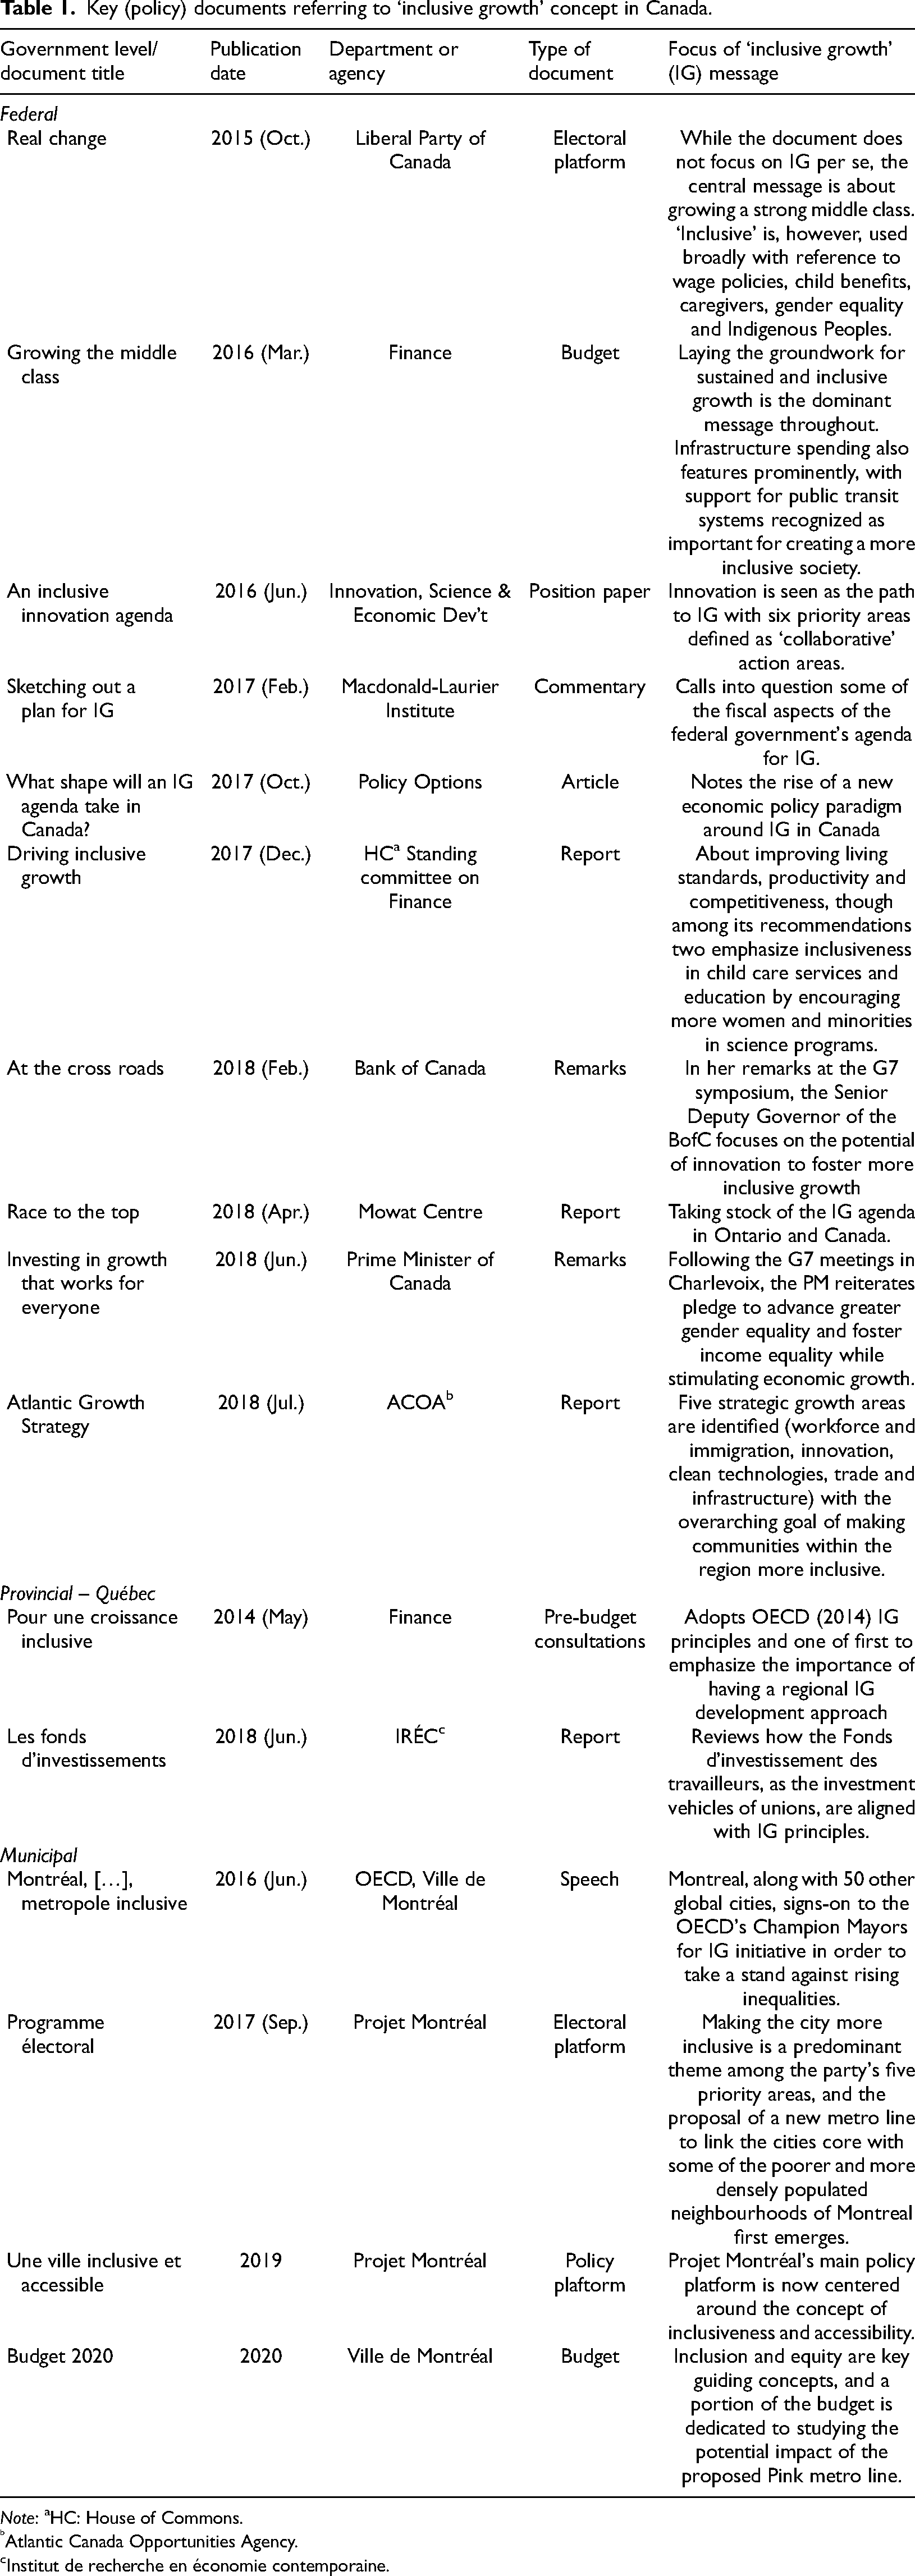
Note: aHC: House of Commons.
Atlantic Canada Opportunities Agency.
cInstitut de recherche en économie contemporaine.
While closer examination of the documents listed in Table 1 suggests that inclusive growth has certainly become a meaningful goal used to set social and economic development agendas across the country, it is also clear that the concept suffers from a lack of clarity. With multiple meanings and definitions, it remains a rather fuzzy concept (Lee, 2019; Turok, 2011). It has also become somewhat of a buzzword, applied broadly as a veneer to different policy frameworks often leading to little substantive changes in the policies themselves (Waite et al., 2020). And to be sure, while scholars have emphasized how new transport investments can distribute benefits (e.g. increased access to desired destinations, reduced travel time, convenience, safety etc.) across different socio-demographic groups, one should not forget about the potential harms (e.g. increased housing cost, displacement) associated with such investments (Boarnet et al., 2017a; Verlinghieri and Schwanen, 2020; Zuk et al., 2018). While the empirical evidence on transit-induced displacement remains limited at best (Boarnet et al., 2017b; Delmelle et al., 2021), an understanding of both the benefits and possible harms of new transit infrastructure is key to ensuring that investments have positive and equitable outcomes.
The local context: inclusive growth and Montreal's transit projects
In the case of Montreal, the concept of inclusive growth made its first appearance in official documents in 2016. The city was one of 50 around the world to sign on to the OECD's ‘inclusive cities campaign’ recognizing the need to stem the rise of inequalities. It is the following year, however, that the concept really gained heightened attention as Projet Montreal made it a centrepiece of its electoral platform. Here, the concept of inclusive growth was rooted in ideas of sustainable development, accessibility and focusing on the needs of the local population, especially those residing in economically disadvantaged neighbourhoods. For Projet Montreal, the proposed Pink line was seen as the key policy instrument to achieve greater inclusiveness by providing increased access to the city's transit network for the latter.
The Pink line was to be added to the city's existing metro system. Built from the early-1960s to the mid2000s, Montreal's existing metro network includes 68 stations that span over 69 km of track on four different lines (see Figure 1 and Table 2). With an annual ridership of more than 383 million, it is North America's fourth busiest rapid transit system (APTA, 2018). Add to this phase I of the REM which will link the South shore to different parts of the West Island (the airport, Sainte-Anne-de-Bellevue) along with the Northern Deux Montagnes region, Montreal is projected to have the second highest ridership on a per capita basis after New York City. While a boon to transit users in these communities, as Figure 1 shows, the city's East and Northeast boroughs remain largely underserved by the existing transit infrastructure even though many of their neighbourhoods are amongst some of the city's most densely populated and, as we will see, most economically disadvantaged. Projet Montreal's proposed Pink line, which would extend diagonally across the island from Montreal Nord (to the Northeast) down to Lachine in the Southwest, is thus seen as filling an important gap in terms of the transit grid by connecting the Northeast's neighbourhoods to the downtown business core.
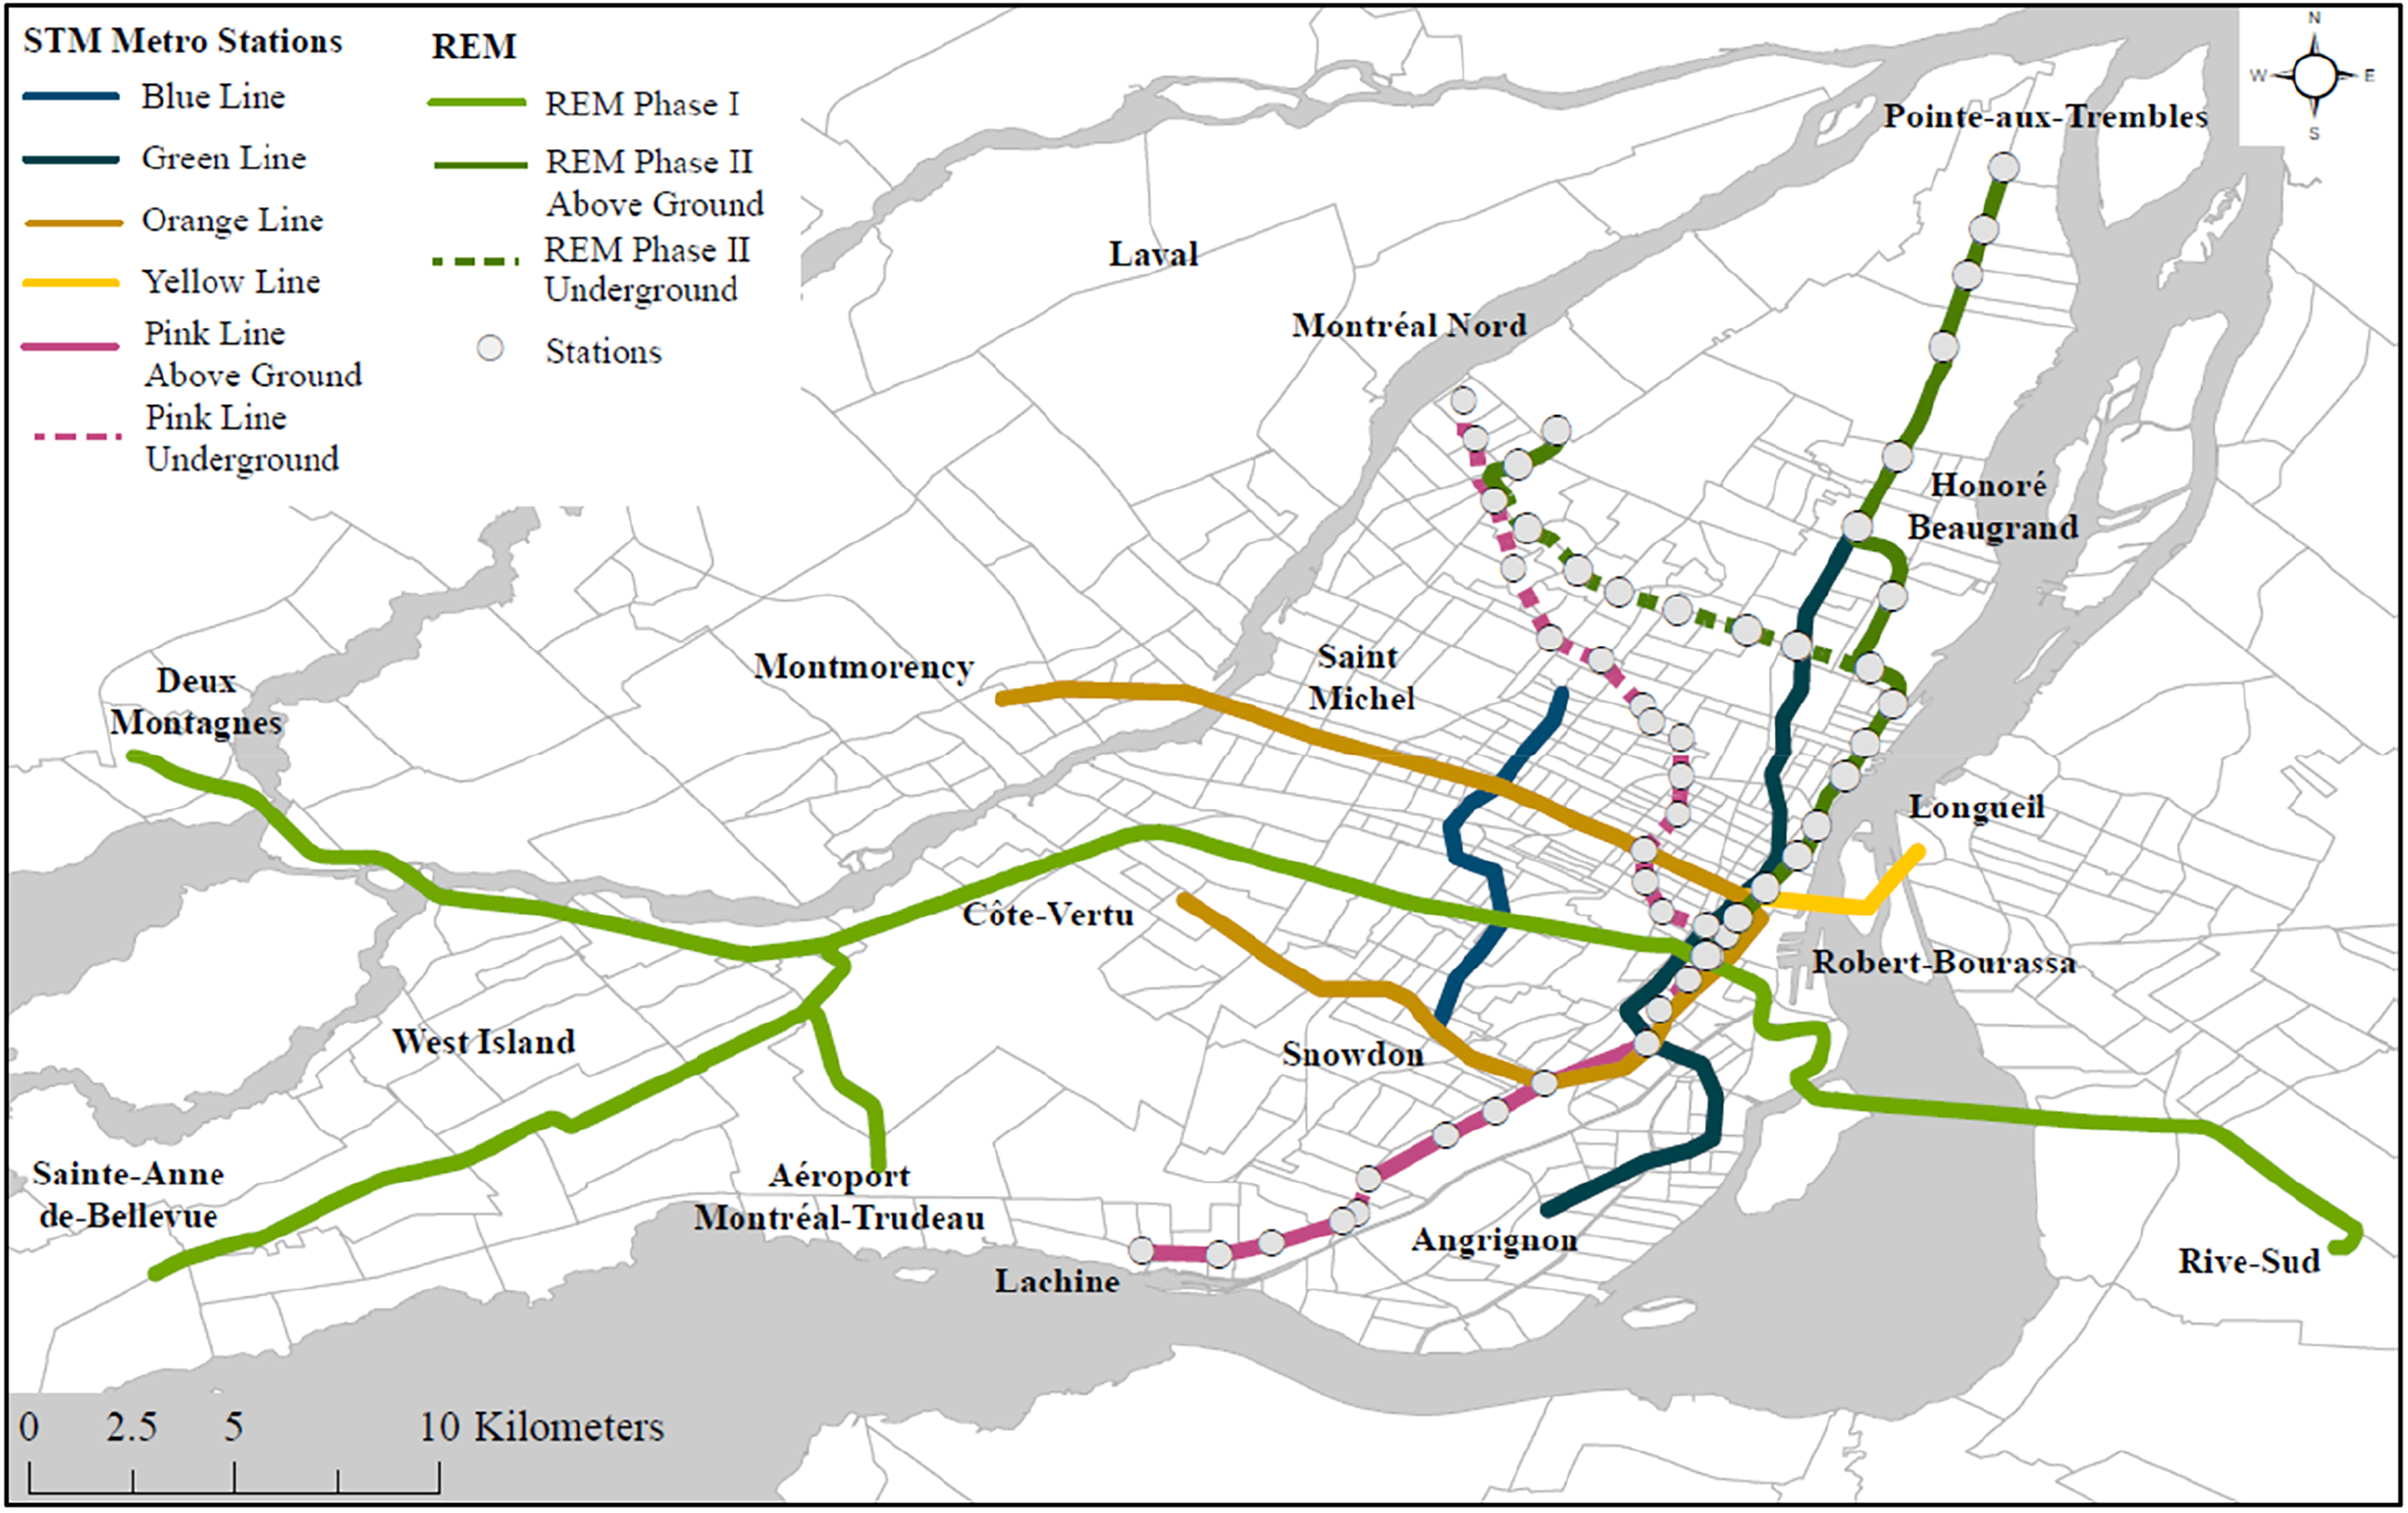
Montreal's existing and proposed metro/light rail infrastructure.
Existing and major proposed public transit projects in Montreal.
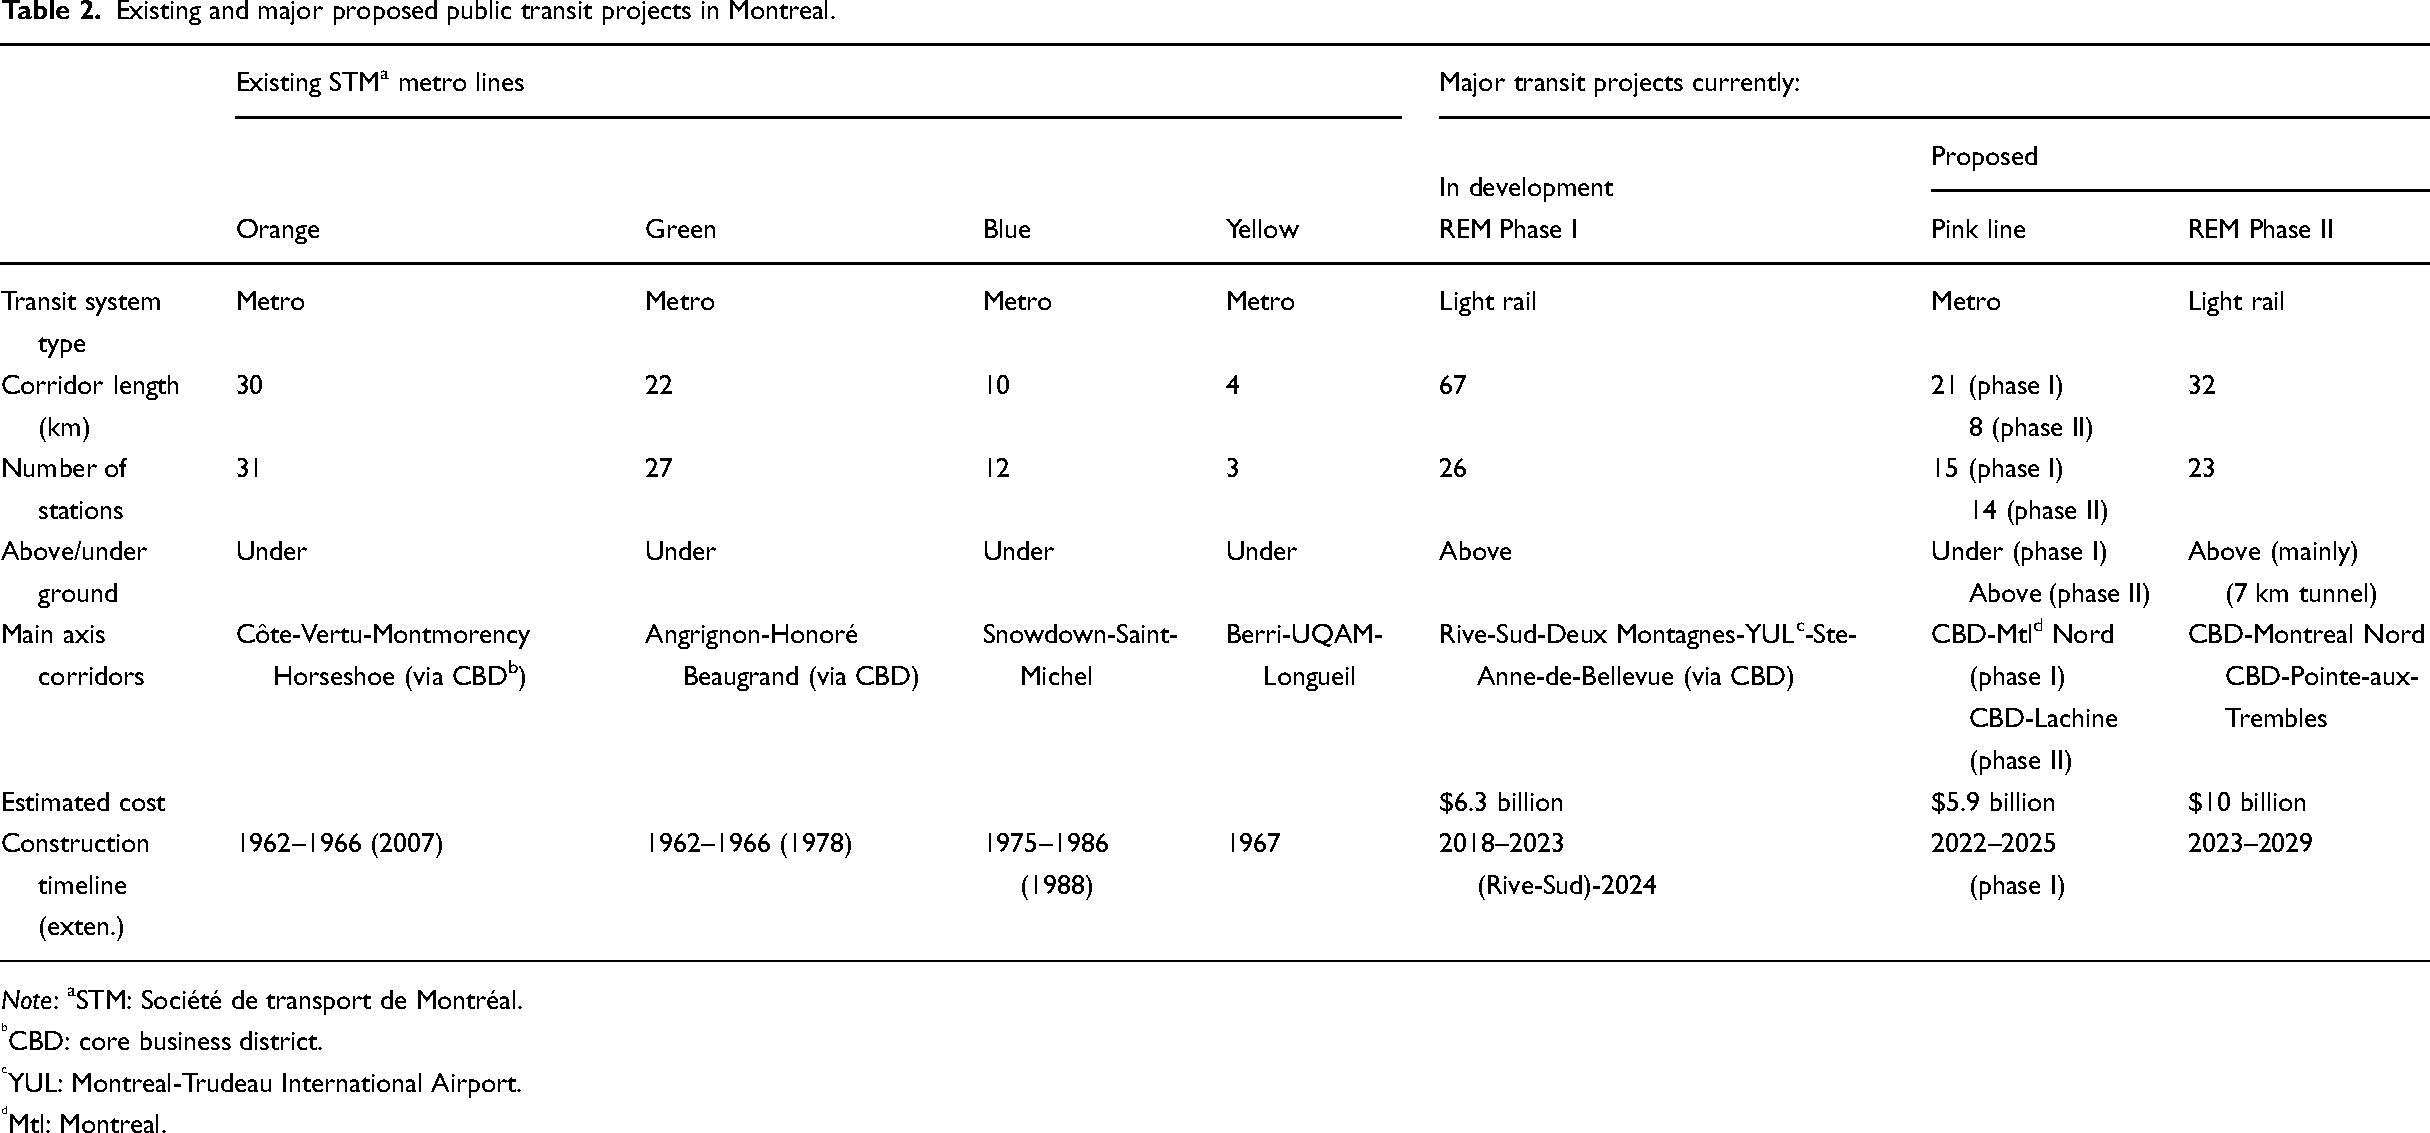
Note: aSTM: Société de transport de Montréal.
CBD: core business district.
YUL: Montreal-Trudeau International Airport.
Mtl: Montreal.
The Pink line would to be developed in two phases (see right-hand side of Table 2). After an initial round of planning and feasibility studies, phase 1 of the project would see the construction of a 21-km tunnel with 15 stations stretching from Montreal Nord down through St-Leonard, Villeray-St-Michel, Parc Extension, Rosemont-La Petite Patrie, and the Plateau to the city's downtown. Construction was originally slated to begin in 2022 with this first segment of the Pink line to be in operation by 2025. Phase 2 of the project would see another 8 km of line (mostly above ground) and 14 stations added from the city's centre heading west through Notre-Dame-de-Grâce and Lachine. Initially pegged at a total cost of US$5.9 billion, the project found support in Quebec City with the Liberal provincial government of the time. However, since the election of the Coalition Avenir Québec (CAQ) in the fall of 2018, it has received a cooler reception, plagued by debates over cost estimates and placed in competition with other CAQ prioritized transportation projects (Chouinard, 2020).
Indeed, with the change of government in 2018, the province's preferred transit expansion option for Montreal is a second automated light rail network that would extend to the east of the city. Known as the REM phase II (or REM de l’Est), it would feature another 32 km of light rail lines added to the phase I's 67 km section already in construction (see Figure 1). This phase II development would include two new branches: one extending to the eastern tip of the island (Pointe-aux-Trembles) and the other to Montreal Nord (northeast). With cost estimates pegged at roughly US$10 billion, the REM de l’Est (Phase II) expansion would constitute the largest ever public transit project in the province's history.
While the REM phase II is the preferred option for provincial authorities, the project has generated much controversy (Teiscera-Lessard, 2021). Questions have been raised about whether or not the REM Phase II meets the transportation and mobility needs of users in eastern Montreal, especially since large segments of the proposed branch lines run in close proximity to existing transit infrastructure (e.g. ∼12 km of the proposed REM Phase II Pointe-aux-Trembles line will run parallel and within < 500 m of the current Green metro line). Concerns have also been raised about the REM's Phase II design, especially in terms of having an elevated track platform system supported by large concrete pillars running through some of the city's most densely populated areas (Bergeron, 2021). Taken as a whole, these issues have also led to broader concerns about who is making the decisions – local planning authorities like the Autorité régionale de transport métropolitain (ARTM) and the Société de transport de Montreal (STM) or Quebec City and the CDPQ-Infra? While the former were created to oversee public transportation planning and integration for the region, they seem to have been sidelined in the more recent decision-making process (Montpetit, 2021). The fall-out from these controversies is such that in May of 2022, the provincial government announced it would shelve the REM phase II expansion project until further feasibility studies are conducted (Radio-Canada, 2022).
It is important to note that we do not seek to establish how the political stars will ultimately align for these two proposed projects. Rather, we are interested in evaluating which of the two, given the planned locations of their respective transit stations, may offer the greatest coverage and accessibility to users living in some of the city's more economically disadvantaged neighbourhoods. By focusing on accessibility and the prioritisation of disadvantaged neighbourhoods in order to reduce inequalities of opportunities, we assess which of the two transit projects (in their current proposed form) has the most merit as a policy tool for greater inclusiveness. The analysis of such infrastructure projects thus presents one lens through which the concept of inclusive growth can be operationalized at the local level for a specific policy intervention (Evenhuis et al., 2021; Waite et al., 2020; Waite and Roy, 2022).
Patterns of income inequality in Montreal
Montreal, like most other large urban centres in the country, has experienced a significant increase in income inequality over the last few decades. With a Gini coefficient of .412, the Montreal region ranked 11th in the nation in terms of its level of inequality in 2016 and third among large metropolitan areas (see Table 3).
Income inequality across major metropolitan areas in Canada, 1981–2016.
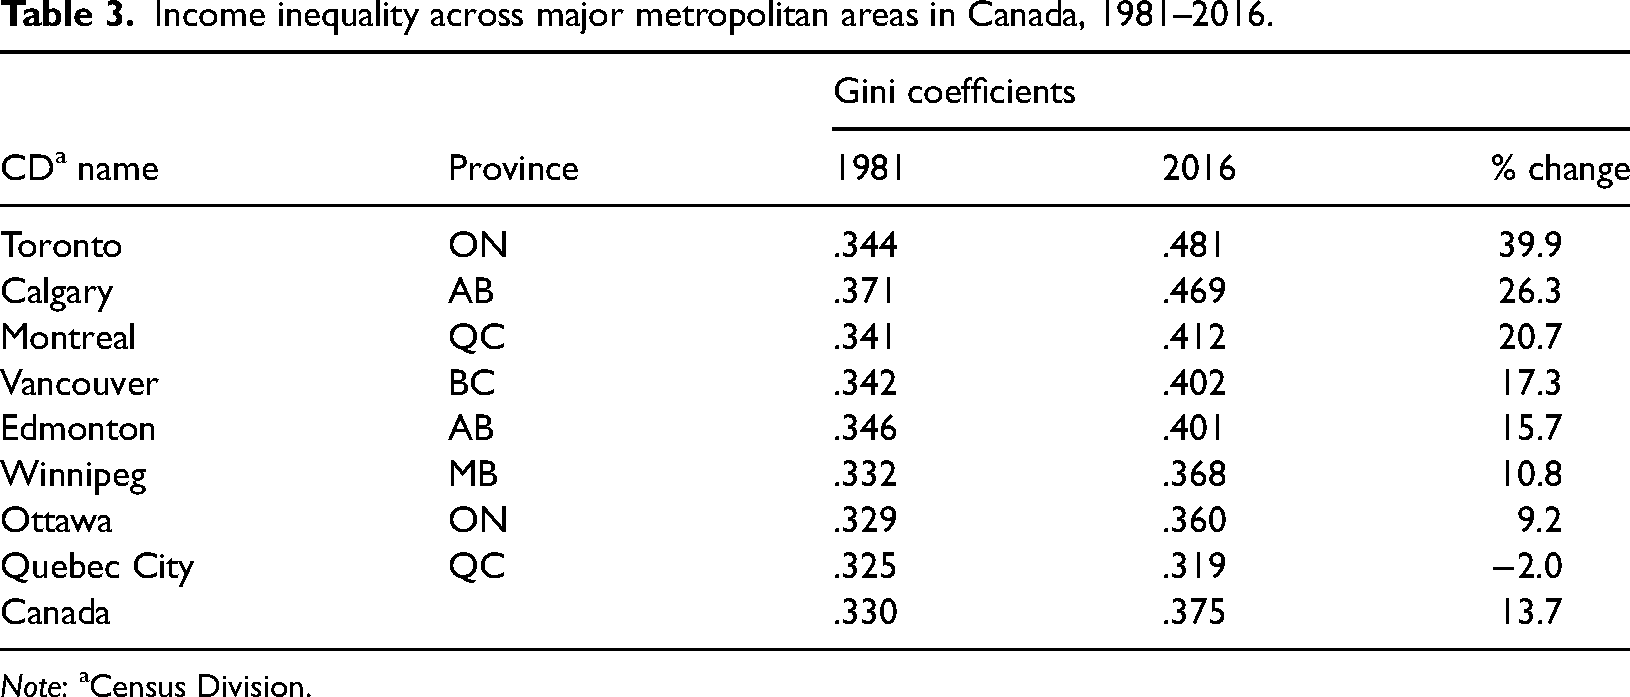
Note: aCensus Division.
While there is a long tradition of studying the spatial distribution of poverty across Montreal (see Apparicio et al., 2007 for an overview), the literature on income differences between neighbourhoods is relatively sparse. Bourne (1989), MacLachlan and Sawada (1997) and Myles et al. (2000) produced some of the earliest analyses tracking the trajectories of neighbourhood inequalities in Canadian cities – including Montreal. Using census tracts as their unit of analysis, their results showed that by the 1980s the distribution of income across neighbourhoods in several of the country's largest metropolitan areas started to become more unequal. Myles et al. (2000) also documented an important rise in economic segregation within Canadian cities, whereby individuals were increasingly sorting themselves into ‘like’ neighbourhoods. In a follow-up study using more recent data, Chen et al. (2012) confirmed this trend and found the rise in spatial economic segregation in Montreal to be particularly pronounced. Charron and Shearmur (2005), Walks (2011) and more recently Leloup and Rose (2020) also have documented the rise of economic segregation in Montreal. The latter study is particularly useful in providing a visual of the spatial patterning of neighbourhood income changes in Montreal over the 1981–2016 period. Adopting a method pioneered by Hulchanski (2007) for Toronto, income changes across census tracts are categorized into three different classes: those (i) gaining ground compared to the Montreal Census metropolitan area (CMA) average, (ii) holding ground or (iii) losing ground. Their findings suggest the ‘sorting effect’ in Montreal is driven primarily by more people finding themselves in neighbourhoods that are gaining ground, that is where the increase in income is at least more than 10% higher – on average – than that of the CMA's. If their results are primarily descriptive in nature, the authors nevertheless conclude that the increase in the sorting process involves important transformations of the socio-spatial structure of Montreal and call for more research on the spatial aspects of neighbourhood inequality. In this article, we propose to push the analysis of neighbourhood inequality in Montreal further by using directional local indicators of spatial associations (LISAs) to explore the spatial interactions and movements of average incomes across census tracts in the city.
Research design
The empirical approach adopted in this article rests on two basic steps. The first is to identify and track the evolution of neighbourhood income disparities over time to gain a better understanding of where the city's most economically disadvantaged areas are located. The second step consists of a buffer analysis of the transit stations for both proposed infrastructure projects to determine which of the two would provide more potential coverage in terms of accessibility to work and mobility. In the section that follows, we elaborate on the main methodological aspects involved in each of these steps.
Data and neighbourhood disparities
The datasets used for this analysis are constructed from the 20% long-form samples of the 1981 and 2016 Census of Population. To examine changes in incomes across neighbourhoods in the Montreal CMA, our primary unit of analysis are census tracts (CTs). Census tracts typically have a population of 2500–10,000 and are the preferred units for neighbourhood studies because their boundaries are delineated by local specialists (planners, health and social workers), they follow easily recognizable physical features and as an entity, are considered relatively homogeneous in terms of socio-economic characteristics.
Although their boundaries are relatively stable over time, census tracts may split when their population exceeds 10,000 which poses challenges for longitudinal comparisons, especially over longer periods of time since the number of units to analyse can vary significantly. In the case of Montreal, the number of census tracts in the CMA increased from 669 in 1981 to 970 in 2016. To get around this issue, we re-aggregated the split census tracts to their original 1981 boundaries.
Neighbourhood inequalities are based on income disparities between census tracts with incomes defined as the median value of total income for all resident individuals. In the Census, total income is measured on a pre-tax basis and includes market-based incomes (i.e. wages and salaries, investment and private retirement incomes) as well as government transfers (i.e. old age security, public pension plans, employment insurance and other social assistance benefits). Note that we use the provincial Consumer Price Index to deflate total income figures to $2002 values.
In order to examine changes in the spatial configurations of neighbourhood incomes across the city, we use directional LISAs. Originally developed by Rey et al. (2011), directional LISAs have been widely adopted to study the dynamics of regional patterns of inequality (Ayouba et al., 2020; Breau et al., 2020; Fiaschi et al., 2018; He et al., 2017; Sastré Gutiérrez and Rey, 2013). Compared to most existing empirical studies of income disparities, which are typically aspatial and static (see Morrill, 1991 for an excellent discussion of this), directional LISAs allow researchers to incorporate the dynamic aspects of changes in income occurring over time as well as across space. In other words, by simultaneously focusing on the change in a unit of analysis and its spatial lag, directional LISAs have the advantage of being able to differentiate spatial diffusion from persistent spatial dependence (Kang, 2022).
Breau et al. (2018), in a pilot study using data from 1991 to 2006, applied directional LISAs to examine trajectories of neighbourhood incomes across Canada's eight largest CMAs. Their findings suggested that in five of these cities, including Montreal, the predominant pattern observed over the period of study was one of increasing spatial polarization between higher- and lower-income neighbourhoods. With a span of 35 years, the current study provides a much longer horizon with which to examine changes in the spatial distribution of neighbourhood incomes in Montreal.
Transit station buffer zones
Once we ascertain changes in the distribution of incomes and map out clusters of LL neighbourhood incomes across the city, our next task is to estimate what percentage of these census tracts will be disserved by the proposed transit line investments. To do so, we focus on the 2016 LISA maps and identify the neighbourhoods that fall within a defined proximity of the proposed 29 new metro stations for the Pink line and 23 transit stations for the REM Phase II using a simple Euclidean buffer.
The location information for the proposed metro stations of the Pink line comes from Projet Montreal planning documents (as reported by Radio Canada, 2017) and is recorded as the point value at the nearest street intersection or major point of interest. Similarly, the location of REM phase II (de l’Est) stations is derived from a map produced by CDPQ-Infra, 1 with stations later georeferenced based on points taken at major street intersections.
Delineating service areas (also known as buffer zones) around public transit stations in cities has a long history in transportation and planning studies (El-Geneidy et al., 2014; O'Sullivan and Morrall, 1996). The distance a person typically chooses to walk to a transit station is conditioned primarily by the mode of transportation to be used and the quality of the walking environment itself. In the case of Montreal, work by El-Geneidy et al. (2014) shows that the mean value of walking from home to metro stations across the island is 565 m (with a standard deviation of 297 m). Given this value, and considering that Euclidean buffers tend to overestimate service areas, we adopt two different buffer ranges of 400 and 800 m to define neighbourhoods that are within close proximity of metro stations. In cases where some of these transit stations are located at the border of different census tracts, we include all tracts that intersect with a station within the buffer zone. 2
Results
Neighbourhood trajectories of income disparities
The first research question to answer relates to how the spatial distribution of income across neighbourhoods in Montreal has changed over time. To do so, we begin by examining Moran's I scatterplots of median total income in 1981 and 2016 (see left-side of Figure 2). 3 In both cases, the Moran's I values are statistically significant and point to the fact that neighbourhood incomes are positively spatially autocorrolated. Each scatterplot is further divided into four quadrants that tell us something about the type of spatial association between census tracts and their neighbours. Of most interest are the top right-hand (NE) and bottom left-hand (SW) quadrants. The former shows tracts with higher than average median incomes surrounded by neighbouring tracts with similarly higher than average median incomes (i.e. high-high (HH) income tracts) while the latter shows census tracts with lower than average median incomes surrounded by neighbouring tracts that also have lower than average incomes (i.e. LL incomes). The top left-hand (NW) and bottom right-hand quadrants (SE) are referred to as the low-high and high-low spatial outliers corresponding to census tracts with lower (higher) than average median incomes surrounded by higher (lower) than average median incomes.
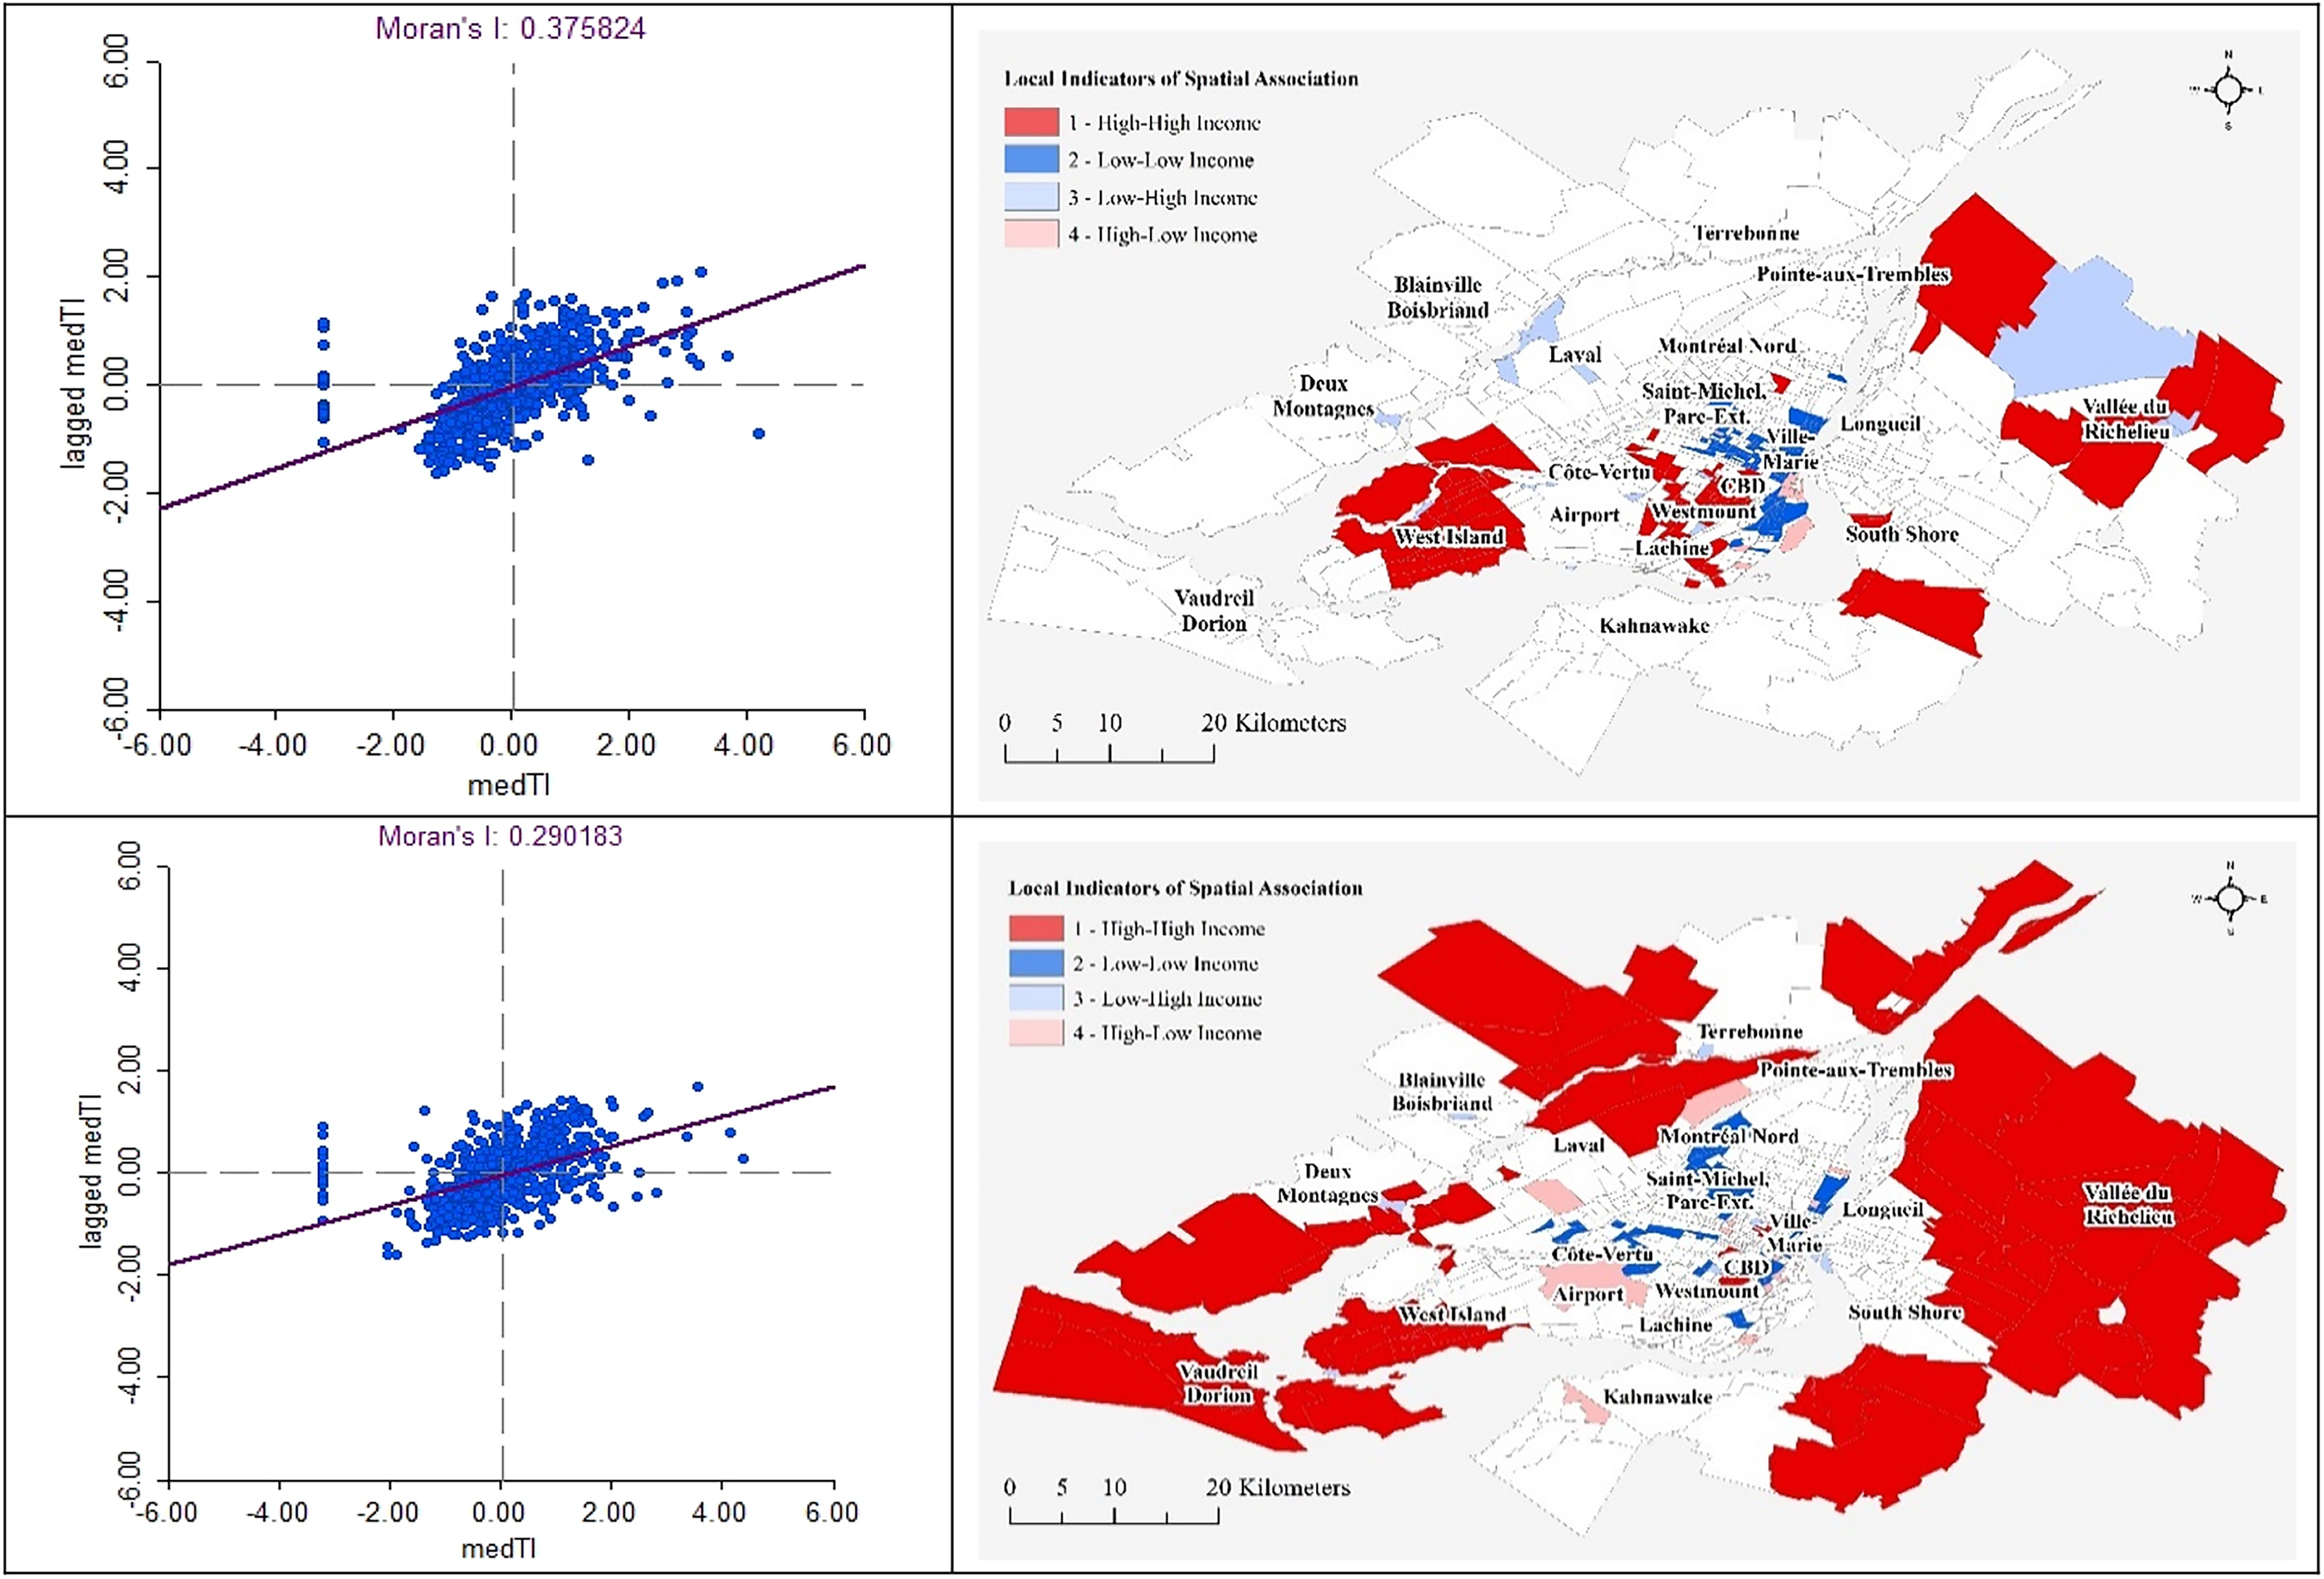
Moran's I and local indicators of spatial association (LISA) maps of median total income, 1981 (top) and 2016 (bottom).
The right-side of Figure 2 shows the local cluster maps that correspond to the scatterplot quadrants described above. By comparing both maps for 1981 and 2016, we see important changes in the spatial morphology of HH and LL clusters across the region. In 1981, HH clusters (shown in dark red) were mainly concentrated in the centre of the Island, in-and-around the Westmount and Outremont neighbourhoods, with other visible pockets of HH clusters in the West Island and on the South shore. LL clusters (dark blue) were also concentrated in the downtown area, especially in parts of Ville-Marie along the port (up to Viauville), in Verdun and the city's Sud-Ouest district. By 2016, the spatial distribution of HH income clusters changes significantly. While we still find the traditional pockets of HH incomes in Westmount, parts of Outremont and the Plateau, the most visible change is the outward push of HH clusters in the rapidly expanding neighbourhoods of the 450 suburban belt: to the North in Laval and Blainville-Boisbriand, West in the Lac des Deux-Montagnes, Vaudreuil-Dorion and Ile Perrôt regions, and on the South shore in the Roussillon and Vallée du Richelieu areas. This reflects the changes in the spatial income gradient earlier described by Charron and Shearmur (2005) and Leloup et al. (2016). LL clusters have also diffused away from the city center, stretching North of the ‘Mountain’ thru parts of Côte-des-Neiges, up to Ahuntsic-Cartierville, and especially North-East thru the Villeray, St-Michel, Parc Extension and Montréal-Nord neighbourhoods. The LL clusters in the Ville-Marie-Hochelaga-Maisonneuve corridor along the port area are also still visible. These latter two LL income pockets, which contain many of the city's most ethnically and racially diverse populations (also amongst the most highly impacted by the COVID-19 pandemic, see Santé Montréal, 2020), will be the focus of our second research question below.
While the comparative static exercise conducted above provides a first set of insights as to the broader trends in the spatial dynamics of neighbourhood incomes, directional LISA plots offer a more formal way of linking the Moran's scatterplots over time and tracking changes across census tracts and their neighbours in the distribution of incomes using movement vectors (see Rey et al., 2011). In Figure 3, the left-hand side shows the non-standardized movement vectors for each individual trajectory of a tract from 1981 to 2016. The length of each vector indicates the magnitude of change in neighbourhood incomes over time with the direction of that change given by the arrowhead at the end of each vector. There is much heterogeneity in the vector movements presented in the non-standardized directional plot, both within and across quadrants. Standardizing each vector to its origin (in 1981) simplifies the visualization and interpretation of changes in neighbourhood incomes (see right-hand side of Figure 3). Here, we see that the bulk of vectors tend to fall within the top right-hand side (NE) and bottom left-hand side (SW) quadrants. Compared to the standard Moran's scatterplot described earlier, the interpretation of movements within these quadrants is slightly different since they represent co-movements between census tracts and their neighbours. The NE quadrant shows positive co-movements or tracts that have experienced relative gains along with their neighbours in the distribution of incomes (i.e., both are moving upwards). In contrast, the SW quadrant shows tracts whose median incomes have declined over time surrounded by neighbouring tracts who have also experienced relative declines in median incomes (i.e., CTs and surrounding CTs that are moving in a downward direction).
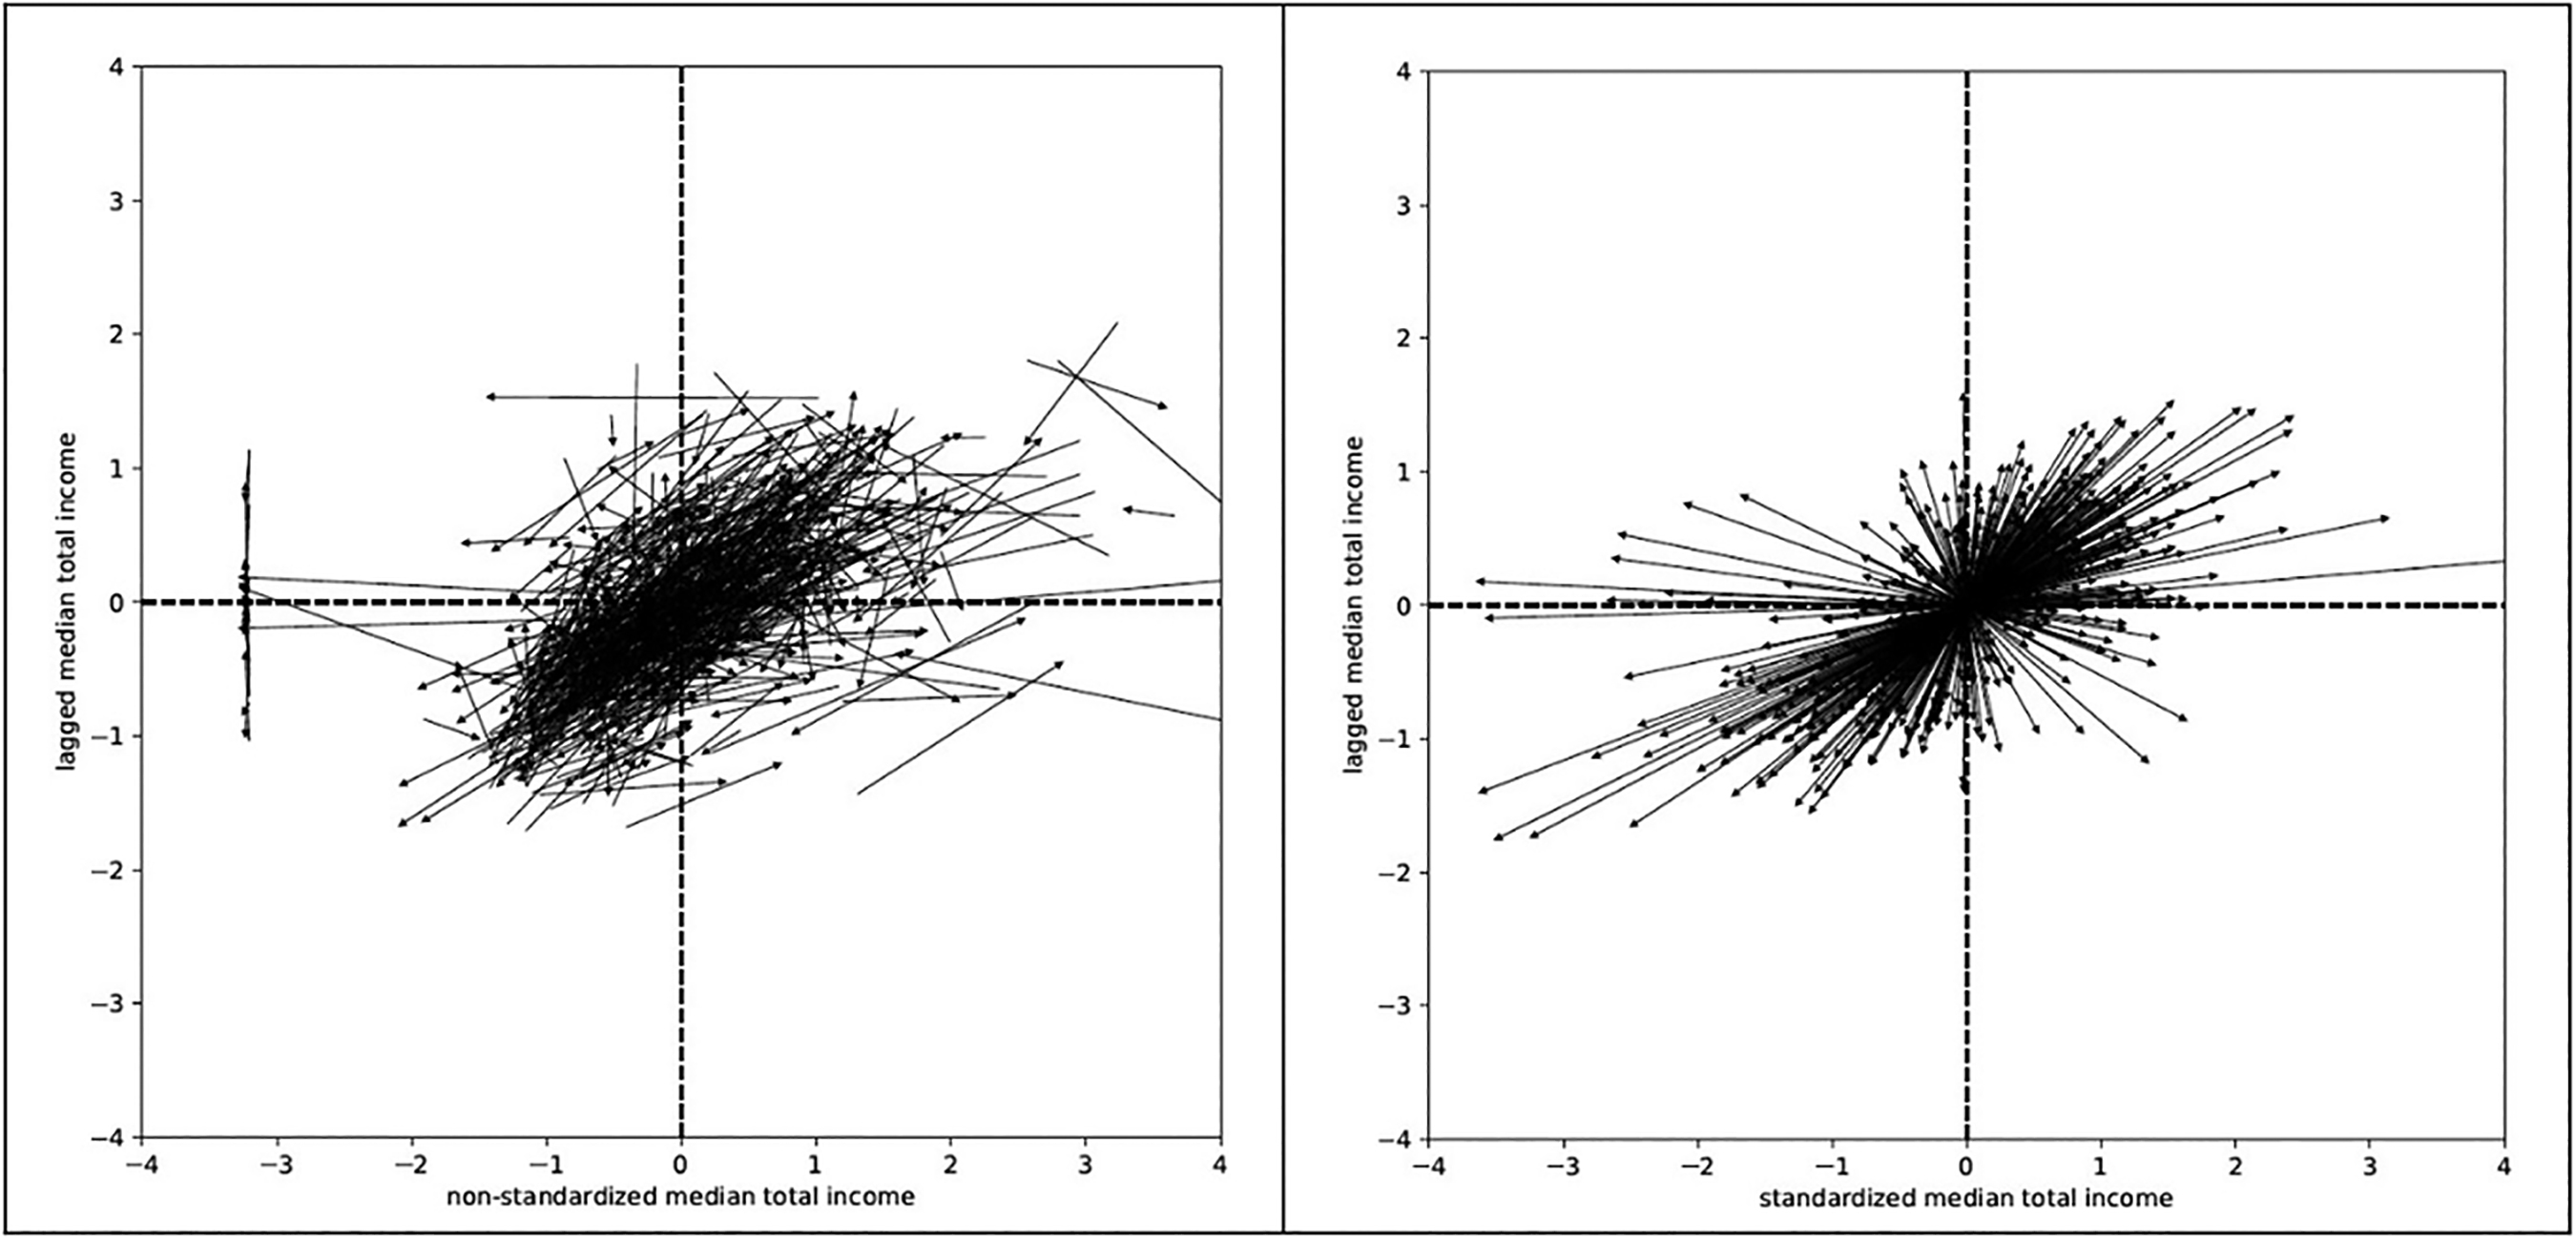
Directional Moran scatterplots of neighbourhood incomes: (a) non-standardized and (b) standardized.
Figure 4 presents a rose diagram that more neatly summarizes the movements extracted in Figure 3 across eight segments. It is easier to see here that the relative frequency of movement vectors is highly concentrated in the NE and SW quadrants. In total, there are 272 census tracts that fall within the NE quadrant (i.e. experiencing positive co-movements). Taken on their own, this would suggest there has been spatial convergence in terms of neighbourhood income disparities as several tracts have moved upwards in the distribution (Rey et al., 2011). The CTs identified as part of the 450 suburban belt fall into this category. That said, with 252 tracts experiencing negative co-movements in the SW quadrant, the number of neighbourhoods moving downwards or losing ground in the distribution is almost the same such that in the end, we have offsetting trajectories that suggest greater spatial polarization of neighbourhood incomes across the greater Montreal region.
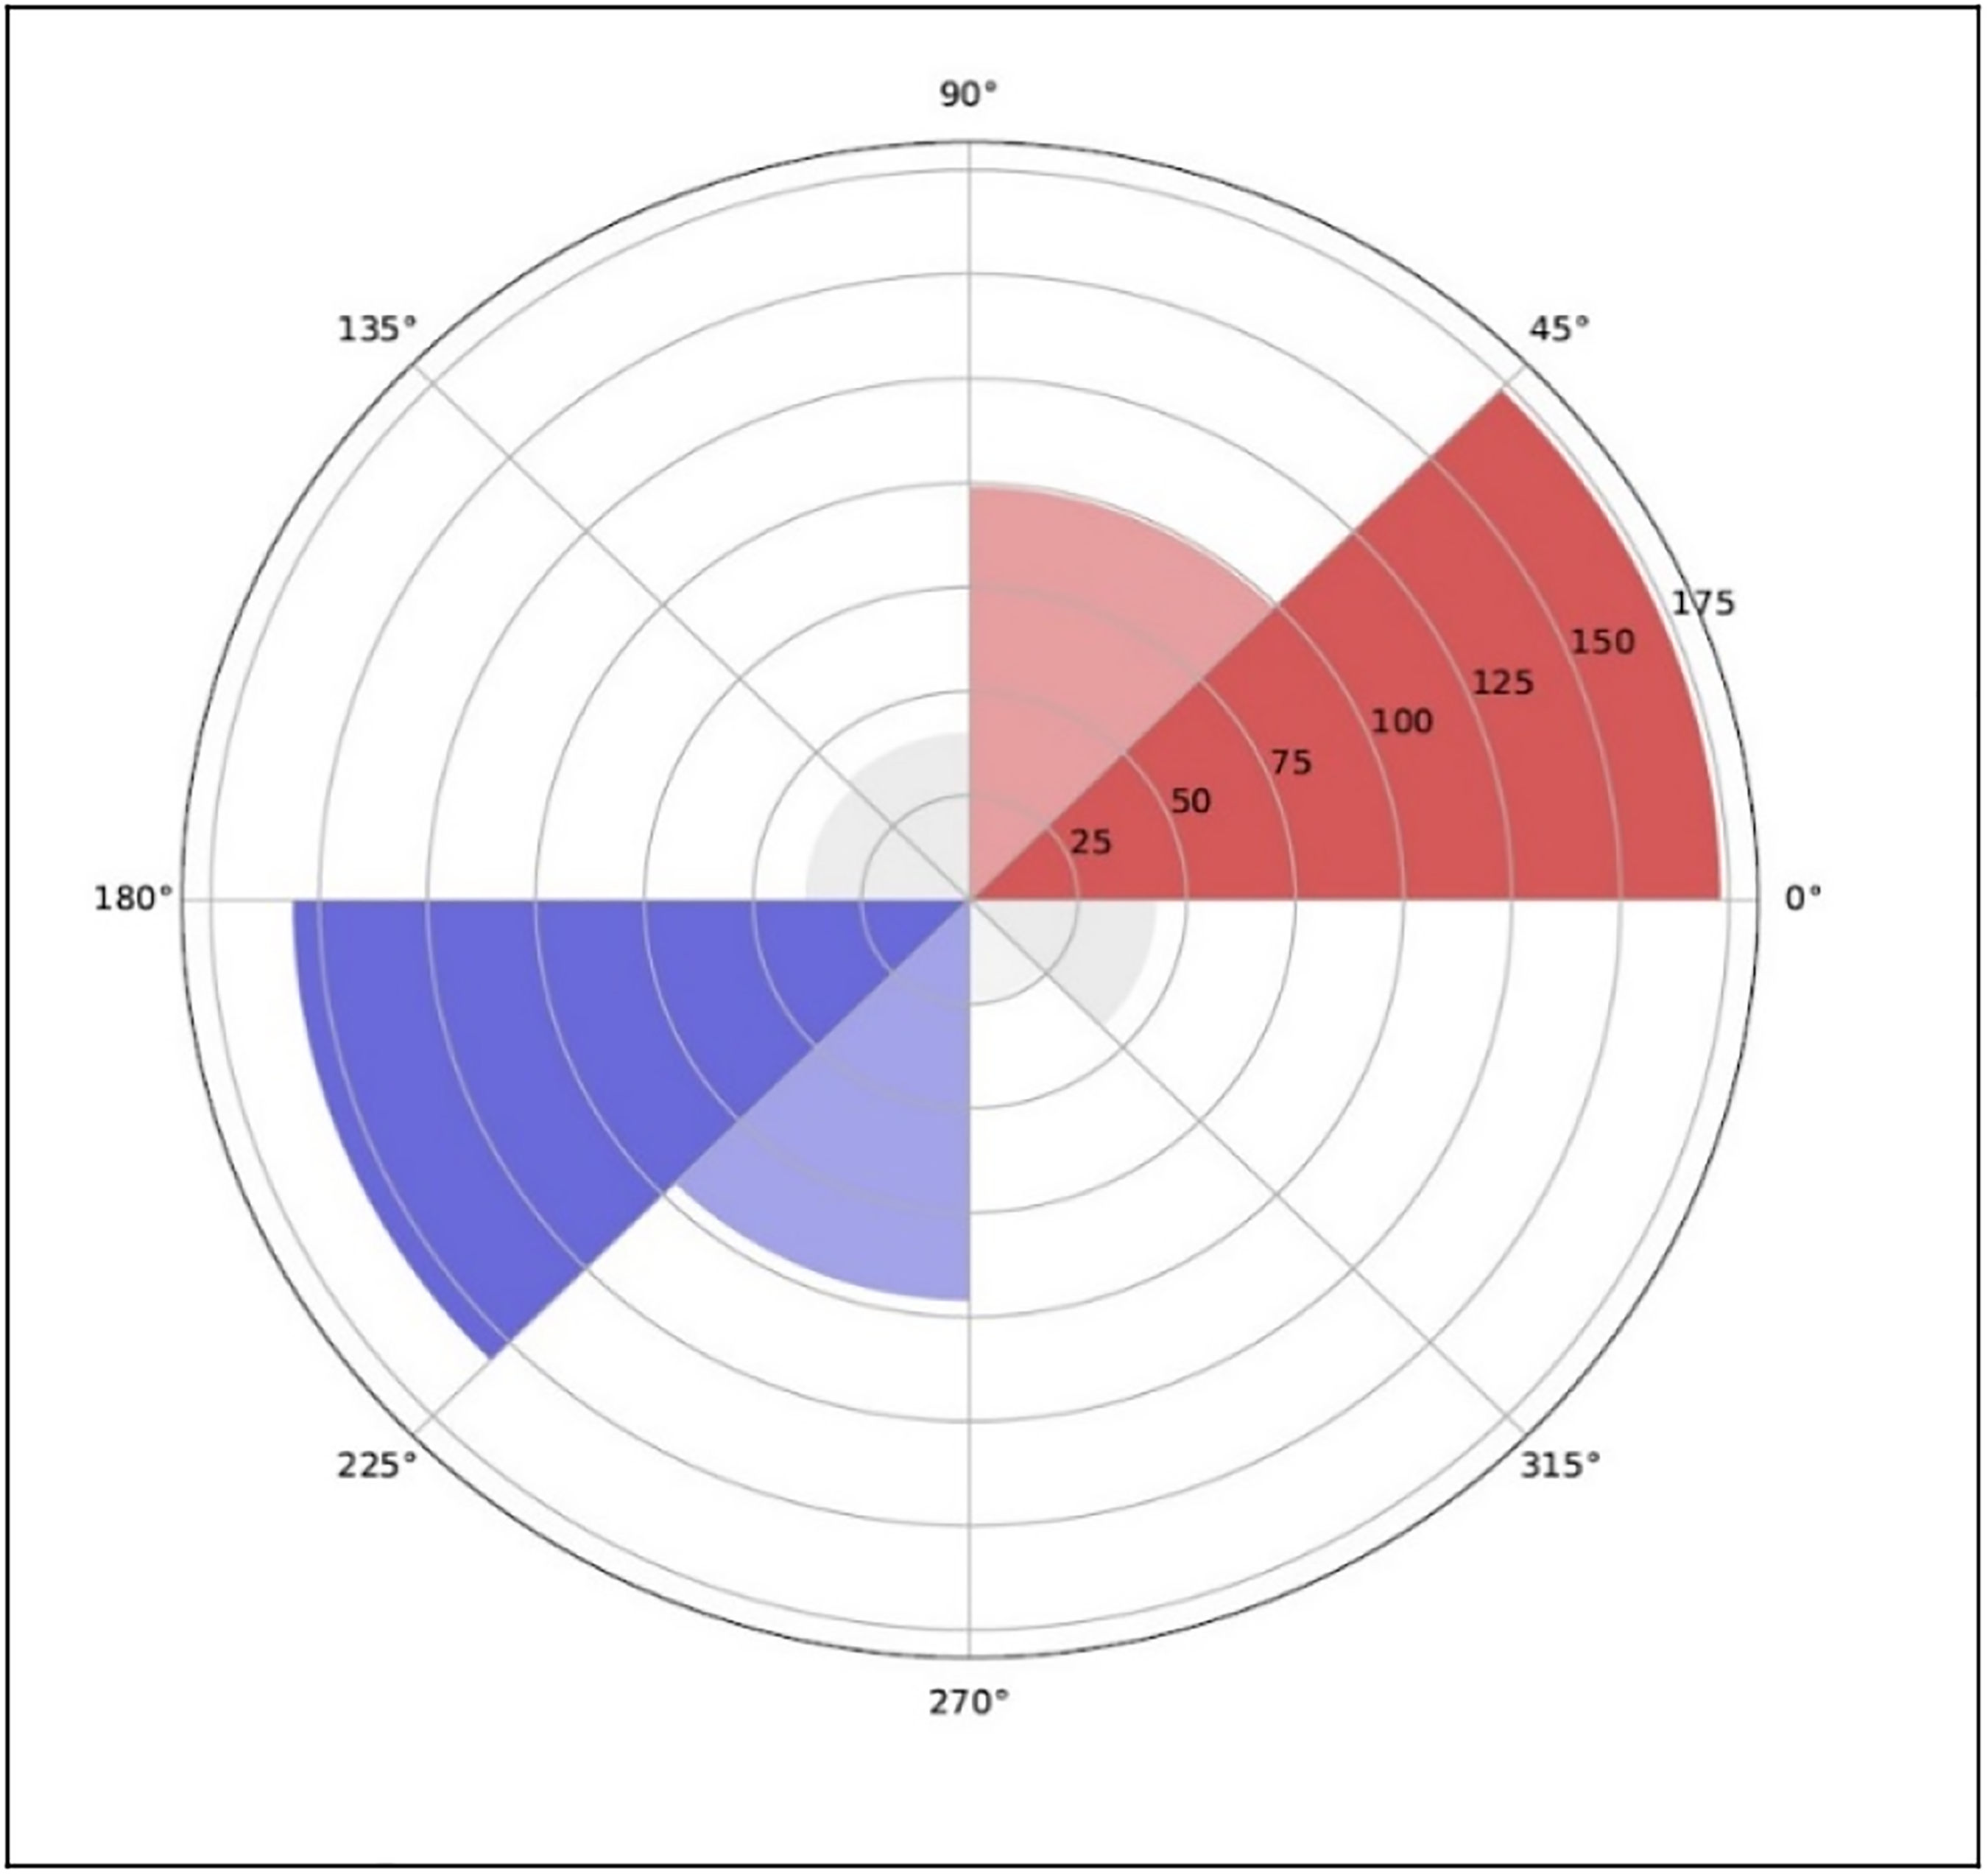
Rose diagrams of neighbourhood inequality.
Buffer analysis
Having examined the evolution of neighbourhood income disparities, we now turn our attention to the second research question to assess the potential of the two proposed public transit infrastructure projects and see which one may provide greater access to economically disadvantaged neighbourhoods. Again, for the purposes of our study, we define these as the pockets of LL income neighbourhoods identified in the previous section.
Figure 5 provides a close-up of these neighbourhoods across the Island with (i) the STM's existing metro grid (Orange, Green, Blue and Yellow lines) and the REM's Phase I line linking the South shore to the airport and the West Island (with initial segments of this line becoming operational in 2023) overlaid to the map, along with the (ii) proposed Pink line metro expansion and (iii) the REM de l’Est (Phase II). For the latter two lines, transit stations are clearly identified along with their 400 m (left-hand side) and 800 m (right-hand side) buffers. The portion of each proposed transit lines to be developed underground is also identified as a dashed line on the maps.
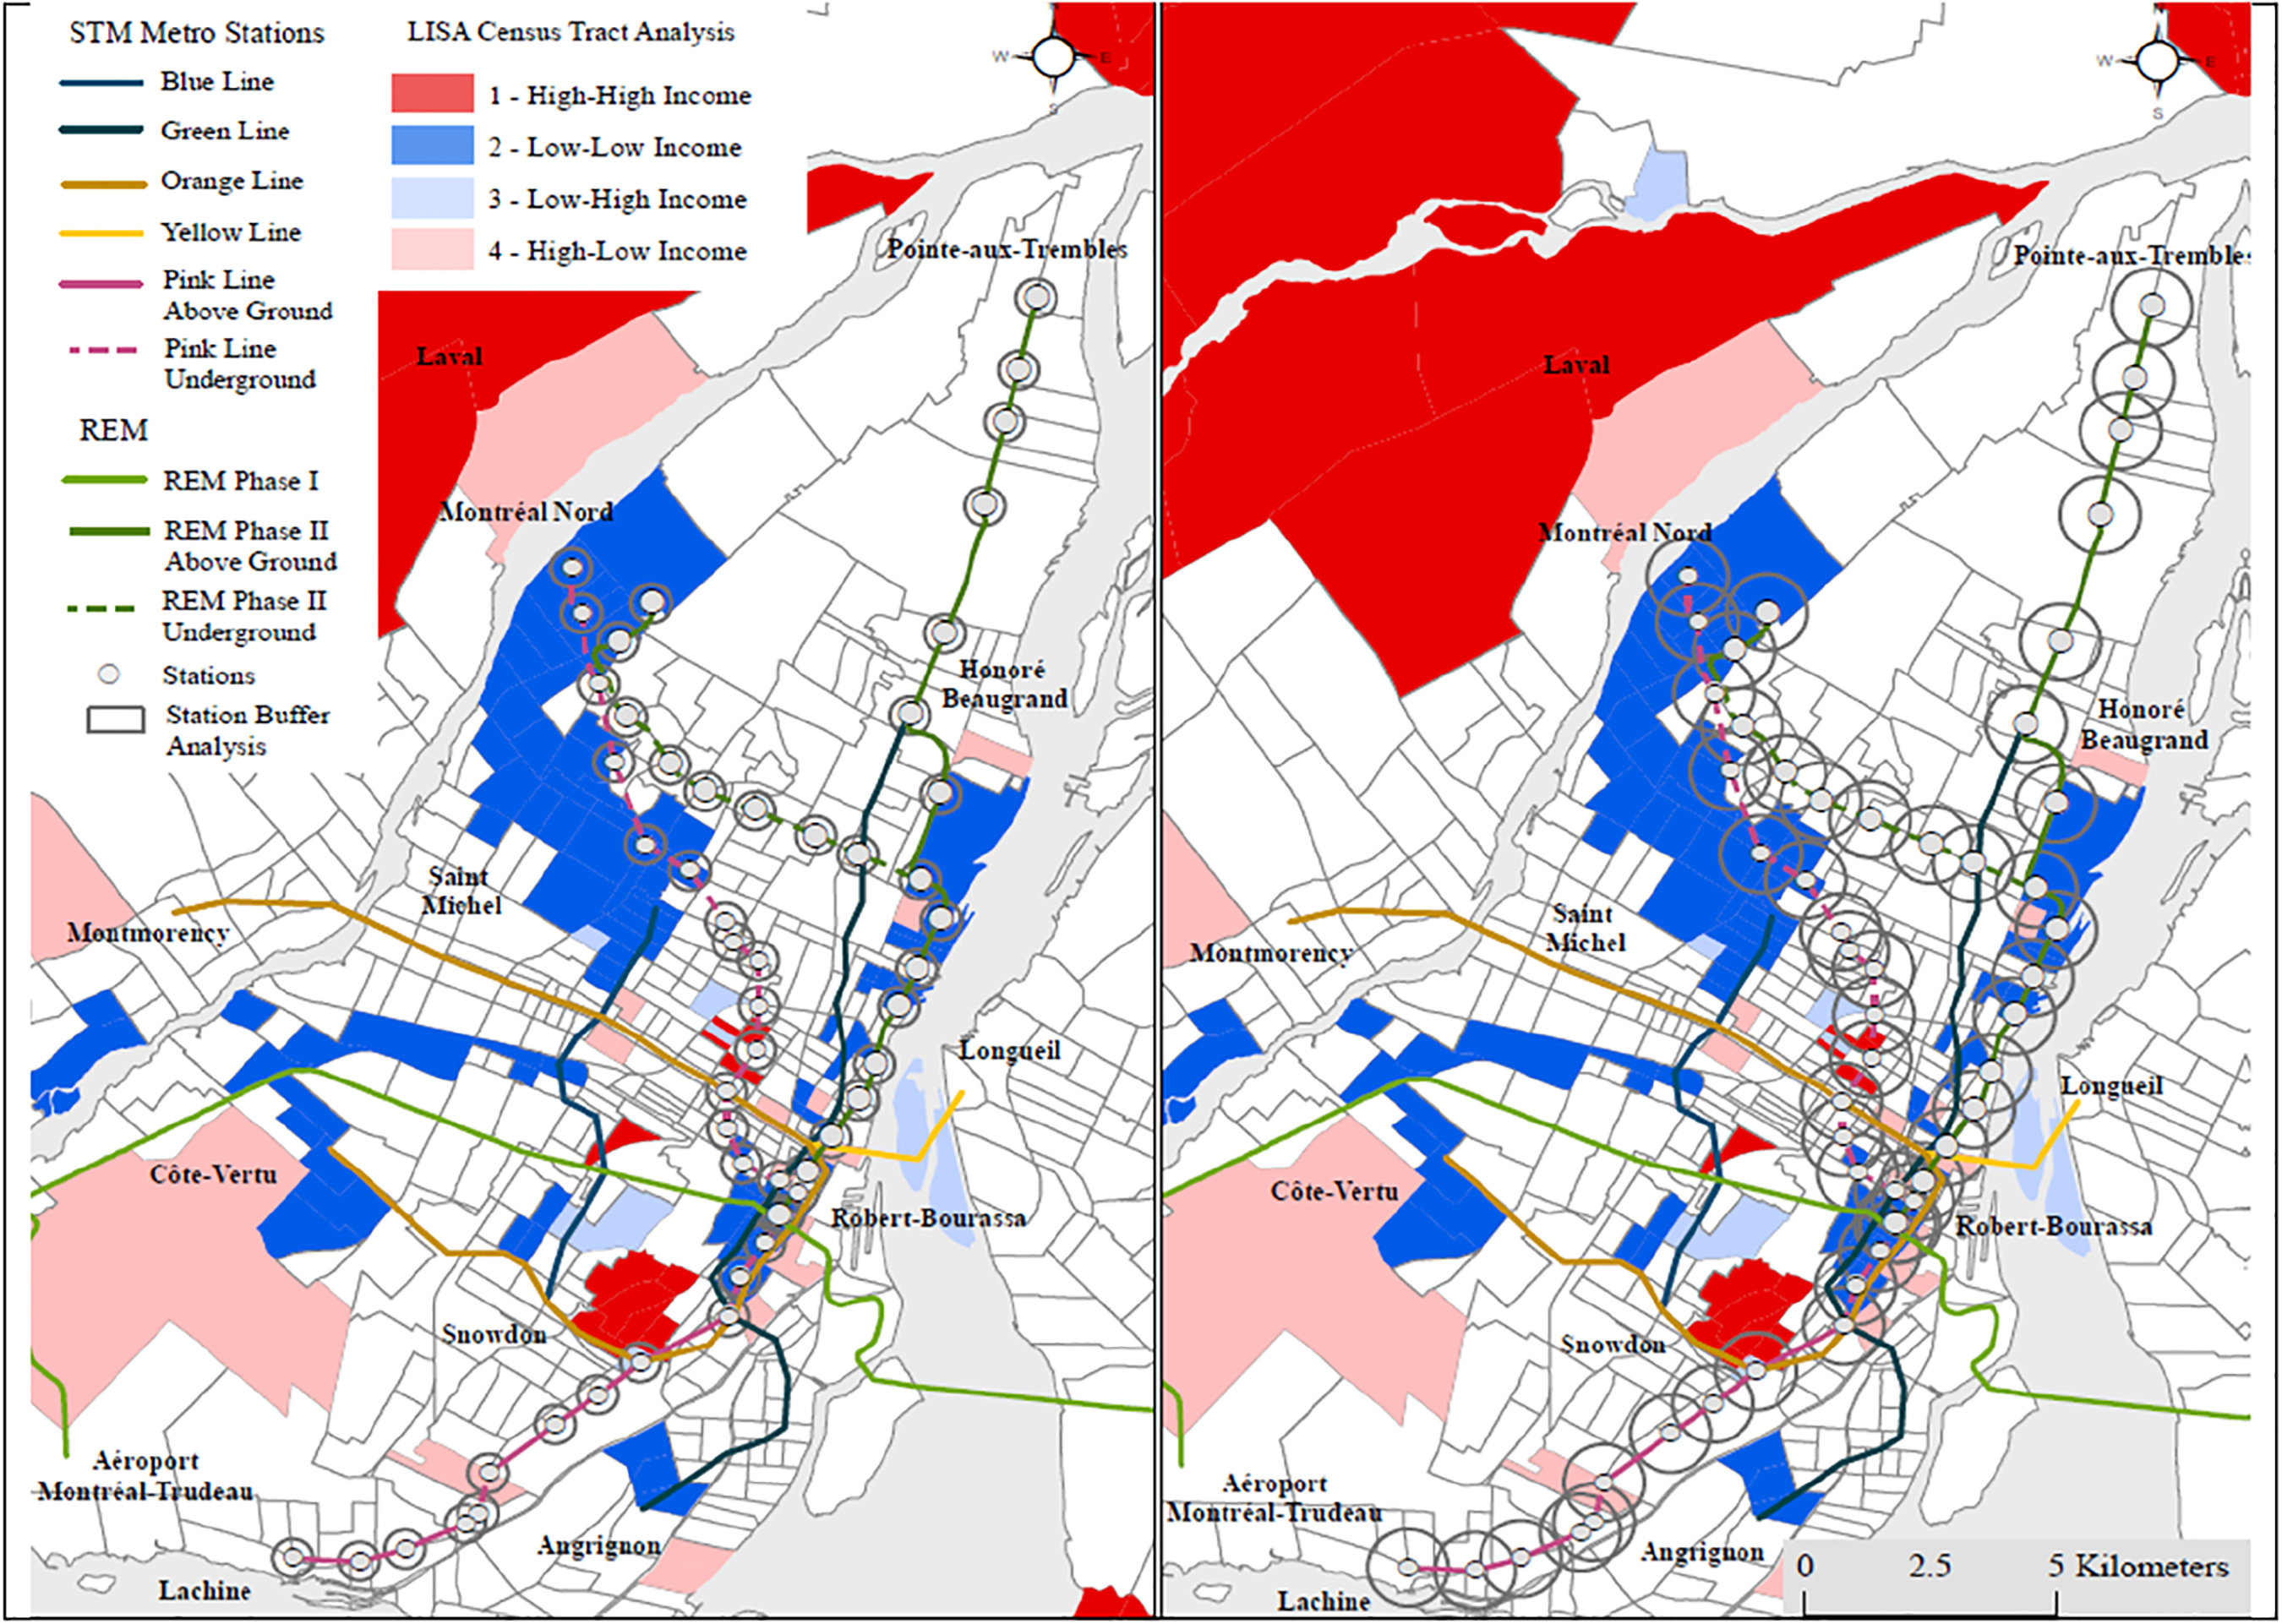
Low-low income neighbourhoods and proposed transit stations for the Pink and REM de l’Est transit projects with (a) 400 m buffers, (b) 800 m buffers.
The close parallel between the REM's Phase II development and the existing Green metro line in the Ville-Marie-Hochelaga-Maisonneuve corridor stretching north-eastward is clearly visible here. At first glance, it is also evident that many of the proposed stations along the REM's Phase II line running North towards the CEGEP Marie-Victorin in a tunnel section beneath Lacordaire Boulevard are not located in LL income neighbourhoods, nor are the six most eastern stations on its Pointe-aux-Trembles branch. In contrast, several of the Pink line stations that extend to the St-Michel, Villeray, Parc Extension and Montreal Nord neighbourhoods overlap with the LL income clusters identified.
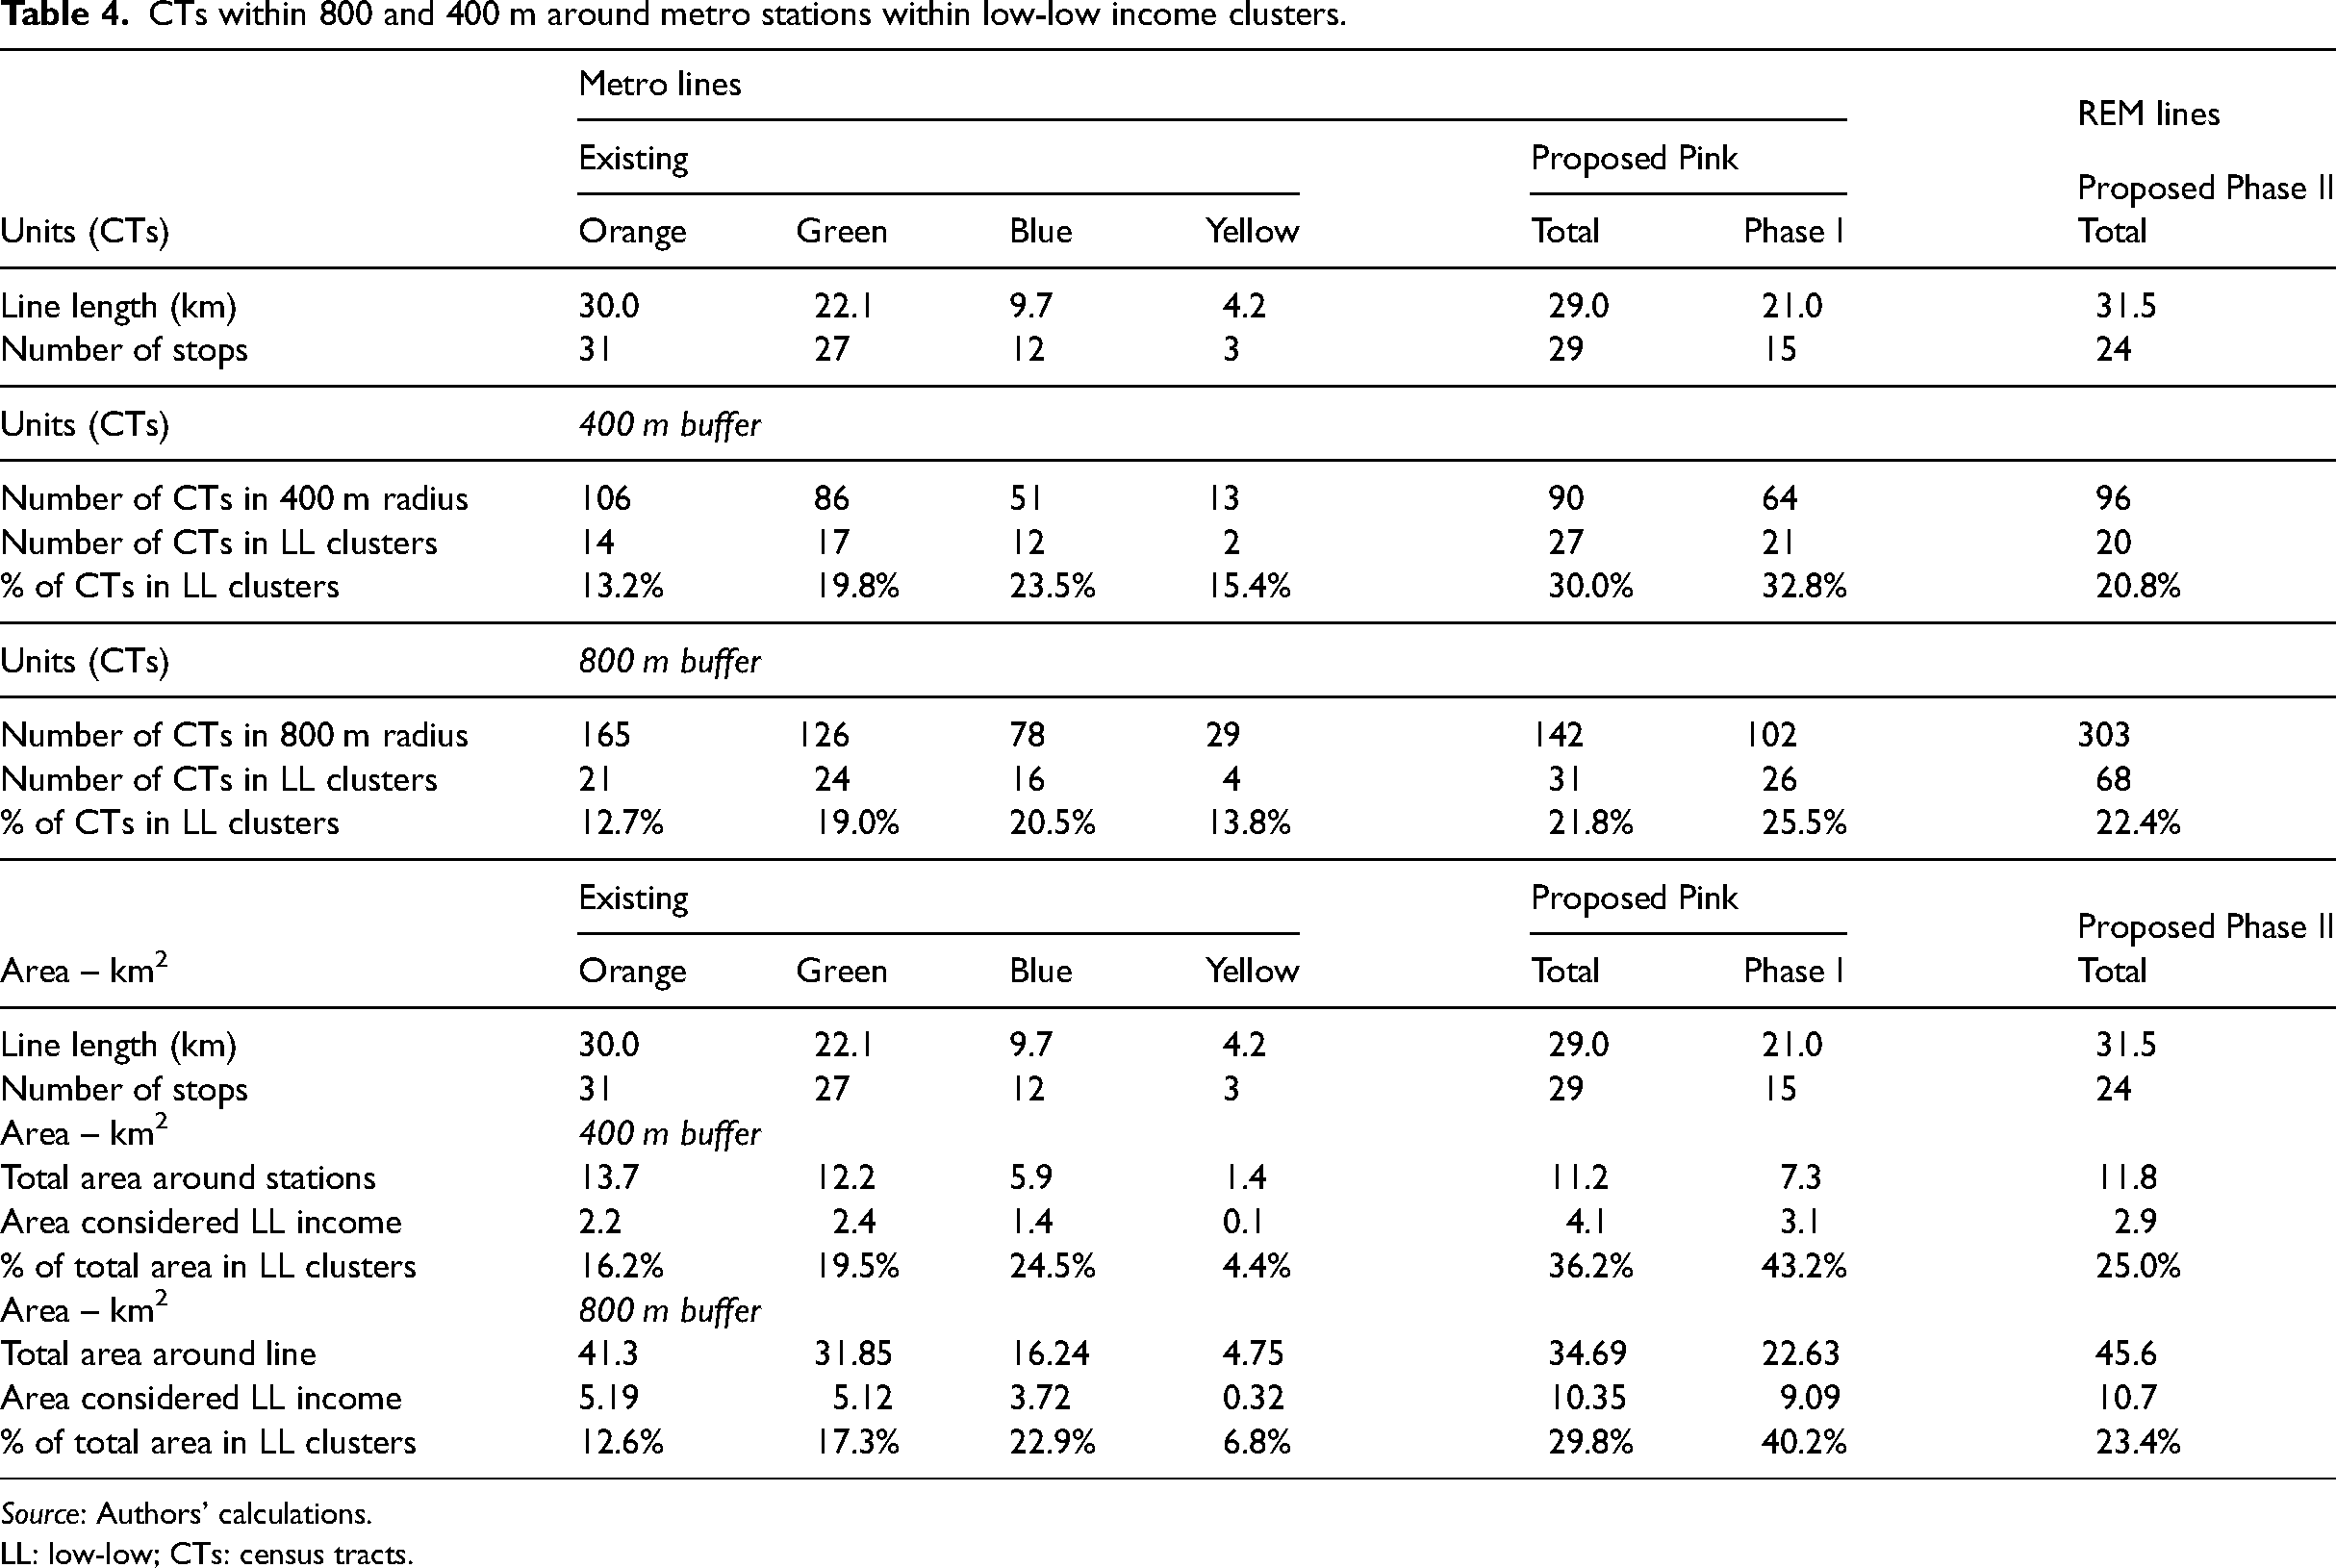
To investigate how the location of the proposed transit stations intersects with LL income clusters, Table 4 presents the findings for the buffer analysis. The results are organized (i) by number of census tract units that are selected within each buffer around a transit station (using either a 400 m or 800 m buffer) and (ii) based on the total area (in km2) captured (or serviced) by each station's buffer. In both cases, the number of LL census tracts (or area) covered is divided by the total number of census tracts (or area) captured by the buffer analysis to determine a relative or percentage based measure of census tracts (area) in LL clusters. For comparative purposes, we also include the results of the buffer analysis for the existing metro (Orange, Green, Blue and Yellow) lines in addition to the proposed Pink line (total and Phase I) and REM Phase II projects.
CTs within 800 and 400 m around metro stations within low-low income clusters.
Source: Authors’ calculations.
LL: low-low; CTs: census tracts.
The first impressions described above are confirmed by the findings reported in Table 4. Across all indicators – with only one exception – the proposed Pink line (especially in its Phase I section extending from the CBD to Montreal Nord) offers clear benefits over the REM Phase II in terms of the location of its transit stations being more accessible to individuals living in LL income neighbourhoods. The buffer analysis for the more selective 400 m distance threshold shows that 30% to 33% of census tract units in LL clusters would benefit from the location of proposed Pink line transit stations, compared to 21% for the REM Phase II project. In terms of the total area covered around the proposed transit stations, it increases to 36%–43% for the Pink line compared to 25% for the REM Phase II.
Results based on the use of the 800 m buffer confirm this, though the coverage rates are slightly lower (which is to be expected since the capture basins for the selected features are themselves much wider) and the percentage of CTs in LL clusters for the total Pink line is essentially the same as that of the REM Phase II (the 14 stations of the Pink line's Phase II development stretching westwards do not, for the most part, fall into LL income clusters). Overall, from the perspective of inclusive growth policies, the Pink line – as currently proposed – is the project offering the most potential in terms of transit accessibility by prioritizing economically challenged neighbourhoods.
Compared to the existing metro infrastructure, the Orange and Green lines are relatively similar in terms of their length and number of stations. Both proposed transit projects, however, appear to provide greater accessibility and coverage in LL income clusters. It is important to note the results for the REM Phase II stations are broadly similar to those of the existing Green line. This is perhaps not surprising considering the overlap between the two. Again, the findings for the Pink line stations suggest that it would be the most inclusive choice in terms of public transit infrastructure expansion.
Conclusion
Over the last decade, the inclusive growth agenda has gained significant momentum across OECD countries (Lee, 2019) and it is increasingly shaping metropolitan-level policy discourse, especially in terms of local transportation networks and infrastructure projects (Hughes and Lupton, 2021; Joy and Vogel, 2021). As a city, Montreal was one of the first to sign-on to the OECD's ‘inclusive cities campaign’ back in 2016. Since then, there has been much debate among practitioners and policymakers as to how large transit infrastructure projects could be used to improve accessibility in economically disadvantaged neighbourhoods across the city.
In this article, we first examine changes in the evolution of neighbourhood income disparities over the 1981–2016 period. Directional measures of spatial association show there is a greater spatial polarization of income trajectories across neighbourhoods, with the bulk of census tracts (and their spatial lags or neighbours) either experiencing relative (i) gains or (ii) losses in the income distribution, similar to the ‘pulling apart’ effect previously described in Breau et al. (2018). Roughly half of the neighbourhoods that are identified as part of LL income clusters are in the city's North and Northeast boroughs, which are currently underserved in terms of public metro and rail transit systems.
Based on this diagnostic, we assess two recently proposed major transit infrastructure investment projects, the Pink line metro expansion and the REM Phase II (de l’Est), to see which one, in its current form, may offer the most potential in terms of greater transit accessibility to economically challenged neighbourhoods. Results from our 400 m buffer analysis suggest between 30% and 33% of all CT units in LL income clusters would benefit from the location of the proposed Pink line stations compared to only 21% of stations for the REM Phase II project. Findings from our 800 m buffer analysis confirm the Pink line's advantages, though coverage rates are slightly lower.
While it is important to remind the reader that our analysis focuses on the location of the proposed transit stations, and not on the design, engineering or cost aspects of the projects, it appears to us that the Pink line offers certain advantages from a social justice and inclusive growth policy perspective. Given these findings, and considering that both proposed projects are still in their planning and feasibility stages, what is not clear is why the REM's Phase II project appears to be the favoured approach of provincial decision makers. Such tensions bare some resemblance to the multi-scalar government and agency fault lines recently documented by Waite and Roy (2022) in their case study of inclusive growth policies being rolled-out across four Scottish cities. At the very least, we argue that should the REM's Phase II infrastructure project (or some eventually revised version of it) end up being adopted, planners should revisit the choice of location for transit stations in order to reach a broader proportion of the LL income neighbourhood clusters identified through this article. This should also be done in closer consultation with the local actors and communities most affected by these choices. In fact, the need to consult local populations (e.g. via community forums) should be part and parcel of developing an inclusive growth policy framework (Waite et al., 2020).
It is also important to note that our analysis focused on the potential benefits inherent in increased access to transit. As mentioned earlier, improvements in transit infrastructure can also place additional burdens on neighbourhoods in the form of increased housing prices and possible displacement. These possible negative impacts need to be monitored to ensure that the benefits of transit investment are equitably distributed.
Footnotes
Acknowledgements
We thank participants at the 2019 annual meetings of the Association of American Geographers in Washington (D.C.) for their comments on an early version of this paper. Financial support was provided by the Social Sciences and Humanities Research Council of Canada and McGill's Sustainability Systems Initiatives. Thanks also to the Clark family for a quiet week of writing by the lake. The analysis was conducted at the McGill-Concordia Lab of the Quebec Inter-university Centre for Social Statistics which is part of the Canadian Research Data Centre Network (CRDCN). The views expressed in this article are those of the authors, and not necessarily those of the CRDCN or its partners.
Declaration of conflicting interests
The author(s) declared no potential conflicts of interest with respect to the research, authorship, and/or publication of this article.
Funding
The author(s) disclosed receipt of the following financial support for the research, authorship, and/or publication of this article: This work was supported by the Social Sciences and Humanities Research Council of Canada, McGill Sustainability Systems Initiatives (grant number 435-2018-1439, 2018 New Opportunities Fund).