
Abstract
Over the past 20 years, increasing land values, a rising population and inward investment from overseas have combined to encourage the demolition and redevelopment of many large council-owned estates across London. While it is now widely speculated that this is causing gentrification and displacement, the extent to which it has forced low-income households to move away from their local community remains to a large degree conjectural and specific to those estates that have undergone special scrutiny. Given the lack of spatially disaggregated migration data that allows us to study patterns of dispersal from individual estates, in this article, we report on an attempt to use consumer-derived data (LCRs) to infer relocations at a high spatial resolution. The evidence presented suggests that around 85% of those displaced remain in London, with most remaining in borough, albeit there is evidence of an increasing number of moves out of London to the South-East and East of England.
Introduction
Over the past decade, there has been increased international interest in displacement as the flipside of urban gentrification (see especially Baeten et al., 2021). Such interest appears most pronounced in those global cities where financialisation and spiralling property prices are conspiring with urban regeneration policies to produce increasingly unaffordable cities for low-income residents. The concern here is that displacement reinforces the deprivation of these populations by separating them from their existing employment, education and care networks and eroding their physical and mental health (Gillespie et al., 2021). Such concerns are magnified when the displacements involve a move not just out of a neighbourhood but the city itself, with some media stories suggesting displacements are often long distance, and fundamentally remove residents and households from the employment and education markets in which they are embedded.
In the UK, this preoccupation has encouraged urban scholars to both quantitatively and qualitatively trace the displacements caused by the demolition and redevelopment of London's council estates (see London Tenants Federation et al., 2014; Wallace, 2020; Watt, 2021). This is important given 54,263 units have either been demolished, or slated for demolition, on council estates of more than 100 units since 1997, a conservative estimate being that 135,658 council estate tenants and leaseholders have been, or are being, displaced (Lees and Hubbard, 2020). Some are thought to have been re-housed well beyond the capital, either to cheaper housing areas in the South-East or even beyond into the Midlands and North. Despite this, substantial doubt remains about the patterns of displacement involved, in part because of the difficulties of obtaining data that can grasp both the temporality and spatiality of displacement. Easton et al. (2019) argue that it remains especially difficult in the UK context to measure and map gentrification-induced displacement, first, because of the lack of extensive data and second, because what is available is not at a sufficiently granular temporal and spatial scale. Indeed, it has been noted that the UK evidence base lags far behind that of many other nations (see Baeten et al., 2017; Goetz, 2010; Wyly et al., 2010).
Given the limitations of extant data, this article provides a demonstration of the value of linked consumer and administrative records in tracing demolition-induced displacement from London council estates. Hence, we explore the potential of novel data on households provided by the Consumer Data Research Centre (CDRC) to shed some much-needed light on these debates. We use this data to investigate patterns of relocation from 45 council-owned estates in the Greater London Authority (GLA) area: 30 redeveloped/gentrified ones and 15 un-redeveloped control estates. For the first time, we approximate an experimental approach to estate regeneration that controls for the changes seen in London as a whole and allows us to unpick the impacts of redevelopment from that larger trend. Given the challenges of tracking hard-to-reach households during and after council estate redevelopment and associated gentrification, this work represents a significant – but we hope not unique – contribution to the quantitative analysis of gentrification and displacement in London (and beyond – see Greenlee, 2019, who used consumer data to study residential mobility in Chicago).
The article unfolds via five main sections. First, the article provides context on the redevelopment of London's council estates since the 1990s, a form of ‘regeneration’ predicated on demolition and rebuilding at higher density to provide more ‘homes for Londoners’ (London City Hall, 2018). Second, the article engages the challenges associated with the quantitative exploration and analysis of displacement in the UK and London context. Third, it introduces Linked Consumer Registers (LCRs), already validated in other studies of population movement (Lansley et al., 2019, van Dijk et al. 2021), as an under-exploited source for tracing displacements at a micro-level. Fourth, we outline a method for exploring the displacement of tenants and homeowners from estates that have undergone demolition in London, describing how we identified case study estates and suitable control cases. Finally, we test four discrete hypotheses relating displacement patterns to questions of distance, dispersal, direction and deprivation.
Our conclusions suggest that the overall dispersal of displacement is less than sometimes suggested in the press, and mainly within the greater South-East, with localised micro-geographies of displacement more significant, and implicated in patterns of deprivation across London's inner and outer boroughs. Here, there are echoes of Bailey and Minton's (2018) decentralisation of poverty thesis, in that most moves of former council estate residents are out of, rather than towards, the centre of London, but we find no real evidence that claims of suburbanisation (e.g. Hochstenbach and Musterd, 2021; Travers et al. 2016) can be attributed to the estate regeneration process per se. Indeed, our results suggest that, despite headlines linking London to Stoke-on-Trent or Bolton, localised dispersion within the local authority is, perhaps, the defining feature of this process. However, our results also point to the continued absence of a city- or country-wide register of local government assets (e.g. council housing) as presenting profound problems for our understanding of the full scale and impact of this dynamic over time.
A note on context: The London clearances
In the 2000s, it became apparent that London's council estates were the new gentrification frontier in a now hyper-gentrifying city (Watt, 2009; Lees, 2014a). As the case of the Heygate Estate in Southwark (Inner London) showed, the so-called ‘renewal’, ‘redevelopment’ or ‘regeneration’ of council estates was in fact a form of ‘state-led gentrification’: over 3000 council estate residents were ‘decanted’ (moved out) from the estate, the estate was demolished, and then replaced by a new build development marketed off-plan in East Asia (see Lees, 2014b; Lees and Ferreri, 2016). Council estates were long seen as protecting the poor from gentrification in London, but as land values soared, the city's population grew, and overseas investment increased (see DeVerteuil and Manley, 2017; Badarinza and Ramadorai, 2018; Hamnett and Reades, 2019; Atkinson, 2020), the pressures on these estates grew. Coupled with the pressures from the New Labour government's ‘Decent Homes Standard’ (that sought a minimum standard of housing conditions for public housing) and Urban Renaissance agenda (that drew on the perceived success of mixed communities policy in the US's HOPE VI program and sought to socially mix ‘deprived’ council estates; see Lees, 2014a), plus the push to densify, increasing the number of housing units (Watt, 2021), council estates began to be demolished and replaced with purportedly ‘socially-mixed’ new build developments. Scholars have talked about the ‘mixed communities policy’ that underpins these projects as encouraging a process of ‘gentrification by stealth’ (see Bridge et al., 2011). Council tenants, and those who had bought their council homes through ‘right to buy’, have been displaced, and research (e.g. Lees and White, 2020) has shown that owners were sometimes forced out of London altogether because the compensation offered through compulsory purchase (‘eminent domain’ in the United States) was insufficient to buy in the regenerated development or, indeed, anywhere else nearby.
In 2010, the-then Mayor of London, Boris Johnson, told BBC London that he would resist these displacements: ‘On my watch, you are not going to see thousands of families evicted from the place where they have been living and put down roots’ (BBC News, 2010). In 2018, Sadiq Khan went further by issuing guidance that insisted on demolition schemes only proceeding following resident ballots, and with tenants being offered full ‘rights to return’ (Greater London Authority, 2018). But years later, and despite a global pandemic, these displacements are still happening and continue to demand attention (see Lawrence, 2022). While there has been a wealth of research collated by both academics and activists on the ground, the overall scale and wider pattern remain unclear. Quantitative mapping of displacement has to date focused on single council estates, for example, the Heygate and Aylesbury estates in Southwark (see London Tenants Federation et al., 2014; Lees and White, 2020). Data on displacement from the Heygate Estate was collated via snowballing with the support of the community, while data for the Aylesbury Estate, used for the expert witness statements in the Aylesbury public inquiry (both in 2015 and the revised 2018 inquiry), was provided, first, by Notting Hill Genesis (the initial developer) and then via Freedom of Information (FoI) requests to Southwark Council. To date, there have been no attempts to trace displacement beyond the scale of single council estates (and indeed a single borough – Southwark) because of the lack of suitable data.
More generally, most attempts to measure gentrification and displacement in London have tended to rely on the decennial UK census and have been heavily criticised. For example, Hamnett (2003) made use of occupational and educational data from the decennial census that Watt (2009) argued incorrectly associated the decline of working-class occupations with the decline of the working-class populations. This is far from inconsequential in terms of its implications for theory and critical perspectives on gentrification (Slater, 2006), especially the ‘social cleansing’ of council estates in London (Lees, 2014a; Lees and White, 2020). Indeed, Wacquant (2008: 199) went so far as to charge Hamnett with the ‘literal and figurative effacing of the proletariat [from] the city…’ (see also Slater, 2010, on Hamnett's ‘foggy analysis’).
Census data also underpinned Butler et al.'s (2008: 84) conceptualisation of a ‘great inversion’ in London: ‘whilst the old manual working-class groups may have declined, they have not left a vacuum but have been replaced by these new groups of middle- and lower-middle class non-manual working households’. Davidson and Wyly (2013:308) criticised this conclusion as based on ‘an inappropriate use of UK census data given that we are dealing with relatively small percentage changes’, asserting they had fallen into a ‘now common narration of post-industrial transition that all too often erases a concern for class conflict’ (ibid).
Generally, census-based attempts to quantitatively measure displacement suffer from weaknesses in spatial resolution (i.e. the data are not at the household level) and temporal resolution (i.e. the data cannot distinguish between socio-economic change and population change using 10-year snapshots). Indeed, the census asks only about relocation in the preceding year, rendering the intervening nine invisible! Consequently, researchers have failed to meaningfully advance our understanding of displacement (see Preis et al., 2021), with Easton et al.'s (2019) review concluding that, in the UK context, it is ‘time to move beyond conventional census-based measures'. Almeida (2021) was first to do this in a report for the Runnymede Trust making use of population churn and ethnicity data from the CDRC. This is the same root source upon which we also rely; however, the analysis was restricted to just three of the capital’s 32 boroughs and, more pertinently, is neither centred on the estate redevelopment processes nor able to ascertain displacement distance or destination because of the resolution chosen and its interaction with privacy concerns.
As a result, other recent work has sought to sidestep the census entirely; for example, Dancygier and Chou (2021) have taken advantage of the British Household Panel Survey (1991–2008), a longitudinal panel later integrated into the larger UK Household Longitudinal Study survey, using a question on eviction and forced relocation to argue – perhaps erroneously, in light of recent election results – that we have witnessed the displacement of low-income Labour voters in/from London. Freeman et al. (2015) also used data drawn from the British Household Panel Survey to examine the relationship between residential mobility and gentrification in England and Wales. But the UK Household Longitudinal Study (although similar in conceptualisation to the Panel Study of Income Dynamics used by Freeman, 2005, in the US context), does not provide the level of detail required to zero in on gentrification-induced displacement from London council estates; indeed, since it is composed from a 1% sample of the UK population we would be lucky to have even one household on an estate of interest
Using novel data to trace displacement
Putting the UK census to one side, publicly accessible data on population flows is not meaningfully available below the local authority (borough council) level in the UK. The National Change of Address (NCOA) file maintained by the Royal Mail might seem promising in terms of deriving origin/destination data to track displacement, but many households neglect to, or are unable to pay for, postal forwarding. Likewise, the data used by the Office for National Statistics (ONS), which draws on patient registrations in a healthcare setting, is strongly impacted by the nature of healthcare provision: young people are seriously under-represented and moves over short distances (within the same commissioning context) are under-counted (see discussion in van Dijk et al., 2021: 1455). ‘Linked Consumer Registers’ (LCRs) seek to work around these limitations by combining individual- and address-level anonymised databases of adults from retailers’ consumer registers with composite databases formed from public versions of electoral registers. At their heart, LCRs consist simply of names, addresses and timestamps indicating a probable start and end dates of residence (van Dijk et al. 2021: 1456); doing so for every year between 1997 and 2016 creates a database of 47 million moves between 32 million unique addresses (Lansley et al., 2019). When aggregated to the same geographies and timeframe as the 2011 census, van Dijk et al. (2021: 1455) find a very high level of overall correlation (0.97) with comparable census data, but LCRs allow these relocations to be disaggregated to much higher temporal and spatial resolutions.
Of course, LCRs do not provide a complete picture since, as with all other such sources of data, individuals and households living in more deprived or vulnerable circumstances are less likely to be covered by the data (which relies on people signing up to consumer loyalty cards and finance schemes). We estimate that the LCRs employed in this research cover no more than 40% of tenants on London council estates, though this could vary between 20% and 60% over the course of the study period. As well, the LCRs necessarily include a probabilistic component: while first name–surname combinations are surprisingly ‘identifiable’ (especially when a household is composed of more than one individual), there is necessarily a degree of statistical ‘guesswork’ involved when matching out- and in-movers across an entire country (see discussion in van Dijk et al. 2021: 1456–1463). This is not ideal, but there are no alternatives: the UK's decennial census looks only at relocation during the preceding year, and there is no equivalent to the rolling American Community Survey upon which to draw. In other words, no other source combines the ability to create highly disaggregated, bespoke geographies (Figure 1) with an equally bespoke, if lower resolution, temporal framework.
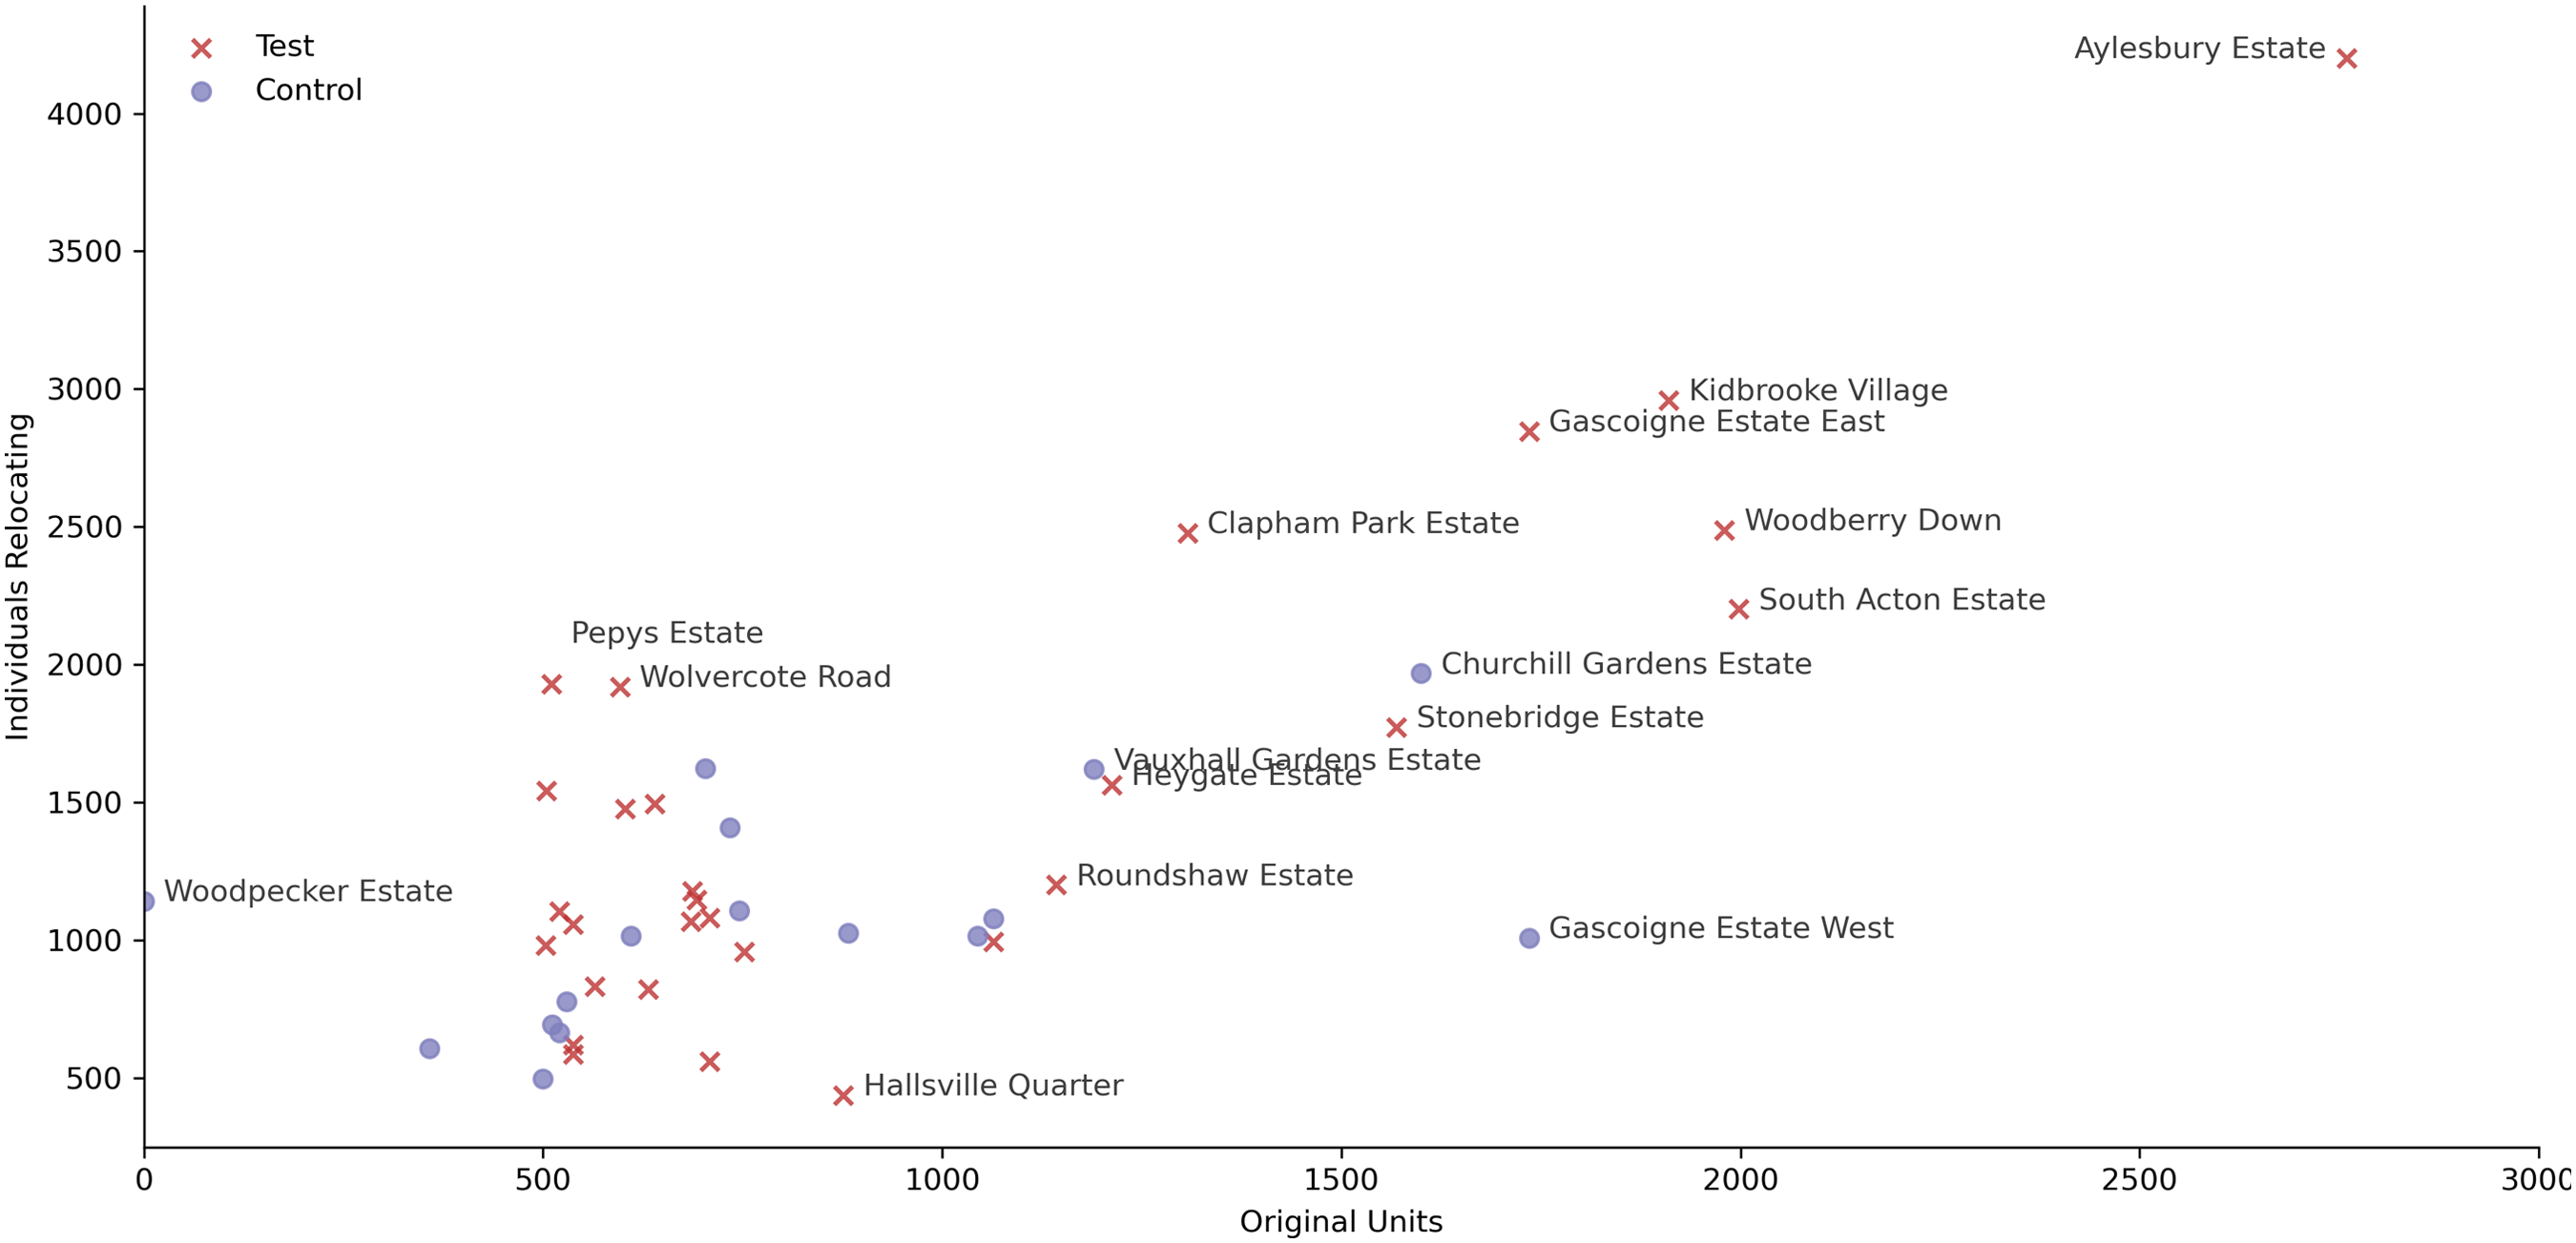
Comparison of units to number of detected relocations 1 .
In short, the UK context continues to differ substantially from what is possible in the United States (see Atkinson, 2000a, for a sense of how long this situation has persisted) thanks to differences both in the workings of the census and in the leeway given to commercial data resellers and credit verification firms to link, share and sell individual- and household-level data. The 1% longitudinal sample so creatively employed by Atkinson (2000a, 2000b) using custom borough-scale geographies provides insufficient spatial and temporal resolution: any relocations happening between census years are lost and we would not be able to evaluate the extent of short-distance relocations because only cross-border flows can be reported. The LCR-derived migration estimates allow us to work around these constraints and therefore serve as a foundation for our analysis; however, strict access and disclosure controls mean that the data to which we had access is much more circumscribed than the InfoUSA data used by, for example, Greenlee (2019) in his research on Chicago. In line with ONS practice, any origin-destination pair – such as a source estate and destination zone/area – affecting fewer than ten adults is reported as ‘<10’. That said, the flexibility of the LCRs made it possible to aggregate origin-destination flows from bespoke units (estates) to larger census geographies, reducing the impact of this selection constraint. Where this limit was encountered in our analysis, we assigned a default value of 2.4 to all flows between pairs reported by the CDRC as ‘<10’ since this is the average size of a household in a social housing unit according to Census of Population 2011 estimates for London. We should also note that it is not possible to distinguish tenure types in LCR data since it is based on name and household matching and does not attempt to impute other characteristics.
Our stepped methodology
Delineating and sampling council estates in London
We focused our analysis on the period 1998−2014 since this aligns at one end with the instigation of the state-led gentrification of council estates in London by the New Labour government in 1997 (Lees and White, 2020) and, at the other, with the latency in address updates mentioned above. Since there is no central register of council estates in London, we were fortunate to be able to draw on a database developed as part of an earlier project (see Lees and Hubbard, 2020; and estatewatch.london (n.d.)); this details 198 major regeneration schemes on 161 estates, each involving the demolition of at least 100 units. Because their morphology and extent vary enormously, the process of finding and delineating estates cannot be automated, making analysing every estate impractical (see additional discussion in Supplementary material); we therefore purposively selected 45 council-owned estates in Greater London: 30 that were redeveloped/gentrified and 15 un-redeveloped controls (see tables in Supplementary material). Selection was driven by a desire to maximise coverage of the process, so estates were chosen on the basis of size as well as temporal and spatial distribution: they were drawn from the majority of London's boroughs, both inner and outer, and they ranged in size from 500 up to 2759 units.
It might seem straightforward to align the relocations reported for regenerated/gentrified estates with the regeneration/gentrification process, but the way that LCR data is generated does not allow us to split the data that way. An address update may take a year or more to filter through to the database. Worse, major regeneration work can entail multiple phases involving the sequential demolition of parts of the estate, hence the description of council estate gentrification as a form of ‘slow violence’ (Elliot-Cooper et al. 2019). As well, resident behaviour may be – indeed, is likely to be – impacted well before the property in which they reside is demolished. For our analysis, we dated redevelopment of the entire estate to the first public announcement of the need for decanting (that is the relocation of tenants and leaseholders, whether on a permanent or temporary basis), a planning application, or some other form of notice. While the ‘managed decline’ of estates (see Lees, 2014a; Lees and White, 2020) may have started well before then, this nonetheless seemed a reasonable break point after which tenants and leaseholders would face much more direct pressure to relocate. However, this distinction could only be made at the level of a calendar year, so ‘before’ was defined as the period prior to the year in which regeneration was announced, and ‘after’ begins in the year in which regeneration is announced.
Hypotheses and rationales
In reviewing the literature on state-led gentrification of council estates in London, we hypothesized that gentrification-induced displacement pressures from council estates manifest quantitatively in several ways: first, changes in the rate at which people relocate from an estate; second, changes in the distance over which relocations occur; third, changes in the degree of dispersal of households across space; fourth, changes in the direction in which relocations occur; and finally, changes in the type of neighbourhood to which households relocate. We consider each of these propositions in greater detail below, but the basic idea was that these hypotheses could be tested by consistently comparing ‘before’ and ‘after’ migration patterns against the unregenerated estates as a control. Our expectation was that a change in behaviour might be evidence of an increase in involuntary moves, where some households ‘see the writing on the wall’ and jump before they are pushed, while others have no choice when their tenancies or leaseholds are terminated by the local authority.
The two-sample Kolmogorov–Smirnoff test of observed distributions is an appropriate way to test for differences between ‘before’ and ‘after’ behaviours. However, this approach risks introducing the ‘multiple comparisons problem’ in which you will almost always eventually find a ‘significant’ result if you make enough pairwise comparisons between variables (for historical context, see Benjamini and Braun, 2002). The problem is therefore closely connected to the ‘replication crisis’ and ‘p-hacking’ in academia (including geography, for which see relevant discussion in Brunsdon and Comber, 2021), even though its causes may be entirely innocent (Gelman and Loken, 2013). In other words, you cannot compare variables A and B, A and C and B and C without actually changing the likelihood that you will find at least one of these comparisons to be ‘statistically significant’. We sought to avoid this problem by comparing the empirical distributions for the test and control estates first, and then the before and after distributions for the test estates only, to see if these data appeared to be drawn from different distributions.
In looking at displacement we are obviously interested in
Of course, it is also possible that even if displaced residents from regenerated estates were not moving further than they were before regeneration began, they were nonetheless still dispersed by the decanting process in a way that disrupted existing friendship and support networks. We hypothesised that
Also drawing on our literature review,
Finally, we also sought to examine
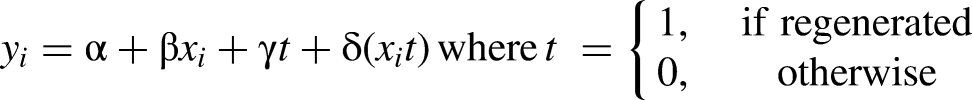
The IMD was hypothesised to be directly relevant to displacement since significant movement to less deprived areas would suggest some kind of ‘trading up’, while equivalent or greater deprivation would suggest that ‘pricing out’ or some other form of exclusionary displacement dominated. The most straightforward way to test for differences between the test and control council estates was with a linear model of the form:
We were also careful to validate the LCR data. Figure 1 provides an overview of the data, of the council estates used in the analysis, and of their scale in terms of the number of units on the original estate as well as the number of individuals that the LCRs recorded as having relocated from these estates over the study period between 1997 and 2014. On the whole, Figure 1 shows that we are able to track migration out of council estates using LCR data: not only did we generally detect more relocations from larger estates, but there was also a general indication that estates undergoing regeneration were generating more relocations. Work by the CDRC had already validated LCRs against migration statistics (Lansley et al. 2017, 2019) so these results were not exactly surprising, but they are reassuring since the nature of LCRs would tend to imply a systematic undercount of council tenants. And while there is no question that certain types of tenants were under-represented in the data, we were nonetheless able to get a handle on overall migration using this data.
What LCR data revealed about gentrification-induced displacement from London council estates
We found that the majority of relocations for both regenerated and unregenerated estates were over relatively short distances (i.e. within the same borough). However, the smoothed distribution curve generated via automated Kernel Density Estimation (KDE) and the rug plots in Figure 2 provide strong evidence that the spatial characteristics of relocations from unregenerated estates are significantly different from those of regenerated ones. The upper plot shows that, in most cases, fewer than 50% of households leaving the control estates remained within the borough. This is in sharp contrast to the distribution for the test estates, regardless of whether the measures are for before or after redevelopment. There is an apparent shift towards fewer households remaining in-borough or in-London post-redevelopment. At the GLA scale there is a similar picture, though rather less extreme in terms of the magnitude of the differences: between 80% and 90% of relocations are within the region, but more individuals who left un-redeveloped estates end up leaving London entirely.
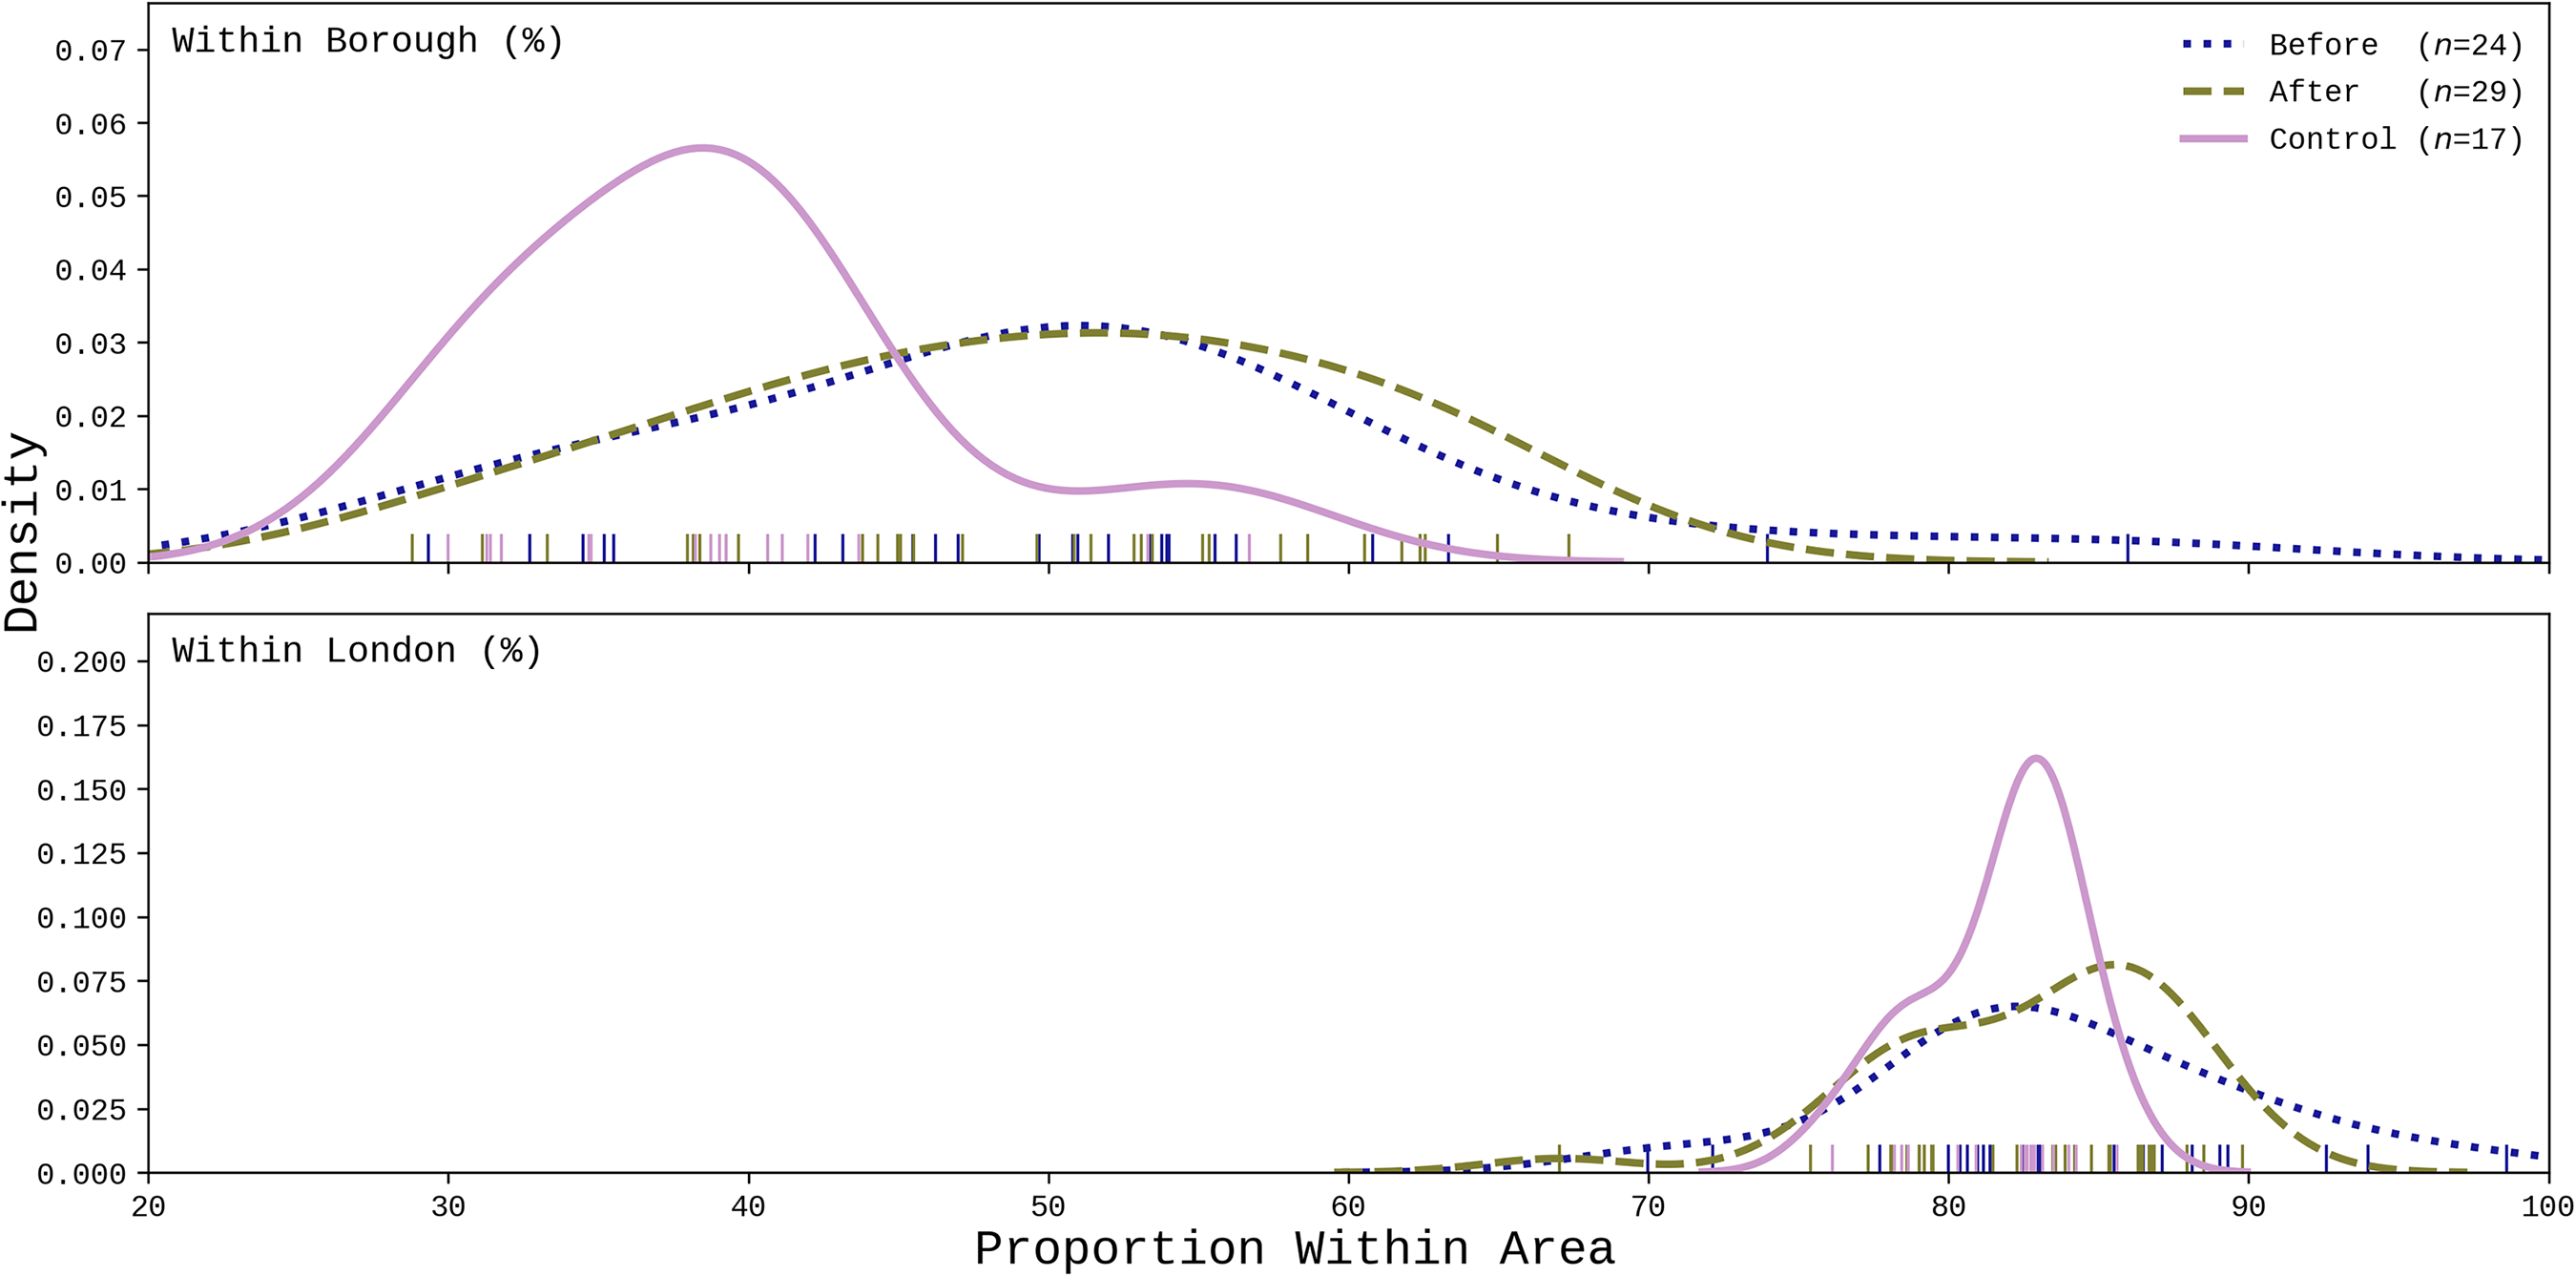
Proportion of relocations within administrative area.
There are two possible interpretations of Figure 2, although in either case, we can conclude that there is a tendency for ‘voluntary’ migrations to lead to longer-distance relocations than ‘involuntary’ ones. Of course, there are also two possible interpretations of what a ‘voluntary’ move might look like: they could be cases of leaseholders realising capital gains from the sale of property purchased under ‘right-to-buy’ and using the proceeds to purchase in a more affordable part of London or the UK; however, these could also indicate more complex processes, including council tenants beginning to look much further afield to get a new council- or affordable privately rented home.
Table 1 shows the results of the Kolmogorov–Smirnoff two-sample test, and the results confirm that the differences observed between control and regenerated estates were real at the borough scale: the p-value was significant at the 99% level for within-borough moves and at the 90% level for moves within the GLA area. However, it was not possible to observe a statistically significant difference between before and after distributions for the test (regenerated) estates in terms of the proportion of residents who remained within the borough and within the GLA boundaries. We return to this issue below.
Testing for differences in relocation distances.
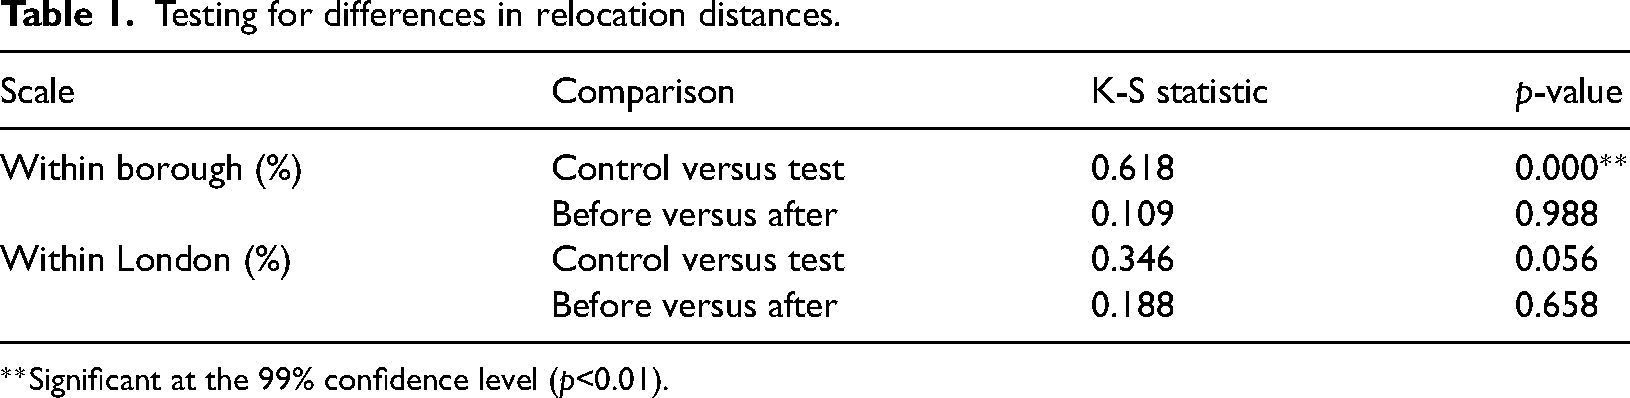
**Significant at the 99% confidence level (p<0.01).
Figure 3 also shows a clear distinction between control and test estates: the former show greater dispersion at all scales, which would be consistent with an ad hoc process that is, presumably, predominantly voluntary in nature and driven by choice (e.g. a desire for proximity to family, a better location, more space, etc.). There was (again) no statistically significant difference detected between pre- and post-regeneration patterns of mobility on the test estates.
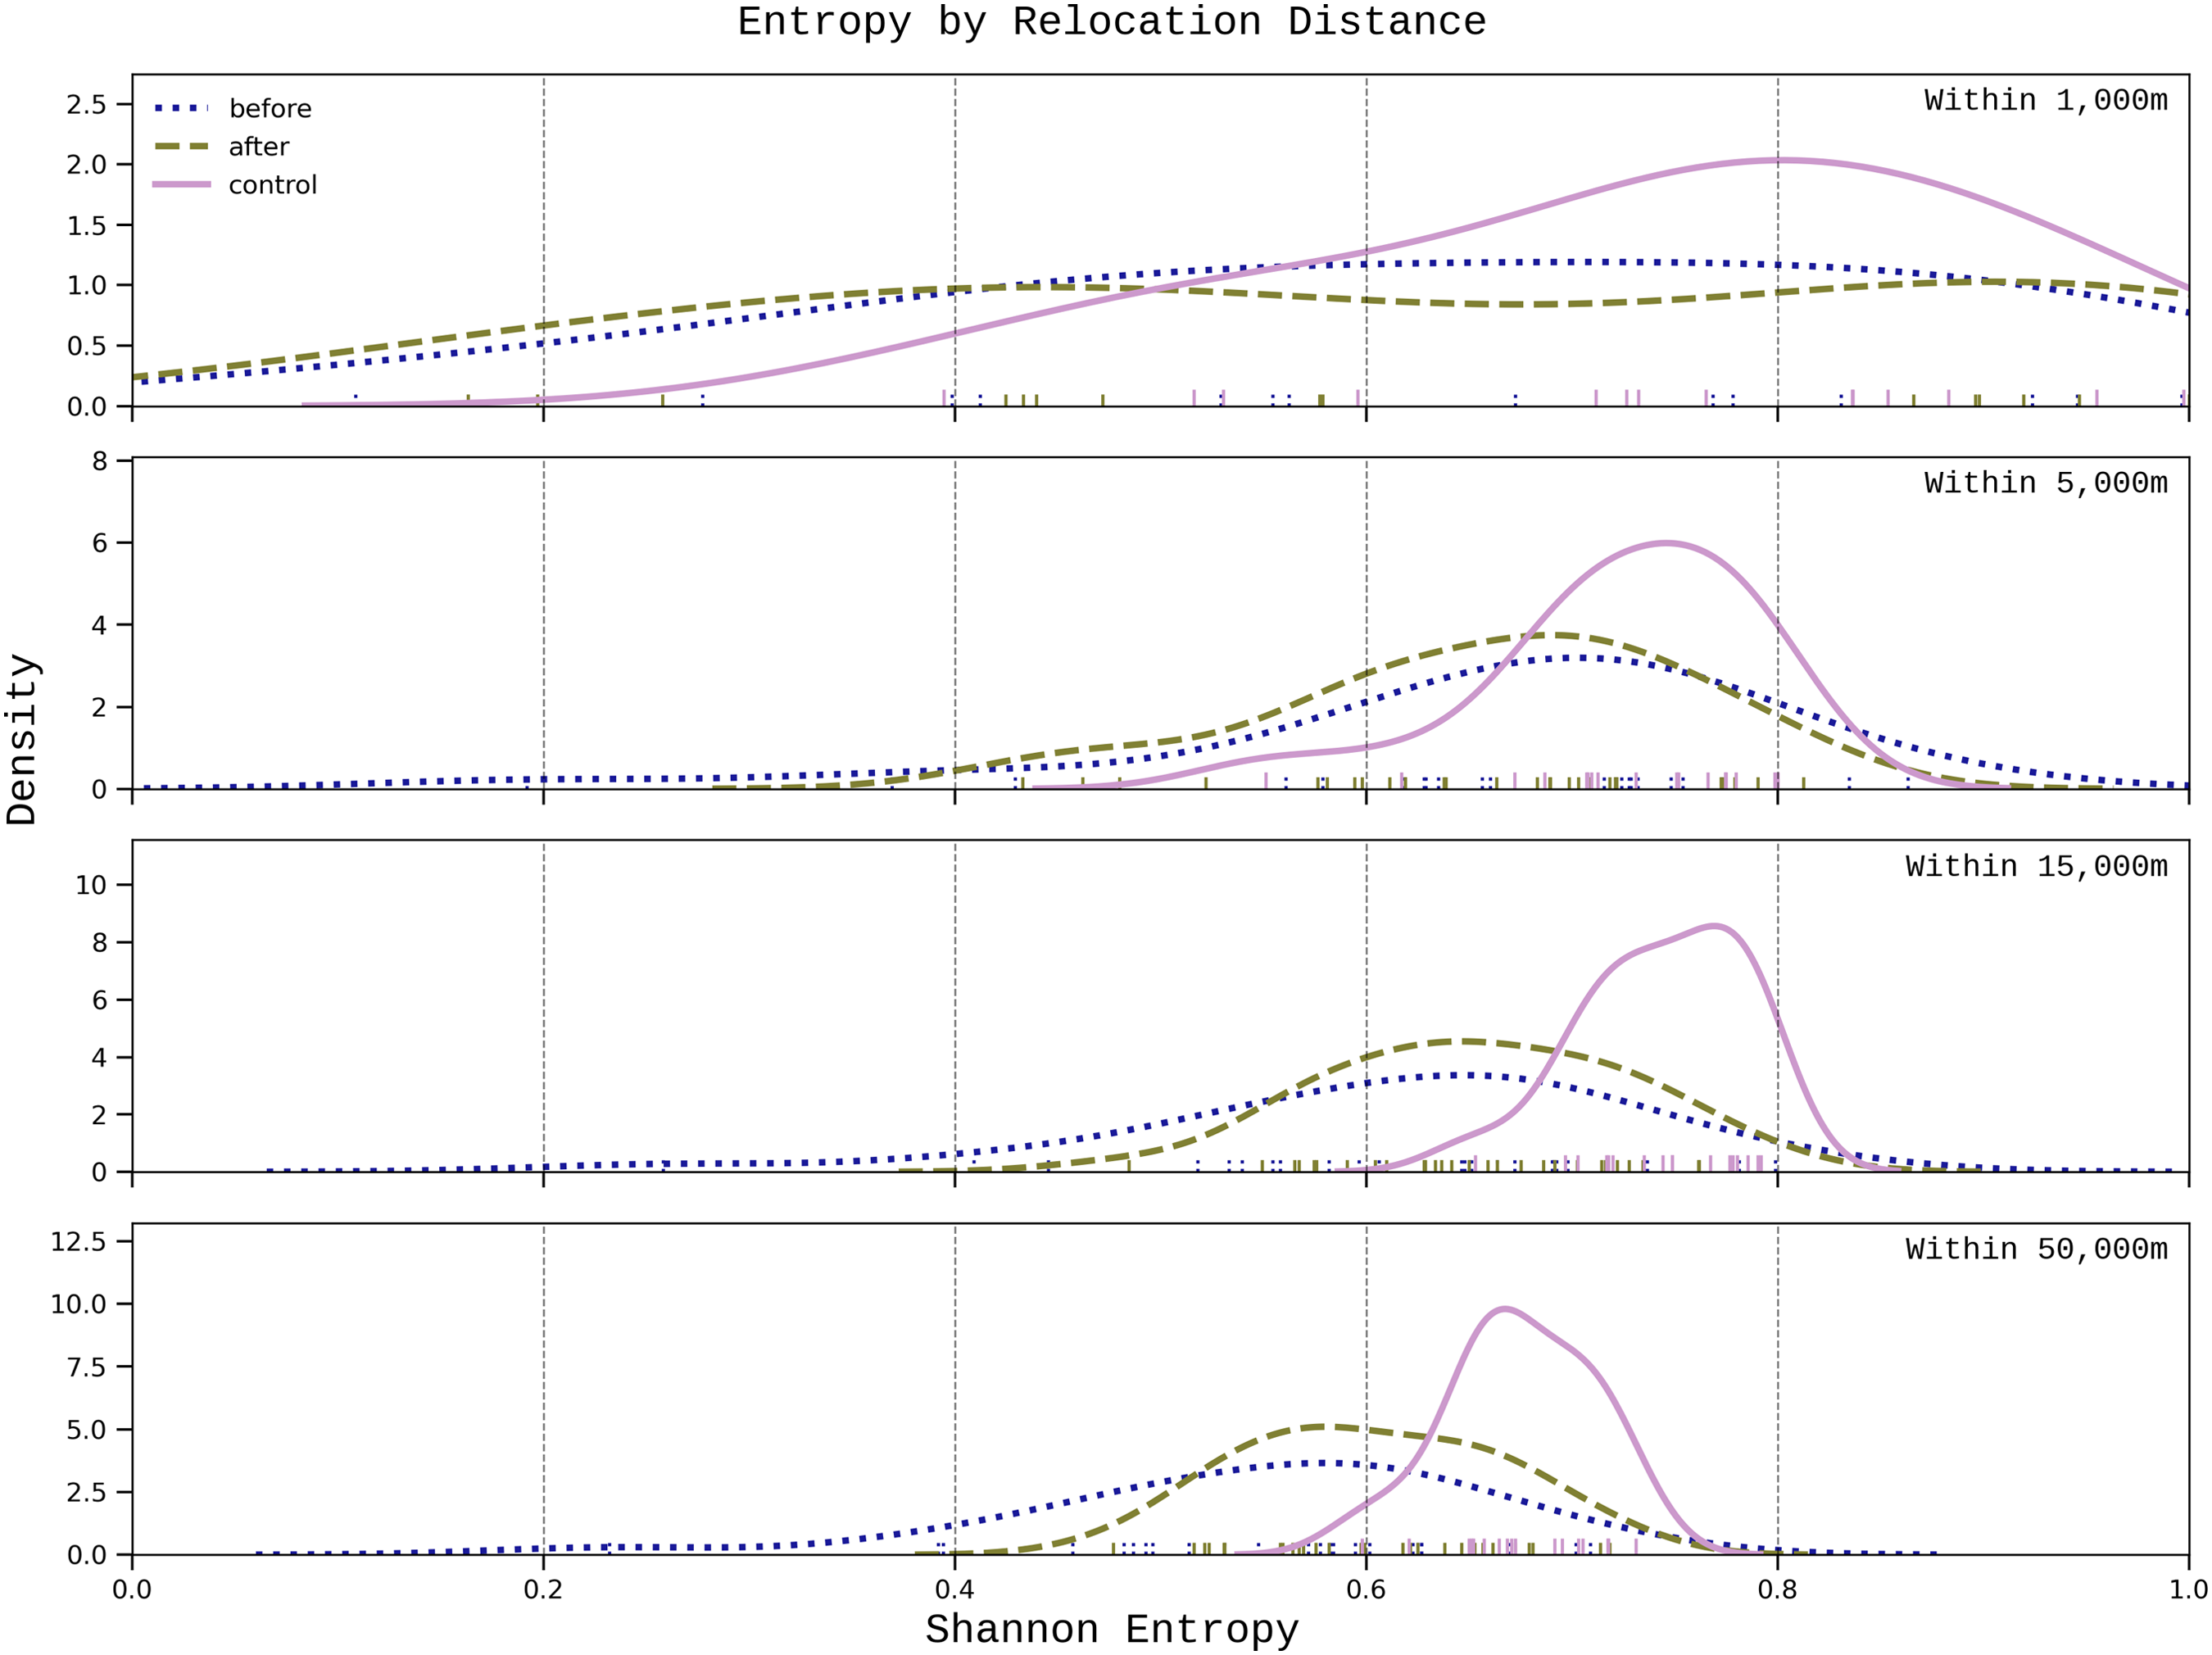
Entropy distribution by relocation distance.
Finally, we mapped the pre- and post-regeneration flows (Figure 4(a) and (b)) in order to explore whether there might be more subtle differences in migration trajectories once directionality was taken into account. The maps presented here need to be placed firmly in the context of the evidence that precedes them, but they point towards a marked change in the scale of flows: the median value across all estates for the post- to pre-regeneration outflows on an annualised basis is 1.77 (i.e. after regeneration began outflows nearly doubled in number). The most reasonable interpretation of this picture is therefore that there has been relatively little change in the proportions of detectable out-flows, but a significant change in their magnitude.
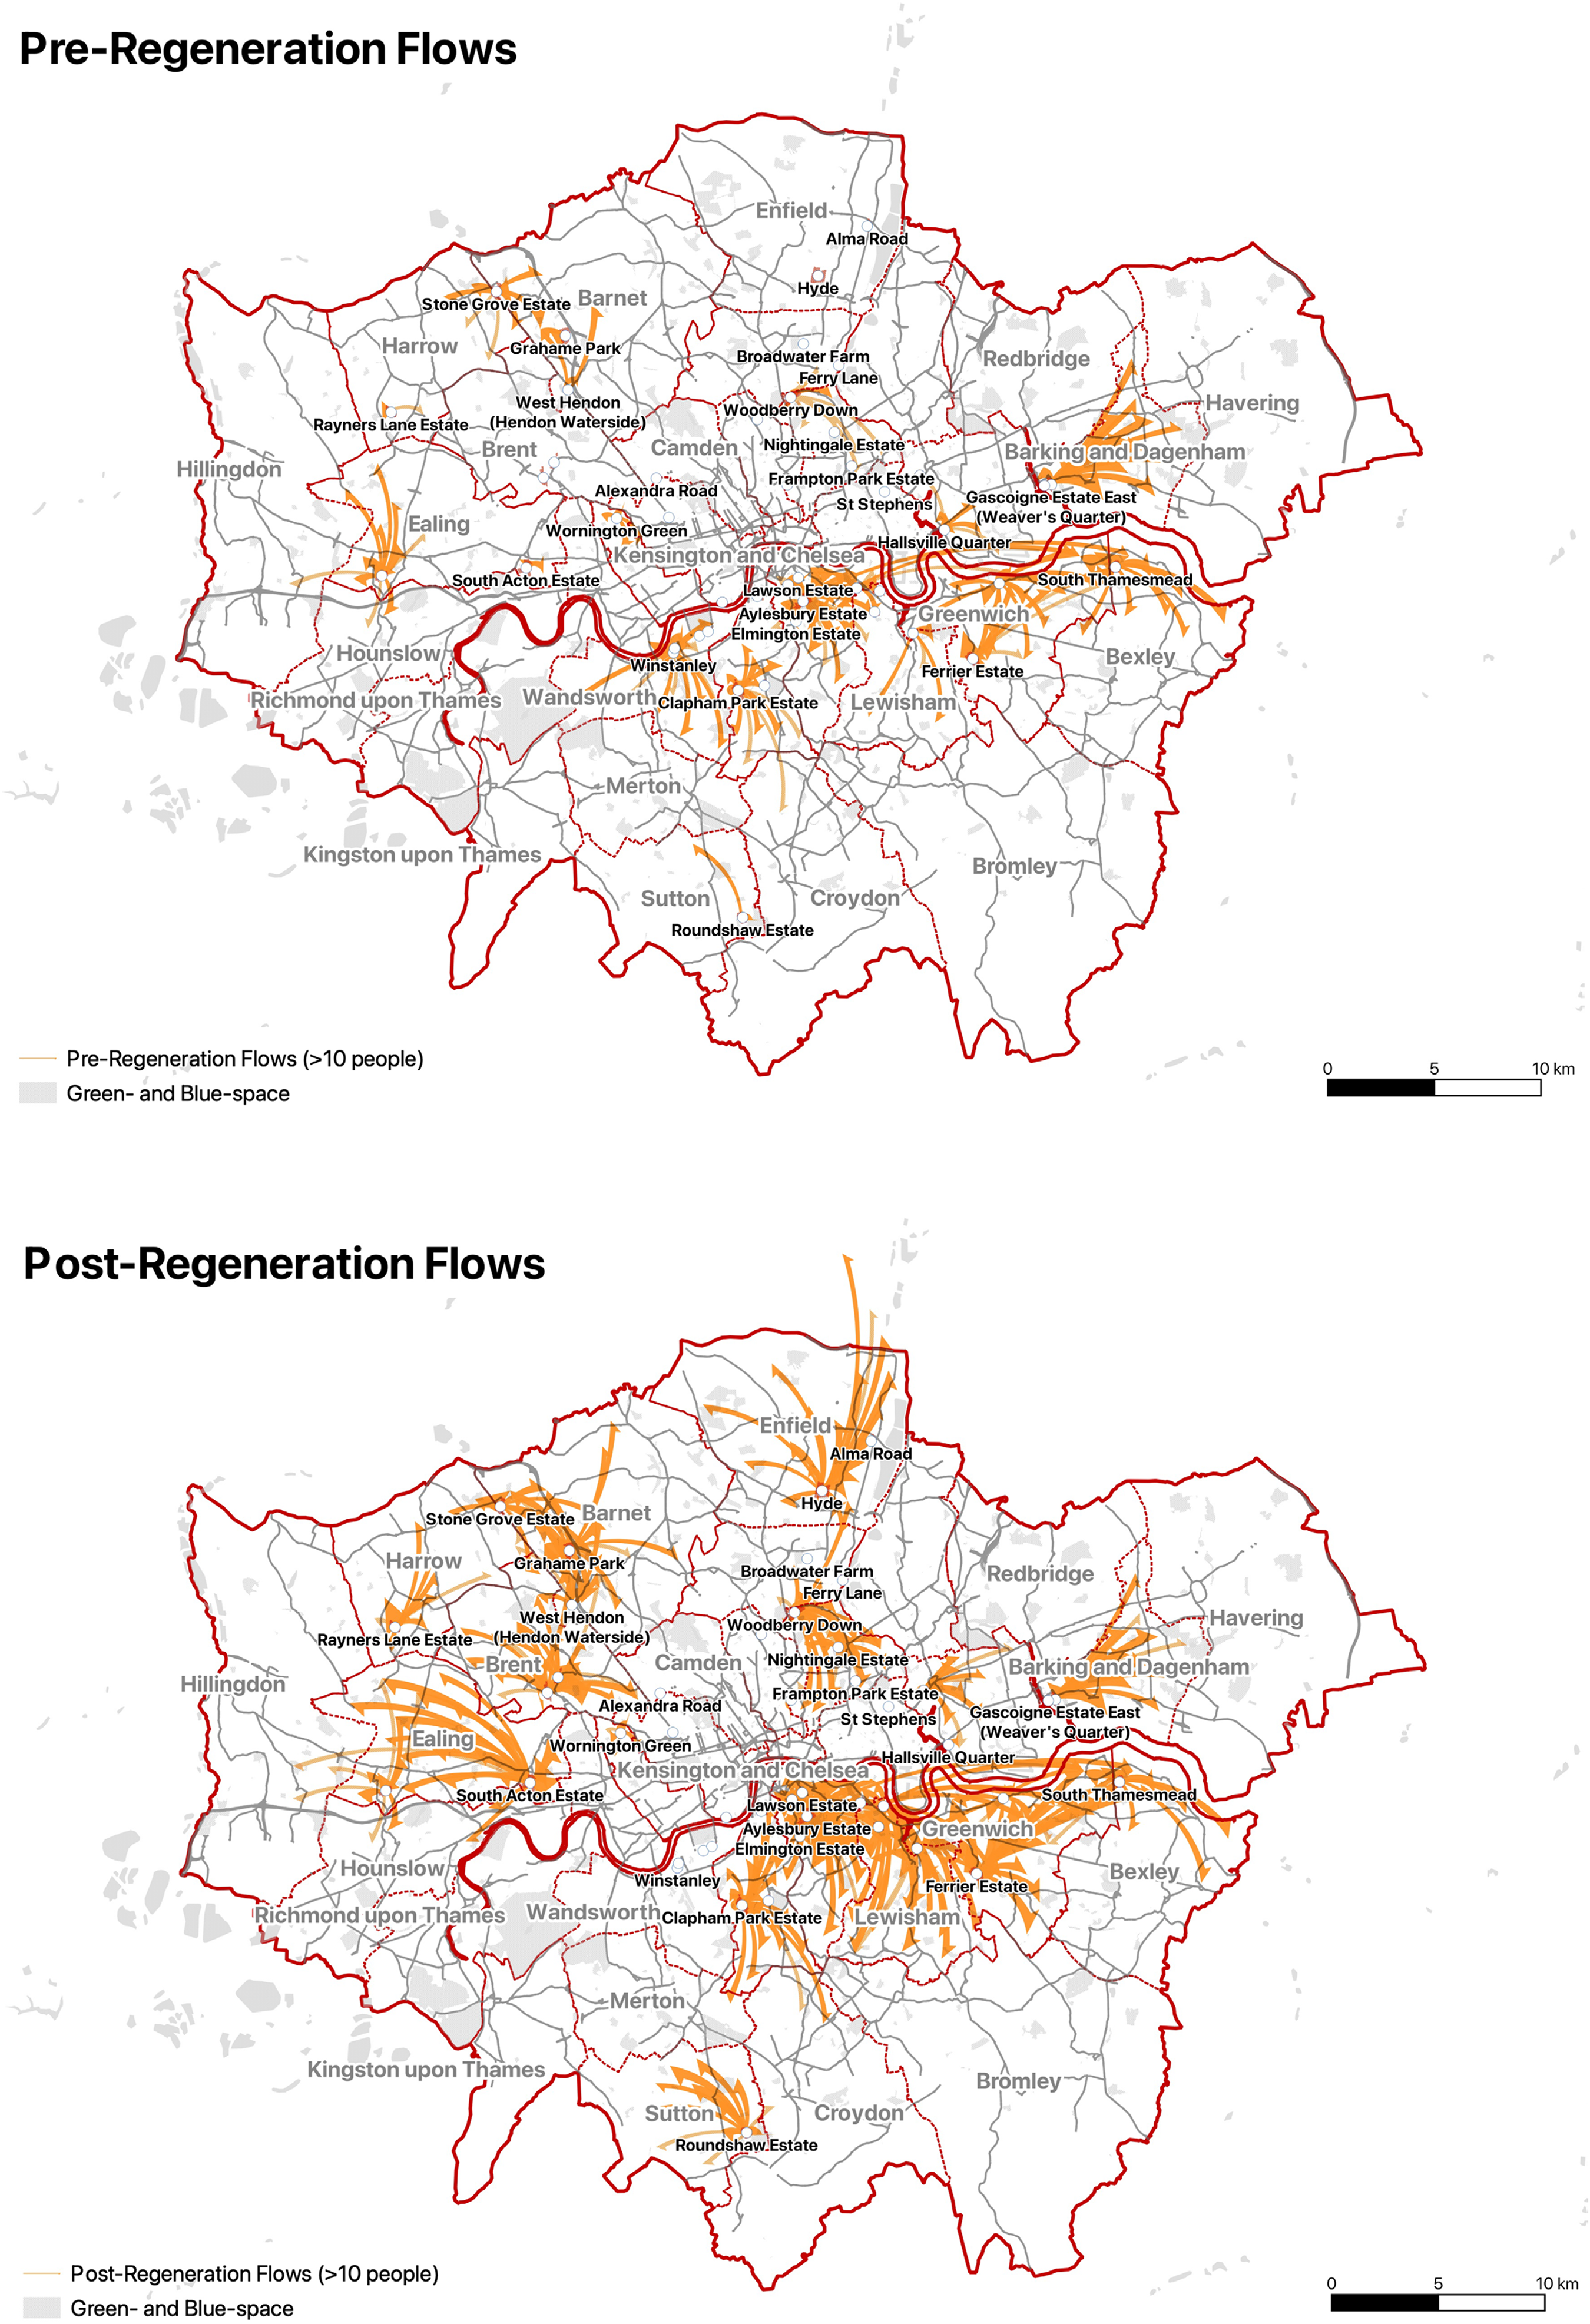
(a and b) Pre- and post-regeneration flows from test estates. 2
We note here too that while the majority of out-flows remained within borough, larger flows were directed towards the outer edges of each. This interpretation is also consistent with the results presented in Figures 2 and 3. Collectively, they point to subtle changes in the movement of households in the pre- and post-regeneration phases: although it is the long-distance relocations that more often garner media attention, this is not the ‘typical’ experience for households impacted by estate renewal. Rather, it appears that households displaced by the state-led gentrification of council estates in London are marginally more likely to be dispersed than they would have been previously (especially at distances longer than 5 km) and, as we show next, to end up living in a more deprived and less centrally located neighbourhood. While the majority of the expected differences in pre- and post-outcomes remain below the threshold for statistical significance, the near-doubling of out-flows nonetheless means that a vastly higher number of people are experiencing these impacts.
To test the impact of displacement on living environment we implemented two versions of the regression model: one using OLS and one using WLS to account for the differences in populations between estates (Table 2). For the first model, the probability of the F-statistic was 0.050 and log-likelihood was −126.58; for the weighted model, these values were 0.062 and −131.20, respectively. In both cases, parameters other than the intercept were not statistically significant, although in the WLS model the origin IMD score had p = 0.054 which we would argue is within the range of acceptability for significance (94.6%) and the 95% Confidence Interval around this indicates that it is likely to be a ‘positive’ relationship. A simpler model, incorporating only the treatment effect and origin IMD score (Adj. R-squared = 0.115), also indicated that origin deprivation was a useful predictor of the destination score (
Model results and comparison.
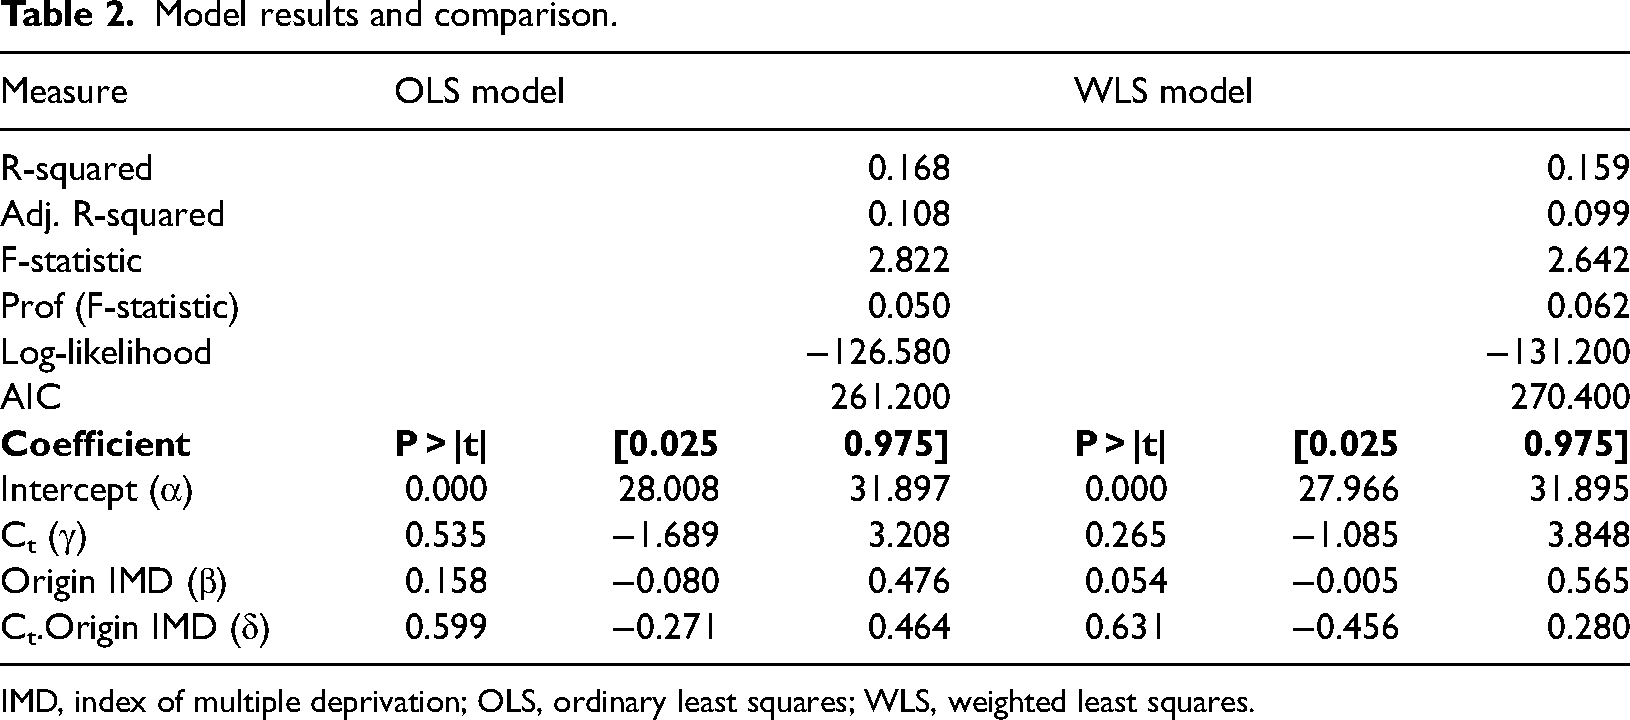
IMD, index of multiple deprivation; OLS, ordinary least squares; WLS, weighted least squares.
This ‘null’ result indicates that there was no statistically significant difference between regenerated and unregenerated estate results in terms of destination IMD averages in the LCR data. The limitations of the data noted above may partly account for this; but note too that while the results were based on the weighted average of many households, from a statistical standpoint the findings are based on a considerably small number of estates (n = 46), meaning that the differences would need to be egregious to be detectable. For the reasons outlined earlier regarding standard census geographies and the changes made in 2001, we should also note that in this model wards were used in place of LSOAs (Figure 5).
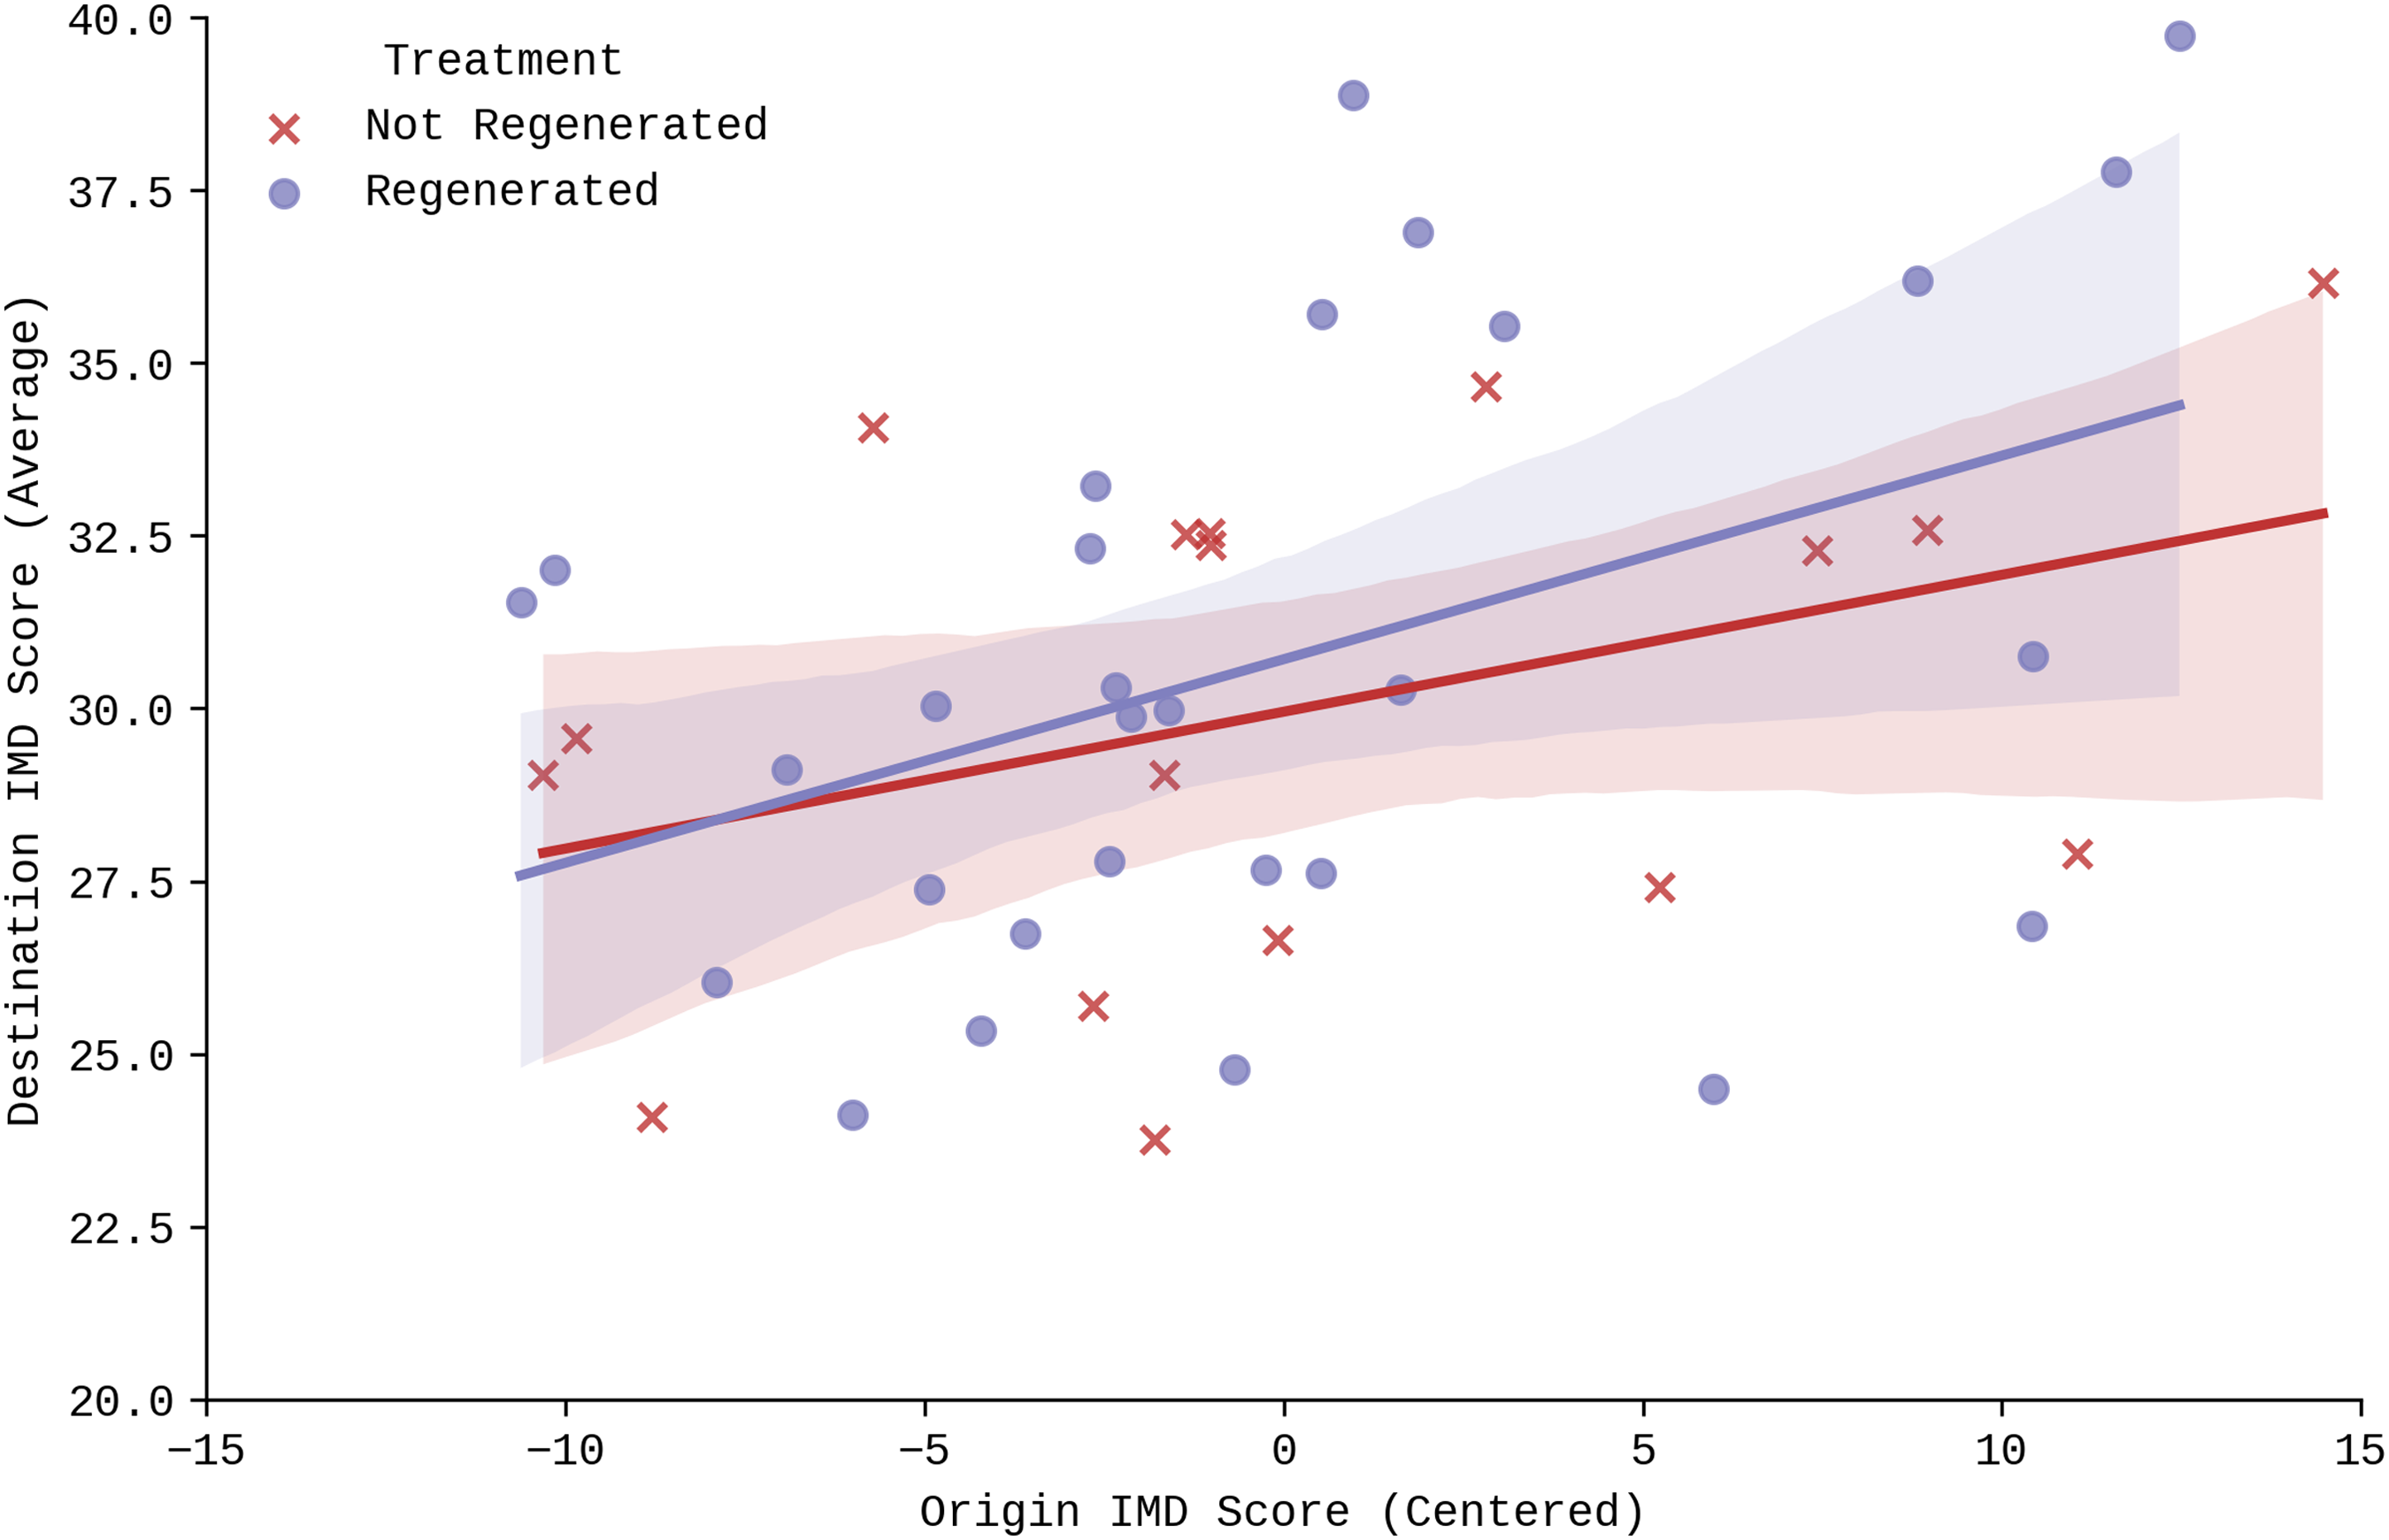
Comparison of average origin and destination index of multiple deprivation (IMD) scores (ward level).
Comparing the slopes of the two lines in Figure 5 suggests that regeneration may have a negative effect on social mobility amongst the most deprived households, but testing this difference robustly would require the use of household-level data and this is not something to which we have access, so the case here must be ‘not proven’. At the inter-regional scale, four boroughs were outliers in terms of their share of relocations from the test estates: Barnet, Enfield, Harrow and Sutton. Geography plays a major role here since all four are Outer London boroughs and so, in a variation on the Modifiable Area Unit Problem (MAUP), what appears to be an inter-regional relocation could nonetheless be over a relatively short distance. However, Barnet's high share comes in spite of it having three estates in the test group, so it is not then a case of a single, unrepresentative estate producing a misleadingly high share. Enfield had two estates in the test group, Sutton and Harrow both had one.
Conclusion
Given fine-grained quantitative data on UK housing is notoriously difficult to find, in this article, we ‘made the most of what we had’ and used a novel data source to investigate displacement from council estates in London that were being demolished to allow for redevelopment. Our results paint a complex and mixed picture. First, it is clear that estate ‘regeneration’ causes forced moves: we found statistically significant differences between the unregenerated council estates and the regenerated council estates in terms of the distribution of moves, indicating that what the council call ‘regeneration’, ‘renewal’ or ‘redevelopment’ has caused displacement. But we found only suggestive (not statistically significant) differences between pre- and post-regeneration out-flows from the regenerated estates. We also found that the average distance of relocation was quite low, suggesting that many (but not all) council residents (and we surmise tenants not leaseholders here) are, in fact, rehoused locally, which echoes previous studies of single estates (e.g. the Heygate and Aylesbury estates, see London Tenants Federation et al., 2014; Lees and White, 2020). Most of the displacement happens within London and often in-borough. However, one could argue that the juxtaposition of both quantitative and qualitative evidence is important, in that it highlights and indeed counters the problematic nature of simplistic ‘we’ve re-housed them within the borough’ responses from London councils, given the negative impacts and experiences documented on estatewatch.london (n.d.), and by, amongst others, Watt (2021).
Importantly, our modelling also shows that the homes council estate residents are relocating to tend to be in marginally more deprived areas, again countering the idea that the displacement is voluntary or that we are witnessing significant social uplift amongst those living on these estates prior to demolition (see Bridge et al., 2011). This echoes the qualitative findings of those who have investigated mixed communities policy and new-build developments in London (e.g. Arbaci and Rae, 2013). Rather than alleviating deprivation, displacement to an even more deprived neighbourhood is likely to increase a household's level of deprivation. This is not the social mobility promised to the poor (and the New Labour-voting public) through mixed communities policy; it is not doing what it ‘said on the tin’ used to sell the regeneration of these estates (see Lees, 2014a).
Our modelling also shows some evidence of higher levels of household dispersal amongst estates having undergone demolition as opposed to test estates, suggesting that neighbours tend to be physically distanced from one another post-regeneration. Many relocate (or are relocated by the council) more than 5 km away from their regenerated estate, and many relocations have resulted in households living further away from Central London. This fracturing of often long-standing council estate communities echoes the qualitative findings on estatewatch.london (n.d.) and in Watt (2021), which highlight the disruption, anxiety, stress (even distress) and interference with the way in which people negotiate their everyday lives. Although we were unable to directly confirm this from the LCR data used, other studies of single estates using primary data (e.g. London Tenants Federation et al., 2014; Lees and White, 2020) have shown that displacements out of London are more likely to be those of leaseholders who cannot afford to remain in London with what they receive from the compulsory purchase process.
The fact that low income (often working class) households are being displaced from council estates in London, some a long distance from their original home, estate and community, albeit many more are moving over shorter distances to (marginally) more deprived locations, is important, because local governments (borough councils) and the GLA seem to have a weak understanding of the micro-dynamics of state-led gentrification in the capital. The data we have analysed indicates a more fine-grained and localised geography of displacement than has been evidenced to date, one that points to gentrification, and the displacement of council estate residents to other deprived locations, mostly nearby. This localised impact on adjacent, deprived neighbourhoods and communities (particularly in Inner London) tallies with observations of a more general trend towards an increase in poverty in medium-density neighbourhoods around the traditional urban core (Cooke and Denton, 2015). This dynamic helps us to make sense of Bailey and Minton's (2018) finding that relative centralisation of poverty has fallen more quickly than the relative concentration of poverty: the (modest) outward shift of poorer groups nonetheless still leaves them living in denser neighbourhoods on average.
As such, for the most part, the gentrification of council estates in London seems not to be contributing to the suburbanisation of poverty (see Bailey and Minton, 2018; Hochstenbach and Musterd, 2021) even if other types of gentrification might be. Accordingly, our analysis neither feeds into, nor validates, emerging theses on the peripheralisation or suburbanisation of poverty arising because of exclusion and direct displacement (see Fransham, 2020). Rather, the results appear to confirm Lawton's (2020:277) view that ‘while the term “inversion” has been used to convey the shifting relationship between centres and suburbs, there is a need for a significant amount of caution in how these relationships are understood’. Lawton (2020) is perhaps right to suggest we should instead draw on notions such as Hall and Savage's (2016) ‘urban vortex’, which draws on debates over planetary urbanisation to emphasise the continued importance of urban centrality but also the destabilisations happening in cities causing more variable social relations (see also the ‘planetary gentrification thesis’, Lees et al., 2016), After all, ‘cities such as London are sites of multifaceted disparities, exclusions, “emplacements and displacements”’ (Hall and Savage, 2016: 91). So while the research reported here represents the most comprehensive quantitative study of the displacements associated with the redevelopment of council estates in London to date, a significant degree of uncertainty will persist in the absence of a government-led, systematic review of council holdings and tenants. Failure to identify, measure and understand the micro geographies of displacement from London's council estates means that local (and national) government can continue to pursue policies encouraging gentrification of council estates, removing the only truly affordable housing left for lower income groups in London today.
Supplemental Material
sj-docx-1-epn-10.1177_0308518X221135610 - Supplemental material for Quantifying state-led gentrification in London: Using linked consumer and administrative records to trace displacement from council estates
Supplemental material, sj-docx-1-epn-10.1177_0308518X221135610 for Quantifying state-led gentrification in London: Using linked consumer and administrative records to trace displacement from council estates by Jonathan Reades, Loretta Lees, Phil Hubbard and Guy Lansley in Environment and Planning A: Economy and Space
Footnotes
Acknowledgements
The data for this research have been provided by the Consumer Data Research Centre, an ESRC Data Investment (ES/L011840/1, ES/L01189/1) under project ID CDRC 468. ES/L011891/1. Initial work for this research was undertaken under the auspices of ‘Gentrification, Displacement, and the Impacts of Council Estate Renewal in C21st London’ which was funded by the ESRC (grant ES/N0115053/1). We also are also very grateful to Dr Levi Wolf for his advice on the statistical comparisons and tests that appear in our results; however, any errors or omissions remain solely our responsibility.
Declaration of conflicting interests
The authors declared no potential conflicts of interest with respect to the research, authorship, and/or publication of this article.
Funding
The authors disclosed receipt of the following financial support for the research, authorship, and/or publication of this article: This work was supported by the Economic and Social Research Council (grant number ES/N015053/1).
Supplemental material
Supplemental material for this article is available online.
Notes
Correction (March 2023):
This article has been updated with minor grammatical or style corrections since its original publication.
References
Supplementary Material
Please find the following supplemental material available below.
For Open Access articles published under a Creative Commons License, all supplemental material carries the same license as the article it is associated with.
For non-Open Access articles published, all supplemental material carries a non-exclusive license, and permission requests for re-use of supplemental material or any part of supplemental material shall be sent directly to the copyright owner as specified in the copyright notice associated with the article.