
Abstract
With an estimated annual worldwide death toll of between 290 000 and 650 000, seasonal influenza remains one of the deadliest respiratory diseases. Influenza vaccines provide moderate to high protection and have been on the World Health Organization’s Model List of Essential Medicines since 1979. Approximately 490 million doses of influenza vaccine are produced per year, but an investigation of geographic allocation reveals enormous disparities. Here, we present two maps that visualise the inequality of the distribution across 195 countries: a conventional choropleth map and a cartogram. In combination, these two maps highlight the widespread lack of coverage in Africa and many parts of Asia. As COVID-19 vaccines are now being distributed in developed countries, data for seasonal influenza vaccine distribution emphasises the need for policymakers to ensure equitable access to COVID-19 vaccines.
With the COVID-19 pandemic currently disrupting the economy, education, and other services globally, medical research institutions have been racing to find a vaccine so that society can return to pandemic-free normality. At the time of writing, the World Health Organization issued its first emergency use validation for a COVID-19 vaccine (World Health Organization, 2020), and many other vaccine candidates are undergoing various stages of clinical trials. While national governments are trying to secure their own vaccine supplies, the World Health Organization has emphasised the need for equitable global access. Can lessons about equity in global vaccine distribution be learned from available data for other diseases?
Here, we take a closer look at the global distribution of seasonal influenza vaccines. Worldwide, there are 3 to 5 million severe influenza cases per year, resulting in 290 000 to 650 000 deaths (World Health Organization, 2018). The seasonal influenza vaccine is 40%–60% effective (Centers for Disease Control and Prevention, 2020), and the World Health Organization recommends yearly vaccination, especially for people aged 65 years or older (World Health Organization, 2012). Despite this recommendation, Palache et al. (2015) found that vaccination coverage rates are below the target in almost all countries and for all risk groups. They defined a ‘hurdle’ rate of 159 doses per 1000 inhabitants as the number of doses required to vaccinate people aged ≥ 65 years in industrialised countries. In Figure 1(a), we present their data for 2013 as a choropleth map (i.e. a thematic map that uses colour to represent a statistical variable). Figure 1(a) reveals that Japan, South Korea, Australia, and New Zealand as well as most countries in Western Europe, North and South America achieve at least ≥ 100 doses per 1000 people. However, all African and most Asian countries fall far short of the hurdle rate. According to Palache et al. (2015), vaccine uptake in these countries is low because access to vaccination is insufficient and political commitment is lacking.
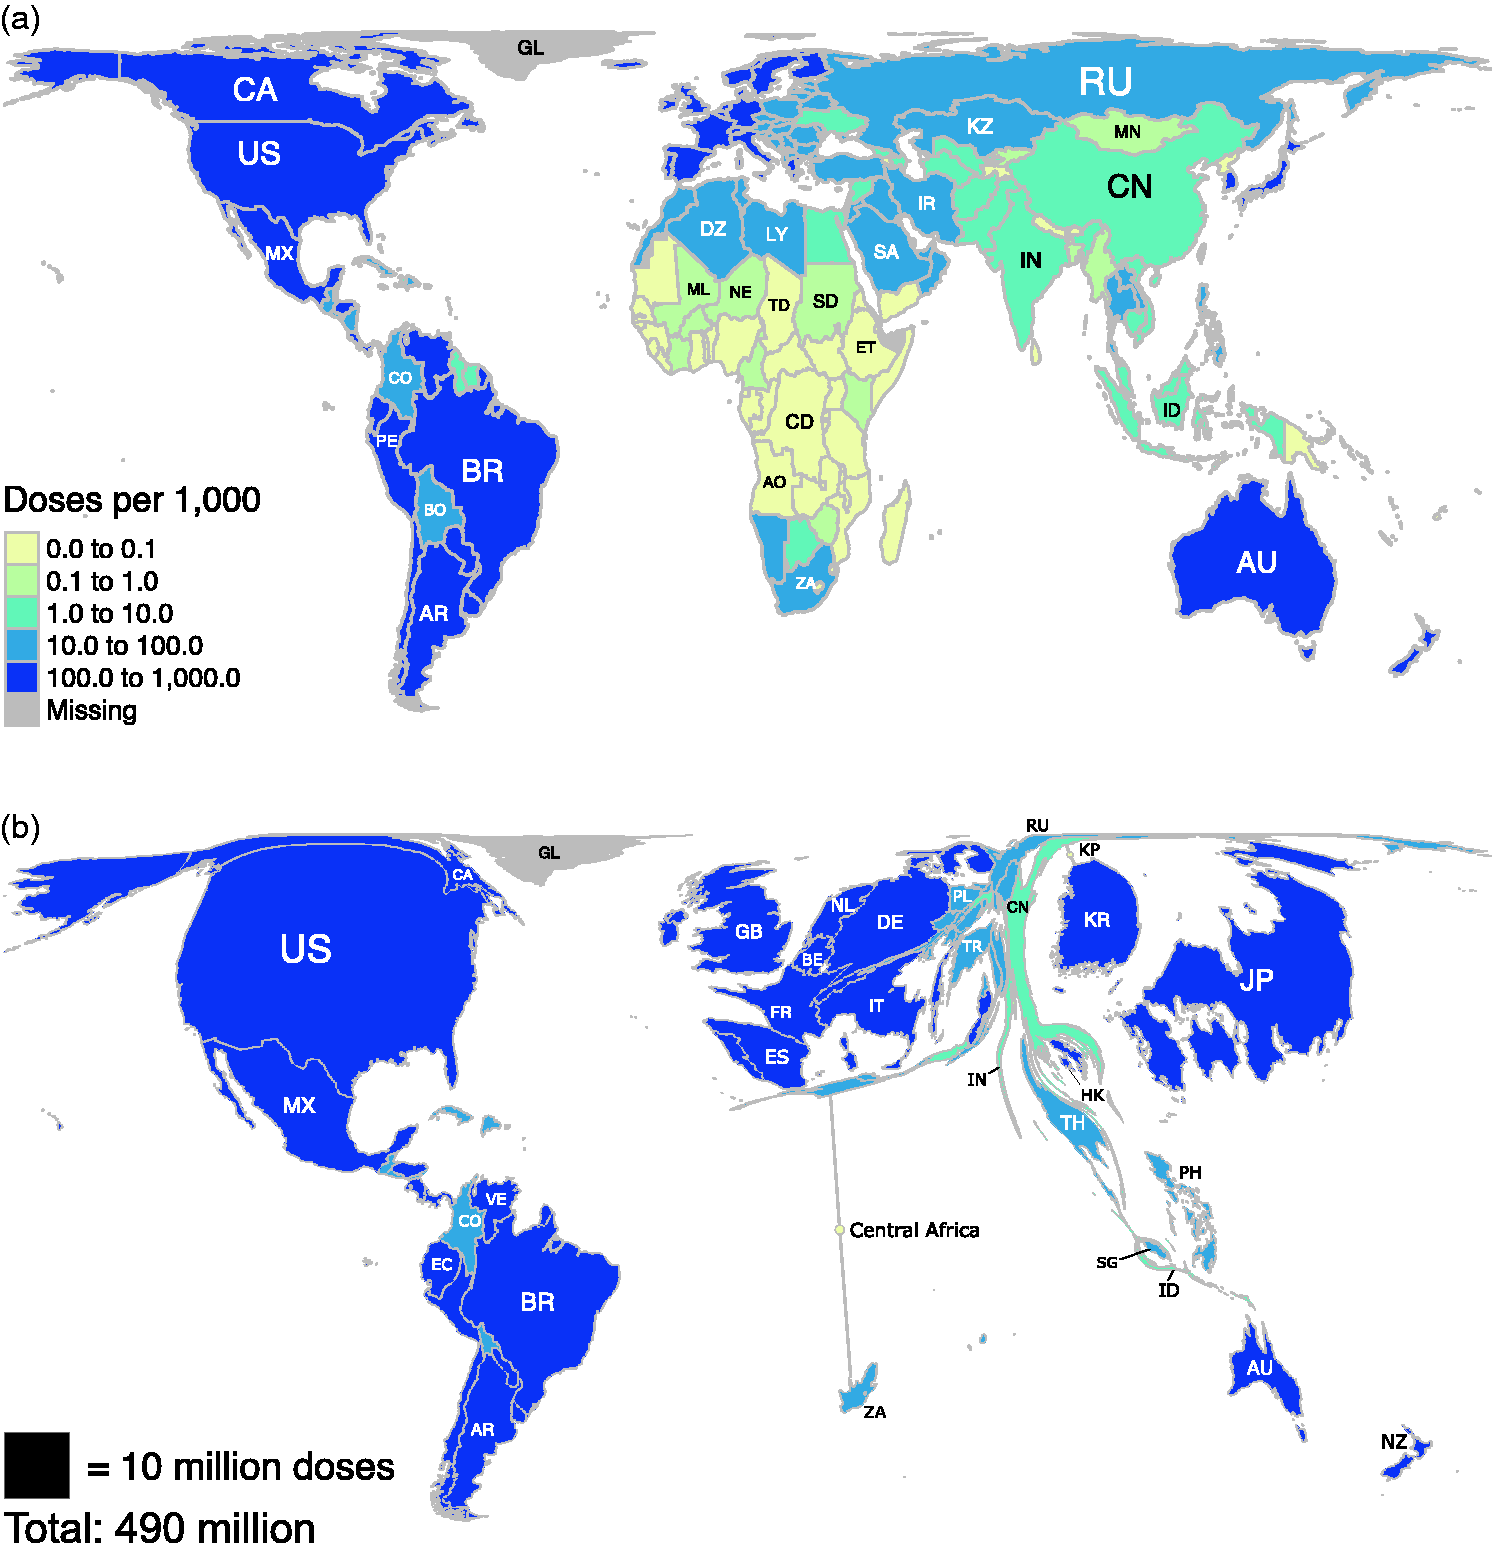
Maps of the global distribution of seasonal influenza vaccine in the year 2013. Data for vaccine doses are from Palache et al. (2015). Region boundaries and population data are sourced directly from the R package rnaturalearthhires (South, 2020), which uses boundaries based on de facto status. We do not adopt a political stance on these boundaries. (a) Choropleth map based on the Hobo-Dyer equal-area projection. (b) Choropleth cartogram where countries are depicted with an area in proportion to the number of vaccine doses. Countries with less than 100 000 doses have been removed from the cartogram. We indicate the positions of some of these countries with small circles for visual orientation.
Figure 1(a) follows the recommended practice that colours on a choropleth map should always represent normalised data (Foster, 2019). Here, the normalisation takes the form of a ratio: the number of doses divided by the population size. On a conventional equal-area projection (e.g. the Hobo-Dyer projection used in Figure 1(a)), the reader cannot retrieve the absolute number of doses from the colours alone, so it remains unclear what proportion of the worldwide total of 490 million doses, calculated from data by Palache et al. (2015) and South (2020), is received by each country. Therefore, we present Figure 1(a) alongside a cartogram (Figure 1(b)) based on a flow-based density-equalising map projection (Gastner et al., 2018). Areas in the cartogram are proportional to the number of doses, so the reader can simultaneously infer the absolute number (represented by area) as well as the relative number of doses per capita (represented by colour). Although countries in the cartogram are more challenging to identify because of their unusual shapes, the cartogram clearly depicts that countries with a high per-capita number (dark blue) also receive the majority of vaccine doses. China and India are small in the cartogram despite their large populations, but Palache et al. (2015) acknowledge that both countries may be underrepresented because dose distribution data from local vaccine manufacturers were unavailable. African countries receive only 1.1% of the global vaccine production and, therefore, Africa almost disappears from the cartogram except for South Africa and some countries in North Africa. Other regions that are virtually absent from the cartogram are Central Asia, the Balkans, and North Korea.
Figure 1 underlines the shortcomings of previous global vaccine distribution models, where the onus of securing sufficient vaccine doses was on each individual country. We can already see manifestations of the same problem in the distribution of the COVID-19 vaccine. On one hand, the international initiative COVAX aims to ensure an equitable distribution. On the other hand, several wealthy COVAX signatories undermine the agreement by negotiating directly with vaccine manufacturers. With this approach, the European Union and five other rich countries have already pre-ordered half of the global production capacity (Mullard, 2020). These side deals leave fewer doses available for an equitable global allocation.
In summary, Figure 1 reveals severe disparities in seasonal influenza vaccine dose distribution. As COVID-19 vaccines are developed and distributed globally, policymakers should prioritise equitable vaccine access to effectively combat the pandemic.
Footnotes
Declaration of conflicting interests
The author(s) declared no potential conflicts of interest with respect to the research, authorship, and/or publication of this article.
Funding
The author(s) disclosed receipt of the following financial support for the research, authorship, and/or publication of this article: This work was supported by the Singapore Ministry of Education (AcRF Tier 1 Grant IG18-PRB104, R-607-000-401-114) and a Yale-NUS Summer Research Programme. We would like to thank Editage (![]() ) for English language editing.
) for English language editing.