
Abstract
Data centers constitute a new kind of telecommunications infrastructure that demands attention for four reasons. Data centers are under-examined in the social sciences literature, urban studies, in particular. Data centers present an under explored geography of cyberworlds. Large digital corporations such as Amazon or Google are expanding their role in urban infrastructural development (such as data centers), and it is necessary to research and explain this phenomenon. Data centers present challenges of urban governance. The graphic provided here visualizes the social spatial distribution of data centers in the Washington Metropolitan Area. There are five implications of their social spatial distribution. Data centers are concentrated in metropolitan areas. Data centers have a high demand for energy and water, competing with local residents for these resources. The data center industry is a state-led niche economy. The uneven distribution of data centers can invoke inter-county competition for tax revenue, in addition to access to the water, power, and land resources that data centers require. The scale of the problem is unknown because the input needs of many data centers are not publicly available.
Cloud computing occurs in corporeal spaces: these are data centers (DCs), whose record speed of construction is accelerated against the digital needs of the global pandemic. DCs constitute a new kind of telecommunications infrastructure, requiring scholarly attention for four reasons. First, while there are established debates about the architecture and operational efficiencies of DCs, or related chip or server technologies, in engineering and/or information and computer science (Fleischer, 2020), attention to the societal implications of DCs is nascent. Indeed, some have addressed the ramifications of DCs on labor, real estate, ecology, and policy (Atkins, 2021; Brodie and Velkova, 2021; Jacobson and Hogan, 2021; Patchell and Hayter, 2021; Pickren, 2021), yet these are rather disparate observations, divided across a number of subdisciplines. This contribution aims to bring forward this conversation. Second, while scholars have long charted the social spatial geographies of cyberworlds and their backbone infrastructures (Dodge and Kitchin, 2001; Kitchin, 1998), attention to the geography of DCs is sparse. Third, large digital corporations (LDCs) like Amazon or Google are expanding their role in urban infrastructural development, and it is necessary to research and explain this phenomenon (Carr, 2021). Fourth, DCs present challenges of urban governance. While the DC industry has security standards and classification systems, which provide orientation to those in the industry itself, governing authorities remain ill-equipped to keep abreast of changes in the industry, the implications thereof. Some cities like Frankfurt or Amsterdam have taken measures to regulate—or cancel—construction (Büro der Stadtverordnetenversammlung, 2021; Gemeente Amsterdam, 2019).
Figure 1 visualizes the social spatial distribution of DCs across the Washington Metropolitan Area (WMA), showing both the pressures on resources that DCs exert in their corresponding jurisdictions. There are five implications of these. First, as DCs concentrate in metropolitan areas, Figure 1 suggests that the digital economy continues to thrive on the markets of global cities, as they have for decades (Malecki, 2002).
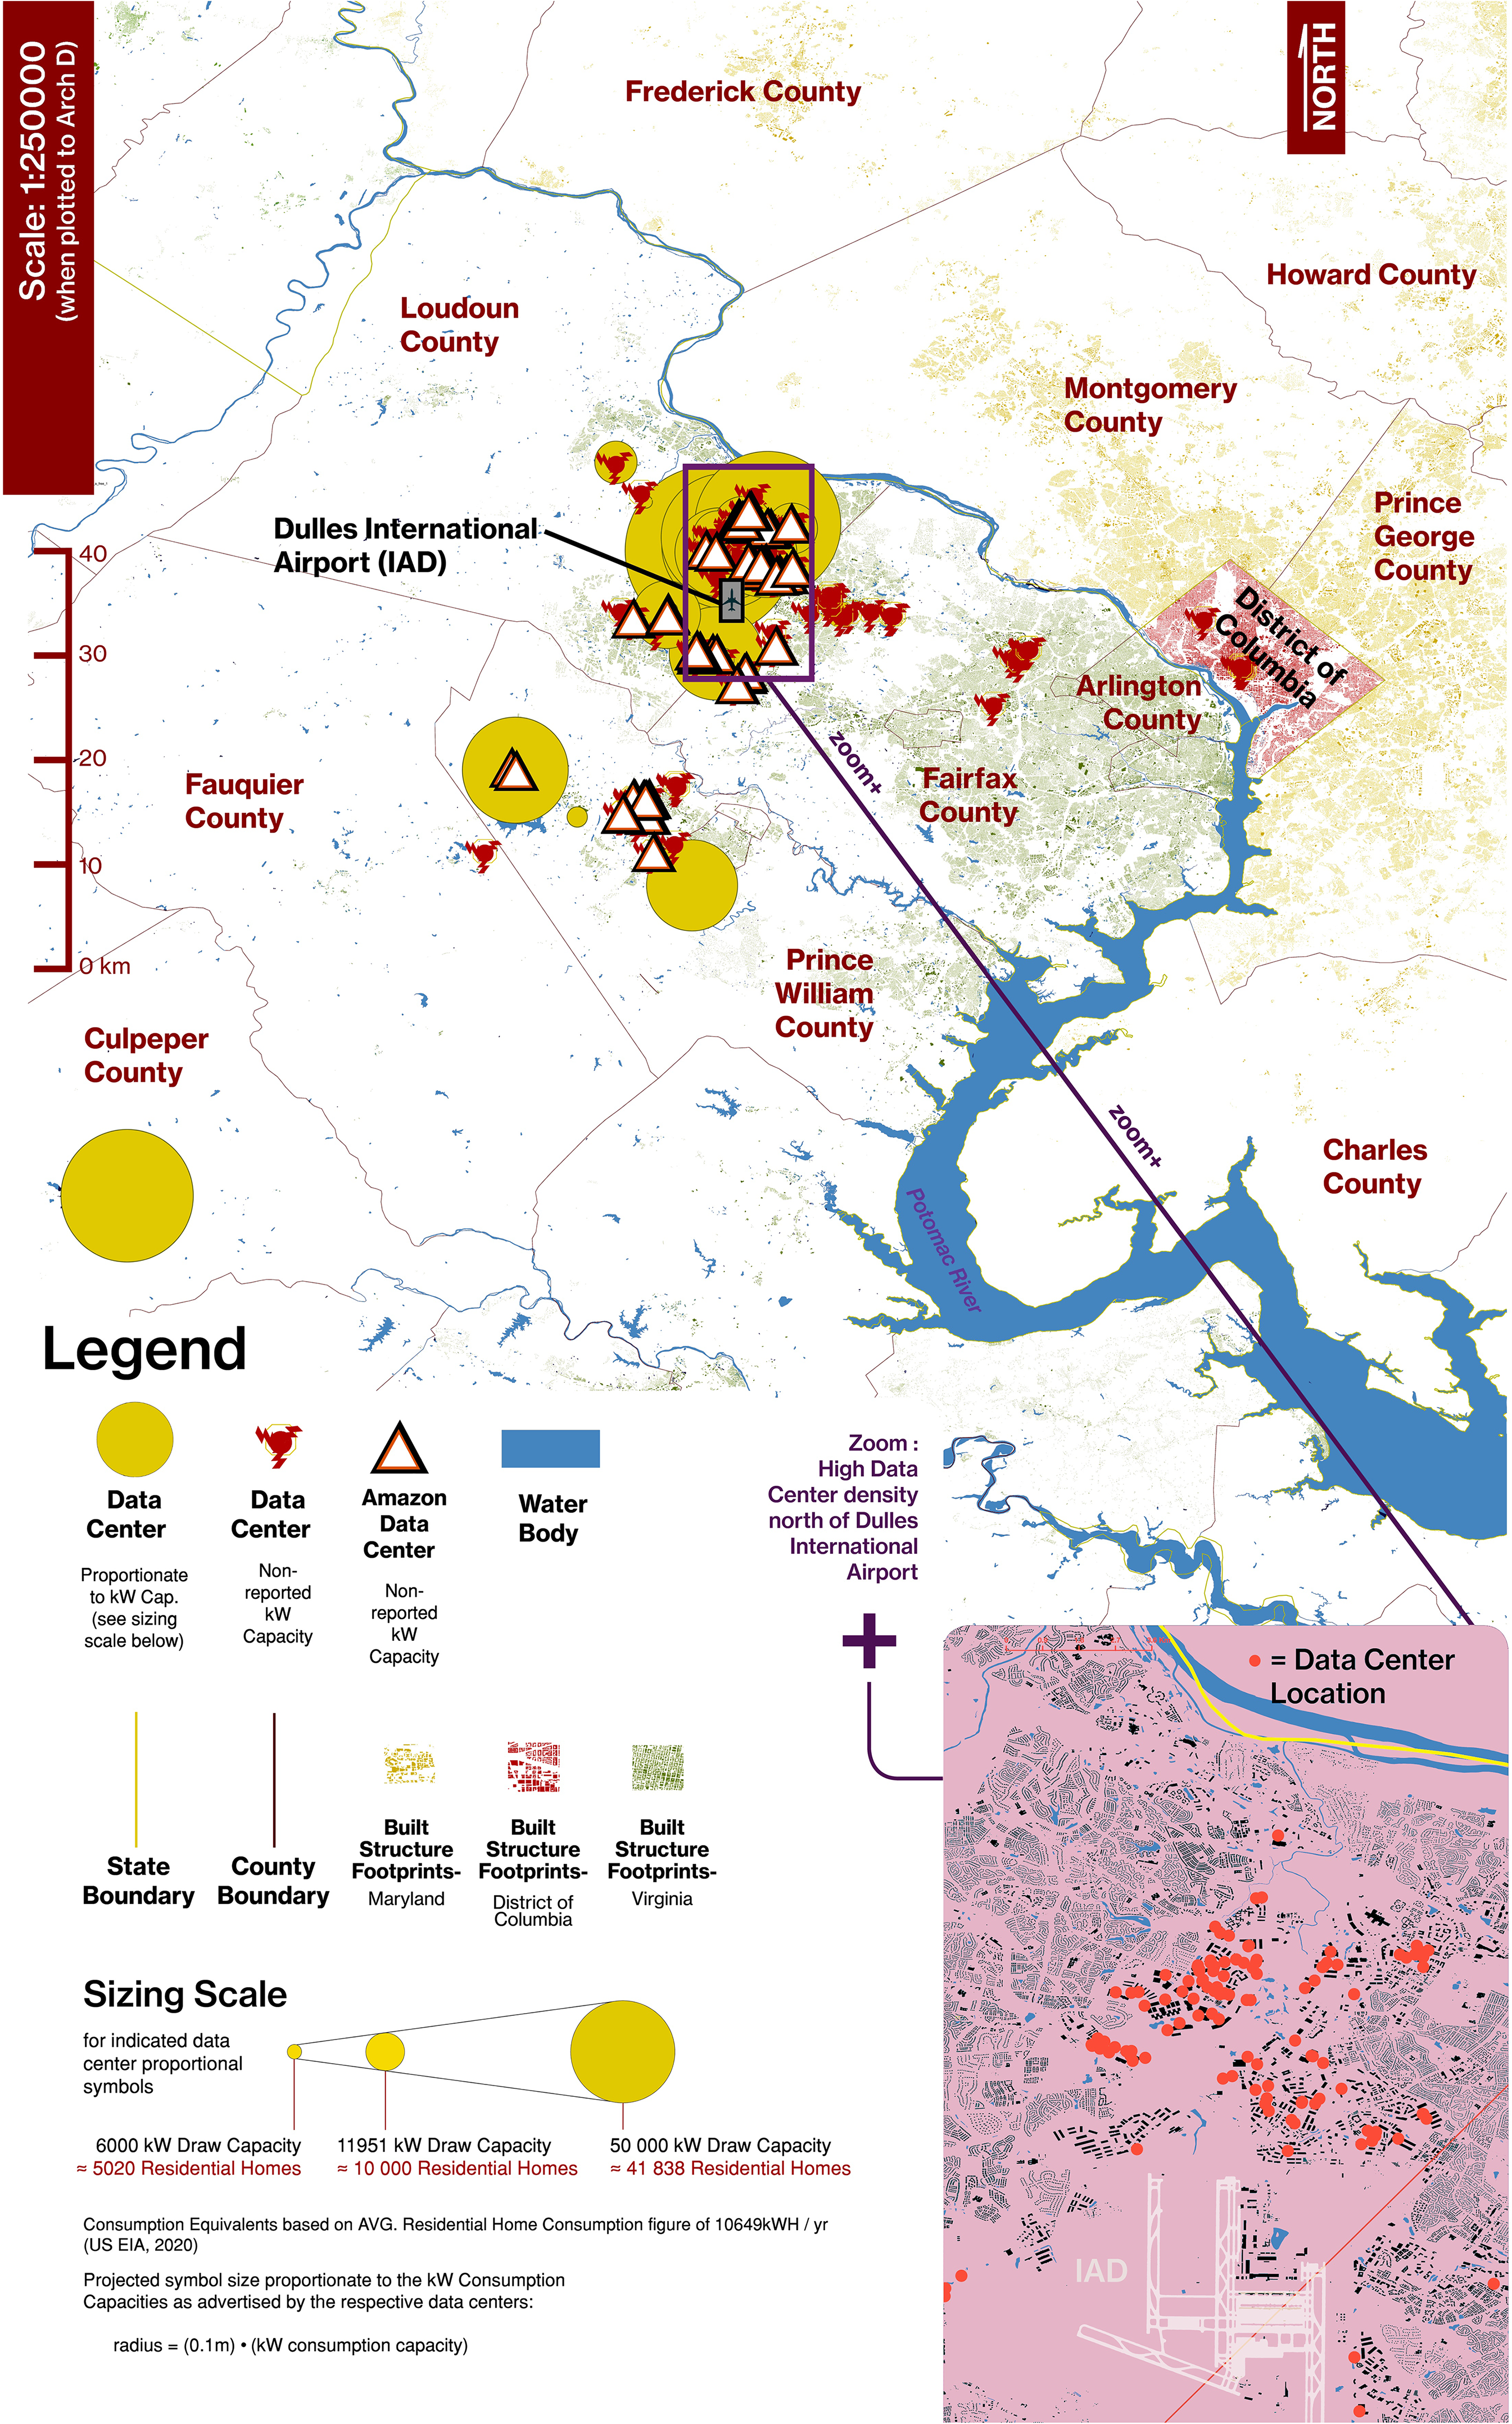
Data centers in the Washington Metropolitan Area and respective kW needs.
Second, hyperscale DCs are built on or near rivers signifying an additional factor in location choice, and they demand high energy input. Figure 1 compares this energy use to that of an average residential home, according to the US EIA (2020). Cooling is a problem and water is the most effective method of regulating temperature (Fleischer, 2020). The affected rivers in the WMA are the Loudoun County watershed (including Broadrun Creek) and Potomac River. Figure 1 also shows the scale of energy consumption. Notable are the enormous quantities of power and water that hyperscale DCs consume. These upstream input needs pit DCs in competition with residents for these resources.
Third, the DC industry is state-led. Figure 1 shows that DCs concentrate inside Loudoun County. Cities compete for DCs in order to anchor capital investments and tax revenues (Molenaar, 2016), developing a competitive niche economy in global flows that is not unusual (Hesse, 2016). Figure 1 suggests that the sovereign ability to develop local economic regimes to reap respective revenues lays at the county level in the State of Virginia, explaining the concentration in Loudoun County and uneven spatial distribution of DCs across the wider WMA (Figure 1).
Fourth, the uneven distribution of DCs may invoke inter-municipal or inter-county competition for tax revenue and access to water, power, and land resources that DCs require. This possible conflict is heightened by the fact that data processing and controlling is increasingly centralized in hyperscale DCs that are largely powered by LDCs. As this concentration increases, local governing administrations shoulder a greater burden in maintaining the availability of upstream resources, and legitimizing this against neighboring administrations and residents alike.
Fifth, the scale of the above problems remains largely unknown because many DCs do not publish their input needs (Figure 1). For example, Amazon.com alone operates 52 known DCs in the WMA, and 43 of these do not publish information about their upstream input dependencies.
Footnotes
Acknowledgments
This featured graphic is part of a greater project entitled, “Digital urban development - How large digital corporations shape the field of urban governance, (DIGI-GOV),” principally investigated by Dr Constance Carr. All of the authors thank the Luxembourg National Research Fund for its financial support for DIGI-GOV (C20/SC/14691212/DIGI-GOV). The authors also thank Prof. Markus Hesse for his constructive feedback and support.
Author's note
Building footprint and water body data was drawn from OpenStreetMap (2021), available at https://www.openstreetmap.org. Boundary data was drawn from Global Administrative Area (2021) University of California, Berkeley, available at ![]() . Data was processed using MS Excel, maps were drawn with ArcMap 10.3.1, the visual was further edited with Adobe InDesign and Procreate.
. Data was processed using MS Excel, maps were drawn with ArcMap 10.3.1, the visual was further edited with Adobe InDesign and Procreate.
Declaration of conflicting interests
The authors declared no potential conflicts of interest with respect to the research, authorship, and/or publication of this article.
Funding
The authors disclosed receipt of the following financial support for the research, authorship, and/or publication of this article: This work was supported by the Fonds National de la Recherche Luxembourg (grant number C-C20/SC/14691212/DIGI-GOV).