
Abstract
Ridesourcing advocates and companies promise many benefits to cities, such as increased accessibility, a solution to the last-mile transit problem, and even reduced need for automobiles. However, an important body of research has indicated that ridesourcing is more heavily used by more privileged consumers and in more affluent and whiter neighborhoods. Questions have also emerged about the effects of ridesourcing on public transportation. This study builds on a mobility disparities perspective by analyzing ridesourcing in the context of urban inequality, including gentrification and displacement. Using a large data set from the Chicago area, this study shows that ridesourcing is associated with areas that have seen rising rents and have become whiter and more educated. The results also show that ridesourcing is more prevalent in areas that are accessible by public transportation. Although the causal relationship between ridesourcing and gentrification is complex, the study suggests a new direction in the literature that embeds the analysis of ridesourcing in the broader frameworks of unequal urban development and neoliberalization. The study also suggests policy approaches that could help to reduce some of the connections between ridesourcing and urban inequity.
Introduction
In the past decade, Transportation Network Companies (TNCs) have influenced the patterns of mobility and the socio-economic landscape of urban areas. For example, usage data from the Pew Research Center (2019) found that in 2018 36% of US adults had used ridesourcing in comparison with only 15% of US adults in 2015 (Pew Research Center, 2019). The widespread adoption of smartphones allows individuals to conveniently schedule on-demand vehicle trips through private app-based mobility services like Uber and Lyft (Anderson, 2014). The on-demand features, such as customized transportation routes, coupled with the historic and cultural influence of the automobile (Henderson, 2006), make ridesourcing a desirable option for city mobility. Given the rapid proliferation of ridesourcing, it is prudent that researchers explore the influence of this mode of shared mobility in multimodal transit landscapes, including its impact on accessibility and other measures of city equity.
Although prior studies have explored the relationship between ridesourcing and its impact on public transportation (Gehrke, 2020; Gehrke et al., 2019) and on taxi usage (Anderson, 2014; Bialik et al., 2015), we are interested in answering a different set of questions pertaining to equity: Who is benefiting from the growing dominance of ridesourcing, and who is losing? How does ridesourcing relate to growing patterns of inequity in the city such as gentrification, displacement, and other patterns of unequal development? Survey research has shown that those using ridesourcing services are typically younger and wealthier, and they have high levels of education (Clewlow and Mishra, 2017; Rayle et al., 2016). Not only are these findings reminiscent of the demographic differences of the digital divide (Jin et al., 2018), but they also match the stereotypical cultural imagery attached to gentrifiers in urban sociology literature (Zukin, 2009).
This paper uses ridesourcing to demonstrate how gentrification and unequal development are unbounded relational spatial processes (Lawton, 2020; Poorthuis et al., 2021). Essentially, ridesourcing, and specifically TNCs, are part of a broader set of social and spatial processes that exist beyond the neighborhood but have the potential to reconfigure the way that people are connected or disconnected from urban places. Although some studies have used point-in-time spatial data to examine the link between city-level demographics and ridesourced trips (Jin et al., 2019), few have taken a spatial-temporal approach by examining the relationship between ridesourcing and larger patterns of demographic change (Gehrke, 2020). Using Chicago as a case study, we contribute to the existing literature by building on survey and spatial studies of ridesourcing to develop a perspective that situates ridesourcing within a broader framework of transportation accessibility, unequal development, and demographic change in urban areas. Chicago is an excellent city for such research given its history of uneven transportation development and decades of landmark research in urban sociology that has explored the political and economic processes of neighborhood change in this city (Drake and Cayton, 1970; Farmer, 2011; Park et al., 1925).
This work is imperative given the current and growing popularity of ridesourcing and future growth of automated ridesourcing. TNCs are integral to the growth of the sharing economy, and as for-profit companies with massive revenues, they exist for the purpose of capital accumulation. They have positioned themselves as integral to the neoliberal city that Logan and Molotch (1987) famously referred to as “growth machines.” As such, ridesourcing has the potential to reinforce and deepen existing systems of social stratification that pattern transportation accessibility and affect social, economic, and political inclusion (Handy and Niemeier, 1997; Lucas, 2012; Vickerman, 1974). TNCs and other technology companies have already invested billions of dollars in developing an urban transportation regime that includes ridesourcing and prepares for a future that incorporates connected and automated vehicles. TNCs have the potential to compete with public transportation systems, which could impact transit accessibility for vulnerable non-discretionary riders, including people of color and the poor. Thus, analyzing the connection between urban inequity and ridesourcing can help us to gain a better understanding of future areas of concern and to develop better policies to reduce negative impacts for structurally disadvantaged groups.
The study is organized as follows. In the theoretical background section, we assess the most relevant literature on ridesourcing and equity, including survey research on the characteristics of ridesourcing users and studies that explore the spatial relationship between ridesourcing, city demographics, and public transportation systems. Then, we link these studies to a broader perspective on how TNCs relate to processes of uneven development, gentrification, and displacement in urban areas. Next, we introduce our data, variables and variable construction, and analytic approach, followed by our results. The final section offers a summary of the main theoretical concepts and empirical findings and suggests future research directions and policy implications.
Theoretical background
Social equity in current ridesourcing research
This section synthesizes findings from past studies that address the social equity issues associated with the adoption and growth of ridesourcing services, and subsequently their impact on public transit systems, in urban areas. We conceptualize this literature as adopting a “mobility disparities” perspective in the sense that researchers have offered valuable and important information on how urban demography is related to unequal access and use of ridesourcing. In general, this research can be split into two broad categories. The first category of studies uses survey methods to evaluate the demographic characteristics of ridesourcing users. The second category of studies uses spatial methods to explore associations between demographic characteristics of geographic areas (such as zip codes or census tracts) and ridesourcing usage.
Survey research has generally shown that ridesourcing users are more likely to be younger, better educated, and wealthier (Clewlow and Mishra, 2017; Rayle et al., 2016). Rayle et al. (2016) conducted an intercept survey in three San Francisco hotspots and found that the age distribution skews younger, 84% of respondents had a bachelor's degree or higher, and households making below $30,000 were underrepresented. Clewlow and Mishra (2017) deployed a survey in seven cities to explore travel behavior and found that most ridesourcing users are between the ages of 18 and 49, have a bachelor's or advanced degree, and have incomes above $75,000. Survey research on the race and ethnicity of users has generally shown that whites are more likely to use ridesourcing services in comparison to Black and Hispanic populations. After conducting an intercept survey of the greater Boston area, Gehrke et al. (2019) found that respondents tended to be younger and whiter, but they did not find major income discrepancies when examining city-level trends. 1 Alemi et al. (2019) found that individuals who adopt on-demand ride services in California are more likely to be of non-Hispanic origin. Conway et al. (2018) found that Black individuals were slightly less likely than whites to use ride hailing but that Asian individuals use ride hailing much more than whites.
Research using spatial methods examining the general socio-economic demographics of urban areas and ridesourcing is generally consistent with the results of survey research. However, this research is still in its nascent stages. In a comparative study of six cities, Feigon and Murphy (2018) found that zip codes with the highest level of TNC activity had residents that had higher levels of education, were younger in age, and were whiter compared to the cities in which they are located. Brown (2019) used Lyft data from Los Angeles combined with census-tract level data and found that white neighborhoods were positively associated with Lyft rides, whereas majority Asian and Hispanic neighborhoods were associated with less service. However, the study did not note differences in per capita trips between majority Black and majority white neighborhoods.
Some of the research that uses spatial methods addresses another important dimension of research on ridesourcing and urban inequality. In addition to tracking the mobility disparities associated with demographic variables of individuals or census tracts, the research also examines the impacts of ridesourcing on public transportation. Specifically, this area of research asks: is ridesourcing in competition with public transportation or is it complementary to it? Researchers have argued that from a temporal perspective, ridesourcing is more frequently used at night and in the early morning hours when public transit systems are not running (Feigon and Murphy, 2018). From a spatial perspective, ridesourcing shares the same deficiencies as public transit because it has yet to expand its service to peripheral suburban and rural areas (Gehrke, 2020; Schaller, 2018). Yet, others have argued that ridesourcing can serve as a feeder for public transit systems (Williams, 2017). Although some cities have attempted to regulate ridesourcing offered by TNCs, other cities have agreed to substitute certain public transit routes with subsidized rides (Shaheen and Cohen, 2019).
Very few studies have addressed the spatiotemporal relationship between ridesourcing and public transit and how this relationship impacts urban transportation in a single study. One notable exception is a study by Jin et al. (2019), which combines data on public transit coverage with Uber trip data in New York City (NYC). They find that that Uber competes with public transit during day-time hours and that there is a negative correlation between number of Uber pickups and percentage of racial minorities. In general, these findings confirm those of other survey and spatial analyses that identify racial disparities. Likewise, experimental research has shown discriminatory behavior toward minorities by ridesourcing drivers (Ge et al., 2016). Marquet (2020) explores the spatial distribution of ridesourced trips and its association with walkability and race and class indicators in Chicago. This study finds a negative association between transit accessibility and ridesourcing but argues that there is a lack of racial disparities in ridesourcing demand.
In summary, existing research on ridesourcing has identified important demographic and spatial aspects of how ridesourcing may reinforce existing patterns of inequity in the city. For example, they seek to answer questions such as: What is the diversity of ridesourcing users? How have drivers discriminated against structurally marginalized riders? What is the correlation between ridesourcing in a city and current demographic characteristics? We build on this important research by bringing a temporal dimension to the existing spatial analyses. We also connect the research question of ridesourcing's impact on city equity by evaluating how this service is situated within the larger political economy of the city, and how it relates to the patterns of demographic change, including urban gentrification, between the time that ridesourcing began and the current time.
Ridesourcing and urban development
Ridesourcing companies like Uber and Lyft emerged in cities only a decade ago. One of the promises of ridesourcing is that it could end personal car ownership, and another is that it would improve public transportation by offering a solution to the “last mile problem” of seamlessly connecting people from public transportation stops to their destination through on-demand ride hailing. However, survey research has largely shown that these arguments are inaccurate. With respect to the claim about reducing car ownership, Rayle et al. (2016) noted that 90% of their respondents made no changes to their car ownership when they started using ridesharing. This same finding was echoed in a study by Clewlow and Mishra (2017) that spanned seven cities. Anderson (2014) noted that ridesourcing can even encourage private ownership because drivers use the service to buy new automobiles or subsidize car payments on existing ones. With respect to the last-mile problem, there is little evidence that ridesourcing provides a solution. As noted above, ridesourcing tends to be used when public transit is not running, and there is some evidence that it has replaced public-transit lines. Jin et al. (2019) also note that the majority of studies exploring the complementary nature of ridesourcing to public transit regimes has used evidence provided by the TNCs themselves, who have a vested interest establishing political alliances with public transportation operators and city-level political operatives. Thus, the benefits that ridesourcing advocates and companies have promised are likely overstated.
Moreover, TNCs also generate challenges for the urban labor force and for local government regulation. For example, TNCs are an integral part of the growing sharing economy, which has led to an increase in precarious labor and the restructuring of the political economy of the city. Cities are often leading the government responses to the development of regulation. However, there have been numerous cases across the US, including in Austin and NYC, that highlight how cities are struggling to regulate TNCs. In 2018, NYC limited the total number of Uber licenses after three years of expensive campaigns, and the city also set a minimum for driver pay (Fitzsimmons, 2018). The City of Austin passed legislation that would require Uber and Lyft to fingerprint employees and to conduct background checks (McPhate, 2016). The companies responded by leaving the city and hiring lobbyists to battle the city government's rules in the Texas state legislature. Each of these companies has been involved in battles against classifying drivers as anything other than “contractors” to avoid having to pay out benefits. Wells et al. (2021) argue that TNCs have created “just-in-place” labor that leads to isolation and disempowerment to discourage worker solidarity.
Although these examples indicate how city governments can attempt to develop regulations that defend the rights of drivers and riders, the protective actions occur in the context of a neoliberal strategy of economic development. Jessop (2002) notes that cities have become complicit in neoliberalization by engaging directly in governance and development that attends to the interests of capital accumulation. Scholars of political economy have positioned cities as products of neoliberalism (Harvey, 2008; Sassen, 2006) and even referred to them as facilitating “growth machines” (Logan and Molotch, 1987). Attempts to regulate the sharing economy are certainly not in the interest of TNCs, nor do they fit within the growing neoliberal economic policies of city developers (Stehlin et al., 2020). Unfortunately, the labor markets that serve TNCs at the city level are produced by the patterns of uneven development and massive income inequality (Peck and Theodore, 2001). Essentially, ridesourcing companies would not exist without having access to a labor force that relies on contractual labor for either supplementary income or survival. The contingent labor pool also enables TNCs to have greater control over their drivers (Cockayne, 2016). Patterns of unequal development in cities lead to disparate patterns of ridesourcing usage and further separate those who benefit from ridesourcing from those who do not.
The sharing economy has also been linked to the patterns of gentrification through an increase in unaffordable housing and lack of livable wages in urban areas (Wachsmuth and Weisler, 2018). Survey research on typical ridesourcing users reveals a similar pattern that matches the typical descriptions of gentrifiers who benefit from these patterns of unequal development. However, there has been much debate in the urban literature on both the process and extent of gentrification, which in turn has led to difficulty in observing and measuring the phenomenon. Smith (1998) defines gentrification as “the process by which central urban neighborhoods that have undergone disinvestments and economic decline experience a reversal, reinvestment, and the in-migration of a relatively well-off middle- and upper middle-class population” (198). Kennedy and Leonard (2001) provide another, even broader definition of gentrification: “the process of neighborhood change that results in the replacement of lower income residents with higher income ones” (1). In general, gentrification is frequently defined in three ways: as a class-based process that leads to a demographic transition (Atkinson, 2000; Freeman, 2005), as a process that changes the material environment and aesthetics of a neighborhood (Hwang and Sampson, 2014; Hyra, 2015), or as a process in which demographic or material changes specifically lead to displacement (Slater, 2004).
We agree with Lawton 2020 and Poorthuis et al., 2021, who argue that gentrification is often defined as a bounded process that ignores the complexity of urban space. Urban spaces do not exist in a vacuum and are dynamically produced and reproduced through social processes of change. As such, gentrification is better understood as an extensive, unbounded relational spatial process. Such a view allows for us to understand gentrification as a phenomenon that may produce both class-based demographic changes and physical changes in space. Furthermore, it allows for us to investigate the relationship between gentrification and displacement, including racial displacement, an imperative connection given recent scholarship on racial capitalism and the inseparable nature of capitalist production and racial inequity in cities (Roy, 2017).
Although there are studies that link public transportation upgrades, such as light rail, to the patterns of gentrification (Hess and Almeida, 2007) and public transportation to housing costs (Kramer, 2018), there is little empirical and theoretical work that examines how ridesourcing relates to gentrification and displacement. Yet, the discussion above suggests that TNCs are linked to the current political economy of the city through a process of unequal development, including gentrification and displacement. McElroy and Werth (2019) use the term “Uber-gentrification” in conjunction with Uber moving its headquarters to Oakland, California, and exacerbating the current unaffordable housing crisis in the area. However, the broader concept of TNC gentrification can be linked to a more ubiquitous process, whereby the proliferation of ridesourcing, and not simply the locale of a TNC headquarters, is connected to the temporal patterns of inequity stemming from the neoliberalization of the city. If we are to understand gentrification as a relational process, such a point speaks to how gentrification is linked to social, political, and economic processes that reach beyond the boundaries of a single neighborhood.
In the following sections, we lay out our empirical approach and results that explore how social and physical changes associated with gentrification and displacement relate to ridesourcing in Chicago. We examine ridesourcing in conjunction with multiple variables associated with gentrification and displacement including physical upgrading (age of existing housing stock), the increased cost of housing, and changes in race and class dynamics. We also include the measures of public transportation usage and coverage because ridesourcing is part of a multimodal system in urban space. Although our analysis does not address the debate in the literature on whether ridesourcing competes with or complements public transportation services, it does speak to how ridesourcing is linked to public transit coverage and ridership. Thus, changing demographics and development associated with higher ridesourcing can also lead to a crisis of public transportation accessibility, whereby those who rely on public transit the most (non-discretionary riders) are blocked from both modes of transit.
Methods
Data sources
The data for this project were collected from four major sources.
Travel times for TNC pickups were collected for every census tract in the city boundaries for October of 2019 during the morning peak period (6am–10am) on weekdays. 2 October was chosen for a couple of reasons. First, it was the month with the most complete data that had minimal holidays. 3 Furthermore, weather in the month of October was relatively mild in 2019, and the minimal precipitation meant fewer travel delays (Gehrke, 2020). Thus, this travel time reflects a routine pattern of high-volume auto traffic in most major urban areas. There was a total number of 2,123,743 TNC rides documented from the month of October that matched our description (out of 7,996,876 altogether in October), and unsuppressed travel information was available for 856 census tracts. 4
Variables
Variable names, descriptions, operationalization, and data sources can be found in Table 1. The dependent variable, ridesourced trips, represents the total number of ridesourced pickups for each census tract. Due to positive skew, we log-transformed this variable. 5 The independent variables are split into four major categories. First, we include two race and ethnicity variables: percent white and percent Black and Hispanic non-white. We include these racial variables to explore the patterns of racial displacement. Furthermore, past survey-level research has generally found evidence that whites are more likely to use ridesourcing than people of color (Alemi et al., 2018, 2019; Conway et al., 2018; Gehrke et al., 2019). Similarly, research using spatial units of analysis has demonstrated a negative correlation between people of color and level of ridesourcing (Jin et al., 2019).
Description of variables.
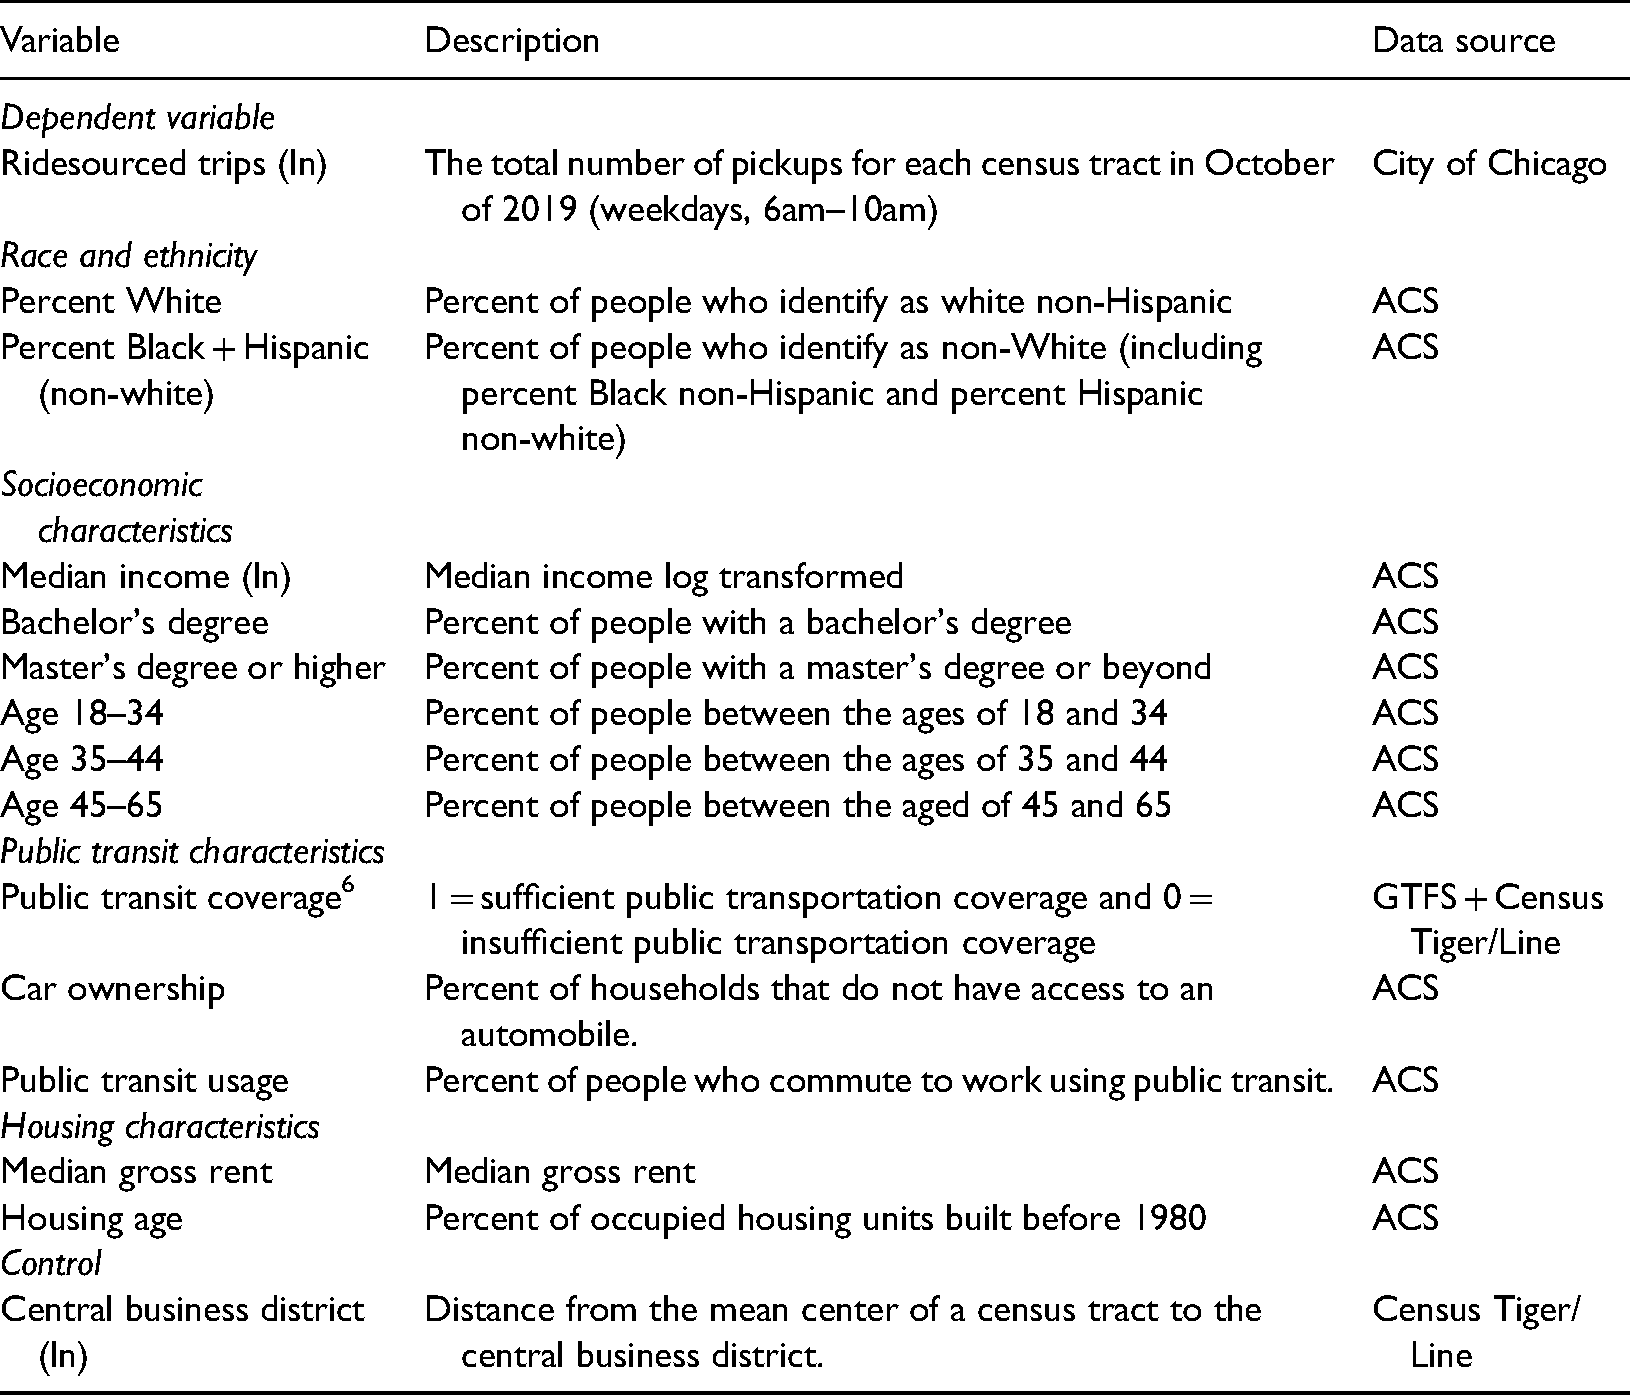
We include six socio-economic variables: median income, percent of people with a bachelor's degree, percent of people with a master's degree or higher, percent aged 18–34, percent aged 35–44, and percent aged 45–65. These variables were chosen because survey research has indicated that those using ridesourcing are likely to be more affluent, have higher levels of education, and are younger in age (Clewlow and Mishra, 2017; Rayle et al., 2016). Furthermore, research that defines gentrification as a class-based process typically includes the measures of education and/or income.
We include three variables that relate to public transit characteristics: public transit coverage, percent of households that do not have access to an automobile, and the percent of people who commute to work using public transportation. Public transportation coverage is a binary variable where 1 represents sufficient public transportation coverage and 0 represents insufficient public transportation coverage. A census tract has sufficient public transportation coverage if it has a stop that is within walking distance (400m for bus and 800m for rail).
We include two housing measures: median gross rent and percent of occupied housing units built after 1980. Median gross rent speaks to the diminishing affordability that is associated with unequal development in cities. Furthermore, decreases in the percent of homes built before 1980 demonstrate visible patterns of physical neighborhood upgrading as opposed to simply changes in class dynamics (Kennedy and Leonard, 2001; Smith, 1998).
Finally, we include one control measure, distance to the central business district (CBD), which measures, in miles, the distance from the mean center of the census tract to the CBD of Chicago. This variable is included as a control measure because ridesourcing is often concentrated in downtown areas and remains a largely urban phenomenon that has yet to penetrate more suburban areas with higher levels of automobile dependency (Schaller, 2018).
Analytic approach
To examine the relationship between ridesourced trips, demographic change, and public transportation coverage and usage in the city of Chicago, we follow a similar analytic approach to prior studies on ridesourcing that use the combinations of visualization, correlation, and regression analysis (Gehrke, 2020; Jin et al., 2018). First, we present a series of maps that graphically represent the number of ridesourcing trips per census tract, a map that depicts census tracts that have sufficient public transportation coverage versus those that have insufficient coverage, and maps that represent measures of race and class equity. These maps provide a visualization of the current transportation and demographic characteristics of areas of the city with high ridesourcing versus those with low ones. Next, we present two sets of results that depict the relationships ridesourcing, public transportation coverage, and patterns of demographic change and neighborhood upgrading. These results include descriptive statistics and correlation analysis, followed by a series of linear models.
Results
Mapping ridesourcing in Chicago
Figure 1 provides a citywide visualization for ridesourced trips in Chicago, the dependent variable of interest in this study. The dot density map shows circles increasing based on the number of ridesourced trips in the census track. It appears that areas with more ridesourced trips during the morning peak hours on weekdays are mostly concentrated in the urban core in neighborhoods such as Lincoln Park, North Center, Near North Side, and other areas in northeast Chicago near Lake Michigan. There is also a concentration of trips surrounding the Hyde Park neighborhood, which is located farther south and contains the University of Chicago. Areas with less ridesourced trips are scattered in inner and outer suburban rings and in neighborhoods in South Chicago and the West Side including Riverdale, Avalon Park, Washington Park, and other historical Black neighborhoods. Fewer ridesourced trips are also observed in sprawling suburban areas of northwest Chicago such as Norwood Park, Jefferson Park, and Edison Park.
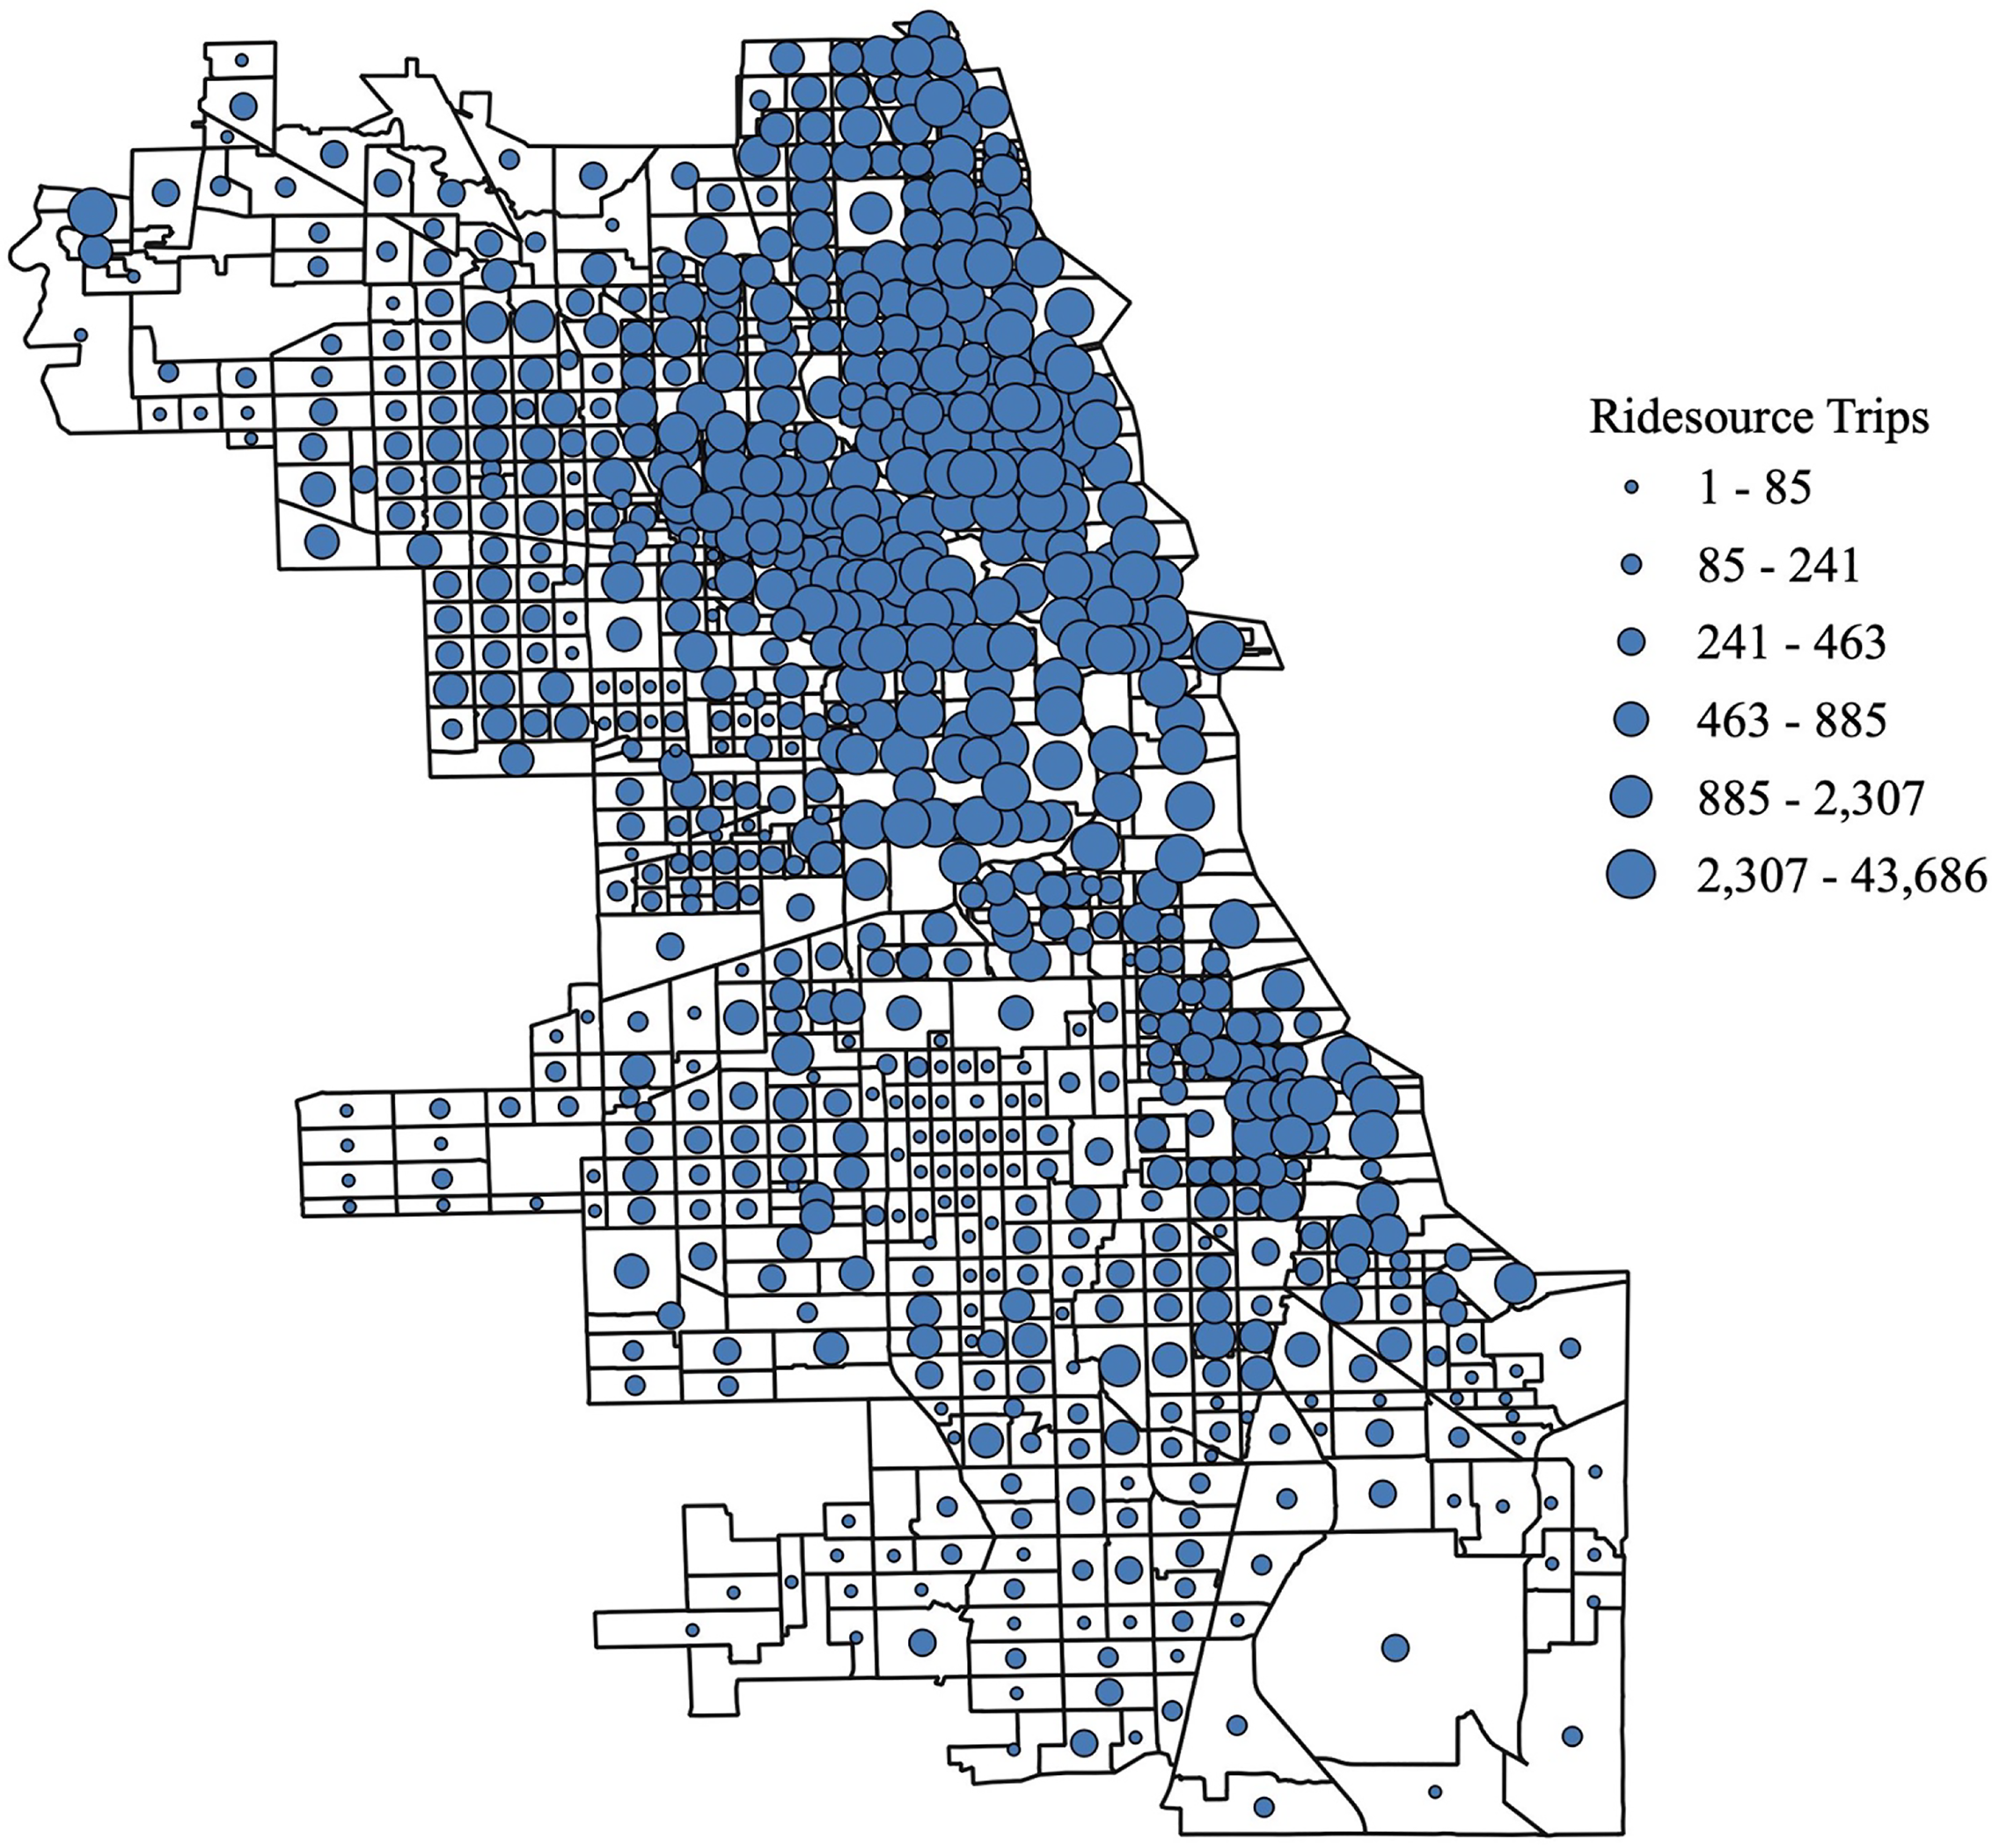
Ridesource trips in Chicago (2019–2010).
Figure 2 provides a graphical representation of change in median family income per census tract. By visually comparing the findings from Figure 1 to Figure 2, it appears that many of the areas with high levels of ridesourcing in northeast Chicago also have rising incomes. Figures 3, 4, and 5 provide a graphical representation of the change in percent white, change in percent Black and Hispanic, and change in median rent, respectively. Like income, areas that have seen either a stable or increasing white population appear to have more ridesourced trips. Similarly, areas with increasing rents also appear to have more ridesourced trips.
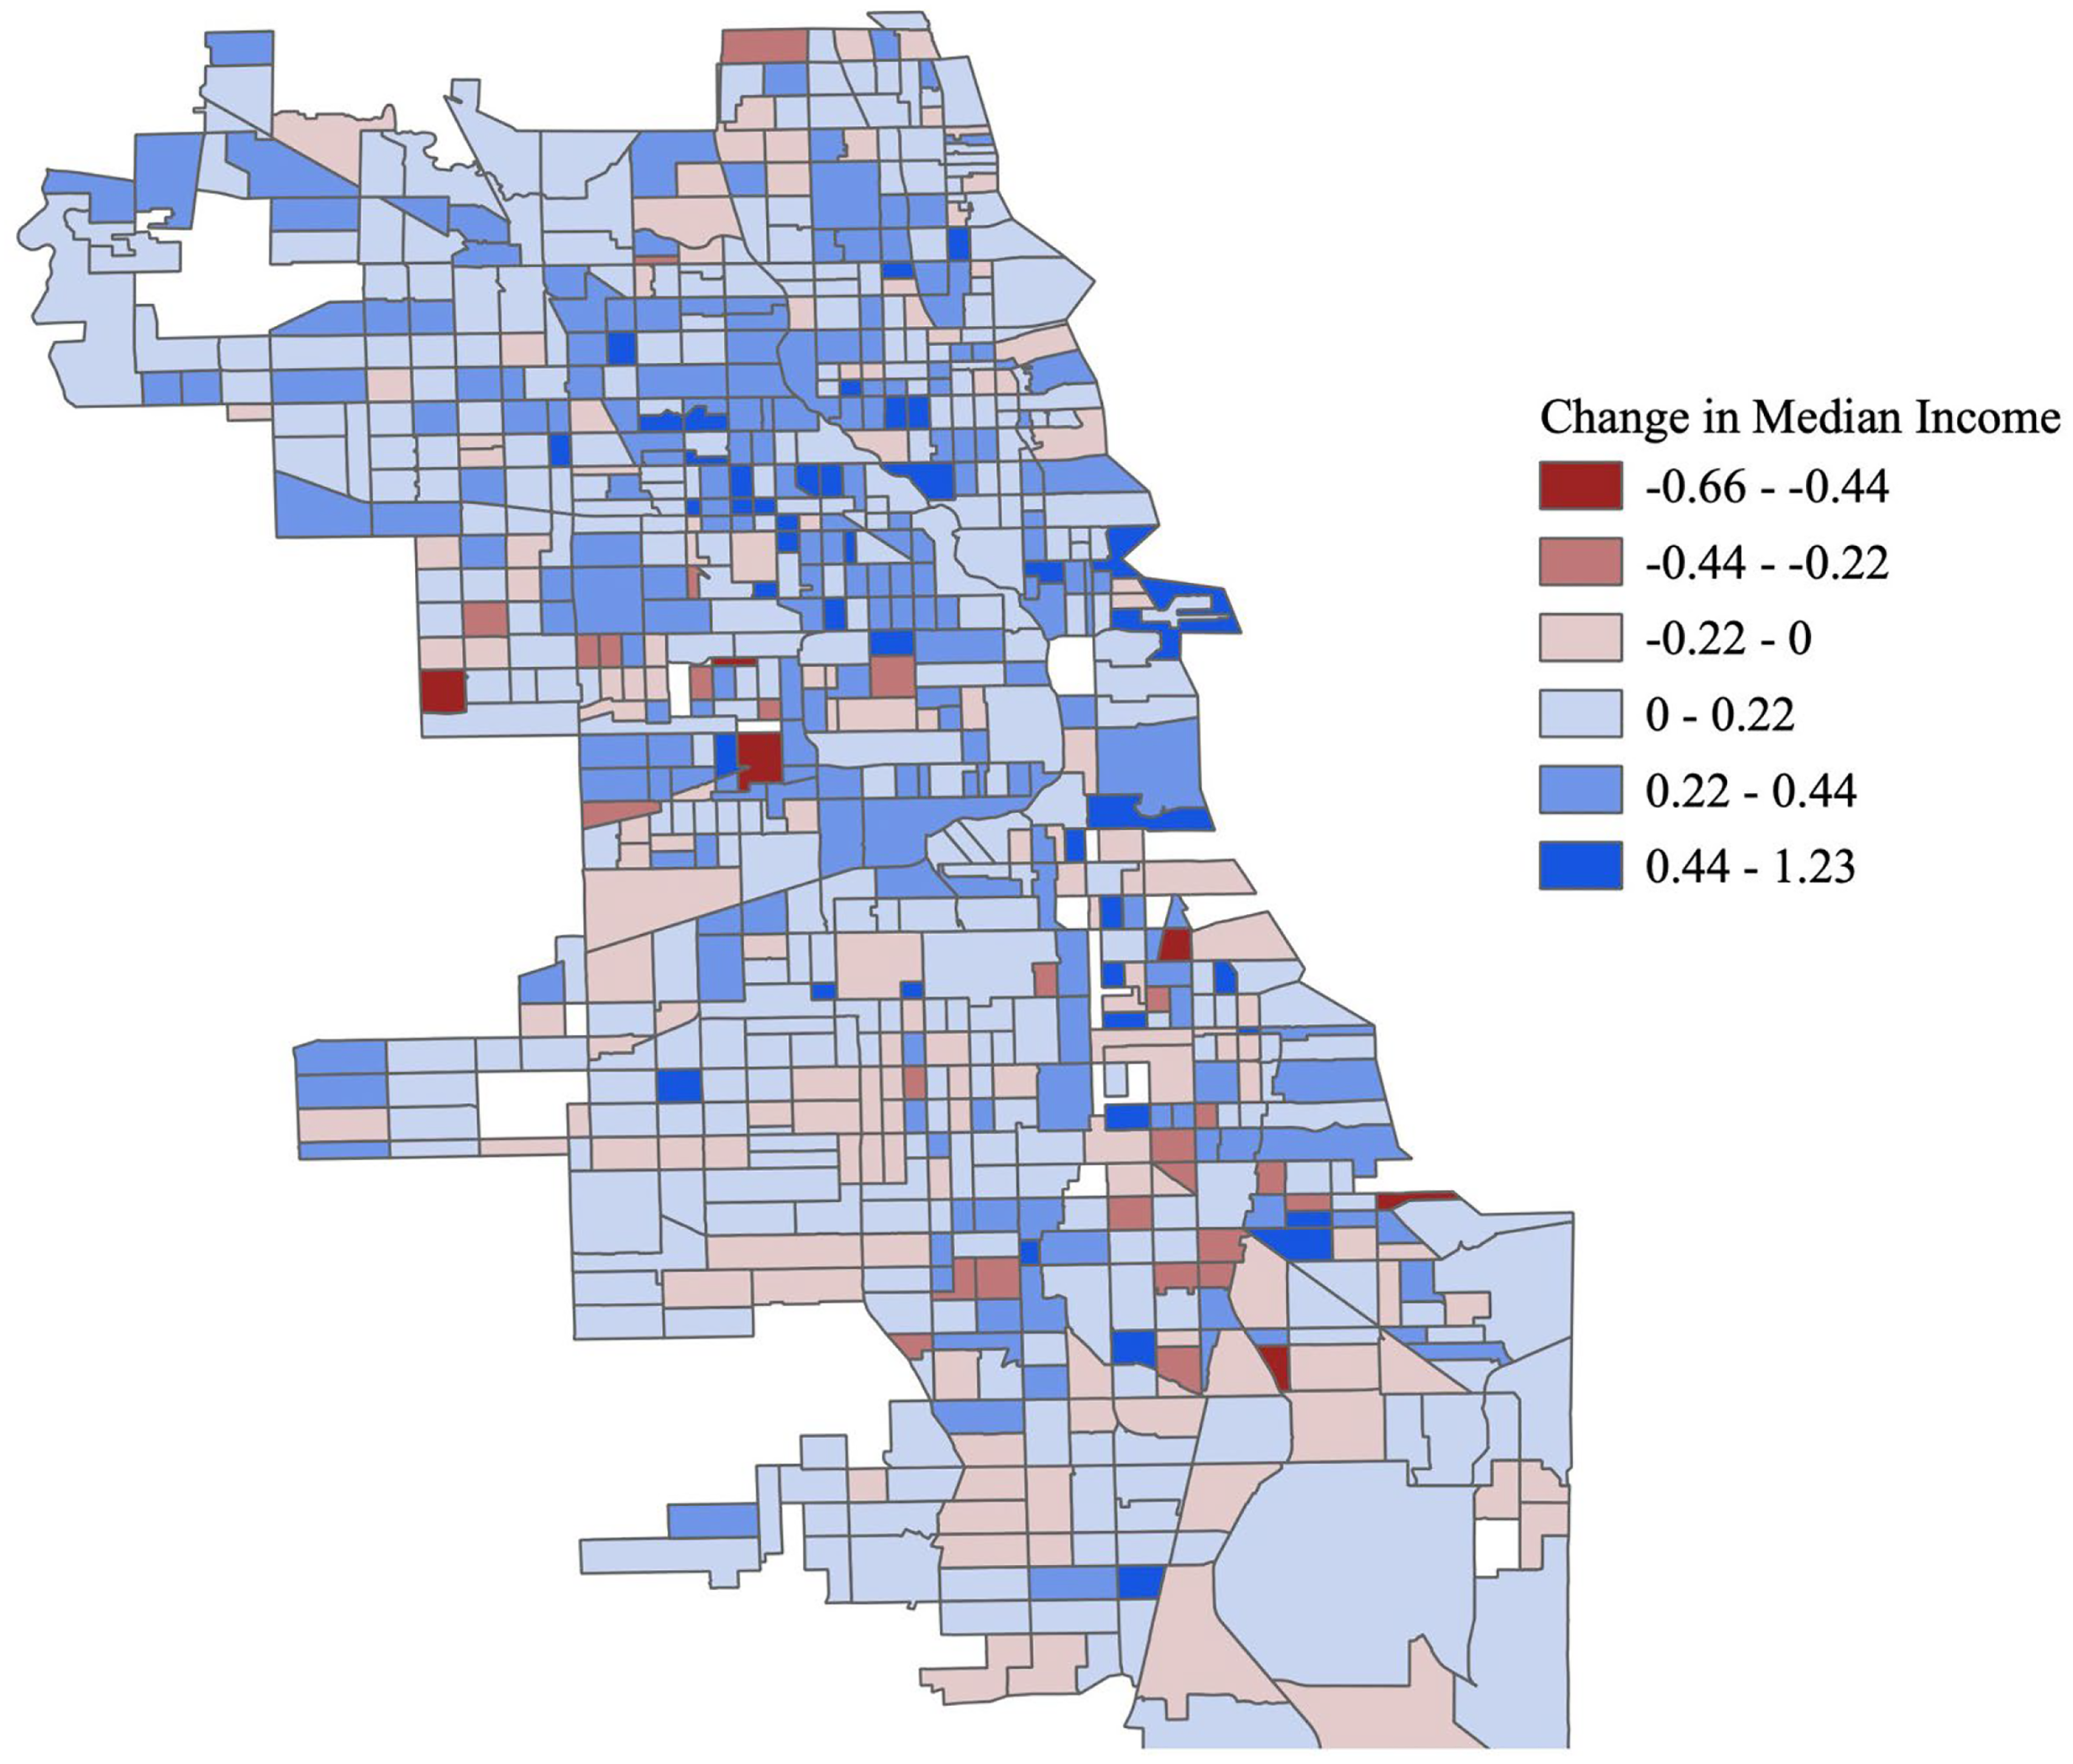
Change in median income (2019–2010).
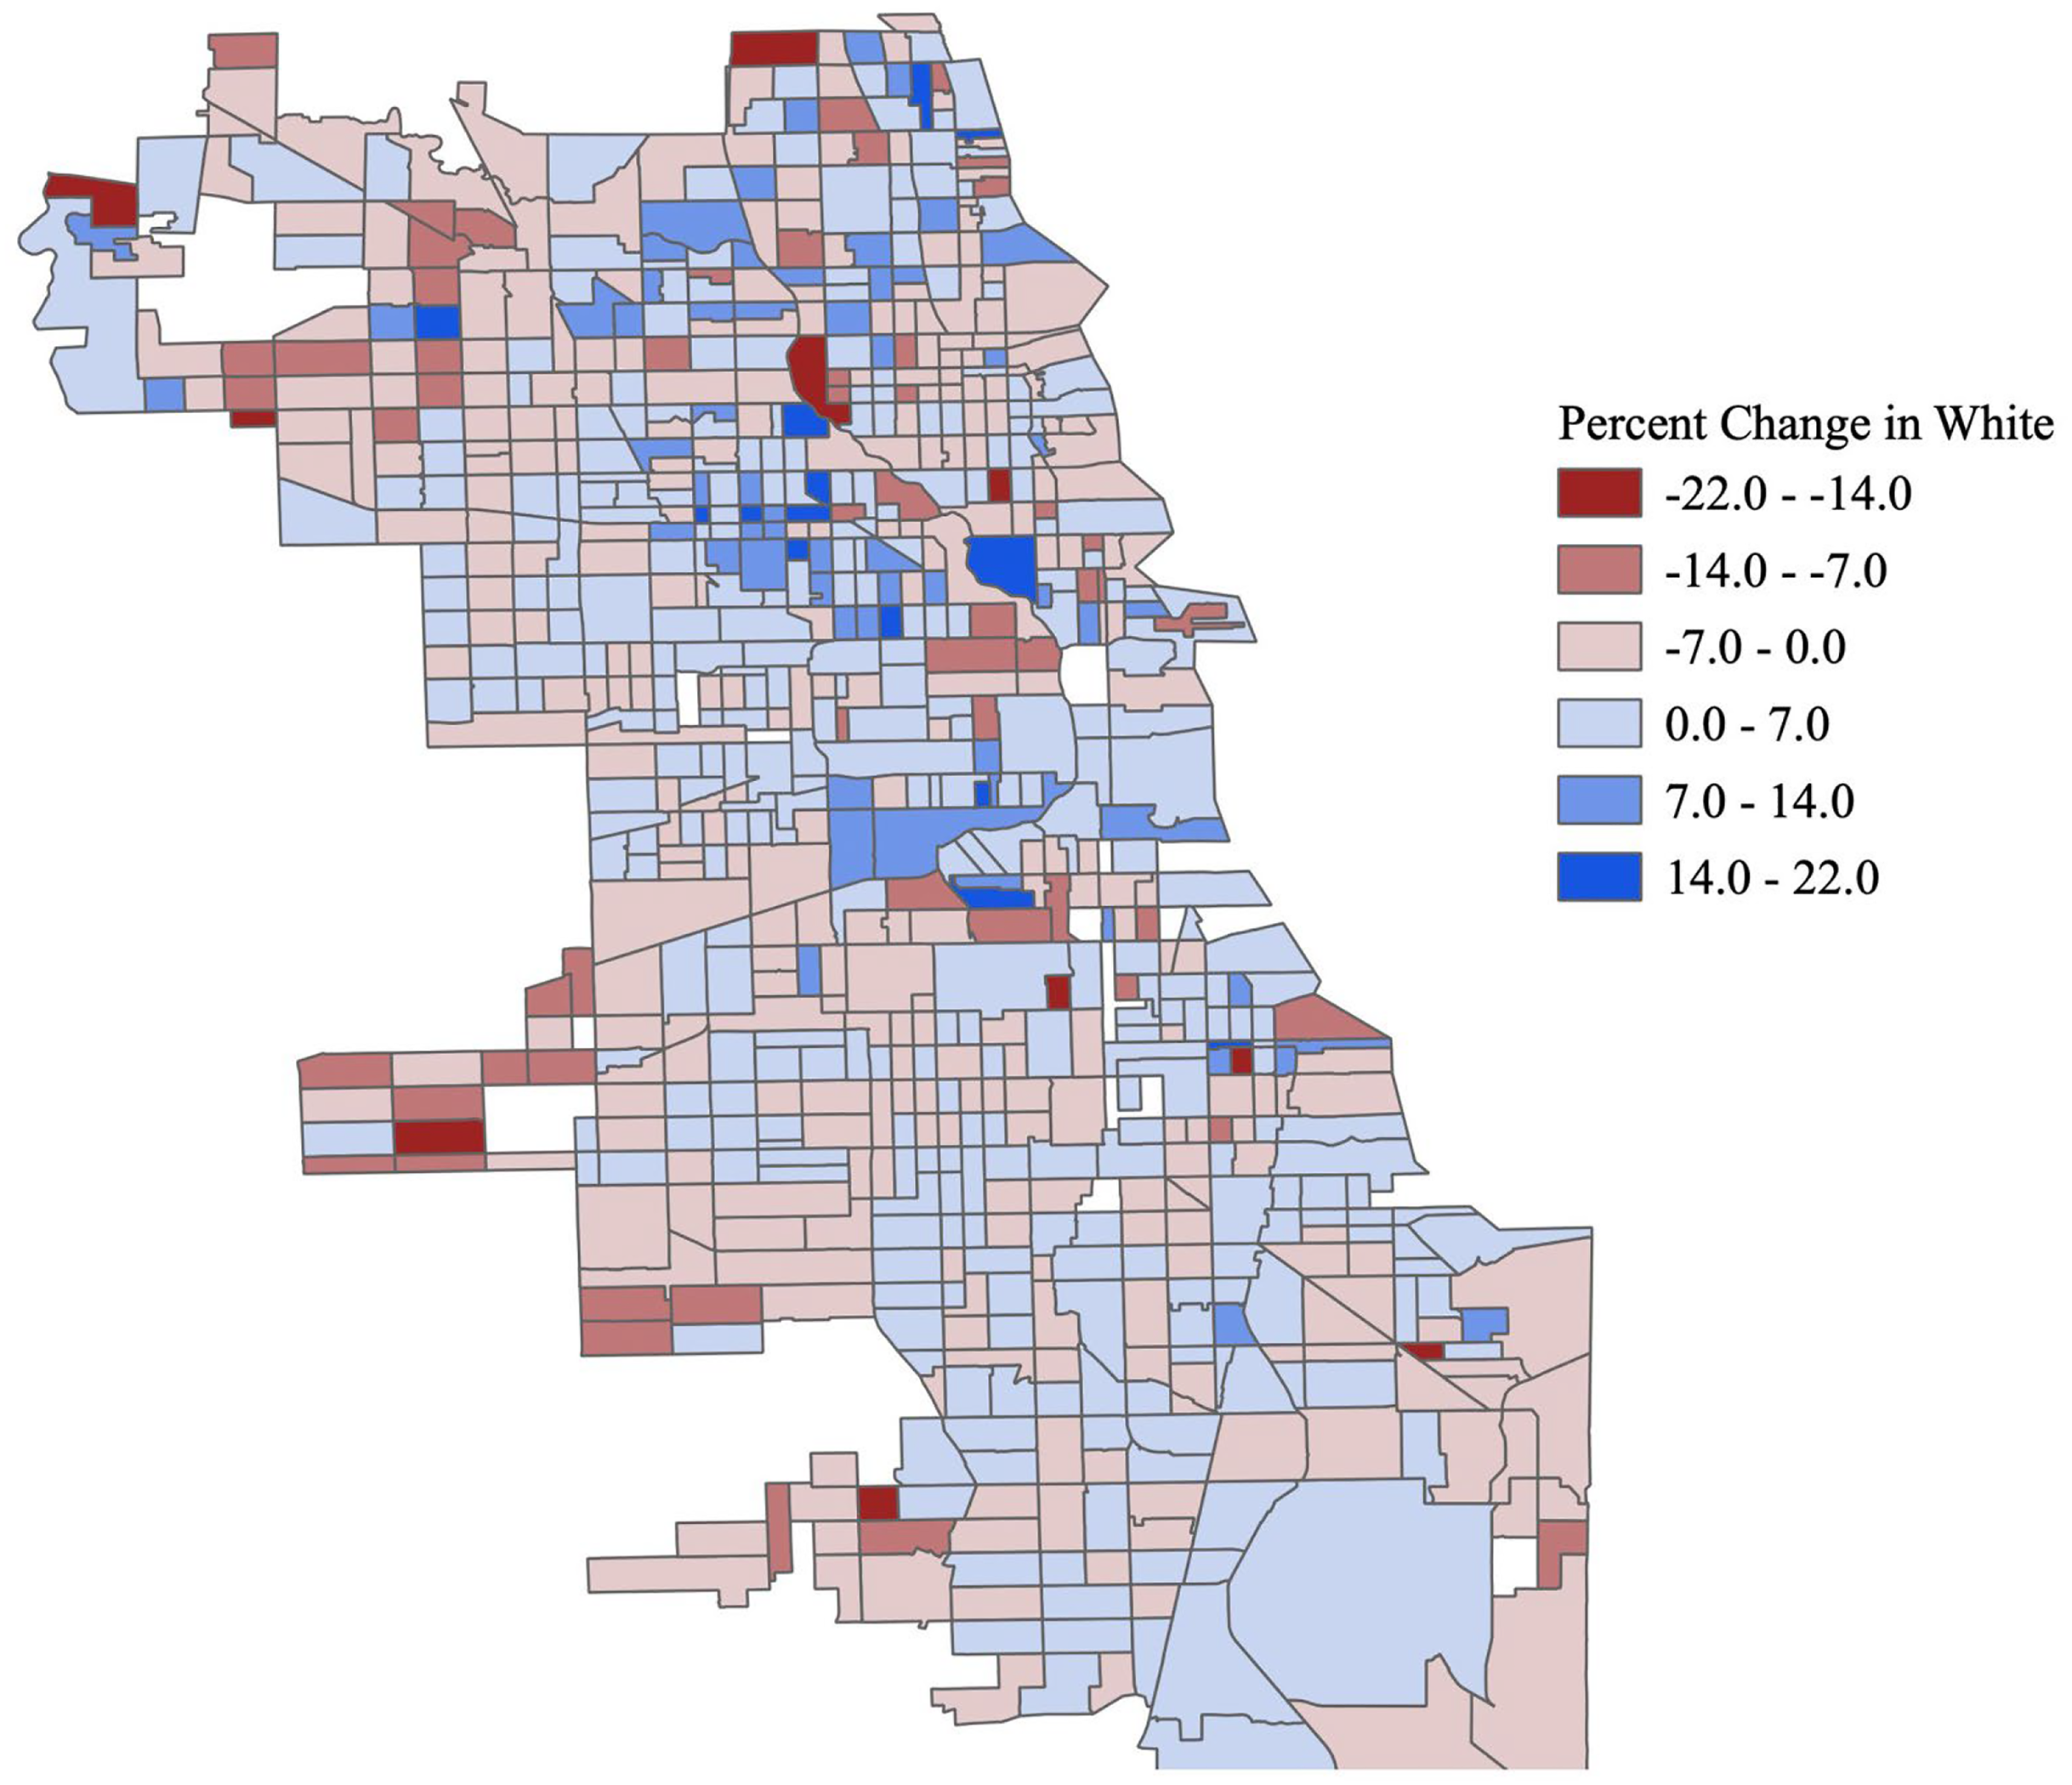
Percent change in White (2019–2010).
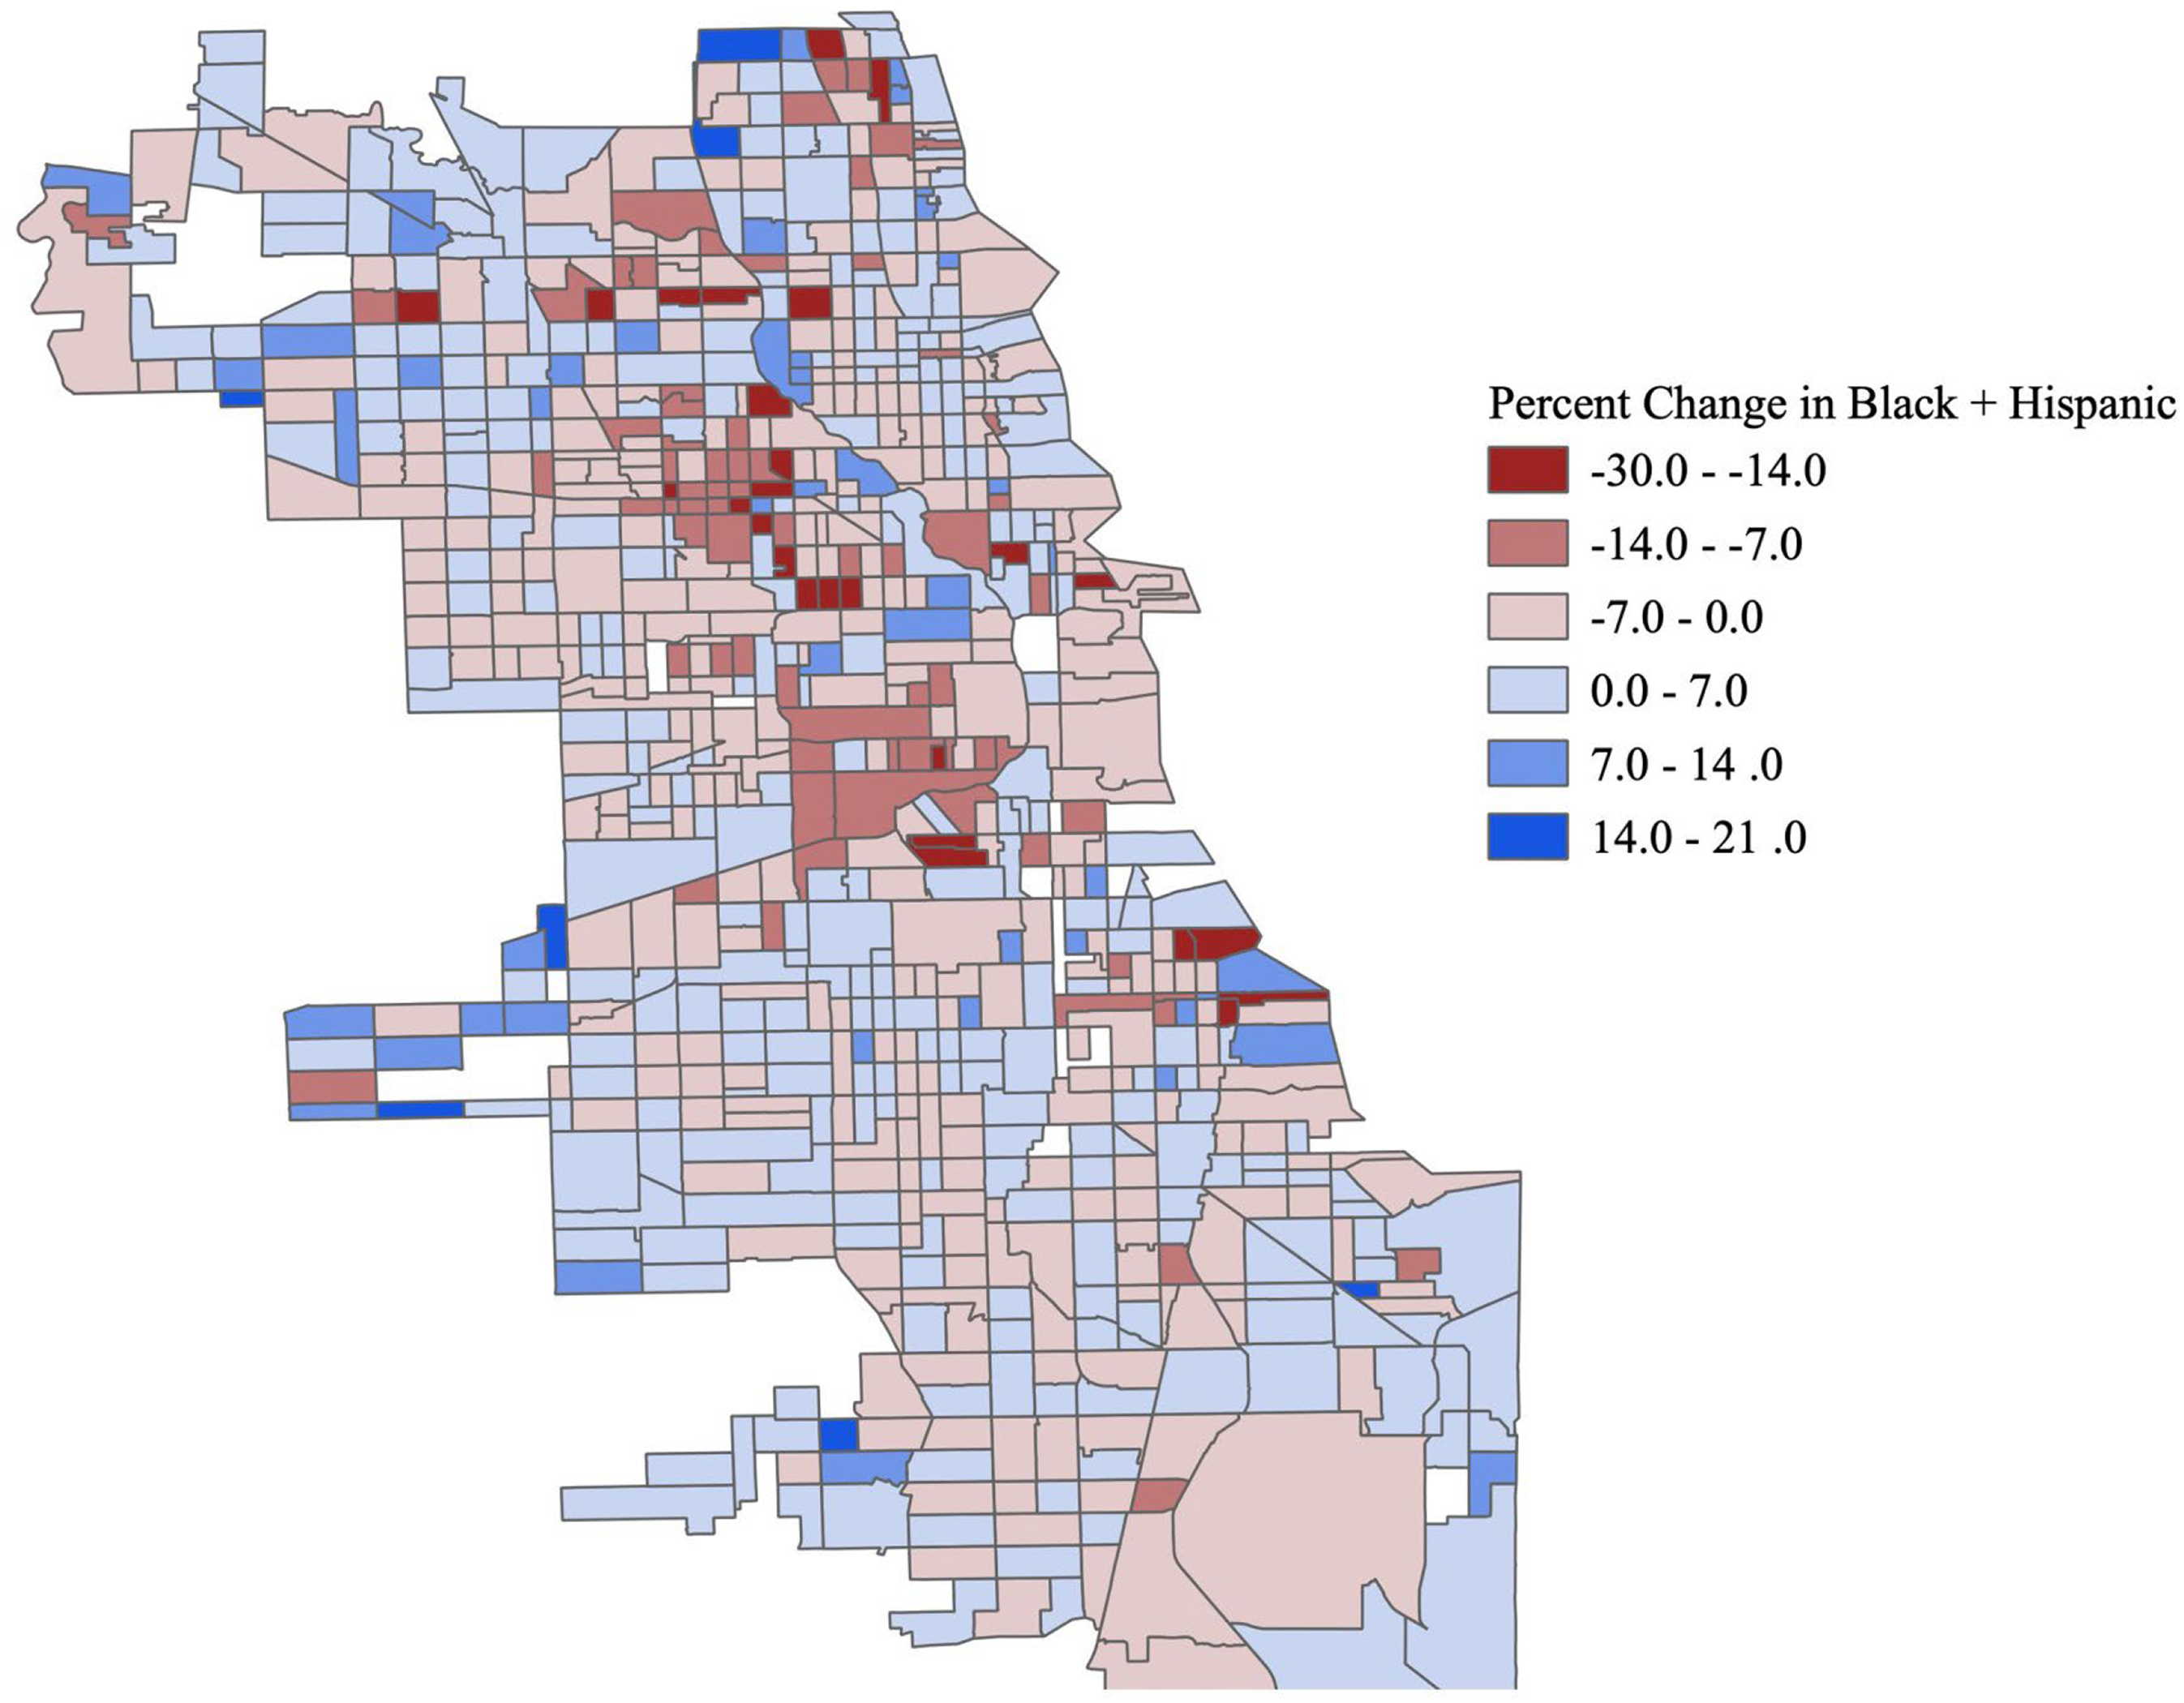
Percent change in Black + Hispanic (2019–2010).
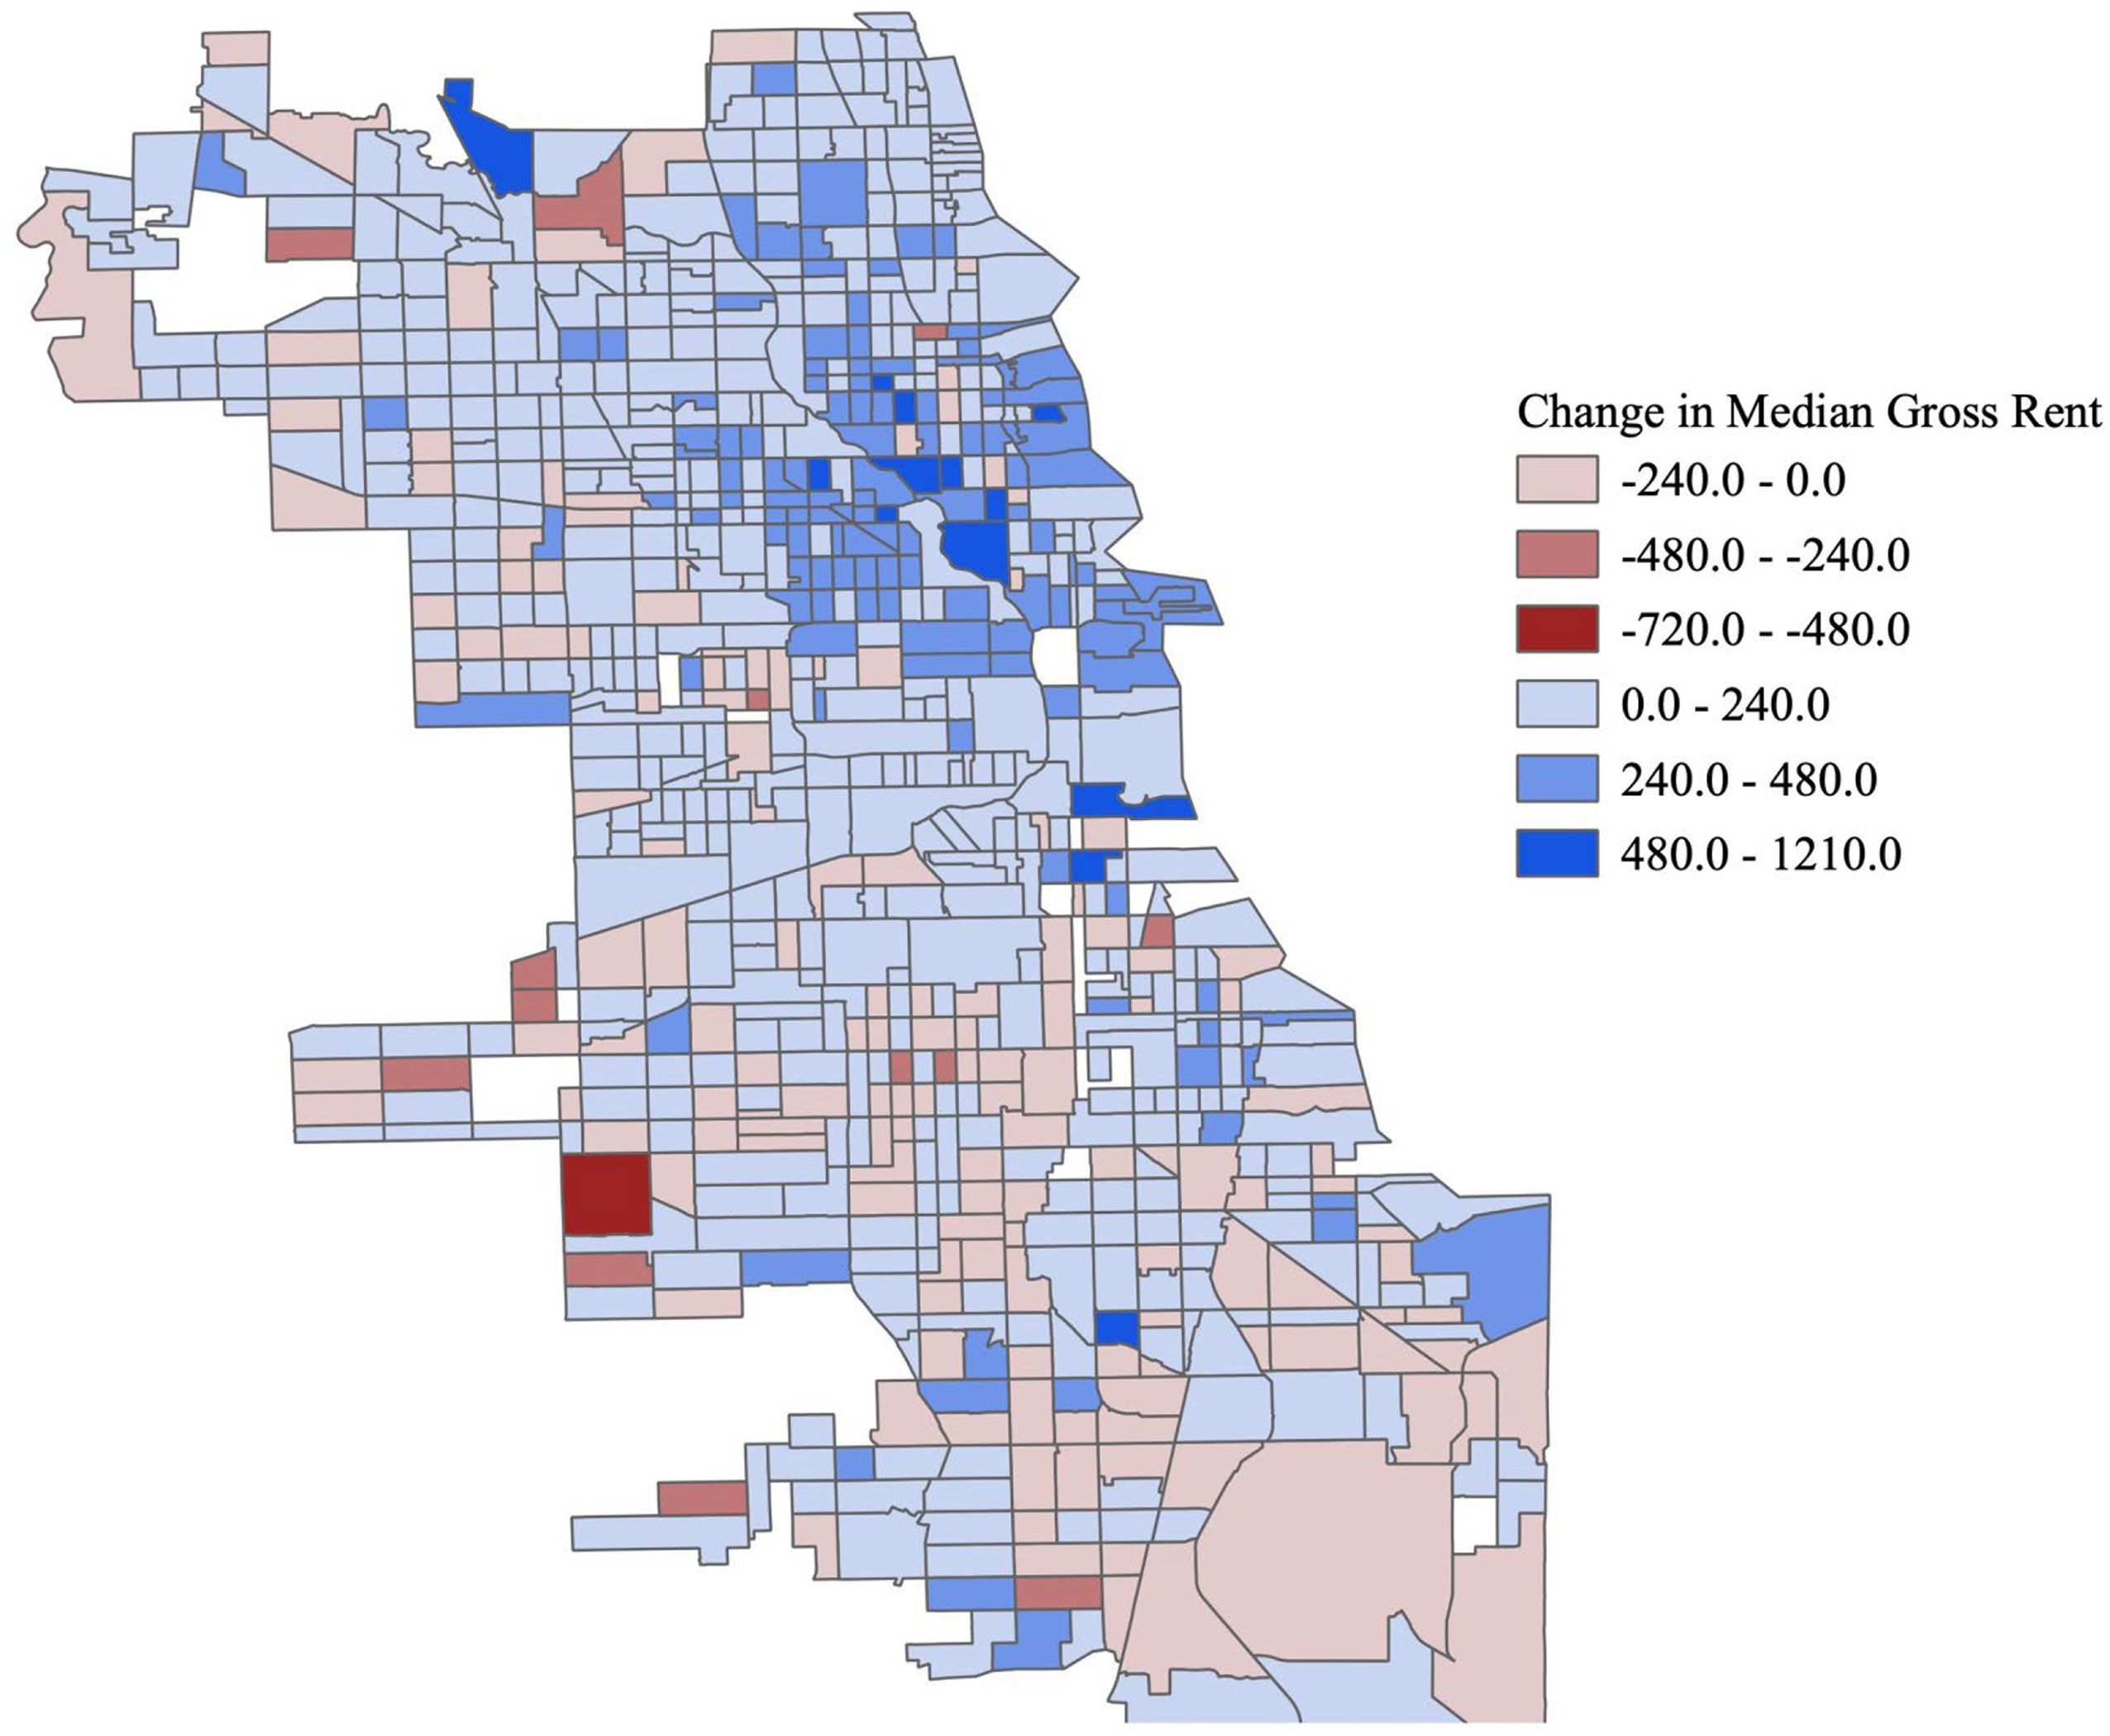
Change in median gross rent (2019–2010).
Finally, Figure 6 provides a citywide visualization for public transport coverage in Chicago. Areas that are shaded in color represent census tracts that have sufficient public transportation coverage, and areas that are shaded in gray represent census tracts that have insufficient public transportation coverage (for definitions of sufficient and insufficient, see the section above). The map demonstrates that areas in the urban core, aside from tracts near the shoreline, have adequate public transportation accessibility. However, there are quite a few census tracts in South Chicago and a few on the West Side that have insufficient access to public transit. In comparison with the other maps, Figure 6 suggests that some historic neighborhoods of color that have lower levels of ridesourcing may also be areas with insufficient access to public transportation. However, whiter areas of northwest Chicago along the lake that also lack sufficient public transportation access have more ridesourced trips.
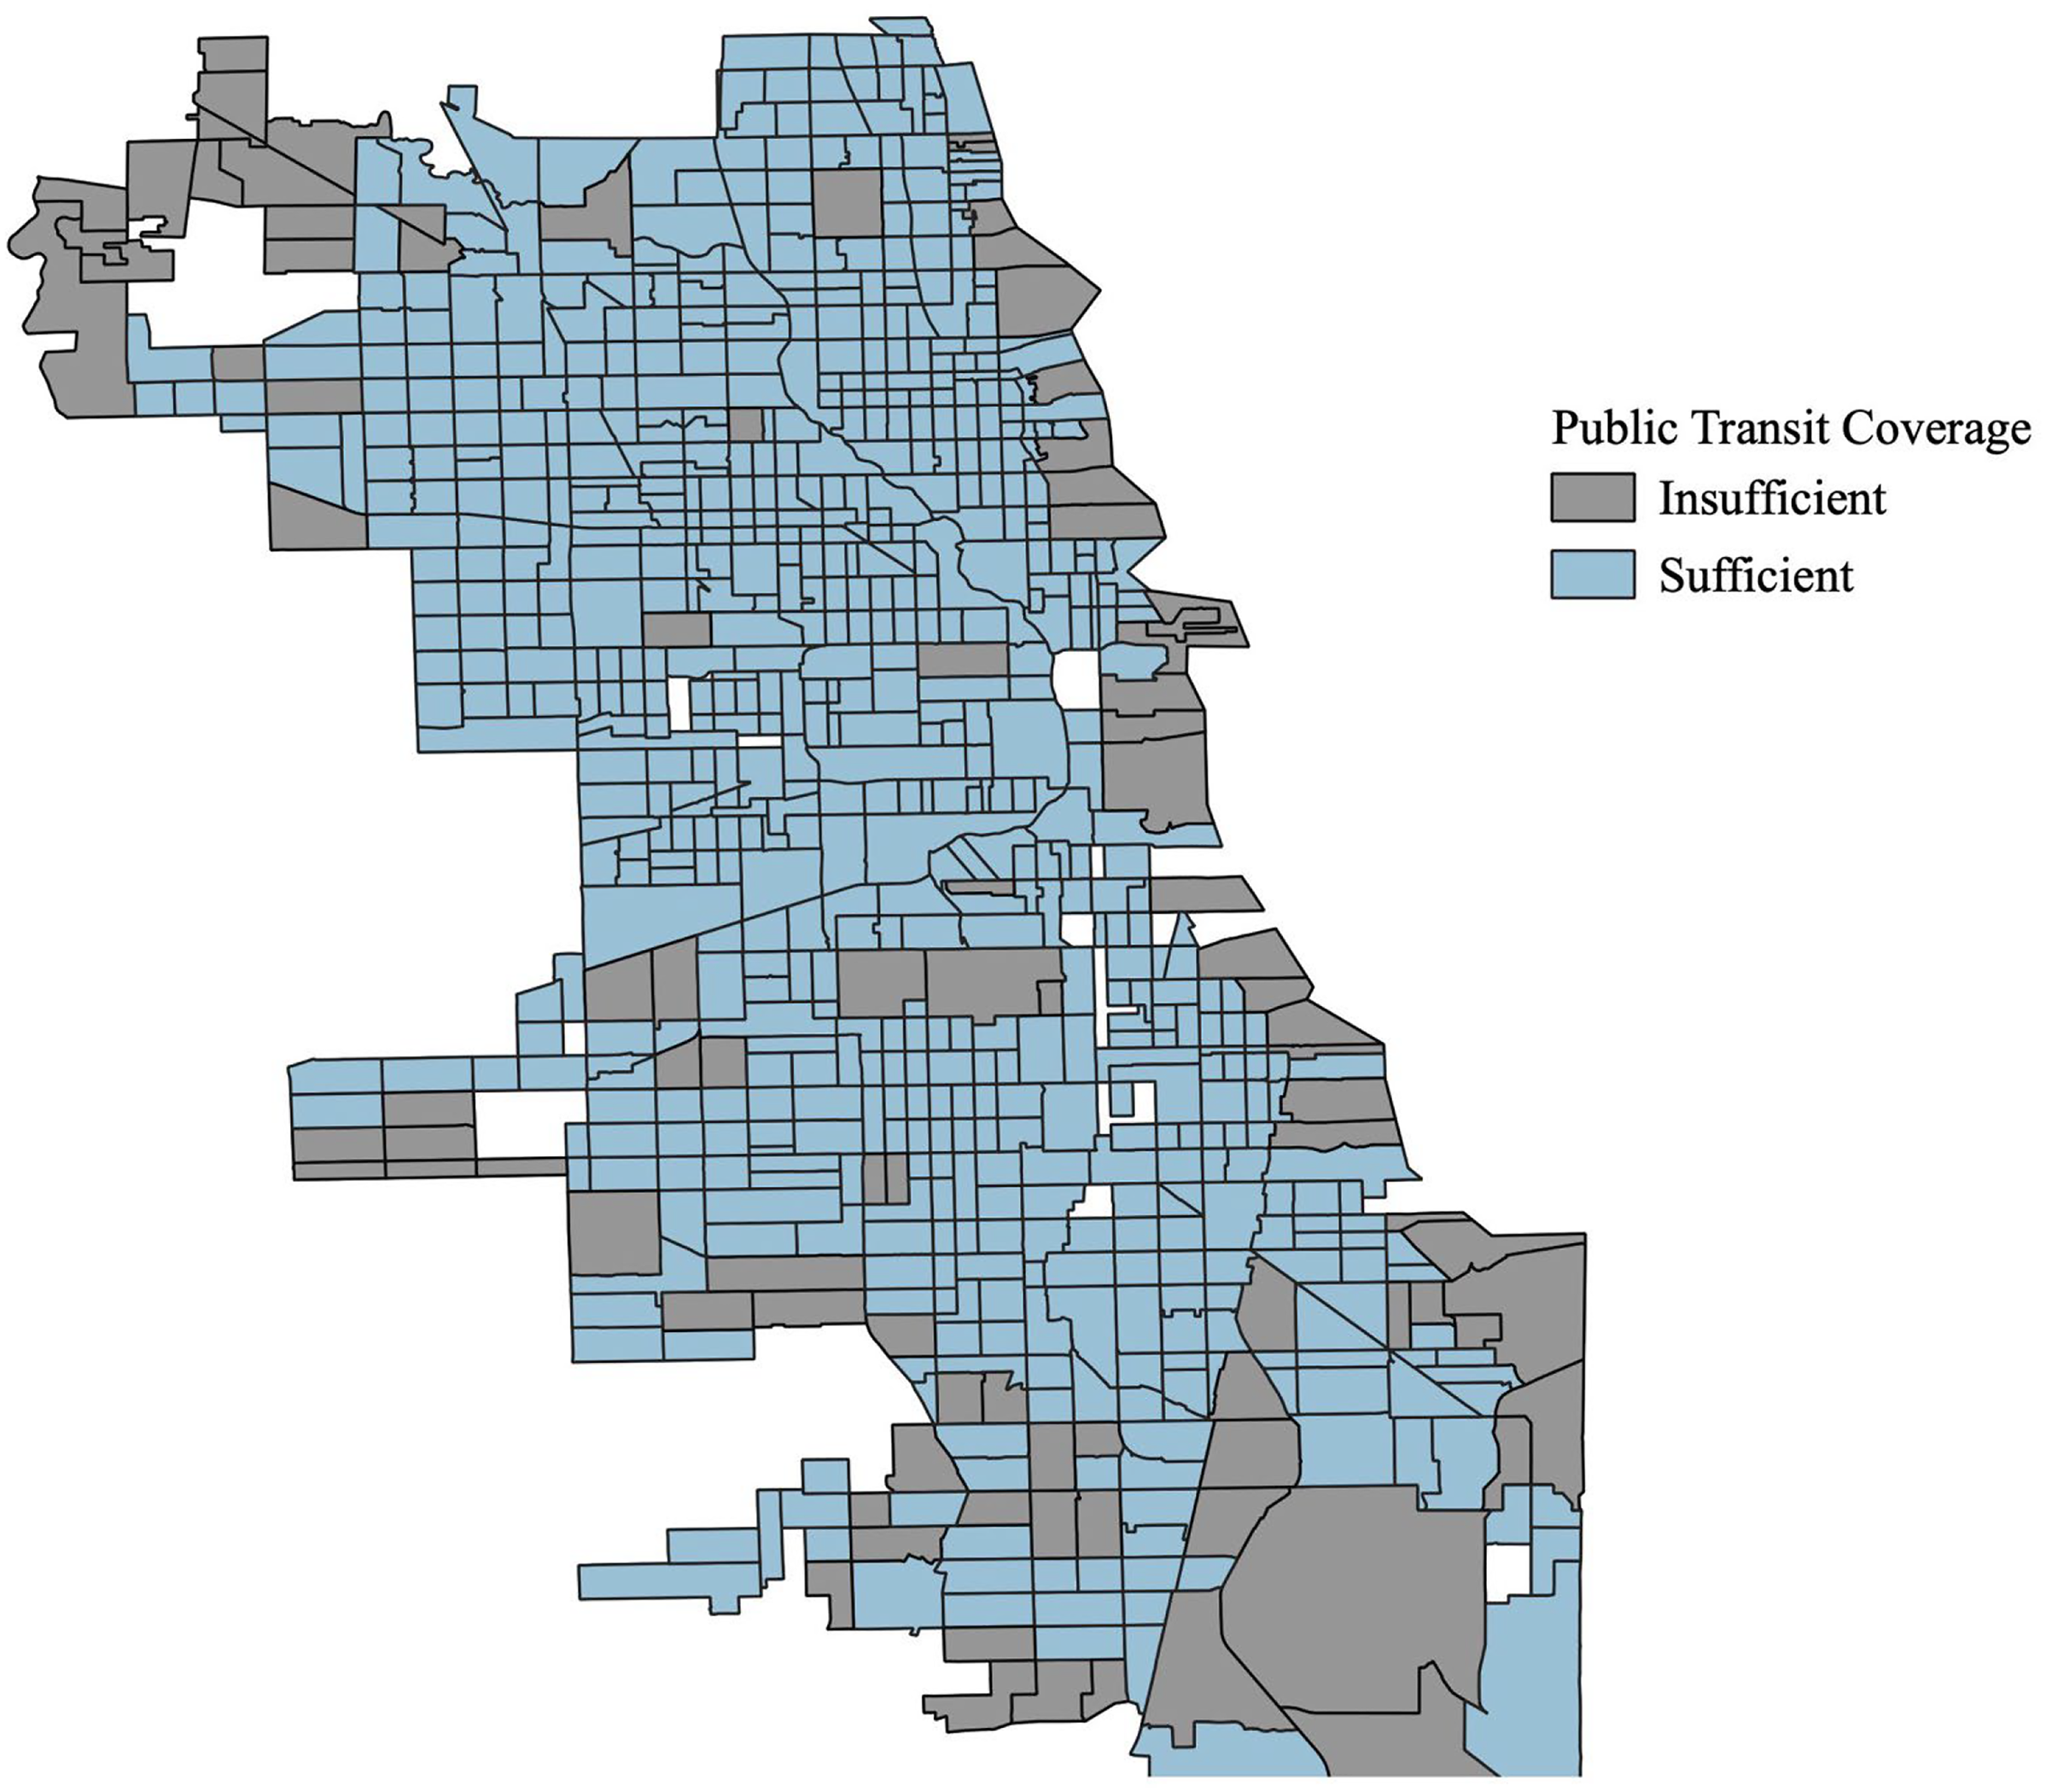
Public transit coverage in Chicago.
Descriptive statistics and correlation analysis
In this section, we turn to our descriptive statistics and correlation analysis to examine changes in racial demographics, housing characteristics, and patterns of transportation and how each of these categories relates to variations in levels of ridesourcing. We will focus on correlations between ridesourcing and our four major categories of independent variables.
Results from Table 2 reveal that both of our race and ethnicity measures show significant correlations with ridesourced trips, with the change in percent white being positively correlated (r = 0.16, p < 0.001) and change in percent Black and Hispanic being negatively correlated (r = −0.22, p < 0.001) to the outcome variable. Three of our socioeconomic variables are significantly correlated with ridesourced trips: change in median income (r = 0.17, p < 0.001), change in percent with a bachelor's degree (r = 0.09, p < 0.01), and change in percent with a master's degree or higher (r = 0.14, p < 0.001). Two variables representing public transportation characteristics are significantly correlated with ridesourcing: public transit coverage (r = 0.38, p < 0.001) and public transit usage (r = 0.08, p < 0.05). Both variables representing housing characteristics are significantly correlated with ridesourced trips. Ridesourcing is negatively correlated with change in the percentage of homes built before 1980 (r = −0.17, p < 0.05) and positively correlated with change in median gross rent (r = 0.32, p < 0.01). Yet, despite their significant p-values, it is important to note that the correlations for change in percent with a bachelor's degree, change in public transit usage, and change in housing age are low.
Means/percentages, standard deviations and correlations for all study variables.
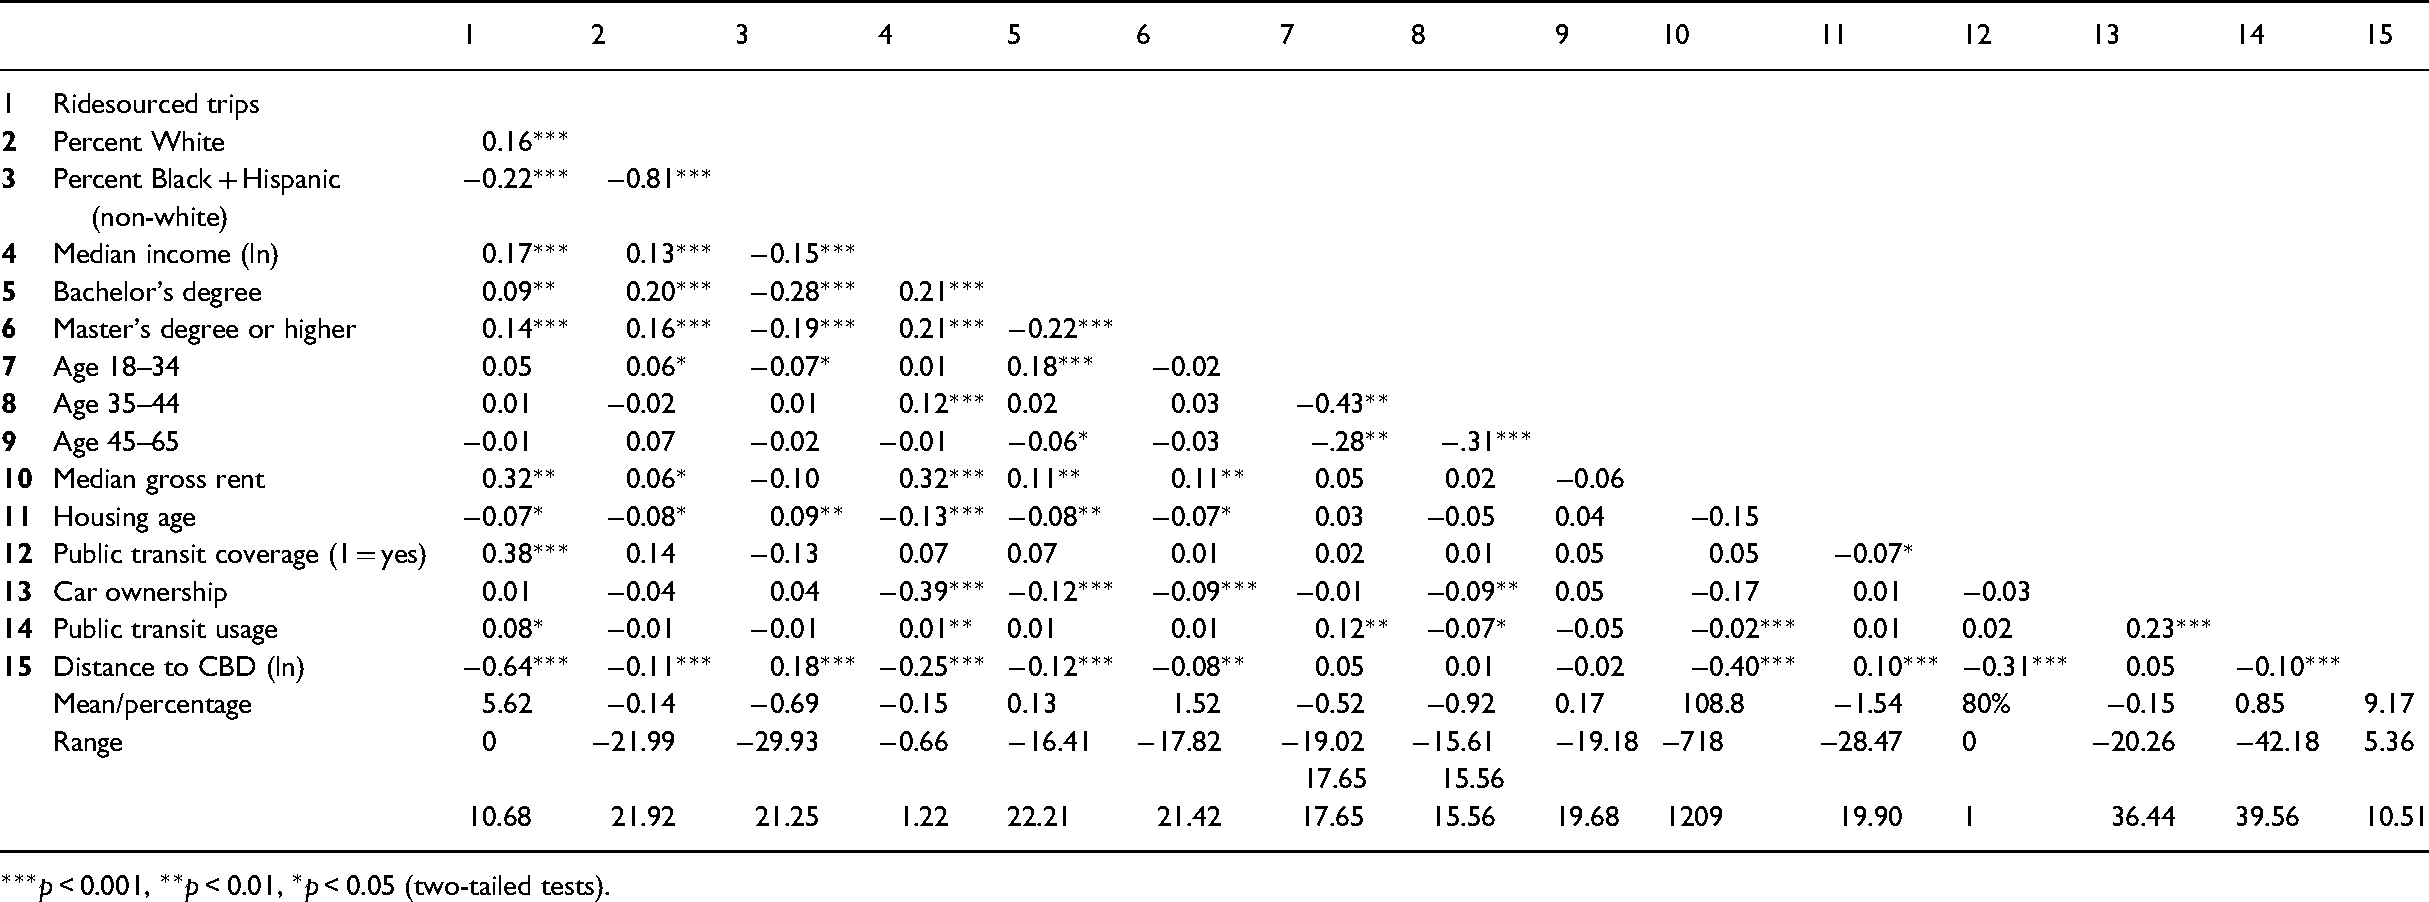
***p < 0.001, **p < 0.01, *p < 0.05 (two-tailed tests).
Regression analysis
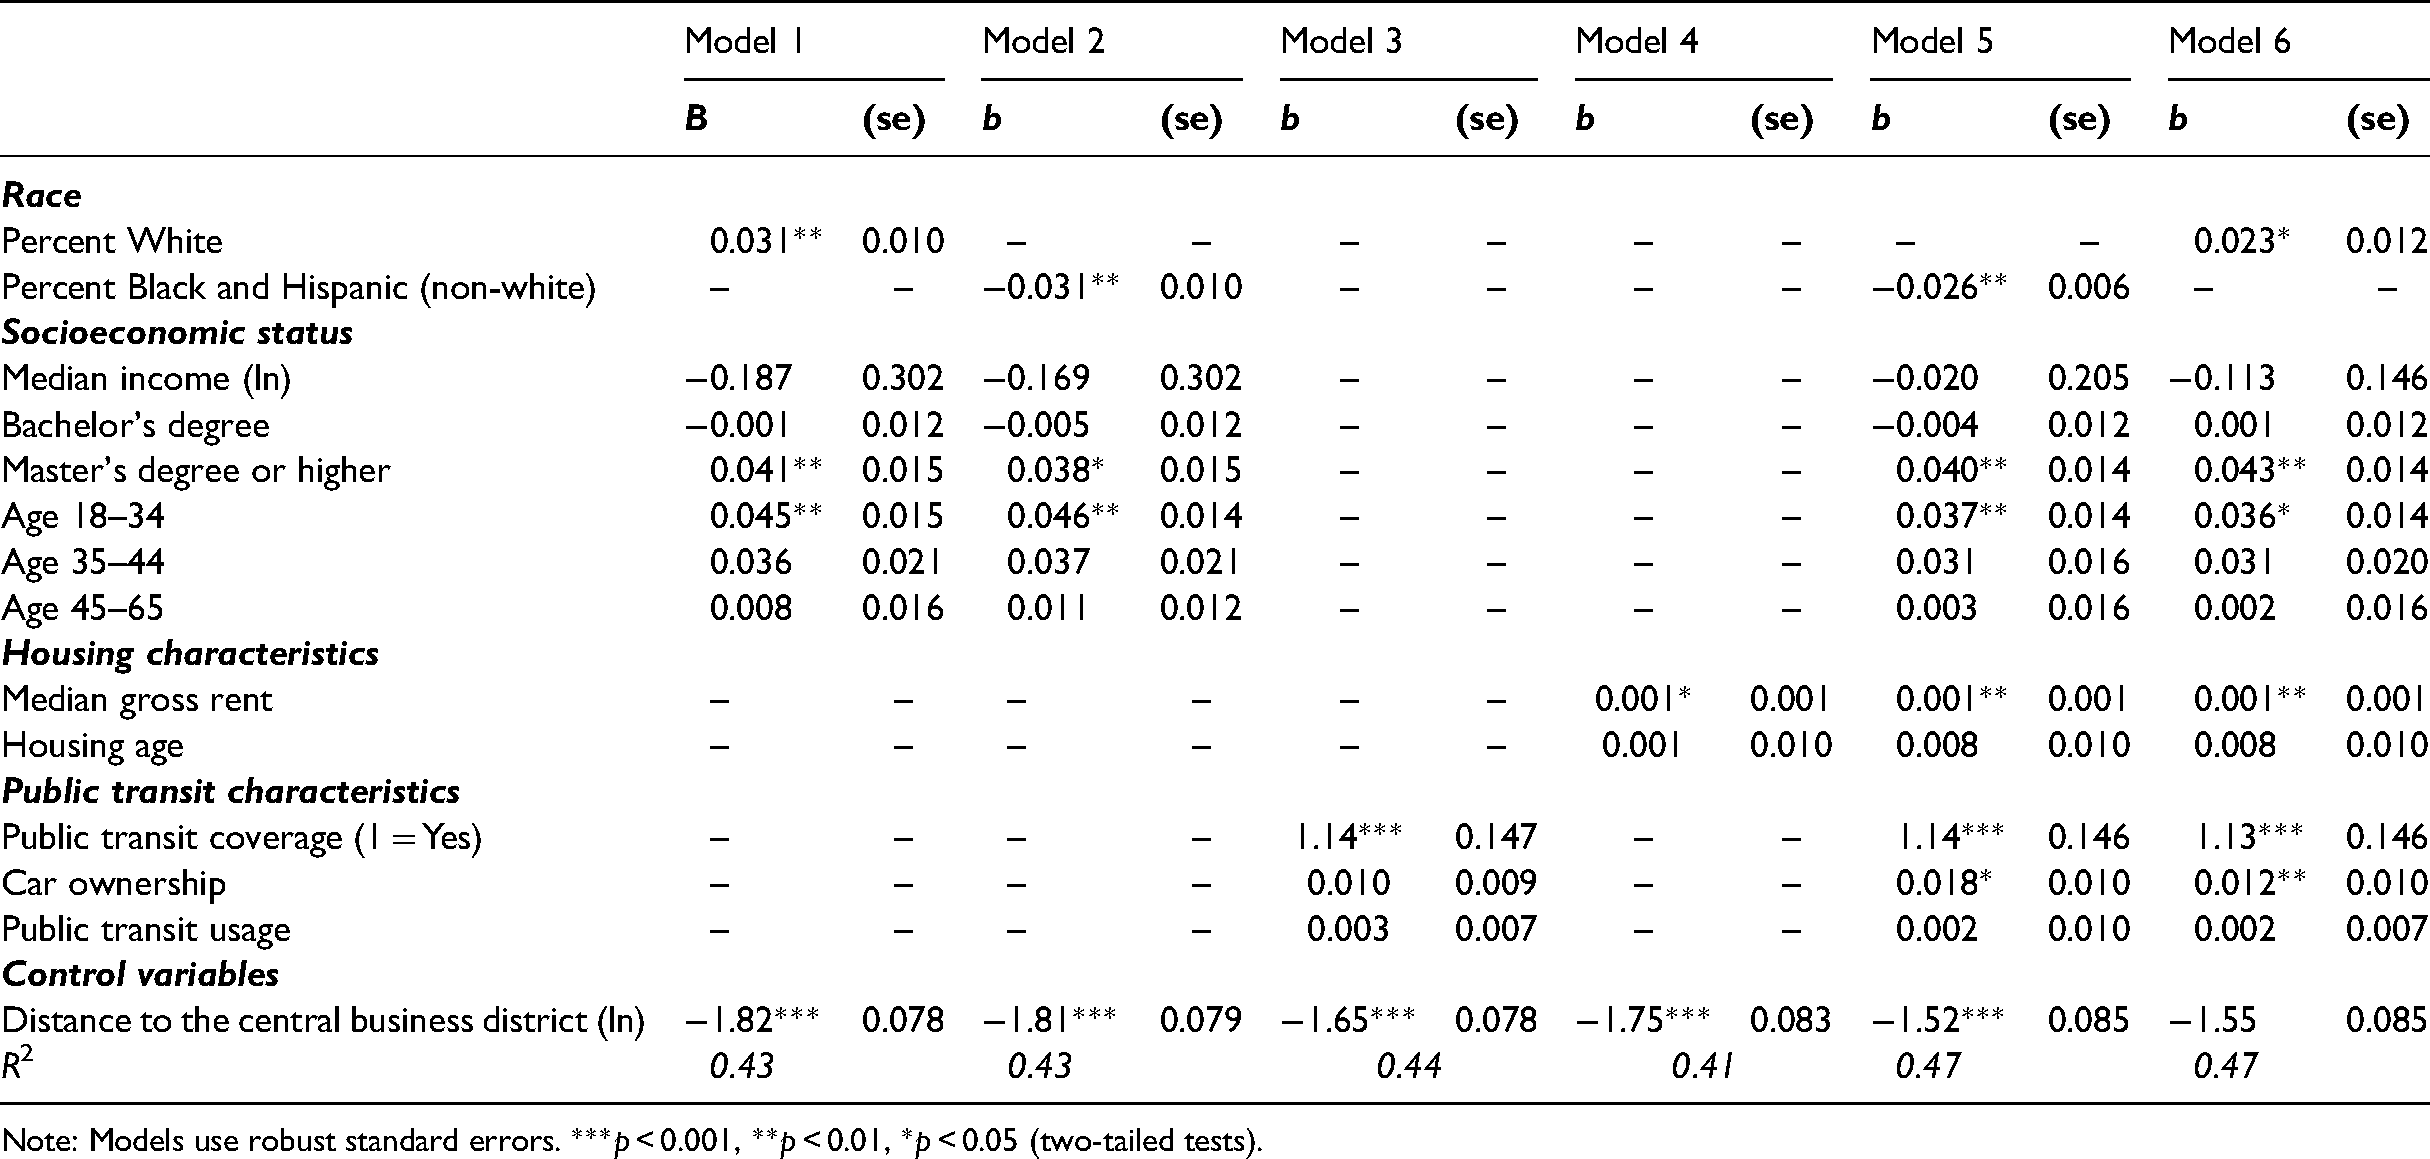
Table 3 shows the results of our regression analysis predicting ridesourced trips by our various independent variables. Models 1 and 2 each include one race/ethnicity variable and the measures of socioeconomic status. We do not include percent Black and Hispanic and percent white in the same models to avoid issues with multicollinearity (Table 2 shows a high and significant correlation). Model 3 only includes variables representing housing characteristics, and Model 4 only includes our variables representing public transit characteristics. Finally, Models 5 and 6 represent our full model with all independent variables of interest.
Change models predicting ridesourced trips (ln) (change 2019–2010).
Note: Models use robust standard errors. ***p < 0.001, **p < 0.01, *p < 0.05 (two-tailed tests).
The results from the regression model reveal similar relationships to those shown in the correlation matrix in Table 2. Results from Model 5 indicate significant relationships with ridesourced trips and change in percent Black and Hispanic (−0.026, p < 0.01), change in percent with a master's degree or higher (0.040, p < 0.01), change in percent between the ages of 18 and 34 (0.0237, p < 0.01), change in median gross rent (0.001, p < 0.01), change in percent of households without an automobile (0.018, p < 0.05), and public transit coverage (1.14, p < 0.001). For ease of interpretation because the dependent variable is log-transformed, we exponentiated the coefficients presented here, subtracted one from the number, and multiplied by 100. Thus, for a one-unit increase in ridesourced trips, change in percent Black and Hispanic decreases by about 2.56%. A one-unit increase in ridesourced trips corresponds to a 4.08% increase in change in percent with a master's degree or higher, a 3.77% increase in change in percent between the ages of 18 and 34, a 0.11% increase in change in median gross rent, and a 1.82% increase in change in percent of households without an automobile. Finally, higher ridesourced trips are associated with sufficient public transportation coverage. Model 6, which swaps our percent Black and Hispanic but includes the other predictors, depicts similar relationships as well as a significant and positive coefficient for change in percent white (0.023, p < 0.05). Thus, a one-unit increase in ridesourced trips is associated with a 2.32% increase in change in percent white.
Discussion
This study uses three analyses to examine the link between ridesourcing and urban inequality. Taken together, the results show two types of relationships: (1) the relationship between ridesourcing and other modes of transportation; and (2) the relationship between ridesourcing and various measures of gentrification, including demographic change, neighborhood upgrading, and displacement. With regards to the first type, the models show a positive and significant relationship with public transportation coverage and ridesourced trips. Put another way, it appears that areas with sufficient public transportation coverage (during peak working hours) also tend to have higher levels of ridesourcing in comparison to areas with insufficient public transportation coverage. With regards to the second type, we find significant relationships between various measures of gentrification and ridesourcing. Our models show that more ridesourced trips are associated with an increase in people with higher education levels who are between the ages of 18 and 34, which speaks to the potential demographic changes that occur with gentrification. Although some measures of gentrification include neighborhood upgrading, we only found an association in the correlation analysis but not in the multivariate analysis. However, we did demonstrate associations between increases in median gross rent and ridesourcing.
We acknowledge that we only use a point-in-time approach with the construction of our dependent variable, ridesourced trips, even though our independent variables represent change in demographic, housing, and transportation usage characteristics. Although there are current barriers with accessing historic ridesourcing data, future research could use a change-change approach to examine how the change in ridesourcing usage relates to the patterns of demographic change presented in this study (Gehrke, 2020). As cities begin to regulate TNCs and ridesourcing, studies could examine how these policy interventions are impacting patterns of demographic change. Furthermore, it is important to note that ridesourcing data can be collected in (or near) real-time. Thus, future research could also track the relationships between public transportation ridership and ridesourcing usage in real time. Although this is nearly impossible to do with demographic data, the growing availability of transit usage data nonetheless leads to more possibilities in unpacking these complex spatial relationships.
Conclusion
This study contributes to the existing literature on ridesourcing by taking a historical change perspective that can help to understand how ridesourcing fits within the processes of uneven development, gentrification, and displacement. Our research is consistent with previous studies of the demographic profile of ridesharing users (Clewlow and Mishra, 2017; Rayle et al., 2016). Although it does not contribute directly to research on the extent to which ridesourcing will complement or compete with public transit, it does establish a different direction in the ridesourcing literature by bringing the nascent field of social science research on ridesourcing into conversation with the field of research on uneven urban development, gentrification, and displacement. We believe that our approach provides further evidence for understanding gentrification as a complex, multi-faceted, and relational process. Furthermore, the relationships explored in our analyses help us to better understand gentrification as an unbounded process, by showing how TNCs impact the connection and disconnection of people from various urban spaces.
In the absence of regulation, the future will likely include more widely disseminated use of ridesourcing, potential conflicts with public transit ridership, and reduced costs as the ridesourcing companies adopt automated technology to replace human drivers (Stead and Vaddadi, 2019). The historical change orientation can also provide one glimpse of the implications of what is likely to be one of the first widespread uses of automated (“driverless”) vehicles. There have only been a few successful policies passed that seek to regulate TNC activity. In addition to the examples of Austin and NYC discussed above, in 2020, the city of Chicago announced that it would be implementing a new pricing structure that increases charges for downtown trips and lowers rates for shared rides to other areas in the city (Henderson, 2020). Although this move was designed to improve traffic conditions and lower carbon emissions in the city, it can lead to a more equitable transportation system by increasing public transit ridership.
Furthermore, awareness of unequal access to ridesourcing based on geographical usage patterns and affordability could lead to corrective measures. With respect to the connections with public transit, one policy change is a discount for first-mile and last-mile trips that are covered by fees for commuter trips that duplicate or compete with public transit routes. New regulatory policies could also include subsidies or discounts for low-income riders and incentives for ridesourcing pickups and drop-offs in underserved neighborhoods. It would also be possible to build incentives into driver payments if they provide service in underserved neighborhoods or to require them to accept pickups in a specified percentage of underserved neighborhoods. Changes in the fee structure could be paid by transfers such as fees on services used in destinations in gentrifying or privileged neighborhoods. As the vehicles become automated, the incentives could be dropped and replaced with software design that systematically avoids discriminatory patterns or even favors service to underserved neighborhoods when there is a choice. However, we acknowledge that in the current phase of ridesourcing with human drivers with low labor protections, some of these policy regulations could put additional financial or security burdens on a contingent labor force that already has few protections instead of targeting the TNCs themselves.
We do not pretend that these policy and system design innovations will solve the problem of increasing urban inequity that is evident in the patterns of increasing rent, gentrification, and the displacement of people of color and low-income residents to areas with fewer transportation options. These problems are multifaceted, deeply intertwined with other processes of inequity and uneven development in urban areas, and ultimately require multiple solutions. However, we do argue that it is time to put on the table of urban policy agendas the problem of how ridesourcing may be playing a facilitating role in creating these ongoing patterns of urban inequality.
Highlights
Ridesourcing data from Chicago confirms previous research on mobility disparities.
The disparities include access and use by race, income, education, and neighborhood.
A focus on change variables makes it possible to expand the research to include changes in urban inequality.
Change variables indicate that ridesourcing is associated with the patterns of urban gentrification.
Policy implications to reduce the effects of ridesourcing on urban inequality are discussed.
Footnotes
Declaration of conflicting interests
The author(s) declared no potential conflicts of interest with respect to the research, authorship, and/or publication of this article.
Funding
This project was partially supported by the US National Science Foundation, OISE-1743772, Partnerships for International Science and Engineering (PIRE) Program: “Science of Design for Societal-Scale Cyber-Physical Systems.” Any opinions, findings, conclusions, or recommendations expressed here do not necessarily reflect the views of the National Science Foundation.
Notes
Biographical Notes
![]() ).
).