
Abstract
Redlining refers to the officially sanctioned practice of denying mortgage loans in some areas in order to racially discriminate against Black people and other people of colour. Recent studies have shown the persistent impacts of redlining on health risks in effected neighbourhoods. This study contributes to that growing body of work by analysing the relationship between the category that neighbourhoods were assigned on redlining maps and the percentage of the population with 3+ risk factors as defined by the Census Bureau's Community Resilience Estimates. The areas given the lowest redlining grade of D are significantly different than those given the grades of A or B and the areas not graded at the time. This result supports the argument that historical governance and planning decisions do not stay in the past and planners must work to rectify equity issues lest we be complicit in this pattern of racial discrimination.
Keywords
During the coronavirus disease 2019 pandemic, Columbus City Council declared racism as a public health crisis in recognition of the numerous health disparities between Black and white residents and the history of discriminatory practices such as redlining (Resolution, 2020). Redlining refers to the US Government's official sanction of racial segregation in housing throughout the mid-20th century with the Home Owners’ Loan Corporation (HOLC), which excluded Black people from fair mortgage rates (Rothstein, 2017: 63–64). The impacts of redlining persist nationwide, with previously redlined neighbourhoods showing worse health conditions for residents, including birth outcomes (Nardone et al., 2020b), asthma rates (Nardone et al., 2020a) and heat exposure (Hoffman et al., 2020; Wilson, 2020). This paper examines the relationship between redlining and general community resilience as quantified by the US Census Bureau's 11-factor Community Resilience Estimates (CRE) (2020) in Franklin County, Ohio.
This analysis used the Census Bureau CRE data (Community Resilience Estimates, 2020) joined to the TIGER/Line Shapefiles for Census Tracts (2018) and the HOLC maps digitised at the University of Richmond (HOLC, 2020). These two datasets were combined in ArcGIS Pro using a union overlay. The resulting features were symbologised along two axes: colours to represent HOLC grade and colour intensity to represent percentage of the population with 3+ risk factors. Figure 1 shows that HOLC D-grade areas are more likely to have higher percentages of at-risk populations than HOLC A-grade areas, since far more areas are dark red than dark green. This difference was confirmed with a t-test of means: D-grade areas have a significantly higher percentage of the population with 3+ risk factors than A-grade areas (p = 0.005) and B-grade areas (p = 0.034) as well. Additionally, both C- and D-grade areas had a higher percentage of the population with 3+ risk factors than areas ungraded at the time (p < 0.001).
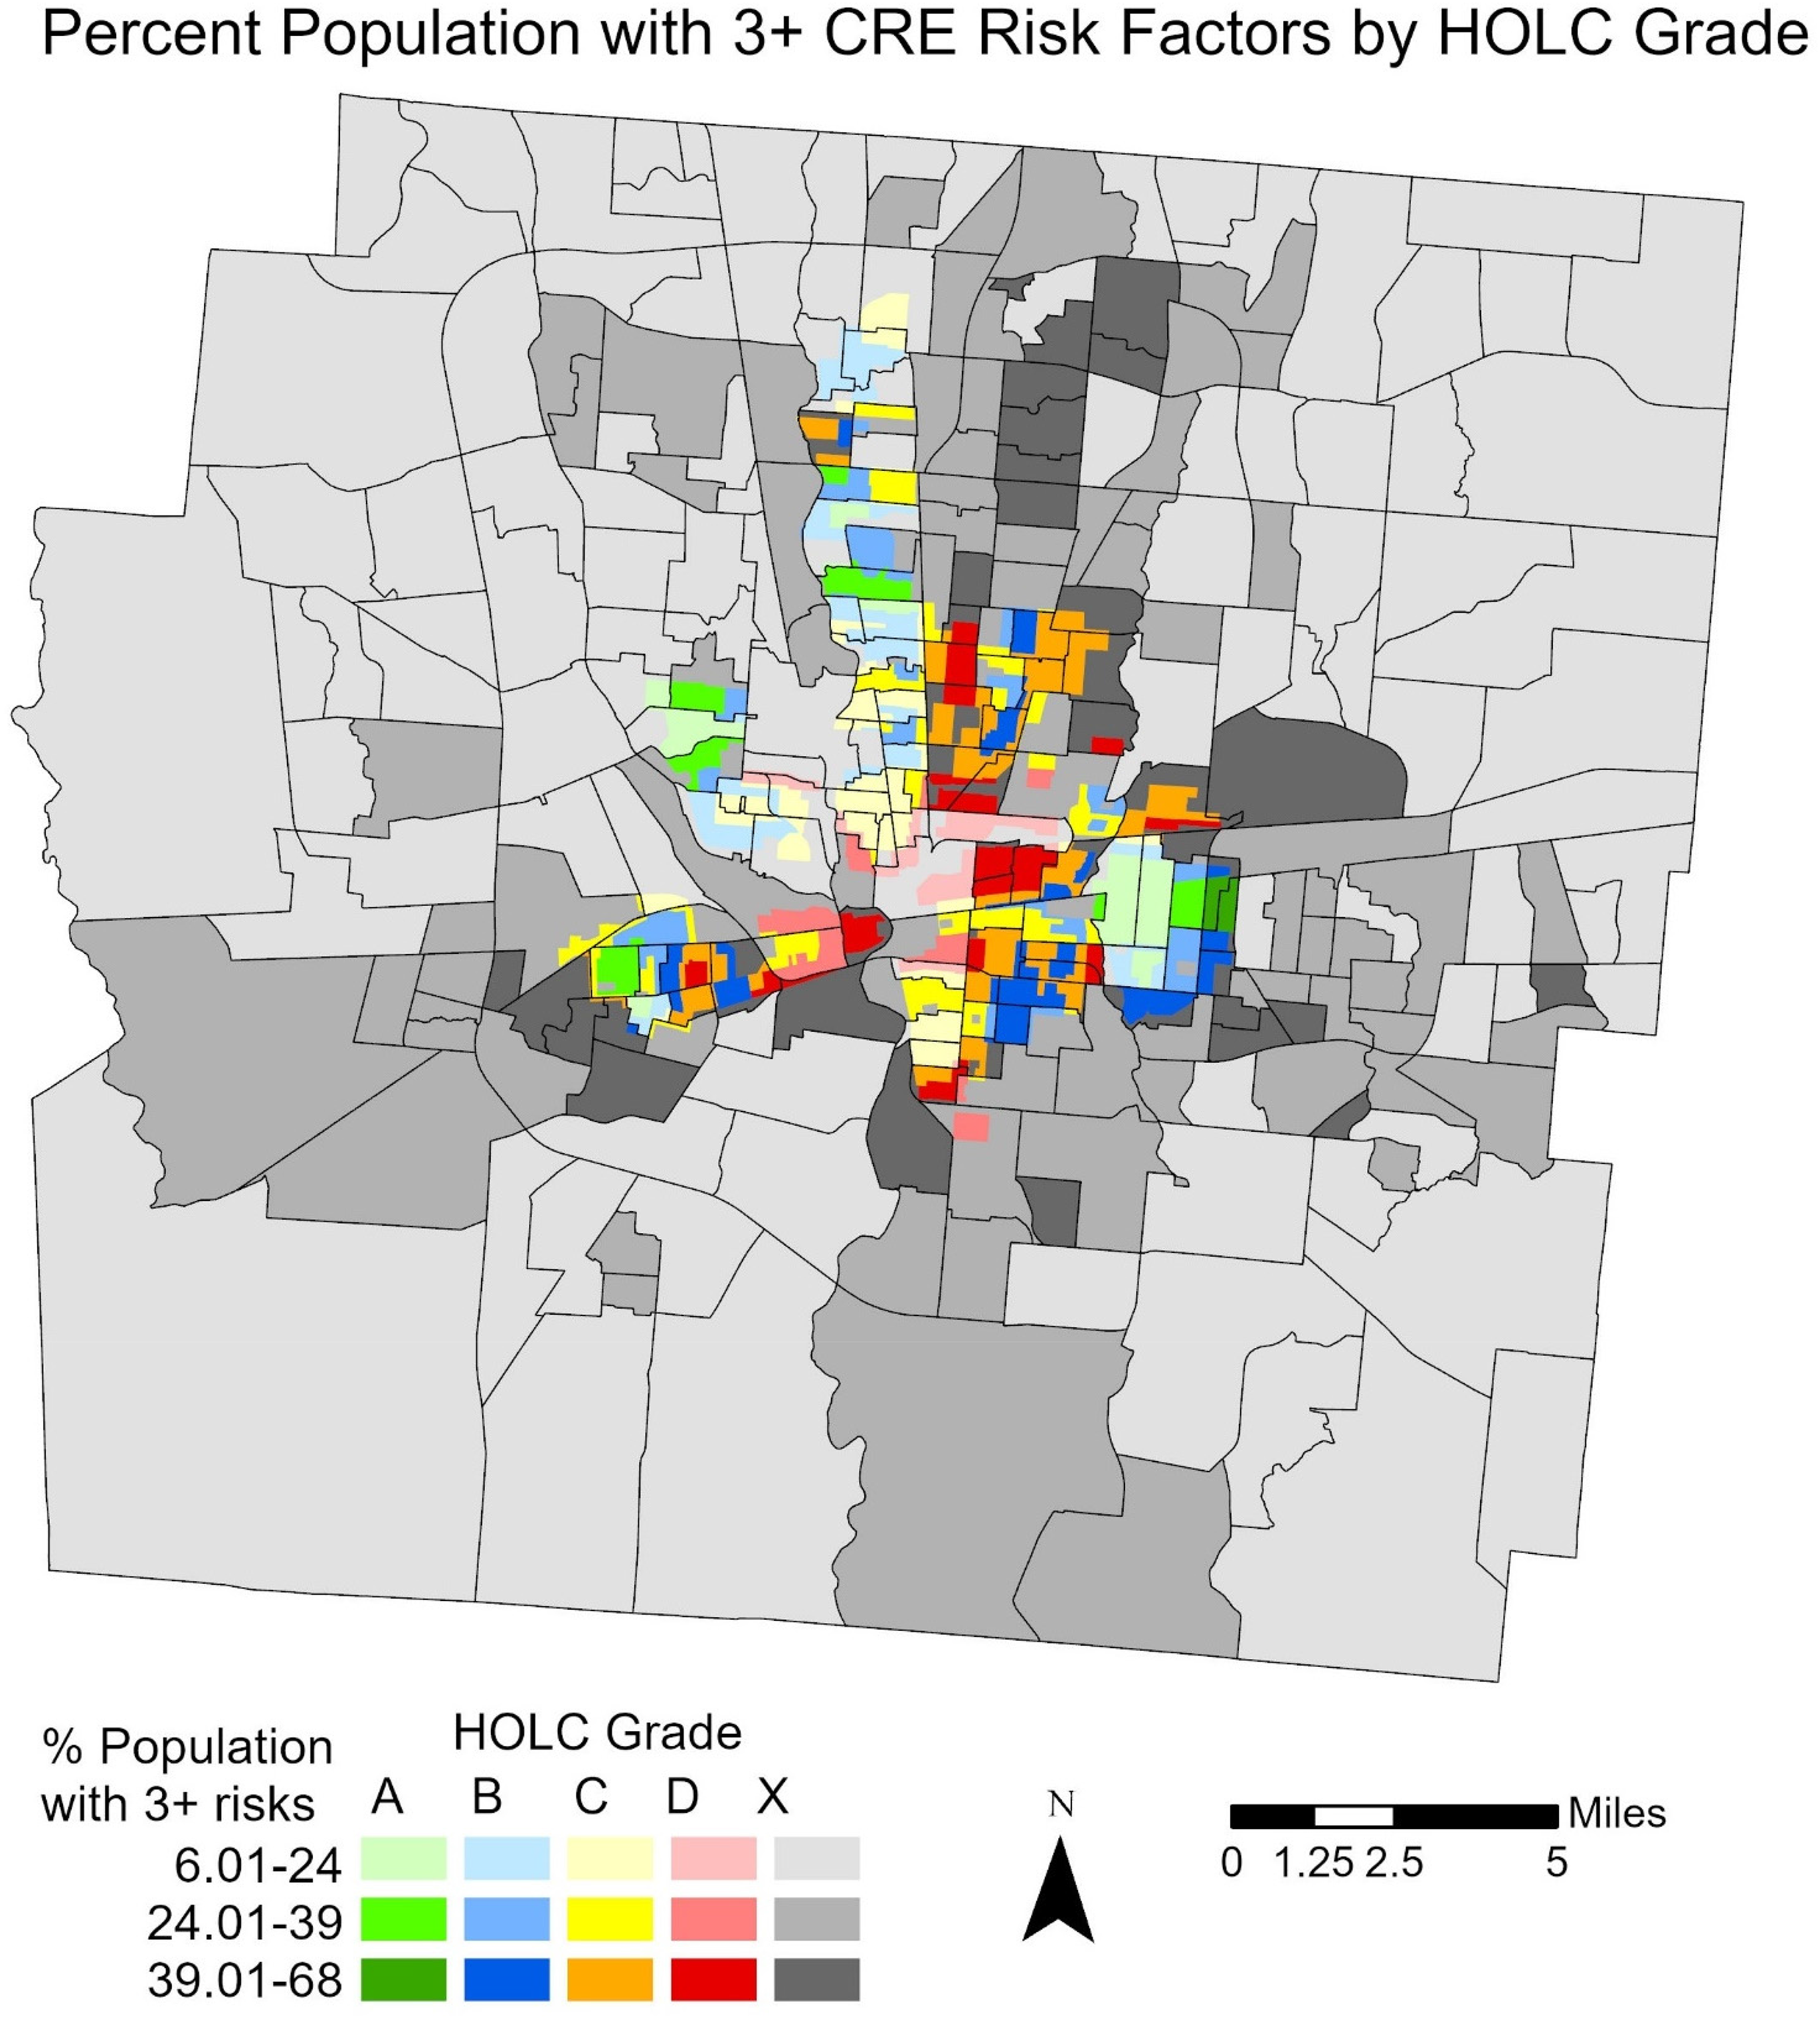
Percentage of the population with 3+ CRE risk factors by HOLC grade. This map displays the percentage of the population with 3+ CRE risk factors, with darker shades representing higher percentages and historical HOLC grades. X is used for areas not classified on HOLC maps.
These findings are consistent with the relationship invoked by the City Council resolution. Neighbourhoods that have a history of being redlined (assigned as D-grade) have a higher percentage of residents with 3+ CRE risk factors than those assigned as A-grade, B-grade or ungraded, suggesting that these areas have fewer resources with which to withstand disasters. Recognising racism as a public health crisis is an important gesture in Columbus and it needs to be followed up with targeted policy and increased funding to these historically oppressed areas.
Footnotes
Acknowledgements
Many thanks to Dr Zhenhua Chen and Gilsu Pae of The Ohio State University’s Knowlton School for their feedback on early drafts of this paper.
Declaration of conflicting interests
The author declared no potential conflicts of interest with respect to the research, authorship, and/or publication of this article.
Funding
The author received no financial support for the research, authorship and/or publication of this article.