
Abstract
European Union (EU) enlargement of the mid-2000s is likely to have changed the motives for foreign direct investment (FDI) location between the existing Member States (the EU15) and the new entrants of Central and Eastern Europe (CEECs), but it is poorly understood. This paper uses the framework of Dunning’s eclectic paradigm and data for 35,105 foreign investments in Europe not only to examine if the motives differ between these, but also how they are affected by the enlargement. Three asset-exploiting motives of market, resource and efficiency seeking are explored using a conditional logit model for the location choice. This is separately for greenfield and brownfield FDI, involving new facilities or jobs, where the latter is efficiency seeking from an expansion or a co-location of functions. The paper finds greenfield FDI in the CEECs seeks an export platform for the EU market and a low-skilled workforce but a national market and higher skills in the EU15. Brownfield FDI differs from this for expansions only, for which the EU market is important, reflecting scale economies. Surprisingly, EU enlargement has a much stronger effect on the FDI location motives in the EU15 by increasing the importance of the European market, which is possibly because the CEEC liberalisation was ongoing throughout the accession process. The paper finds evidence that the differences in the motives between the CEECs and EU15 are narrowing over time, but they are pronounced, and it is argued that they will persist.
Introduction
Multinational enterprise (MNE) activity from foreign direct investment (FDI) has grown at a faster rate than other international transactions, leading to renewed interest in its location (Blonigen, 2005). In Europe, FDI is driven by integration (Barba Navaretti and Venables, 2006), of which a key event is the fifth enlargement of the European Union (EU) in the mid-2000s (Brülhart et al., 2004; Jones et al., 2018). This sought to integrate the 10 Central and Eastern European countries (CEECs) into this union, liberalising their economies (De Smidt, 1992; Disdier and Mayer, 2004) and, through lower trade costs, changing the relationship with the 15 existing EU Member States (‘EU15’). 1 Enlargement is likely to affect the motives for FDI location in both the new and old EU Member States (Krugman and Venables, 1990), but it is relatively poorly understood. Much of the existing evidence is prior to the enlargement or for a single country, while the cross-country studies tend to be piecemeal and are for either the CEECs or the EU15 (e.g. Demekes et al., 2007; Pusterla and Resmini, 2007).
The purpose of this paper is to explore differences in the motives for FDI location in the CEECs and EU15 countries, and to examine the roles played by the EU enlargement and greater integration from economic, political and trade liberalisation. The framework for this is the eclectic paradigm of Dunning (1988, 2001) that is given effect by the asset-exploiting motives of market, resource and efficiency seeking (Buckley et al., 2007). The first two of these motives are explored for greenfield FDI, which is in the form of new start-ups, and the latter for brownfield FDI at an MNE’s existing site in the host country. This is as either an expansion in the plant’s primary function or a co-location of different functions at the same site, where these are efficiency gains from economies of scale and scope, respectively (Cui et al., 2014). In the international business literature, brownfield FDI tends to be used for the foreign takeover of domestically owned plants (Cheng, 2009), but in our case, it is associated with new facilities or jobs, possibly as a result of a takeover, which Meyer and Estrin (2001) define as ‘brownfield acquisitions’. Our definition is used by Král (2004), and it corresponds with the planning literature, where a brownfield site is land or buildings that is developed but not in full use (Alker et al., 2010). Importantly, as Dunning (2000) argues, it is sequential to the market and resource motives, so that it is believed to capture efficiency seeking.
The FDI data give details of 35,105 greenfield and brownfield cross-border investment projects locating in the CEECs and EU15 (together referred to as the ‘EU25’) between 1997 and 2010, including periods before and after the fifth EU enlargement. Terms are used to capture the market and resource motives, while data are also collected for enlargement and liberalisation, as well as for agglomeration, macroeconomic and industry variables, reflecting the heterodox nature of Dunning’s eclectic paradigm (McCann and Mudambi, 2005). The location choice is analysed using conditional logit models (CLMs), by regressing these variables across the EU25 countries for each of greenfield and brownfield FDI. In this latter case, the market and resource terms reveal the location of this efficiency-seeking FDI. The statistical significance of the market and resource motives is examined, which is both from zero and between the CEECs and EU15.
Overall, the results reveal that there are significant differences in the FDI location motives between the CEECs and EU15. Greenfield FDI in the CEECs is consistent with its location as an export platform for the main European market, but in the EU15, it seeks a large national market size and the higher-quality resources of an educated workforce. Brownfield expansions seek the European market in the CEECs and EU15, but co-locations have similar motives to greenfield FDI. Enlargement has a strong effect on the motives in the EU15 only, making the European market and a less highly-skilled workforce more attractive, whereas the locations in the CEECs that are further to the east increase in importance. Liberalisation was ongoing in the CEECs, and this may explain the weaker effect of enlargement. The difference in the motives seems to be narrowing over time, but it is argued that it will persist.
The next section sets out the framework and hypotheses. First, we outline the model, data and variables, and then we present the results before concluding.
Theoretical framework and location motives
The eclectic paradigm and literature review
There is a growing use of the international business literature in economic geography (see Beugelsdijk et al., 2010; Jones, 2018), for which the eclectic paradigm is the most influential framework for examining FDI determinants (Stoian and Filippaios, 2008). According to this, FDI occurs if a firm has ownership, internalisation and location advantages (Dunning, 1988, 2001), and it is given effect by the asset-exploiting motives of market, resource and efficiency seeking (Buckley et al., 2007). Market-seeking FDI circumvents trade barriers or it exploits new markets; resource-seeking investment secures a stable or low-cost supply of resources; and efficiency seeking improves a firm’s operations (Dunning, 2000). A fourth motive, known as strategic asset seeking (see Li et al., 2012), is not explored, since our FDI data are not linked at the MNE level, so industry linkage terms help control for this.
The empirical analysis is structured around three hypotheses. The first two examine the motives for greenfield and brownfield FDI, and the third considers enlargement. All three make a contribution, since only a small number of studies include both the CEECs and EU15, but even these may not take a pan-European perspective, including Spies (2010) on German unification and Ascani et al. (2016) on Italian FDI in EU candidate countries. Other studies are prior to the enlargement, such as Disdier and Mayer (2004), who examined the location of French FDI in Europe between 1980 and 1999. They found that agglomeration economies matter for the EU15 and the national market size and distance from the host country for the CEECs, but they did not consider proximity to the EU market. 2 More broadly, many FDI studies are for a single country, while the piecemeal nature of this literature makes it difficult to compare the importance of the FDI location motives between the CEECs and the EU15, and to know if they are statistically different. Not only do the studies differ between countries, but in the FDI data, the variables, their measurement, the controls, the time period and estimation technique also differ. All of these condition the results, but importantly they are held constant in our study.
Hypothesis I: market and resource motives and greenfield FDI
Eight CEECs acceded to the EU in 2004, followed by Bulgaria and Romania in 2007, although the integration of these economies with the EU15 had been ongoing since the mid-1990s.
3
Association Agreements were signed by each CEEC with the EU that removed tariffs on CEEC industrial goods (Baltagi et al., 2007), and checks on product standards and regulations were phased out over time. The accession negotiations commenced in 1998 and lasted up to seven years (Christoffersen, 2007), with FDI in the CEECs increasing greatly during this time (Jones et al., 2018; Resmini, 2000). The eclectic paradigm argues that the lower tariffs will make a country less attractive to market-seeking FDI, but integration raises the possibility of a third-country effect, since the EU15 has >90% of EU gross domestic product (GDP), and FDI might locate in the CEECs to take advantage of their good access to this market. The notion of an export platform is well established in the international economics literature (Neary, 2008), and it is consistent with the core-periphery new economic geography model (Krugman and Venables, 1990). It suggests that lower congestion and transport costs in the CEECs will be important to facilitate exports, but that the national market size and linkages are less important. Hypothesis Ia: Greenfield FDI in the CEECs is an export platform for the European market that seeks EU25 market access, but national markets are important for the EU15.
Hypothesis Ib: Greenfield FDI in the CEECs seeks cheap, low-skilled labour but high skills in the EU15, while flexible labour markets and lower taxes are important for both.
Hypothesis II: the efficiency-seeking motive and brownfield FDI
Efficiency seeking is explored for brownfield FDI, which is a reinvestment at an existing site that is an expansion in the plant’s main function or a co-location of different functions. These give rise to economies of scale or scope (Cui et al., 2014), where in the latter case the MNE takes advantage of ancillary capabilities, such as in technical, computing or transport services (Defever, 2006). Franco et al. (2010) argue that efficiency seeking is vague, since it includes activities that are resource seeking, such as the fragmentation of production into ‘global value chains’, but Bevan and Estrin (2004) emphasise the definition that is used here. Its sequential nature means brownfield FDI is consistent with efficiency seeking (Dunning, 2000).
Brownfield FDI is little explored in the literature, although, broadly defined, Rascuite and Downward (2017) explore brownfield FDI for EU15 investment in the EU25. They find heterogeneity in FDI location related to market size and labour availability, but again it is not examined separately for the CEECs and EU15, which could underlie this. Expansions are important in the context of integration, since, in the CEECs and EU15, they allow an MNE to consolidate its activities to achieve economies of scale (Neary, 2008). This could arise from the closure of an existing facility, possibly outside the EU25, or the location of an investment at an existing rather than a new site, but in either case access to the EU market will be important. Whether it locates in the CEECs or EU15 will depend on the same resources as in Hypothesis Ib. Hypothesis IIa: Brownfield FDI from expansions seeks locations with EU25 market access in both the CEECs and EU15, but resource seeking is like greenfield FDI. Hypothesis IIb: Brownfield co-locations are driven by the same motives as greenfield FDI.
Hypothesis III: EU enlargement and FDI location
There is little empirical evidence on how EU enlargement affects the FDI location motives, but as FDI grew strongly in the CEECs after liberalisation (Resmini, 2000), then a reasonable hypothesis is that enlargement will accentuate the importance of the location motives found for greenfield FDI in Hypothesis I, that is, a given market size leads to more FDI location and so on. This is consistent with Kosteletou and Liargovas (2000), who find that EU integration increased export-orientated FDI in the CEECs. In the case of the EU15, lower border costs after enlargement could promote the importance of the EU25 market relative to the national market but for investors that still seek higher-level skills in these countries. Hypothesis IIIa: EU enlargement makes the CEECs more attractive to greenfield FDI as an export platform for the European market and for cheap, low-skilled labour. In the EU15, the European market is also more important but for high-skilled labour. Hypothesis IIIb: Greater economic liberalisation increases greenfield FDI in the CEECs, but political and trade liberalisation have an uncertain effect and could diminish it.
Empirical model
The relationship between the profits πijt earnt on an investment i in country j ∈ K = (‘EU25’) at time t and the location attributes is linearised as: πijt = βXijt + εijt, where Xijt are observable attributes, and εijt is unobserved investor-specific characteristics. This kind of relationship can be derived from a rich base in theory but for a smaller set of variables (e.g. Basile et al., 2008; Head and Mayer, 2004). While empirically based, it is reasonable for exploring the market and resource motives, since these affect an investor’s revenue and costs and therefore profits. The hypotheses are examined statistically by writing: βXijt ≡ βMhMijt + βRhRijt + βIIijt+βCCijt, where M and R are market and resource motives (h = CEEC and EU15), I are integration terms and C are controls. The β parameters are estimated in a single regression for the EU25, which is for greenfield and brownfield FDI for hypotheses I and II, respectively. It is tested if the parameters are different from zero (i.e. βMCEEC = 0, βMEU15 = 0, βRCEEC = 0 and βREU15 = 0) and if they differ from each other (βMCEEC = βMEU15 and βRCEEC = βREU15). For hypothesis III, it is also examined if these equalities differ before and after the EU enlargement.
Based on utility maximisation, the CLM links site selection by a profit-maximising firm to the location attributes. The location choice is modelled by letting Pijt denote the probability that the foreign investment locates in country j, that is, Pr(πijt > πikt), where j ∈ K and for all k ≠ j. Since πijt = βXijt + εijt, then by substitution, Pr(β(Xijt – Xikt) > εijt – εikt), and if εijt follows a Gumbel distribution, then (McFadden, 1974):
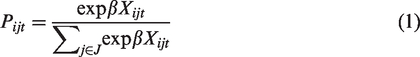
The coefficient β (i.e. βMh, βRh, βI and βC) gives the log-odds ratio of choosing country j over not choosing j in K. It is estimated by maximising the log-likelihood function L across the EU25, where dijt is unity if a project i locates in country j at time t, but zero otherwise:

The CLM embodies the Independence of Irrelevant Alternatives (IIA) that imposes a uniform substitutability between each country pair, but it can lead to biased and inconsistent estimates (see Head et al., 1995). 4 A popular way to address this is a nested logit model (NLM), which estimates the correlation in the error term due to the unobserved characteristics (Basile et al., 2008). Disdier and Mayer (2004) nested the location choice between the CEECs and EU15, but they found it diminished between 1991 and 1999, which they attribute to the liberalisation of the CEECs. The NLM is outlined in the Appendix, although in the analysis below, we do not reject the IIA.
Data and variables
The FDI data are sourced from the Ernst and Young European Investment Monitor (EIM), which gives details of cross-border investment at the project level. It includes FDI from any source in all EU countries at 2007, excluding Cyprus and Malta. 5 The EIM gives the location choice of greenfield and brownfield investments that lead to new facilities or gross jobs. It identifies the industry, function, country of origin and scale, although investment expenditure is known only for a third of cases and the number of jobs for two-thirds. To compile the data, Ernst and Young (2012) claimed to monitor 20,000 outlets and contacted the majority of firms to validate the data. Notwithstanding some definitional differences, the correlation between the EIM and UNCTAD FDI data is 0.90 by country and year. The number of brownfield cases is similar to Rascuite and Downward (2017), who use the Bureau van Dijk FDI data.
The EIM data set identifies 35,105 FDI projects between 1997 and 2010, of which a third are brownfield FDI (see Table 1). Half of the projects locate in three EU15 countries (8343 in the UK, 6022 in France and 3491 in Germany), and a fifth locate in the CEECs (6880 projects). 6 Table 1 shows that 58% of projects are in manufacturing and 30% in services, excluding personal services such as education and health, retail and hospitality and transport. 7 Four-fifths of the brownfield projects are expansions, which is similar for the CEECs and EU15, but they are more likely to be in manufacturing (Table 1). About half of the projects originate from the EU15, 34% from the Americas and 12% from Asia. Figure 1 shows that FDI increases in the CEECs after enlargement in 2004, but it is more pronounced for the EU15. Indeed, Figure 2 shows that manufacturing and service FDI have each trended upwards in the EU15.
Project characteristics by mode.
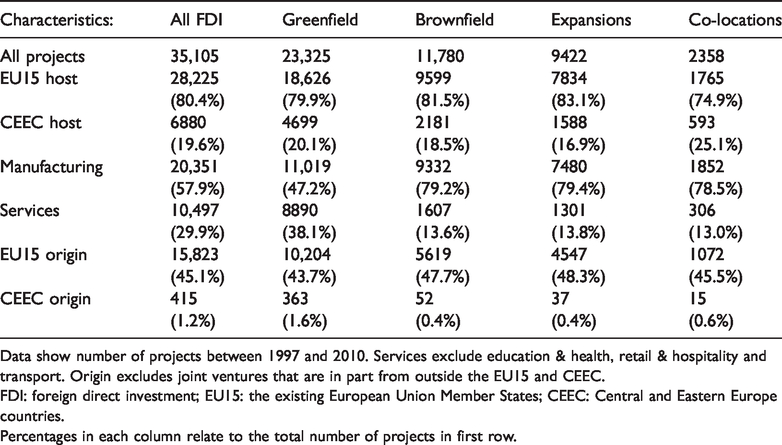
Data show number of projects between 1997 and 2010. Services exclude education & health, retail & hospitality and transport. Origin excludes joint ventures that are in part from outside the EU15 and CEEC.
FDI: foreign direct investment; EU15: the existing European Union Member States; CEEC: Central and Eastern Europe countries.Percentages in each column relate to the total number of projects in first row.
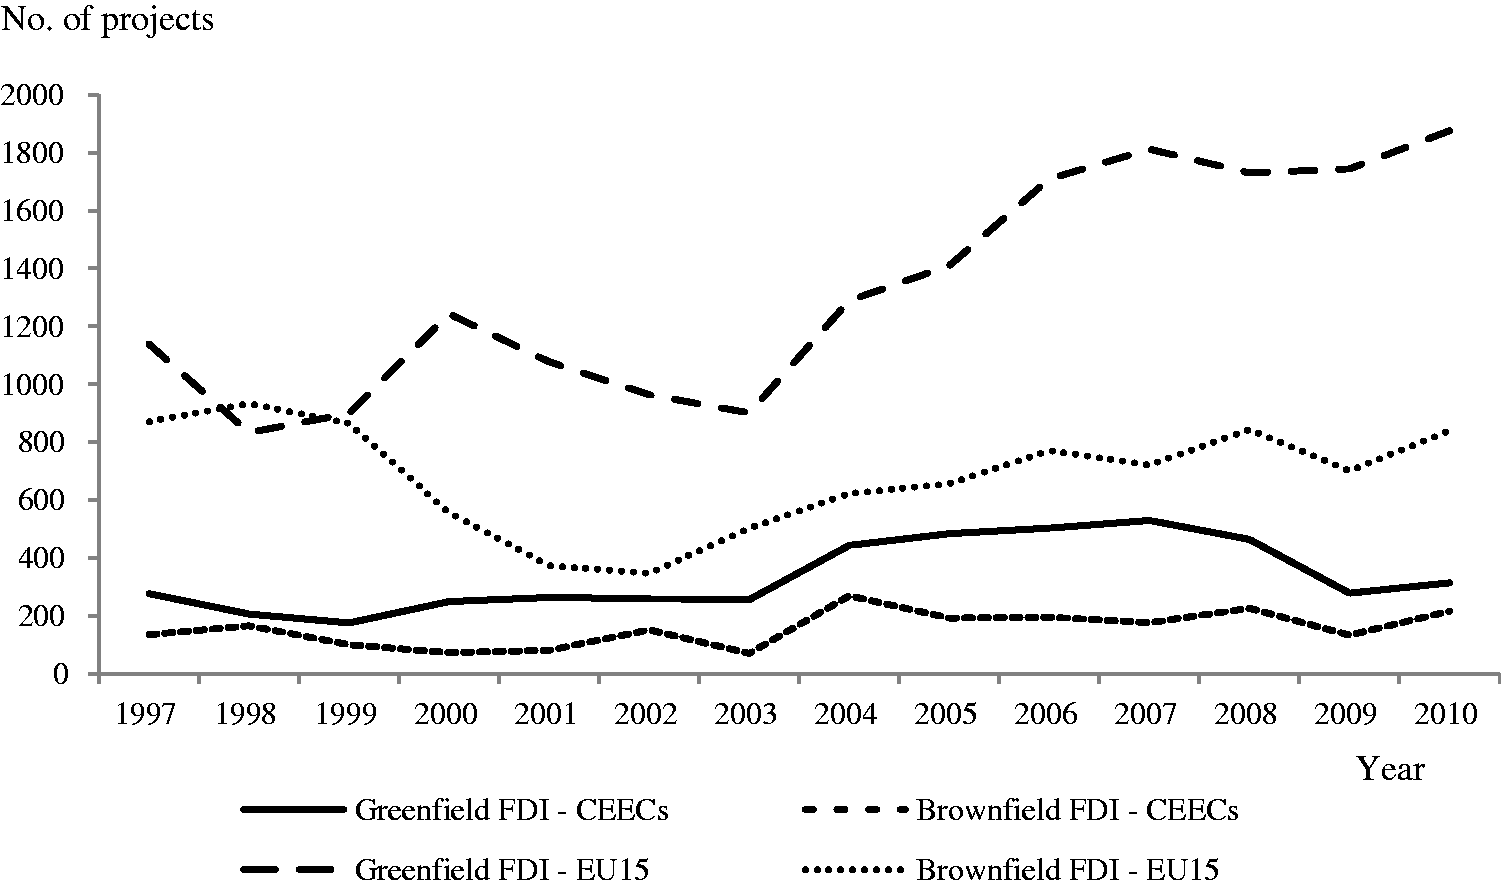
Foreign direct investment in the EU15 and CEECs by mode over time.
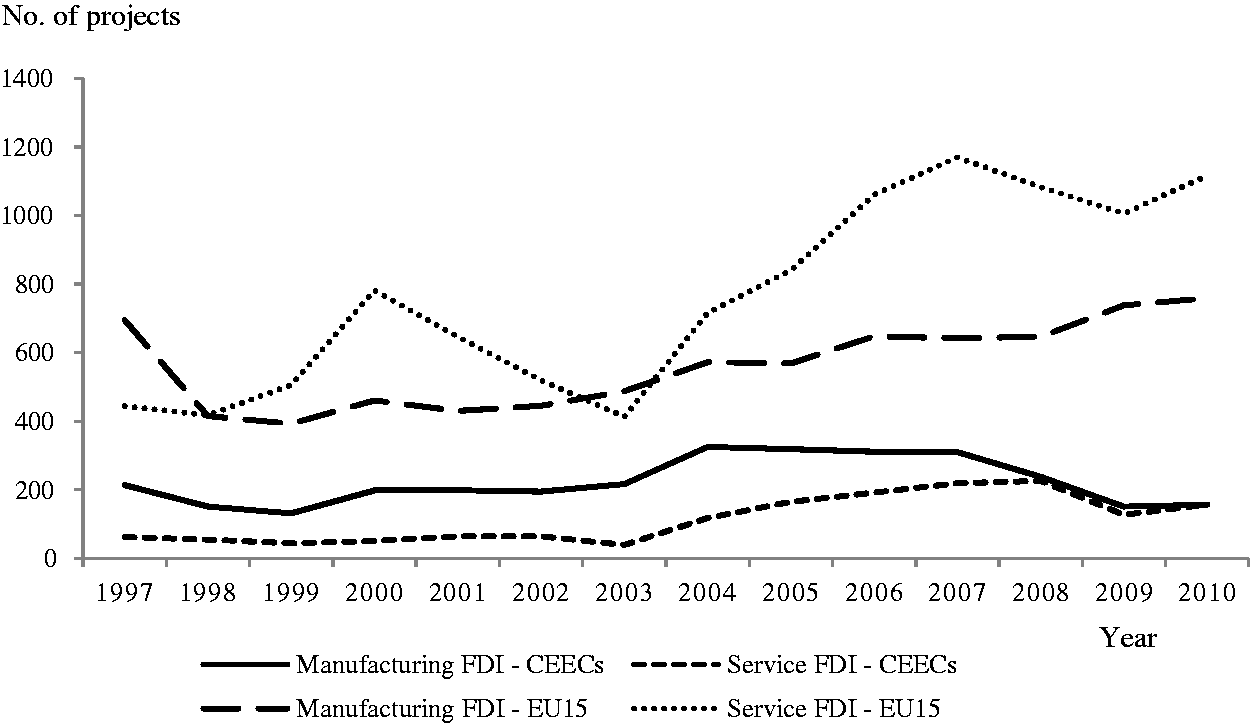
Greenfield foreign direct investment by sector over time.
To distinguish expansions from co-locations, the EIM identifies 10 primary functions of the FDI projects. Overall, 35% of the functions are in production, 35% sales and marketing, 8% headquarters and 7% R&D. These are 29%, 39%, 10% and 8% for the EU15 but 60%, 20%, 1% and 5% for the CEECs, respectively. Other functions are service based but small in number: logistics (8% EU15; 7% CEECs), contact centres (3%; 2%), testing and servicing (2%; 2%), shared services (1%; 2%), education and training (0.5%; 0.5%) and data centres (0.5%; 0.5%).
Market and resource variables
The terms for the market (M) and resource (R) motives are chosen to address the hypotheses, and they are motivated by the literature. The discussion of these terms is necessarily concise, but greater detail can be found in Serwicka et al. (2014). The measurement of the variables, including the I terms, is given in Appendix Table A, together with the expected signs and the means. Correlation coefficients are presented in Appendix Table B and are reasonable. 8
In the manner of Harris (1954), market seeking at the European level is captured by a gravity-weighted market potential term, which quantifies the centrality/peripherality of each country location. For country j, it is the sum of GDP for all other (K=) EU25 countries:
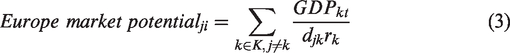
Since roads are the popular method for moving goods in the EU, it is weighted by the distance djk between the respective capital cities, using the AA Route Planner. To allow for the intra-country distance, it is also weighted by the country size rk (i.e. radius of a disk with the same area). An alternative measure used by Head and Mayer (2004) performs less well.
Market demand at a national level is measured by country real GDP and the forward-looking nature of FDI by the GDP growth rate (see Head and Mayer, 2004; Procher, 2011). As a measure of urbanisation, the population density indirectly captures market potential, but a negative sign means that the market is congested and exporting is difficult. The motorway density is likely to be correlated with other physical infrastructure, but it is added for the ease of access, for which a positive sign is expected (Keeble et al., 1988). Some studies include per capita income in place of GDP (e.g. Resmini, 2000), but as a market-based explanation, it is problematic, since it could reflect the productivity of resources. Indeed, it is correlated with both market and resource terms (motorway density: +0.62; wage rate: +0.65). Further, given that the areal size of the country is included in the controls (see below), then it is not possible to include per capita income, as it means unscrambling four coefficients from three estimates, while including per capita income on its own gives an implausible negative estimate. 9
On resource seeking, high- and semi-skilled labour are proxied by the educational attainment rate of the working-age population at each of the tertiary and secondary levels. A positive estimate for these, especially the former, is consistent with investors seeking specific assets (Iammarino and McCann, 2013). Unskilled labour is the share of the workforce that is educated at neither of these levels, so that its effect is inferred from negative estimates for the two education terms. Production costs are measured by the manufacturing wage rate. There is some ambiguity about the role of the unemployment rate (Basile et al., 2008), but as labour availability is likely to be reflected in a lower wage rate, then, like Disdier and Mayer (2004), it is interpreted as capturing a rigid labour market, for which a negative sign is expected. The tax rate is added as it affects the post-tax investment return (Procher, 2011). As the areal size is included, it does not capture the benefit of public goods (Bénassy-Quéré et al., 2007).
Integration and control terms
The I terms include terms for two integration events. The first is for the EU membership that removed the border checks and lowered trade costs. The second is for the European Council commitment to enlargement that ensured the liberalisation of the CEECs under the accession criteria. These are unity for the year of the event and all years afterwards but zero otherwise. Since integration is ongoing terms are also included for each of economic, political and trade liberalisation. The first is captured by the real effective exchange rate. Since its denominator is the consumer price index, it picks up a loss of competitiveness from higher inflation. The second is measured by a composite political risk index that weights 12 indicators, and as serious risks do not vary much, it captures less serious risks. 10 Finally, the trade liberalisation from the tariff reductions is picked up by the volume of trade relative to GDP.
As controls, agglomeration terms from industrial linkages are included for each of the foreign and domestic sectors, where the former is based on the number of FDI projects in the previous period and the latter on employment data (see Appendix Table A). A Jacobs term is added for industrial diversity for the linkages that go across industries (Jones, 2017), as well as a market structure term for the ease of entry into an industry. EU Structural Funds might attract FDI (Basile et al., 2008), but these could just signal that a country is underdeveloped. The absolute change in the exchange rate is included for market volatility that may deter FDI, and Euro currency membership is added, which like the trade term has an ambiguous effect. FDI varies much more strongly across countries than over time, and this lack of within-group variation makes country-level fixed effects inappropriate, like other studies (e.g. Disdier and Mayer, 2004; Spies, 2010). Finally, as noted above, the areal size term captures the benefit of a country’s pure public goods. Crucially, it also ensures that the population density term is correctly determined, while leaving other estimates unchanged (see note 9).
Results
The model is regressed for j = 25 countries and t = 14 years from 1997 to 2010. All terms are lagged a year, except for the pre-announced membership and Euro terms. Initially, the NLM was regressed for greenfield FDI, nested according to the EU15 and CEECs, but these results invalidate the utility maximisation foundation of the logit model. 11 This is also the case if the CEECs are nested by the 2004 and 2007 entrants, implying that Bulgaria and Romania are not close substitutes for each other. A similar result is found for Estonia and the other Baltic States. In both cases, the countries are in different language families, suggesting that cultural differences are important (Mudambi and Navarra, 2002). After experimentation, a nesting structure was found that is consistent with the logit model, but these estimates imply that the errors are uncorrelated. 12 Disdier and Mayer (2004) find a diminishing ‘west–east’ nesting effect prior to enlargement, while it could also be that the large number of variables included in this study capture the differences in FDI location between the CEECs and EU15.
Hypothesis I: market and resource motives and greenfield FDI
The results from regressing the CLM for greenfield FDI are presented in Table 2. The first column is for all FDI, and the second and third columns are for manufacturing and services. Many coefficients are significant, as the large number of observations means the estimates are better determined with smaller confidence intervals. Two significance tests are presented: the difference from zero (e.g. βMCEEC = 0 and βMEU15 = 0), and, in square brackets, the difference between the CEECs and EU15 (βMCEEC = βMEU15). 13 Of the other terms, the integration terms are discussed below, but agglomeration, foreign and domestic specialisation all increase FDI, and more so in the EU15. Industrial diversity has no effect, but a concentrated market deters FDI, and the areal size has a positive effect. Like these, other terms have expected signs.
Results for the greenfield FDI location choice.
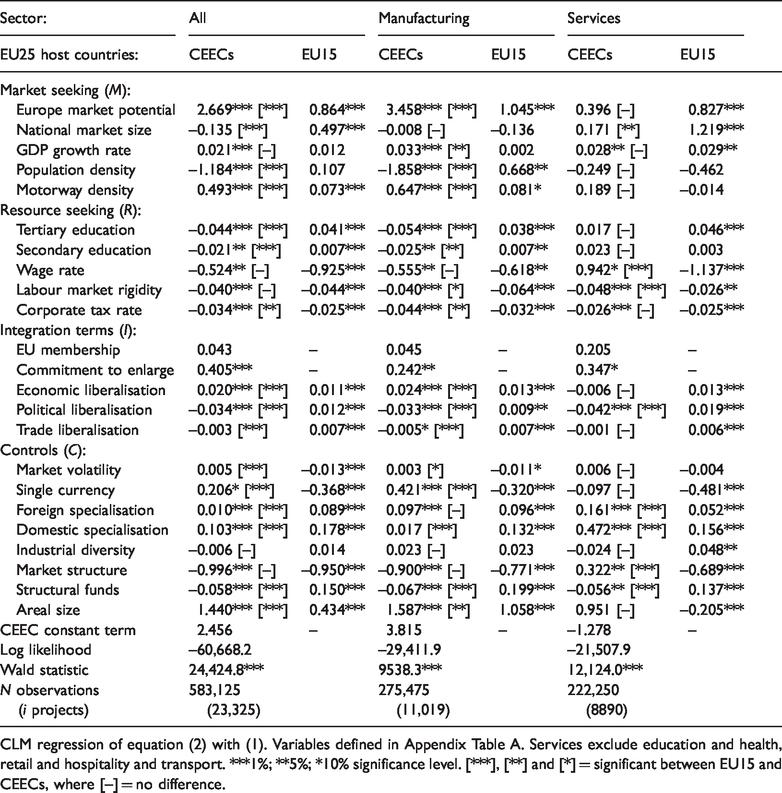
CLM regression of equation (2) with (1). Variables defined in Appendix Table A. Services exclude education and health, retail and hospitality and transport. ***1%; **5%; *10% significance level. [***], [**] and [*] = significant between EU15 and CEECs, where [–] = no difference.
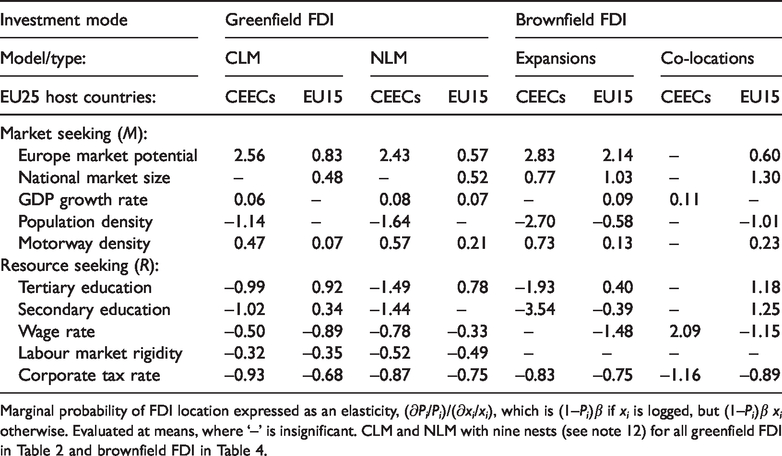
To interpret the results for the market (M) and resource (R) terms, the marginal effects for the probability of FDI location with respect to each term are evaluated in Table 3, where each is expressed as an elasticity. The table also presents the marginal effects for the NLM, but they are similar to the CLM, which is expected, given the above. The elasticities are based on the results shown in Table 2, but qualitatively similar estimates are found for the parsimonious version. The M and R estimates are now considered in relation to Hypothesis I.
Marginal probability effects.
Hypothesis Ia. The results in Tables 2 and 3 do not reject this hypothesis. They show that FDI in the CEECs is an export platform for the EU25, as the European market potential elasticity is significant and greater than two. Other estimates support this, as the population density and motorway terms reveal that the investors seek an uncongested location with good access, consistent with exporting. Further, the European market potential is significantly less important for FDI location in the EU15, as the elasticity is a third of that for the CEECs, while the population density is insignificant and the national market size is positive and significant. Similar results are obtained for manufacturing FDI, except only the European market matters. The market motives are insignificant for service FDI in the CEECs, but these are essentially producer services, while the importance of the national market for service FDI in the EU15 is likely to reflect its more localised nature, and it is found by Jones and Wren (2016).
Hypothesis Ib: The results in Tables 2 and 3 do not reject this hypothesis. The wage rate exerts a negative and significant effect on greenfield FDI in the CEECs, as do both of the education terms, implying a preference for low-skilled labour. In the EU15, both education terms are positive, and they differ significantly from the CEECs, such that resource seeking in the EU15 is about skilled labour. Indeed, the elasticity for tertiary education is nearly three times greater than that of secondary education in the EU15. Nevertheless, costs still matter, as lower wages are important in the EU15, while, as expected, a lower corporate tax rate and less rigid labour market are significant for both the CEECs and EU15. Similar results are found for manufacturing FDI, for which the linkages with domestic firms are weaker in the CEECs, further supporting the export-platform hypothesis. For service FDI, Table 2 shows domestic linkages are more important, consistent with producer services, while the positive wage effect could be a substitution effect, since it is measured for the manufacturing industry only.
It is not practical to regress the data to allow for the characteristics of the FDI using a multinominal logit model, since there are a large number of countries, and space constraints prevent us from setting out the new model. However, Appendix Table C estimates the CLM for manufacturing FDI from the EU25 only, and it finds similar results. This is also the case if the southern EU or three large EU15 recipients of FDI are not included as hosts.
Hypothesis II: the efficiency-seeking motive and brownfield FDI
Brownfield FDI location is conditional on the location of a MNE’s existing plants, but since these investments could alternatively be carried out as greenfield FDI, the model is regressed across all EU25 countries. Any resulting bias is likely to be small, since it is regressed across a large number of location choices. Table 4 gives the results from jointly regressing the CLM for the expansions and co-locations, allowing the estimates of the market (M) and resource (R) terms to differ between the CEECs and EU15. The elasticities are again given in Table 3. With the exception of the accession terms, the I and C estimates are qualitatively the same as Table 2 and so not reported. A similar pattern is found for production in Appendix Table D, but if the other functions are considered, then the estimates are largely insignificant.
Result for the brownfield FDI location choice.
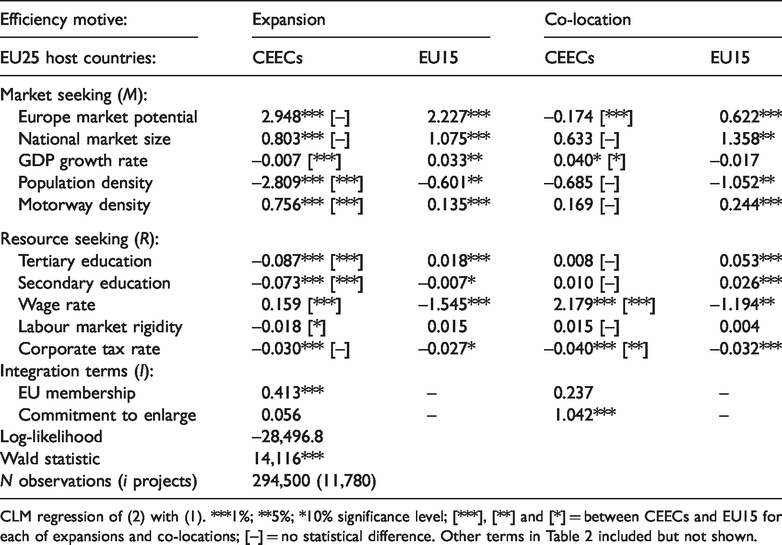
CLM regression of (2) with (1). ***1%; **5%; *10% significance level; [***], [**] and [*] = between CEECs and EU15 for each of expansions and co-locations; [–] = no statistical difference. Other terms in Table 2 included but not shown.
Hypothesis IIa: The results for expansions support the hypothesis for the market motive only. European market potential has a positive effect on the location of expansion projects that is not significantly different between the CEECs and EU15. In either case, the elasticity of two is greater than that for the national market, and good motorway access and a lower population density also matter for both, especially the CEECs. The importance of the European market is consistent with the significant EU membership term, reflecting lower border costs. While not tested directly, the quality of the resource requirement is lower than that found in Table 3 for greenfield FDI, since a less educated workforce has a larger effect on FDI location in the CEECs, and a more educated workforce has a smaller effect for the EU15.
Hypothesis IIb: The results for co-locations support the hypothesis for the EU15 only. The co-location estimates are similar to greenfield FDI, except that the national market and higher-skilled labour are even more important for FDI location in the EU15 (Table 3), while in the CEECs the motive terms are generally insignificant. This could arise from the smaller number of observations on the co-locations (Table 1), while there is greater heterogeneity, as there are 90 possible combinations of the functions compared to 10 for the expansions that are in the same function. Similar results are found for co-locations involving production (Appendix Table D). The commitment to enlarge term in Table 4 indicates that liberalisation rather than lower border costs are important for co-location investments.
Hypothesis III: EU enlargement and FDI location
The European Council commitment to enlarge term is significant in Table 2, so that this is interacted with the market and resource terms to explore the effect of EU enlargement. Since there is no single date for this event, the year 2004 is used for the EU15. The results for greenfield FDI are given in Table 5. These are qualitatively the same if instead the location motive terms are interacted with EU membership or if 2002 is used for the EU15. The other liberalisation terms are estimated for the period as a whole, since these are ongoing.
Result for EU enlargement.
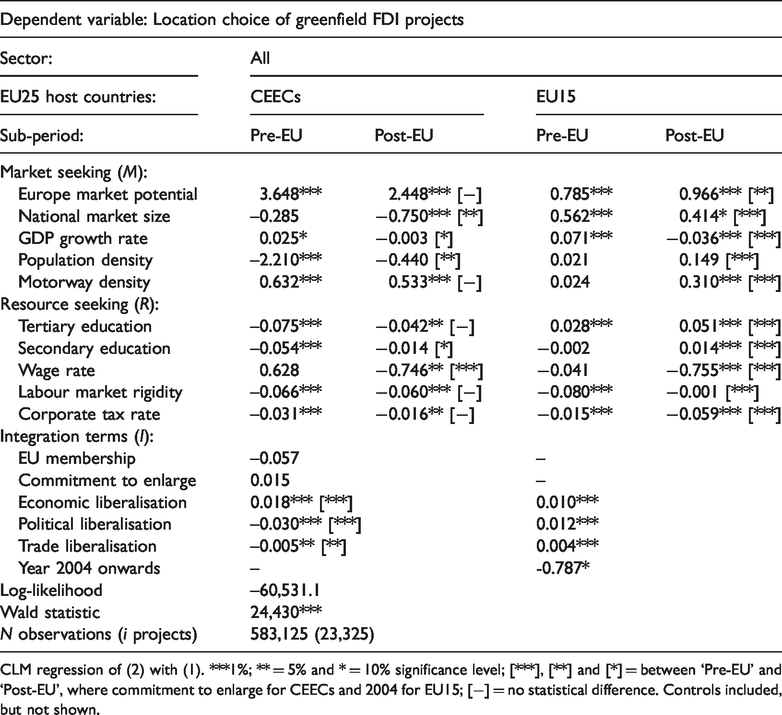
CLM regression of (2) with (1). ***1%; ** = 5% and * = 10% significance level; [***], [**] and [*] = between ‘Pre-EU’ and ‘Post-EU’, where commitment to enlarge for CEECs and 2004 for EU15; [−] = no statistical difference. Controls included, but not shown.
Hypothesis IIIa: This hypothesis is refuted for the CEECs but not for the EU15. The results in Table 5 show that just 3 of the 10 motive terms differ at the 5% significance level for the CEECs after enlargement, but every motive differs for the EU15, which is nearly always at the 1% level. 14 In the CEECs, European market potential is less important for FDI location after enlargement and significantly so for manufacturing (Appendix Table D). Unskilled labour is also less important, as captured by the less negative education terms, while there is a strong negative estimate on the wage rate. These estimates are explained by investors in the CEECs trading market access after enlargement for low-cost locations further to the east. 15 In the EU15, the structural break in the location motives is consistent with the strong upward trend in greenfield FDI from 2004 in Figure 1, which is more pronounced than for the CEECs. It does not reflect the service FDI growth shown in Figure 2, since it is found for manufacturing FDI in Appendix Table D. 16 In contrast to the CEECs, it is locations in the EU15 that have good European market access that are more important after enlargement, and the quality of labour is also more important, particularly skilled labour.
Hypothesis IIIb: This hypothesis is not refuted by the results. Economic liberalisation increases the probability of location in the EU25, but Table 5 shows that political and trade liberalisation reduce FDI in the CEECs. As noted above, it is consistent with other studies and reflects the less developed nature of these economies. The magnitude of the coefficient estimates for economic and political liberalisation are much greater for the CEECs, and this may explain why the EU enlargement has a weaker effect for these countries.
Conclusions
This paper makes several contributions. Not only does it offer systematic evidence on the role of the motives for FDI location derived from Dunning’s eclectic paradigm by testing differences in these between the CEECs and EU15, it also explores how these motives change after the major EU enlargement event of the mid-2000s that integrated the CEECs. There is a substantial literature on FDI location, but this has developed piecemeal, so that there are few studies including both the CEECs and EU15. Further, much of this evidence is in the run-up to the accession, so that the effects of EU enlargement are relatively poorly understood.
The current paper finds there are statistically significant differences in the motives. In particular, greenfield FDI in the CEECs is an export platform for the European market that seeks an uncongested location, good access and low-skilled labour, whereas in the EU15, the national market and high-skilled labour are significantly more important. These differences exist for manufacturing, and they are apparent even if the southern or major European states are excluded as hosts, but they are less clear-cut for services. Brownfield FDI locates differently in the case of an expansion of a plant’s primary function only, for which the European market is important throughout the EU25. This is efficiency seeking from economies of scale.
As regards EU enlargement, the paper finds the surprising result that it substantially affects the FDI location motives in the EU15, but relatively little affects them in the CEECs. This could arise because the economic liberalisation of the CEECs was ongoing both during the 1990s and through the protracted accession process, although like some other studies, we find that political and trade liberalisation actually have a negative effect on FDI location in the CEECs, which differs from the EU15. Notwithstanding this, we are unable to confirm the finding of Disdier and Mayer (2004) that the location choice is nested between the CEECs and EU15, possibly because we include a large number of explanatory variables, so that the unobserved effects are small. Disdier and Mayer argue that the liberalisation of the CEECs weakens the nesting effect, and this may be a further factor over our study period.
Finally, the differences in the FDI location motives found in this paper are ultimately likely to reflect the underlying disparities in economic development between the CEECs and EU15. Of course, FDI is a key driver of development, but given these disparities, the motives may not be readily amenable to policy intervention. Nevertheless, it is the case that the FDI motives should not be treated as homogeneous between the new and existing Member States. While we find evidence that there is some narrowing in the FDI motives between these after enlargement (i.e. the European market matters more in the EU15 but less so in the CEECs, with FDI locating further eastwards), it is the case that they remain pronounced. Since they reflect the disparities in economic development, then they are also likely to persist.
Footnotes
Acknowledgements
Earlier versions of this paper were presented in whole or in part at: the Department of Land Economy, Cambridge University, March 2014; European Regional Science Association conference, St Petersburg, August 2014; British and Irish Section of the Regional Science Association, Newquay, August 2016; and HM Treasury, UK, January 2017. Financial support from the Peter and Norah Lomas scholarship is gratefully acknowledged and thanks go to Ernst and Young for supplying the FDI data. We are grateful to David Barlow, Luigi Benfratello, Paul Elhorst, Simona Iammarino and Roxana Radulescu, as well as to anonymous referees of this journal for constructive comments, but the usual disclaimer applies.
Declaration of conflicting interests
The author(s) declared no potential conflicts of interest with respect to the research, authorship and/or publication of this article.
Funding
The author(s) received no financial support for the research, authorship and/or publication of this article.
Notes
Supplemental material
Supplemental material for this article is available online.