
Abstract
Despite its prediction in public opinion surveys and constituency-level forecasts (e.g. YouGov, 2019), the Conservative victory in the 2019 UK general election with a majority of 80 seats and an overall vote share of 44% (BBC News, 2019) was a surprise to many. Perhaps most unsettling was the manner of Labour losses and Conservative gains. Several constituencies forming Labour’s “red wall” in the north of England elected Conservative candidates for the first time, a pattern that was repeated in constituencies in Wales and the Midlands and, for some, suggesting a ‘realignment’ in UK politics (Sabbagh, 2019). This featured graphic attempts to characterise this shifting geography, borrowing design ideas from a Washington Post article by Lazio Gamio and Dan Keating entitled ‘How Trump redrew the electoral map’ (Gamio and Keating, 2016). Gamio and Keating’s piece quantifies changing vote shares using several indicators and carefully combines visual variables (Bertin, 2010) in order to expose a rich pattern of change in two-party (Republican–Democrat) voting behaviour at the US county level.
Figure 1 closely follows Gamio and Keating’s design choices. Each UK constituency is represented as a line positioned at the constituency’s centroid. These lines, and constituency polygons, are coloured according to the party affiliation of the winning candidate (Conservative, Labour, other). The angle of lines is then varied continuously according to the Butler two-party swing (Butler and Van Beek, 1990) in vote share from the 2017 general election, with lines angled right showing a swing to the Conservatives and lines angled left showing a swing to Labour. Where the winning party for a constituency represents a flip in allegiance from 2017, lines are made bold.
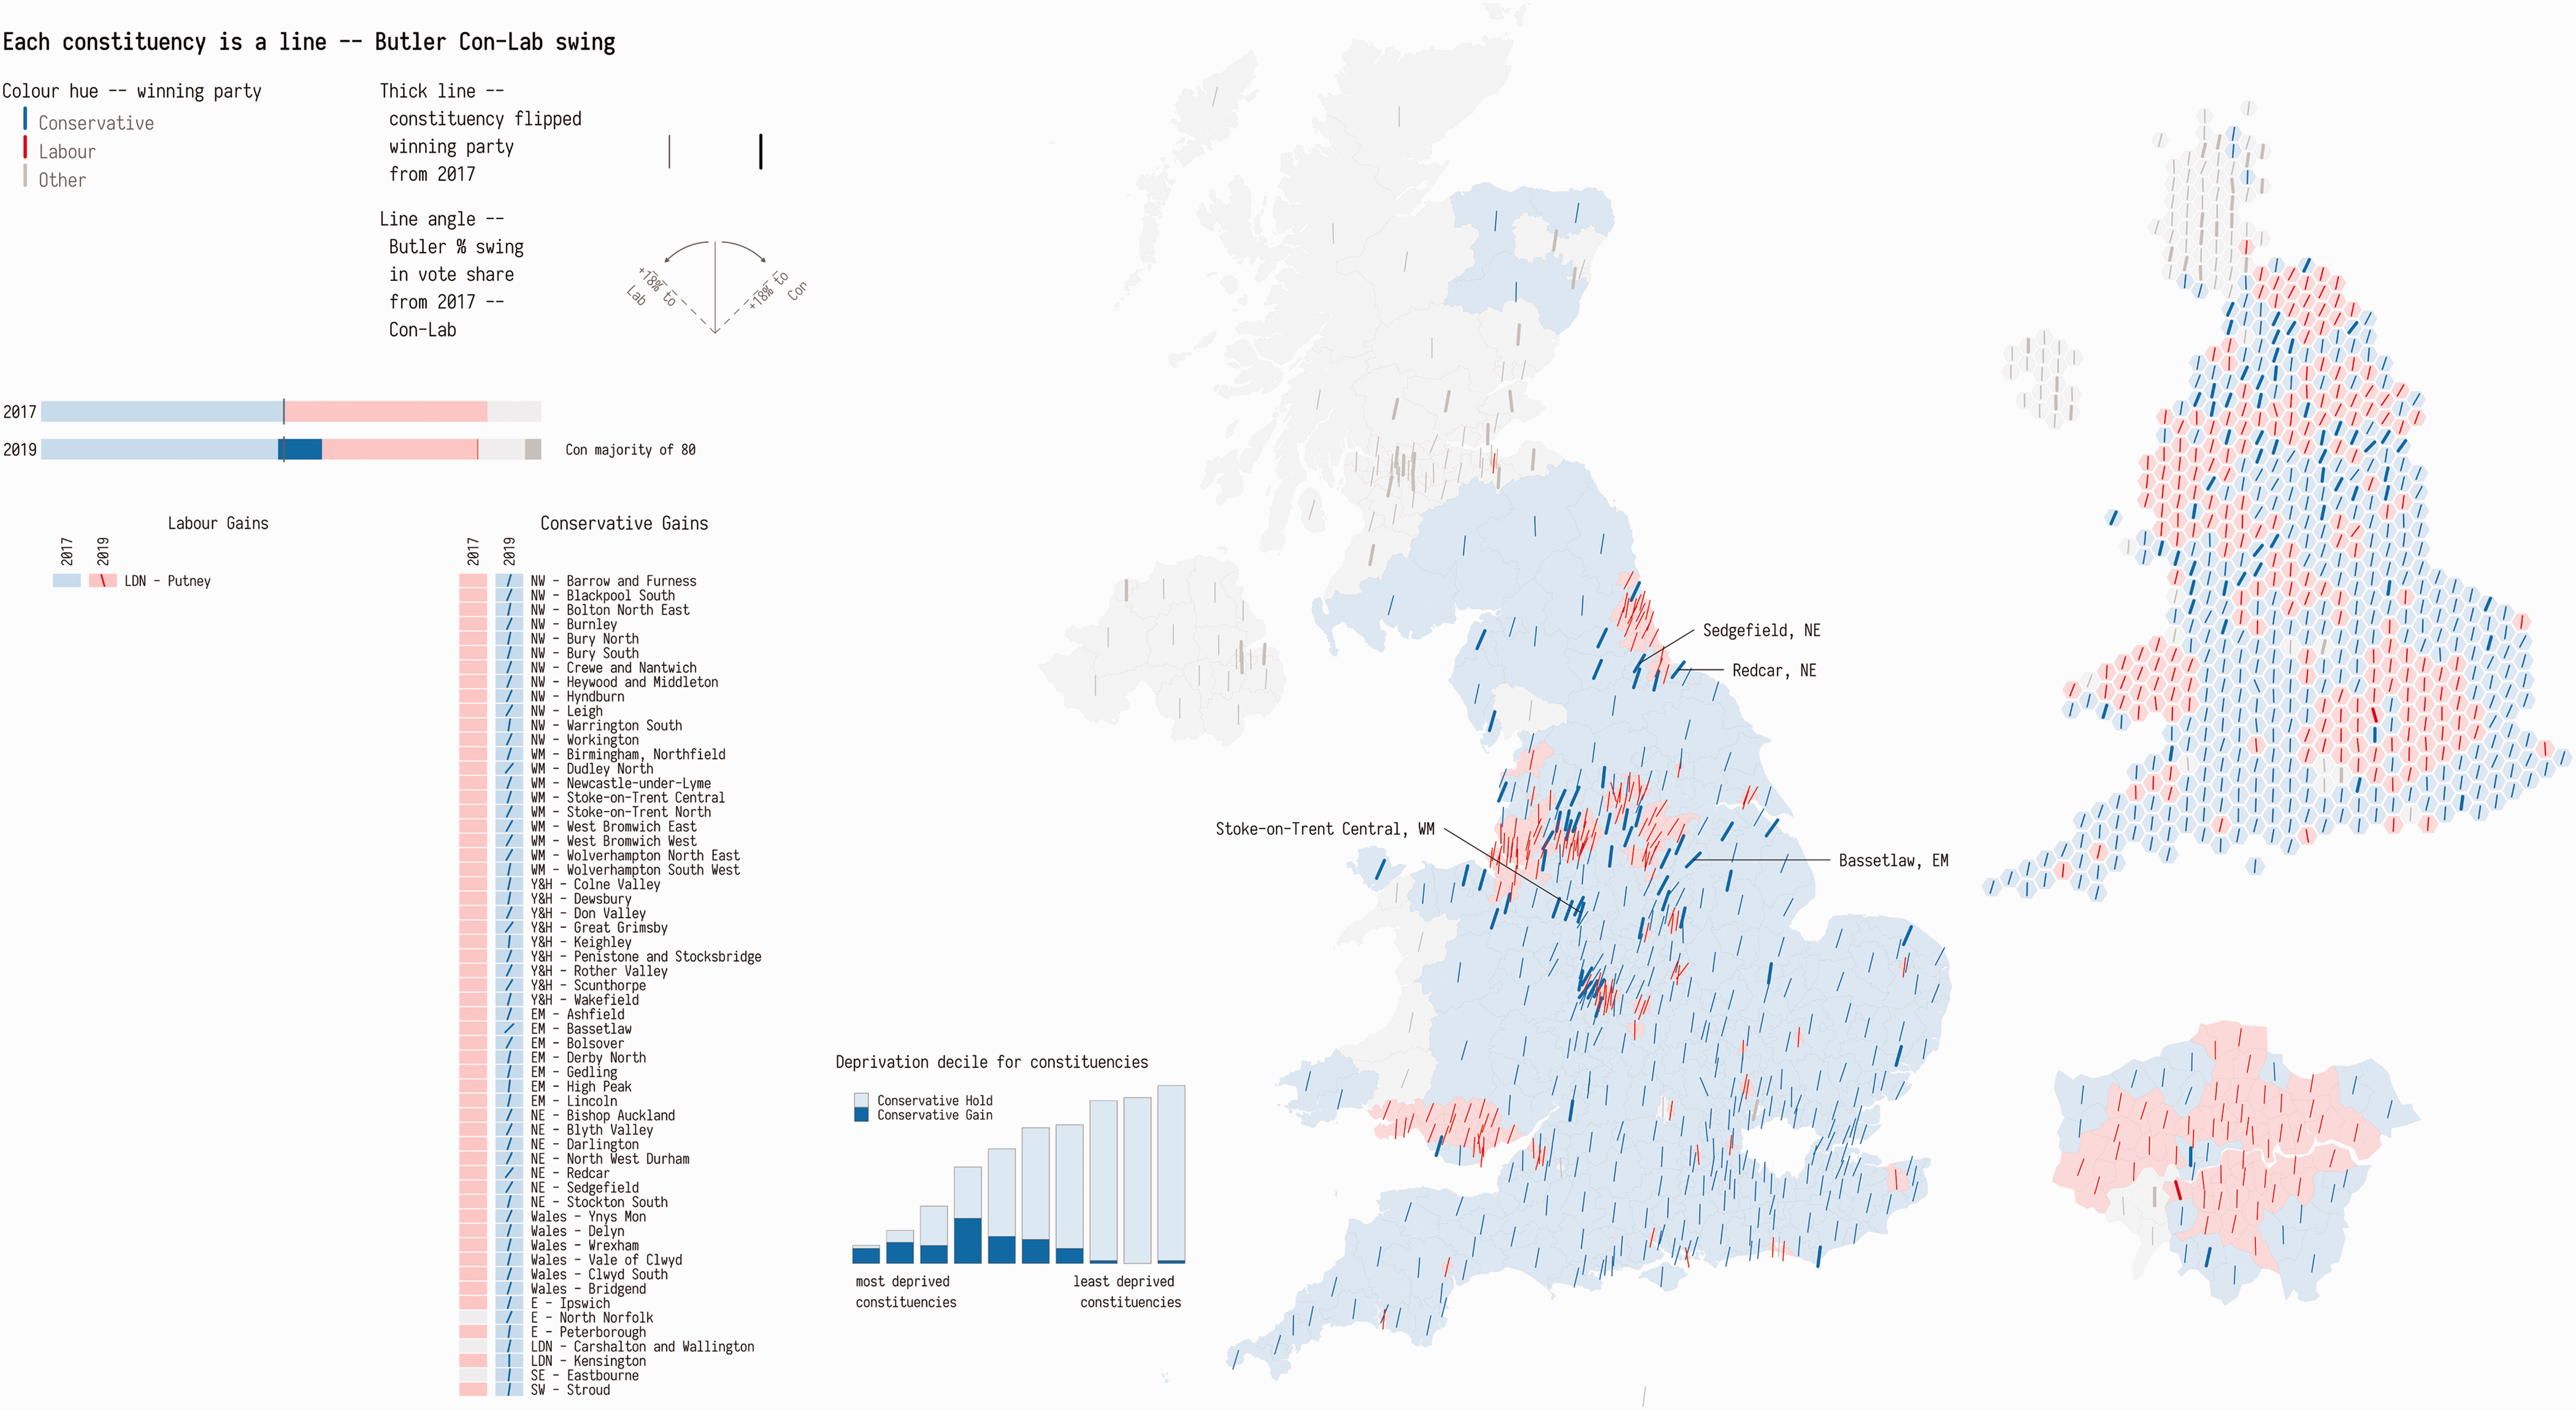
Map of the Butler two-party Conservative–Labour shift in the 2019 UK general election. 2019 data collated by Alex Denvir, 2017 data from the Electoral Commission, boundary data from the Office of National Statistics Open Geography Portal and hex cartogram from ESRI’s Ben Flanagan.
This encoding exposes the ‘realignment’ of Conservative constituencies: bold blue lines angled to the right in the Midlands, Yorkshire and Humber, North West, North East and north Wales; the reverse, a bold red line angled to the left, occurs only once for Putney, London. Annotated on the map is Bassetlaw, a former coal-mining constituency and previously Labour since 1929 which contains the largest swing to the Conservatives (of 18.4%). Also annotated is Redcar (15.4% swing to Conservative), previously Labour since its creation in 1974 with the exception of the Liberal Democrats in 2010; Sedgefield (12.7% swing to Conservative), Labour since 1935; and Stoke-on-Trent Central (6.9% swing to Conservative), which elected a Conservative candidate for the first time in 2019 after electing exclusively Labour candidates since its creation in 1950. Note the heavy spatial autocorrelation in Conservative swings for constituencies in the North East, Wales, Yorkshire and Humber and North West, even for constituencies that did not flip to the Conservatives: bold blue lines surrounded by red lines also oriented to the right. Also apparent is the fact that very few lines are oriented to the left. In only 34 constituencies is the Butler two-party swing for Labour, and the characteristics of these constituencies is also distinctive: 18 are located in London or the South East and six in Scotland. For those familiar with the socio-economic geography of the UK, the Conservative gains listed in the legend do not fit the typical caricature of a Conservative constituency. Inspired by Alasdair Rae’s work analysing constituency-level deprivation (Rae, 2019), and using the UK-wide deprivation data set published by Abel et al. (2016), estimates of deprivation are calculated for each constituency and constituencies assigned into deprivation deciles. The distribution of Conservative gain and Conservative hold constituencies (bottom-left bars of the map) further reinforces the point of a diversifying Conservative party base.
Footnotes
Declaration of conflicting interests
The author(s) declared no potential conflicts of interest with respect to the research, authorship and/or publication of this article.
Funding
The author(s) disclosed receipt of the following financial support for the research, authorship, and/or publication of this article: This work was supported by Wave 1 of the UKRI Strategic Priorities Fund under the EPSRC Grant EP/T001569/1, particularly the Urban Analytics theme within that grant and the Alan Turing Institute.