
Abstract
In our increasingly connected world, individuals produce continuous streams of data through their constant interactions with the Internet. This data is opening up opportunities to measure human behaviour that was previously time consuming or expensive to capture. Here, we explore whether data from online photographs can be used to estimate travel statistics on a global scale. We draw on the locations attached to 69 million publicly shared photographs to infer the global travel patterns of almost half a million users of the photo-sharing platform Flickr. We find that our photo-based estimates of tourist arrival statistics for the G7 countries Canada, France, Germany, Italy, Japan, the United Kingdom and the United States correlate with the corresponding official statistics released by those countries. Our results highlight the potential for vast volumes of online data to inform the generation of timely, low-cost indicators of the state of society. We discuss practical considerations that remain before this methodology could be used in the production of official statistics.
Introduction
With the rise of the Internet, many of our everyday activities now leave behind traces across a wide range of online platforms. Over the last decade, publicly available data on what Internet users search for on Google, pages they access on Wikipedia and content they share on Twitter have fuelled the rapidly developing interdisciplinary field of computational social science (Botta et al., 2015; Ginsberg et al., 2009; King, 2011; Lazer et al., 2009, 2014; Preis and Moat, 2014; Vespignani, 2009). These high-speed streams of data reflect the behaviour of humans, often at global scale, and sometimes at low cost. A number of previous studies have provided evidence that such online data can be used to measure human behaviour in the real world and, in some cases, even improve predictions of what people might do next (Moat et al., 2014).
The potential to use online data to understand the offline world has increasingly sparked the interest of not only commercial stakeholders, but also governmental stakeholders keen to exploit these new insights in decision making. For example, a recent review of economic statistics in the UK stated that better use of such novel forms of data “has the potential to transform the provision of economic statistics” and that the UK Office for National Statistics “will need to build up its capability to handle such data” (Bean, 2016).
Here, we draw on data on the location of 69 million publicly shared photographs to infer the travel patterns of almost half a million users of the photo-sharing platform Flickr. We explore whether rapidly available data on where photographs have been taken could be used to estimate global tourist arrival statistics.
Results
We build on an approach introduced by Barchiesi et al. (2015) for the UK and extend it to the G7 countries to evaluate its robustness. To test whether our Flickr-based approach generalises, it is advantageous that there are differences between the methods used in the seven G7 countries to generate official estimates of tourist arrivals. In the UK, such estimates are based on the International Passenger Survey, which collects information about passengers entering and leaving the UK. In contrast, in Italy and Germany, tourist accommodation establishments are required to report a visitor’s country of residence. In the US, official estimates of international visitors are based on arrival and departure records which form part of the I-94 arrivals programme. Data on Canadian and Mexican arrivals to the US are sourced from Statistics Canada and Banco de Mexico. In Japan, official estimates of tourist arrivals are based on statistics generated when individuals pass through immigration, as aggregated by the Japan Ministry of Justice. Statistics Canada incorporates data on arrivals by car, train, bus, boat and plane from a variety of sources, ranging from passenger declaration forms at larger airports to automated reading of vehicle licence plates for the majority of land ports of entry. However, inherent to all these methods is a publication delay, which ranges from months to years. An approach exploiting the almost instant availability of online data might therefore be able to provide more rapid estimates. Our analysis focuses on official statistics data for 2014, as corresponding tourist arrival data is available for all G7 countries for that year as detailed in the Data section.
Using Flickr’s public API which can be freely accessed at https://www.flickr.com/services/api/, we retrieve metadata for 69,217,761 photographs which were uploaded to Flickr between 1 January 2013 and 31 December 2014 and to which a location was attached by the user. While we aim to estimate official travel statistics from 2014, we also require Flickr data from the previous year to allow us to infer the Flickr users' countries of residence, as we explain in more detail below. The global distribution of photographs taken and uploaded to Flickr during 2014 is depicted in Figure 1.
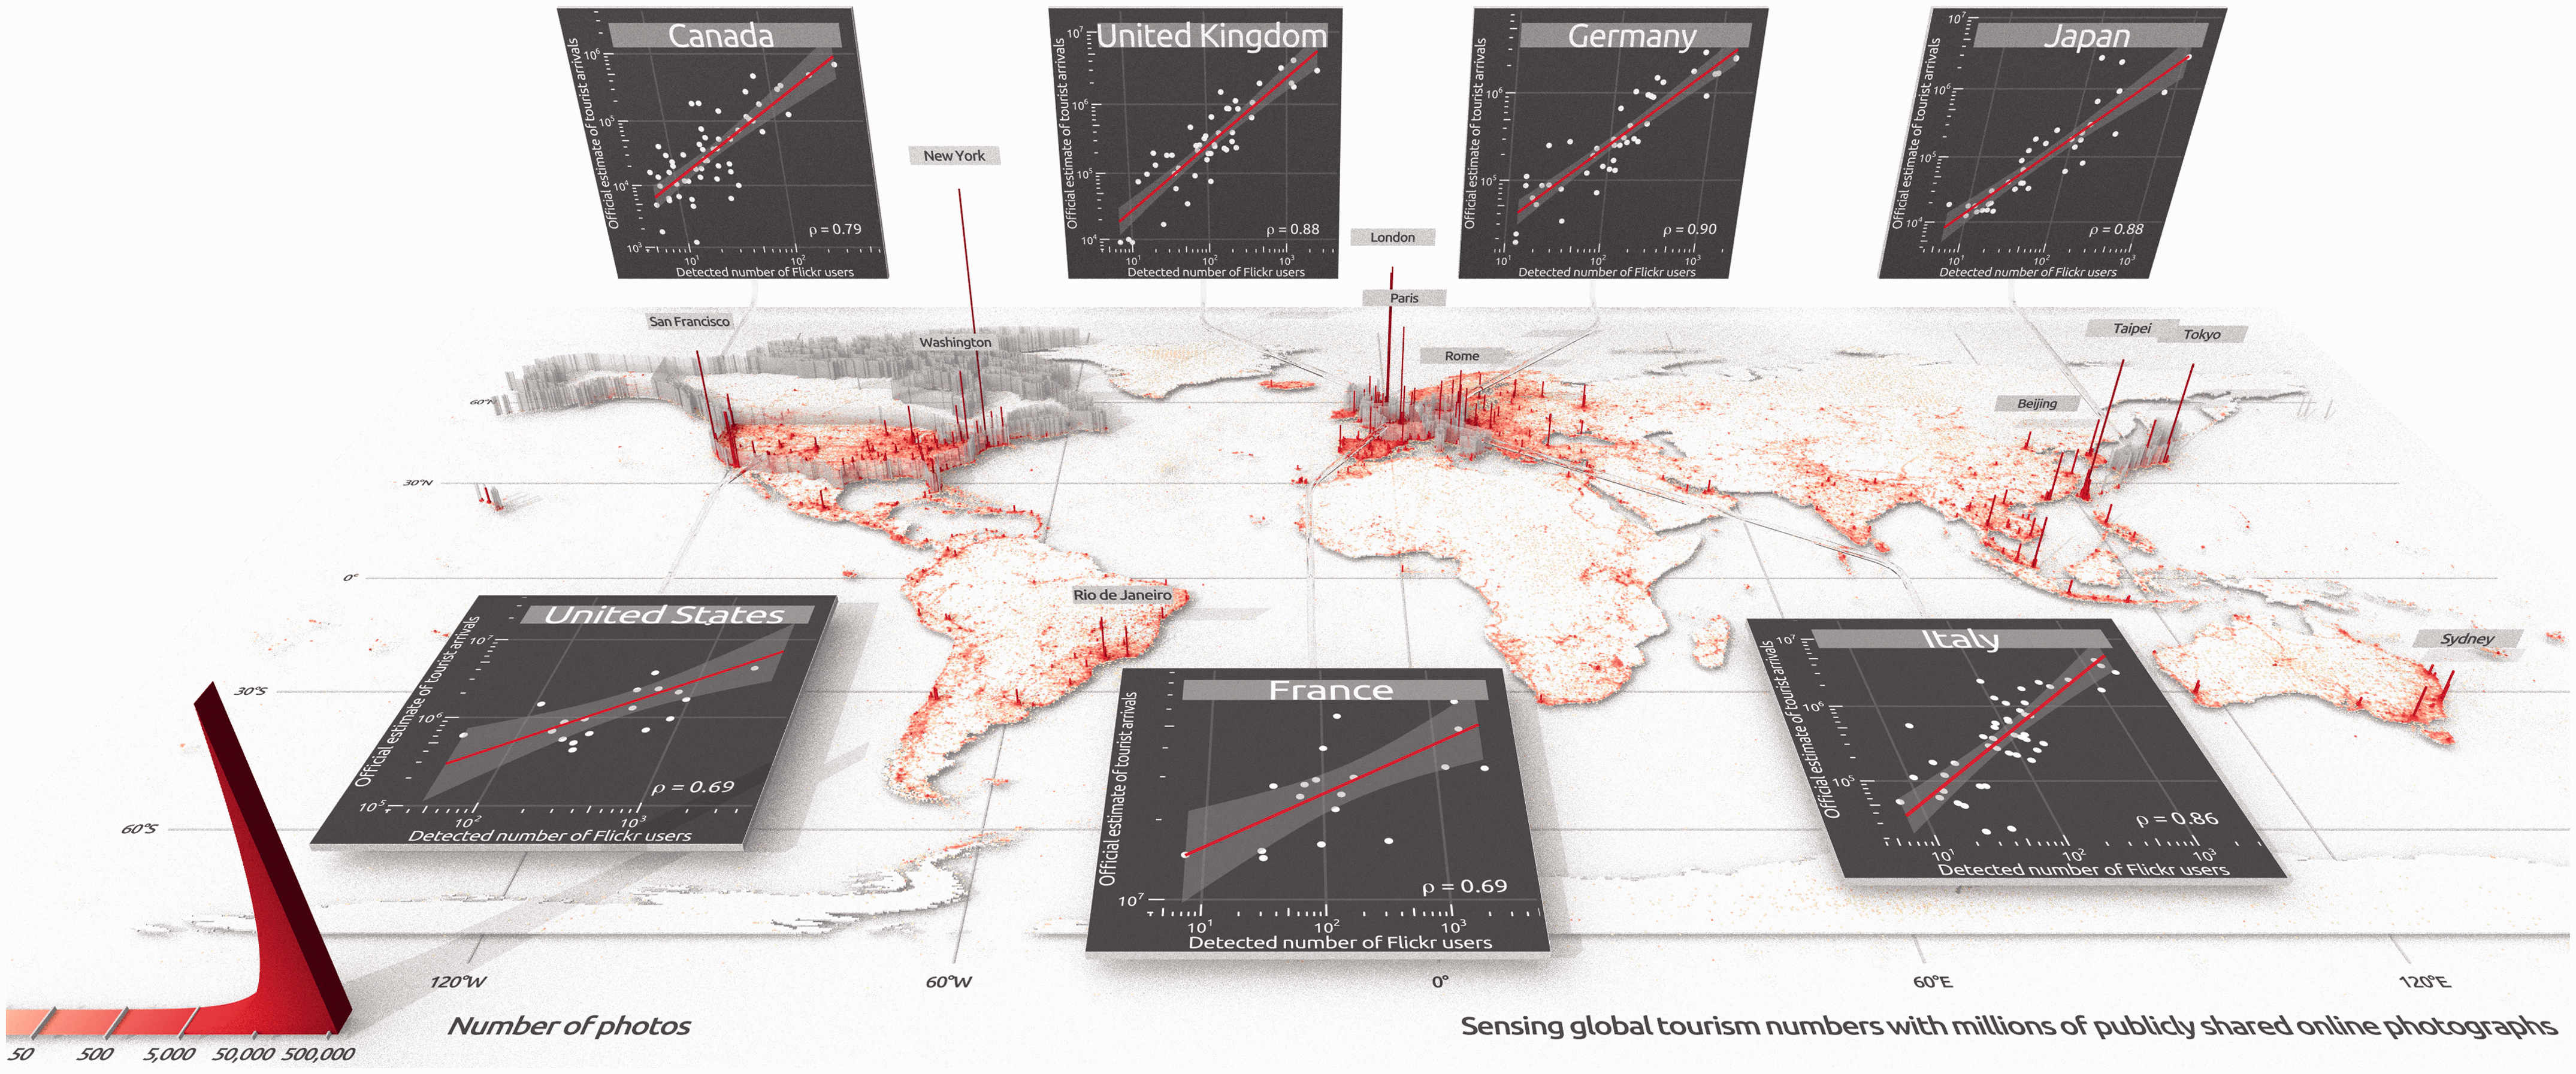
Map of the world, depicting the locations in which 35 million photographs were taken and uploaded to the photo-sharing platform Flickr in 2014. For each G7 country, we investigate whether the number of Flickr users we infer to have visited the G7 country from various other countries is correlated with official tourist arrival estimates. The inset plots depict the relationship between the Flickr-based estimates and the official tourist arrival statistics for each G7 country. Each data point represents a country of origin for which both a Flickr-based estimate of visitor numbers and an official estimate of tourist arrivals exist. The specific nature of the tourism statistics for each country is detailed further under Data.
We consider the sequence of photographs that each user has uploaded. Our analysis processes anonymous data on when and where these photographs were taken, but does not consider any further information that the user has made available, such as the photographs themselves or any further textual information uploaded by the user. From this data, we extract information relating to all users who take photographs within a given country of analysis, such as the UK. Photograph coordinates retrieved from Flickr are allocated to countries using boundary data from the Database of Global Administrative Areas (http://gadm.org/). We find 41,894 Flickr users who took photographs in the UK in 2014; 83,549 users in the US; 26,884 users in Italy; 24,420 users in France; 20,462 users in Germany; 13,338 users in Canada, and 8,866 users in Japan. In order to approximate the country of residence of each user in line with the UN definition of country of residence, we determine the country in which they have spent the majority of the previous 12 months. To do this, we consider the photographs uploaded to Flickr during this period.
We make the simplifying assumption that on days on which a user does not take a photograph, the user is still located in the country in which they took the previous Flickr photograph. For instance, if a user uploaded their first photo taken in the UK on 1 January 2014, we assume this user entered the UK in January 2014, and consider all photographs which that user took between 1 January 2013 and 31 December 2013. For each photograph, we determine the day on which the photo was taken and the location it was tagged with. We use this information to determine how many days the user has spent in different countries during these 12 months.
Days on which no photograph was taken are allocated to the country in which the previous photograph was taken. For example, if the user uploaded one photograph from Germany on 1 February 2013, and then did not upload any further photographs until 15 February 2013, we assume that the user was in Germany between 1 February 2013 and 14 February 2013. The country in which the user is considered to have spent time from 15 February 2013 onwards is determined depending on the photograph taken on 15 February 2013 and any photographs taken afterwards, using the same approach. Days on which a user takes photographs in multiple countries are allocated to each of the countries in question, proportional to the number of photographs taken in each country. For instance, if a given user uploads one photograph from France and one from Italy on a given day, we assume that the user spent half of the day in France and half of the day in Italy. The same proportional allocation is used for subsequent days without new photographs.
Following this approach, if a user is determined to have spent most days in the US in the preceding 12 months before taking a photo in the country for which we are generating the statistics (in our example here, the UK), we consider that user’s country of residence to be the US. We note that the official statistics show that for each of the countries considered, a minority of countries accounts for the majority of overall tourist arrivals. In other words, for each G7 country, the distribution of the number of tourists who arrive from each country of residence is skewed. For this reason, we calculate the logarithm of all official and Flickr-based tourist arrival estimates before analysing them further. As summarised in Table 1 and depicted in the insets of Figure 1 for each of the seven countries analysed, we find that our photo-based estimates of tourist arrivals to the G7 countries correlate with the corresponding official statistics released by the G7 members.
Pearson's correlation coefficient and Kendall's
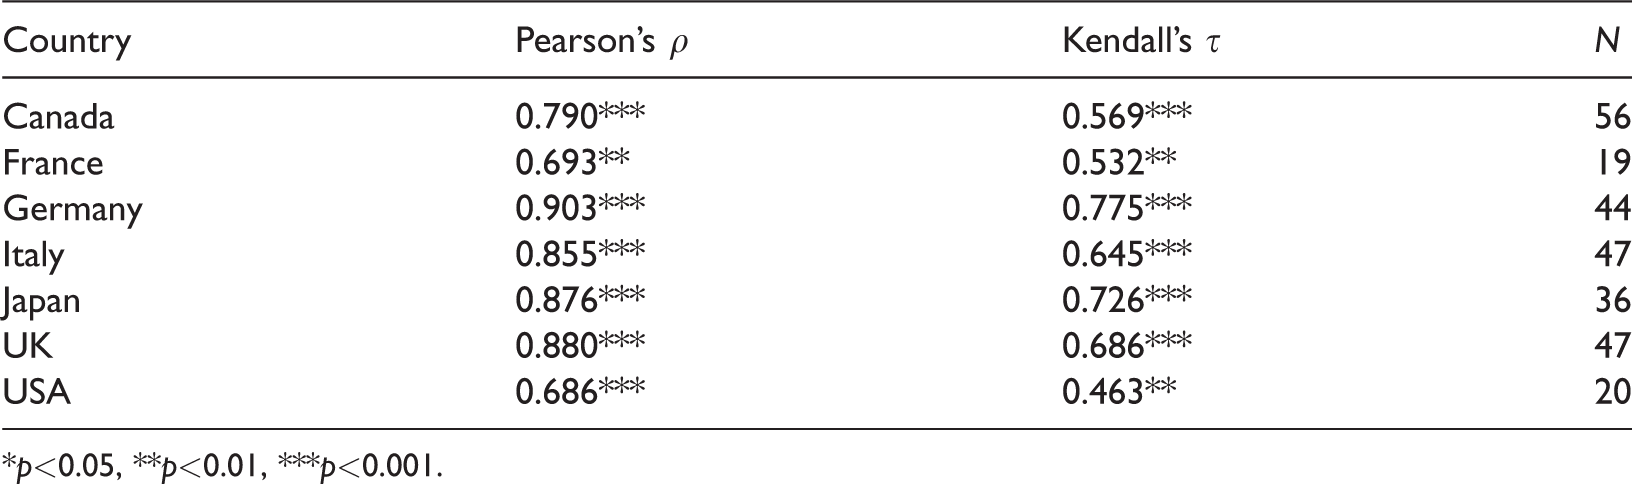
*p<0.05, **p<0.01, ***p<0.001.
Discussion
By drawing on the location of 69 million publicly shared photographs, we infer travel itineraries of almost half a million users of the photo-sharing platform Flickr. We find that our photo-based estimates of tourist arrivals in the G7 countries correlate with the official statistics released by Canada, France, Germany, Italy, Japan, the UK and the US.
Could this approach immediately be used in the generation of official statistics? Here, a number of practical considerations should be borne in mind. First, we underline that the analysis presented here demonstrates a correlation between a Flickr-based indicator of travel and official tourism statistics but does not yet constitute a full estimation framework. (For an example of a framework that generates estimates of other real-world quantities from online data, see Preis and Moat, 2014.) Further work would be required to move from this identification of a correlation to the production of robust tourism estimates. In such work, it would be important to evaluate not only the accuracy of the estimates produced, but the uncertainty associated with these estimates.
Second, it is clear that we make considerable simplifying assumptions to determine a user’s country of residence. It is very unlikely that all Flickr users enter a given country on the date on which they take the first photograph that they upload to Flickr from that country, or that all Flickr users upload a photograph on every occasion that they travel between countries. As such, the intermediate estimates we make of the time spent in each country by each user are almost certainly inaccurate. In addition, we know that not all global travellers will post photographs on Flickr, and it would seem wise to assume that the demographics of Flickr users who we determine to have been resident in a given country will be biased in comparison with the demographics of the country as a whole. The exact nature of this bias is unknown. The results of our analysis do however suggest that despite the likely inaccuracies in our intermediate estimates of time spent in a country and this probable bias in sample, Flickr-based indicators of tourist arrivals are correlated with official estimates of tourist arrivals across all G7 countries. Further analysis would be required to confirm that this relationship generalises to countries outside the sample of countries considered here.
Third, we note that a social media service such as Flickr may cease to exist in the future, or access to the service's data may be withdrawn with little advance notice. The relationship between the proportion of global travellers who post to Flickr may also change over time. Such threats of data withdrawal or a change in the sample captured would represent additional risks for an official body which had begun to rely upon estimates of this kind. To mitigate such risks, further work could investigate whether the approach described here could be extended to integrate other social media data sources. By drawing on multiple data sources in parallel, reliance on one single service would be diminished. In addition, the estimate of the relationship between social media posts and global travel statistics could be continuously recalibrated, for example by using the “adaptive nowcasting” approach described by Preis and Moat (2014). Adaptive nowcasting is a methodology to account for changes that occur over time in the relationship between online data and the real-world quantity of interest. This approach has successfully been applied to the challenge of using Google search data to generate quick estimates of the number of people currently suffering from influenza-like illness. In this scenario, the volume of searches for flu-related terms may be affected not only by the current number of flu sufferers, but also by external forces such as flu scares in the press. We highlight, however, that use of adaptive nowcasting would require that online data were used to generate quicker, complementary estimates of travel statistics, rather than replacing survey-based methodologies entirely.
With these points in mind, we emphasise that further work would be needed before this methodology could be used in the production of official statistics. However, as traditional approaches to producing official statistics are often time-consuming, costly and resource intensive, we suggest that our approach may provide a useful foundation for further investigations of whether complementary, quicker estimates can be produced from online data.
Data
Official tourist arrival data for all G7 countries in 2014 was accessed on 20 November 2017.
For Canada, data on the number of non-resident travellers entering Canada by country of residence excluding the US was obtained from Statistics Canada (https://www.statcan.gc.ca/). For France, data on tourist arrivals at borders (“Arrivées de touristes aux frontières”) was obtained from the Institut National de la Statistique et des études économiques (https://www.insee.fr/). For Germany, data on arrivals at accommodation (“Ankünfte in Beherbergungsbetrieben”) was obtained from the Statistisches Bundesamt (https://www.destatis.de/). For Italy, data on occupancy in collective accommodation establishments (“Movimento dei clienti negli esercizi ricettivi”) was obtained from the Istituto nazionale di statistica (http://www.istat.it/). For Japan, data on foreign visitors to Japan was obtained from the Japan National Tourism Organization (https://www.jnto.go.jp/). For the UK, we use data on the total number of visits by country of residence, which forms part of the International Passenger Survey conducted by the UK Office for National Statistics (https://www.ons.gov.uk/). For the US, data on non-resident arrivals to the US from the 20 countries with the highest tourist numbers was obtained from the National Travel & Tourism Office within the U.S. Department of Commerce (https://travel.trade.gov/).
Software
R, Python, LightWave 3D
Footnotes
Acknowledgements
We thank Louisa Nolan, Lanthao Benedikt, Emily Tew and Tom Smith of the Office for National Statistics Data Science Campus for comments. This study was considered and approved by the National Statistician’s Data Ethics Advisory Committee (NSDEC) in the UK.
Authors’ note
This publication is supported by multiple data sets, which are openly available at locations described in the ‘Results’ and ‘Data’ sections.
Declaration of conflicting interests
The author(s) declared no potential conflicts of interest with respect to the research, authorship, and/or publication of this article.
Funding
The authors disclosed receipt of the following financial support for the research, authorship, and/or publication of this article: TP, FB and HSM. were supported by the Government Office for Science; The Alan Turing Institute under the EPSRC grant EP/N510129/1 via Turing awards TU/B/000008 (TP) and TU/B/000006 (HSM); and the University of Warwick and the ESRC via grant ES/M500434/1.