



Abstract
This article offers initial validation of the Good Lives Assessment of Domains (GLAD). Data were collected from an electronic survey of 1,484 American adults. Participants were recruited via paid research panels using quotas set to match the U.S. population on Age, Race/Ethnicity, Sex/Gender, Education, and Household Income. Participants responded to a set of items including 48 original items to assess perceptions of life satisfaction in the 11 domains described in the GLM and the 5 Satisfaction with Life Scale (SWLS) items. Factor Analysis indicated 45 final items that loaded onto 9 unique factors, with all loadings ranging between 0.391 and 0.854 with acceptable model fit (RMR = 0.070, CFI = 0.866, RMSEA = 0.063). Cronbach’s Alphas demonstrated acceptable reliability, with items achieving alpha scores greater than .7 in all individual domains and for overall GLAD scores. The correlation between GLAD and SWLS scores was .610 (p < .001). An Independent samples T-test found a significant mean difference (t = 4.360, p < .001, mean difference = 8.15737) in GLAD scores between respondents who reported no engagement in crime and deviance and those who reported engagement in crime and deviance.
The Good Lives Model of Offender Rehabilitation (GLM) is a strengths-based intervention that seeks to teach people ways to attain primary human goods in prosocial ways (Ward, 2002b). Originally created for criminal offenders, the GLM focuses on developing and improving clients’ perceptions of their own satisfaction within 11 life domains that the GLM views as universal to human happiness. As clients work through the GLM with their clinicians, they complete a series of activities to help improve their satisfaction in the important life domains. These steps include identifying which domains they feel are important to them, exploring ways in which their behaviors have led to increases or decreases in their satisfaction with identified important domains, revealing obstacles to improved domain satisfaction, and developing plans to amplify their strengths and overcome obstacles to domain satisfaction (Yates et al., 2010; Yates & Prescott, 2011). According to the propositions of the GLM, clients can lead Good Lives when their attempts to gain and maintain domain satisfaction align with prosocial values and norms (Harris et al., 2019).
It is important for any intervention seeking to change specific and identifiable variables, such as domain satisfaction, to have direct and full measures of those variables. Without direct and full measures of those variables clinicians, clients, and researchers cannot be sure that a putative outcome is a result of the intervention (Mears, 2010). Presently, the only available measure of clients’ perceptions of GLM domain satisfaction is the Common Good Lives Questionnaire (CGLQ). The CGLQ asks clients to rate two items for each GLM domain. One item asks the clients to rate their perceived satisfaction in the domain. The other item asks the clients to rate the importance of that domain to their current life positioning. Given that only one of these items is a direct measure of clients’ perceptions of domain satisfaction and this item asks only a global perception of domain satisfaction, the CGLQ does not provide a direct and full measure of GLM domain satisfaction.
The present study sought to address the lack of direct and full measures of GLM domain satisfaction by validating the Good Lives Assessment of Domains (GLAD). Validation procedures included Confirmatory Factor Analysis to determine if individual GLAD items would load onto factors in a manner consistent with GLM domains, internal reliability testing of individual domain items within their respective GLM domains and of aggregated GLAD items, and convergent validity analysis between GLAD scores and Satisfaction with Life Scale scores (Diener et al., 1985).
Modeling Satisfaction With Life
Aristotle suggested that happiness was the ultimate aim of human existence. He viewed happiness as a primary condition—one that people seek for the sake of achieving happiness itself. He suggested that people achieve happiness by acquiring conditions of satisfaction in relevant life domains, or somewhat universal human needs that are important to all individuals (Aristotle, 1999). Arguably, scientific quantitative efforts to discern these life domains began with Campbell et al. (1976). Since that time, researchers have reported sets of life domains that are strikingly similar to each other, and to several of the original ideas posed by Aristotle. As can be seen in Table 1, these domain sets often include primary human needs like basic survival needs, connections to other people, means of productivity and work, leisure or recreation, and mental and physical health, among others.
Domains by Author.

While these domains are consistent across models, achieving happiness does not require achieving satisfaction in all domains at all times. Rather, the importance of the domains fluctuates across people and across their lifetimes. For instance, a 15-year-old Western student may give greater importance to their freedom in decision making while preparing to take the test for their driver’s license. That same student, 10 years later, may shift importance to building connections with others and achieving greater satisfaction with their work. Fifty years later, that student may shift focus to health as they work to lose excess weight gained over the early part of their retirement. Because they are universal—yet individualized—the consistency of these domains makes them a logical place to start when looking to improve satisfaction with life. One SWL model has garnered attention of practitioners and researchers from several countries around the world. It was originally built as an intervention with criminal offenders under the assumption that improving satisfaction with life would help decrease offending behaviors.
The Good Lives Model of Offender Rehabilitation
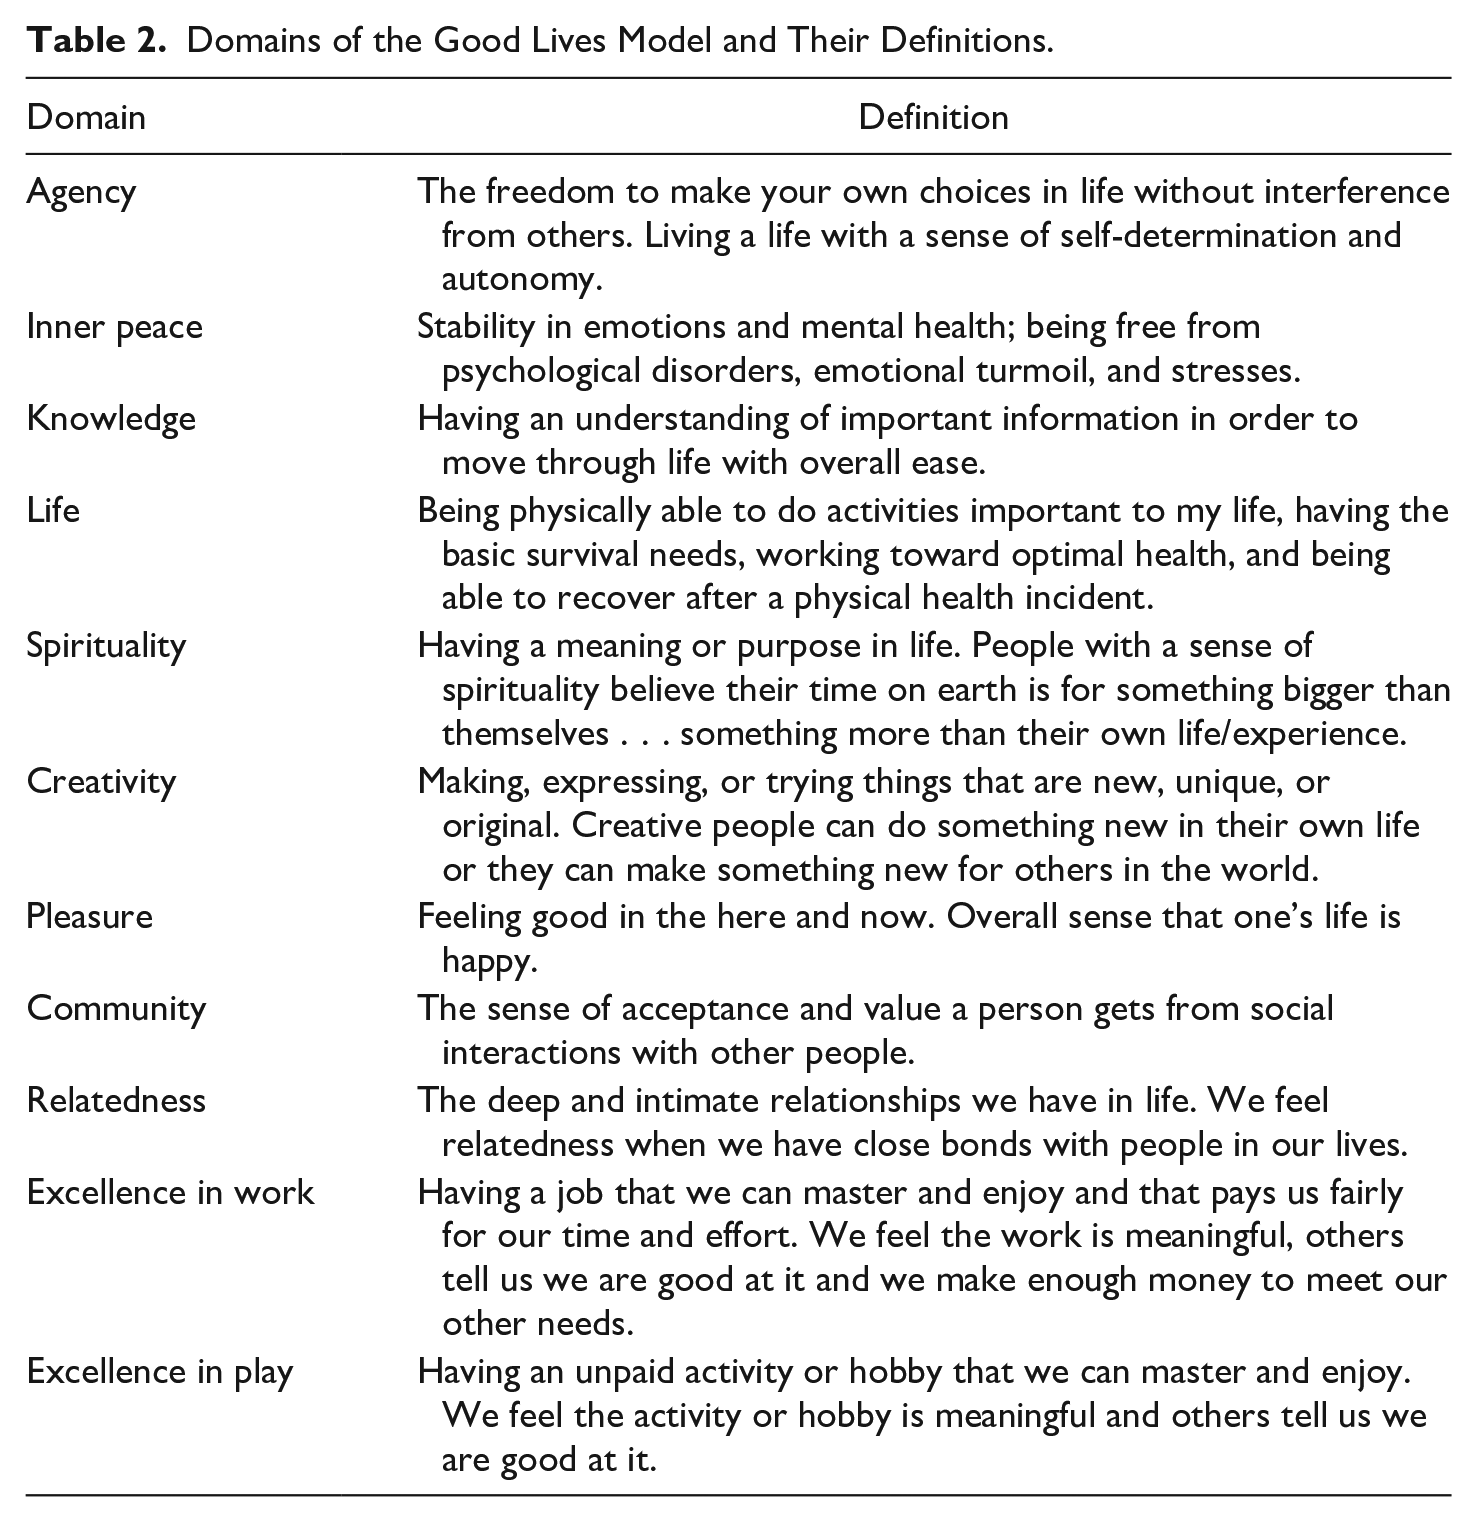
Introduced by Tony Ward (2002a, 2002b), The Good Lives Model of Offender Rehabilitation (hereafter The Good Lives Model or GLM) calls attention to 11 domains consistent with the greater research into SWL. Figure 1 offers a graphical representation of the GLM domains. Table 2 defines the GLM domains.

Domains of the Good Lives Model.
Domains of the Good Lives Model and Their Definitions.
To engage the Good Lives Model, practitioners undertake a multi-step process targeting SWL in the life domains. These steps include studying the GLM and using it to help people understand the domains that are most important to their lives. Practitioners then assess clients’ current perceptions of satisfaction in these domains and their strengths and improvement abilities in each important domain. Practitioners then work with clients to build a plan to achieve satisfaction in their important domains. During follow-up sessions, clients and practitioners work to assess progress and overcome obstacles to achieving SWL.
Conceptual validation and systemic review have supported the foundations and interventions of the GLM (Mallion et al., 2020; Willis et al., 2014). Details for applying the GLM in intervention are available for practitioners (Olson et al., 2016; Prescott, 2013; Yates et al., 2010; Yates & Prescott, 2011). And, the GLM has been supported in working with people from diverse populations and in diverse settings (Barendregt et al., 2018; Damme et al., 2016; Harris et al., 2019; Langlands et al., 2009; Siegert et al., 2007; Walgrave et al., 2021; Whitehead et al., 2007).
Despite this attention and effort, the GLM does not yet have a validated measure of achievement in its domains. The only existing measure of GLM domain satisfaction is the Common Good Lives Questionnaire (personal communication, G. Willis, July 25, 2015). The Common Good Lives Questionnaire (CGLQ) uses a Likert-type scale as it asks clients to globally rate both their perceived importance of, and their current satisfaction in, each domain. Because of its global rating on these two items, the CGLQ is inadequate for practitioners who desire greater depth in assessing areas to target in clients’ SWL work. For instance, a CGLQ rating of 1 in satisfaction for the Spirituality domain does not help indicate why satisfaction is low, nor does it help target ways to improve satisfaction in Spirituality. The simplicity of the CGLQ is also inadequate for researchers wishing to evaluate the outcomes of GLM interventions and/or compare interventions against each other.
The only other known attempt to create a measure of GLM domains failed to account for a majority of GLM domains. Harper et al. (2021) work on their Good Lives Questionnaire validated only five domains, three of which related directly to the original GLM domains. The three GLM domains accounted for were Inner Peace, Social Connectedness, and Spirituality. Thus, like the Common Good Lives Questionnaire, the Good Lives Questionnaire does not fill the void in GLM measurement. These inadequacies limit the ability of psychology and criminology to expand the use, and to evaluate the effectiveness, of the GLM.
The present study corrects these inadequacies by offering initial empirical validation of the Good Lives Assessment of Domains (GLAD). The GLAD is a self-report instrument designed to assess satisfaction in GLM domains. 1 Rather than single and global items, the GLAD asks people to consider their satisfaction on a set of three to six items for each GLM domain. As a planned part of a multi-hypothesis study, participants were asked to rate their satisfaction on 48 original GLAD items. Validation efforts for these GLAD items included factor analysis to determine whether the proposed GLAD items loaded onto 11 factors consistent with their intended placement within the GLM domains. Then, construct replicability analysis determined if the model could replicate across studies. Next, a series of inter-item reliability tests determined whether the remaining individual GLAD items were answered consistently with other items within each domain, and within all GLAD items. Then, construct validity testing determined if the items appeared to measure the latent variables of interest and whether GLAD scores related to scores on Diener et al.’s (1985) Satisfaction with Life Scale. Finally, predictive validity testing determined whether respondents who reported higher satisfaction in the combined GLM domains also reported lower engagement in crime and deviance.
Methods
Scale Development
Prior to the current study, the primary author led a different group of researchers in developing the GLAD. The process began with all researchers reading current literature on the Good Lives Model (GLM), including several publications and websites by GLM creators. Weekly research meetings insured that all researchers were familiar with the definitions and meanings of the GLM domains. Once researchers demonstrated appropriate knowledge of all domains, each researcher was assigned to a domain for item development. Once items for each domain were developed, all researchers met to discuss proposed items and agree on a set of initial GLAD items.
Those initial items were then piloted to a convenience sample of college students. Responses were subjected to a series of validation tests to determine whether they would be included in the GLAD version for full testing. Items from this pilot were kept if they met the criteria described below for exploratory Factor Analysis and Cronbach’s Alpha, and when all researchers agreed to their inclusion. Items retained from pilot testing were then subjected to the current validation study with a national quota sample of adults in the United States.
Participants and Sampling
The current validation study recruited U.S. adults based on quotas that matched five demographics of the U.S. population. The demographics and their quotas were Gender (Female 51%, Male 49%); Age (18–34, 30.5%; 35–54, 34.4%; 55+, 35.2%); Education (Some HS or less 10.9%, HS/GED 40.8%, Some college 10%, Associate degree 18.3%, Bachelor degree 10%, and Graduate degree 10%); Race (Non-Hispanic White 62.3%, Non-Hispanic Black 12.4%, Hispanic 17.3%, Asian 5.4%, and Other race 2.6%); and Household Income ($0–<$50k USD 40.3%, $50k–>$100k USD 32.5%, $100k+ USD 27.4%). Participants were excluded if they reported Age below 18 or above 89. Participants were also excluded if they matched a previously filled quota, if they chose not to complete the survey, or if they did not correctly answer two Attention Check items embedded within the survey. These items were included to help ensure that participants were not speed checking response items.
Participants were recruited via a convenience strategy by Qualtrics Research Services. Using a national panel network, Qualtrics and its affiliates contacted people who had expressed interest in participating in research studies on the internet. Contacts occurred via electronic means such as email, website interactions, customer loyalty panels, etc. While at a location of their choosing, interested participants clicked a link to navigate to an informed consent statement for the electronic survey. Clicking a radio button on the informed consent page opened the survey. Participants who completed the survey on the Qualtrics platform were compensated between $2.10 and $3.50 USD. Participation was anonymous with no personally identifying information collected.
The analysis plan for validation of the GLAD items included using Confirmatory Factor Analysis to test model fit. The original GLAD consisted of 48 items that were hypothesized to fit onto the 11 domains of the Good Live Model, with three to six items loading to each domain. Using Koran’s (2020) estimates of sample size for these procedures at conservative estimates of 12 factors with 6 indicators for each factor, a minimum sample of 350 was required for the present study.
Data was collected between September and November 2021. Recruitment continued until all quotas were reasonably reached, with all demographic categories opened for approximately the last 75 participants. 2,244 participants started the survey, and 1,508 participants (67.1%) successfully completed their responses. The study protocol was reviewed and classified Exempt by the Institutional Review Board at the researchers’ academic institution.
Measures and Instrumentation
Good Lives Assessment of Domains (GLAD)
The present study sought to validate the Good Lives Assessment of Domains (GLAD). The GLAD is a self-report instrument designed to assess respondents’ perceived satisfaction in the 11 domains of the Good Lives Model. There were 48 items in the original GLAD design. The domains and their number of items were Agency (5), Inner Peace (4); Knowledge (5); Life (5); Spirituality (3); Creativity (3); Pleasure (5); Community (4); Relatedness (4); Excellence in Work (6); and Excellence in Play (4).
Each GLAD item was answered on a 5-point Likert-type scale. GLAD response choices were 1 = Disagree; 2 = Somewhat Disagree; 3 = Neither Agree nor Disagree; 4 = Somewhat Agree; and 5 = Agree. Responses to each original item are added together and result in domain scores whose ranges vary with the number of items, and an overall GLAD score that ranged from 48 to 240. Higher scores reflect higher satisfaction. The final 45 GLAD items, arranged in their GLM domains, are presented in Supplemental Appendix 1.
Satisfaction with Life Scale
The Satisfaction with Life Scale, or SWLS, (Diener et al., 1985) is a public domain, self-reported instrument designed to assess respondents’ global satisfaction with life (e.g., “In most ways, my life is close to my ideal”; “I am completely satisfied with my life”). There are five items on the SWLS, all of which are answered on a 7-point Likert-type scale. SWLS response choices are 1 = Strongly Disagree; 2 = Disagree; 3 = Slightly Disagree; 4 = Neither Agree nor Disagree; 5 = Slightly Agree; 6 = Agree; 7 = Strongly Agree. Responses to all items are added together and results in an SWLS score ranging from 5 to 35. Higher scores reflect higher satisfaction with life.
Previous studies have found the SWLS to be reliable and valid, both in and out of the U.S. (Aishvarya et al., 2014; Pavot & Diener, 2008; Zanon et al., 2014) Means of SWLS scores generally fall between 23.0 and 25.2 with standard deviations between 2.8 and 6.4. The five items were found to load onto one factor, with item loadings between 0.588 and 0.911 (Diener et al., 1985; Pavot & Diener, 2008; Slocum-Gori et al., 2009). Internal reliability as assessed in a sample of college students revealed a Cronbach Alpha of .816 (Olson et al., 2020).
Strain Scale
Broidy’s (2001) Strain scale measured respondents’ emotional reactions when they are “unable to reach (their) goals” and “bad things happen to (them).” The scale consisted of 14-items related to respondents’ reactions to blocked goals and unwanted events (e.g., When bad things happen to me, I feel. . .Angry). Each item was rated on a scale of 1 = Never, 2 = Rarely, 3 = Sometimes, 4 = Always. Several individual items were chosen from this scale for construct validation.
Positive and Negative Affect Schedule
The Positive and Negative Affect Schedule (Watson et al., 1988) measured respondents’ ratings for positive and negative affect (e.g., Indicate the way you have felt . . . Interested) over the last 30 days. Each item was rated on a scale of 1 = Very slightly or not at all, 2 = A little, 3 = Moderately, 4 = Quite a bit, 5 = Extremely. Several individual items were chosen from this scale for construct validation.
Crime and Deviance Items
Respondents also self-reported experience with criminal justice processes and engagement in crime and deviance. There were two items for victimization experiences and four items for criminal justice processing experiences (e.g., arrest, probation/parole). Finally, there were 16 items, adapted from the Self-Report Delinquency, General Delinquency Scale (Huizinga & Elliott, 1986), to measure engagement in crime and deviance (e.g., In the last 12 months, how many times have you . . . stolen [or tried to steal] something?).” As described below, we employed the crime and deviance items for validation.
Other Measures Collected
Demographic characteristics collected included Age, Race, Gender, Marital Status, Last Year of Education Completed, Type of Area of Residence (e.g., small-city, rural area), Number of Adults in Household, Number of Children in Household, Employment Status, and Household Income. Descriptive statistics for demographics are reported below but are not analyzed as part of this study.
Data Diagnostics
Planned data diagnostics included several steps to ensure data quality of the present study. First, prior to release of data to the researchers, Qualtrics would scrub the data to ensure that numerical answers were provided where numerical information was requested (e.g., the number 3 was given rather than spelling three). Next, researchers would search for and remove any responses where SWLS or GLAD scores were outside of the possible ranges of 5 to 35 and 48 to 240, respectively, or where cases were missing this data. Normality of data would be confirmed visually using SPSS histogram plots and by interpretation of skewness and kurtosis. Given a sample size greater than 300, normality of both the SWLS and GLAD scores would be assumed if skewness was at or below 2 and if kurtosis was at or below 7, in absolute value (Kim, 2013).
Analysis Plan
The analysis plan was developed using recommendations for scale evaluation from Boateng et al. (2018) as they relate to initial validation of the GLAD with a single sample. Related to their Recommendation 7.1, Factor Analysis will analyze whether the GLAD items load onto factors in a way that is consistent with the 11 domains of the Good Lives Model. The present study will use Confirmatory Factor Analysis as is recommended when constructs are comprised of multiple, linearly related items with a priori fit to the proposed scale (Levine, 2005). DiStefano and Hess’ (2005) suggested that loadings of 0.55 represent a good fit and loadings of 0.45 represent a fair fit for items onto factors. Model fit is generally deemed acceptable with a Comparative Fit Index, or CFI, >0.9 (Bentler & Bonnett, 1980); while Model Fit via Root Mean Square Error of Approximation, or RMSEA, of <0.05 is viewed as close fit and <0.08 as reasonable fit (Browne & Cudek, 1993).
Based on Recommendation 7.4, GLAD scores will be calculated using raw and unweighted data. Then, both individual domain and overall GLAD scores will be subjected to reliability testing using Cronbach’s Alpha (Recommendation 8.1). Consistent with other researchers (Taber, 2018), an alpha of .7 or higher will be considered demonstration of acceptable reliability.
To test construct validity (Recommendation 9.2), the overall GLAD scores will be subjected to correlation tests with the Satisfaction with Life Scale (Diener et al., 1985). A minimum Pearson r between +.5 and +.69 will be considered a moderate association between the GLAD and SWLS, while a score ≥+.7 will be considered a strong association (Akoglu, 2018; Schober et al., 2018). Because both the GLAD and SWLS are designed such that higher scores reflect greater perceived satisfaction with life, a negative Pearson r will be considered failed concurrent validity against the SWLS. Once the GLAD is correlated against the SWLS, separate correlations will be run between the individual domains and selected individual items in the PANAS and Strain Scale. Items will be selected based on how they theoretically correspond to the domains. Selection will include items with both positive and negative theoretical relationships.
Finally, an independent samples t-test will determine if there is a difference in mean GLAD scores between respondents who reported engagement in crime and deviance and those who did not. Positive psychology models like the GLM operate on the hypothesis that higher satisfaction with life can bring about lower engagement in crime and deviance. Thus, the hypothesis of the concurrent validity test will be that those who do not engage in crime and deviance will have higher perceptions of satisfaction with life as indicated by their GLAD scores.
All tests will be conducted using IBM SPSS 28 and Amos 28. The analysis plan was not preregistered.
Transparency and Openness
All data and methods appearing in this study are original to the authors; where instruments of others are incorporated proper citations are given in the manuscript. Raw data are available by making a request to the first author. SPSS syntax for reproducing the analyses is available by making a request to the first author. Research materials are available in the public domain and/or by making a request to the first author. Sample size calculations, data exclusions, manipulations, and all study measures are all reported herein. The study was not preregistered. The analysis plan was not preregistered.
Results
Descriptive Statistics
Sample Characteristics
A total of 2,246 people began the electronic survey between September and November 2021. Of these, 57 (2.5%) were removed during data scrubbing because their item responses were inconsistent with the requested type of response. Six hundred eighty-one people either failed attention checks or did not complete the survey (30.3%). A total of 24 respondents had missing SWLS (n = 2) and/or GLAD (n = 22) data and were removed from the final GLAD analyses. Thus, 1,484 (66.1% completion rate) respondents are included in the final analyses here. Table 3 offers descriptive statistics for the sample and their targeted quotas. Quotas were determined based on the estimated representation of each demographic in the 2020 U.S. general population.
Demographic Descriptive Statistics.

Note. SD = standard deviation.
GLAD and SWLS Characteristics
Descriptive statistics for the SWLS, the original 48 GLAD items, and the final 45 GLAD items are presented in Table 4. Visual histogram analysis and review of the skewness and kurtosis revealed normal distributions for all measures.
GLAD and SWLS Descriptive Statistics.

Note. a = mixed modes.
Validation of the GLAD
Exploratory Factor Analysis
Principal Components analysis on the initial 48 GLAD items revealed nine factors with Eigenvalues above 1.0. These nine factors accounted for 64.932% of the variance in GLAD scores. Table 5 shows the results of the Principal Components analysis for these nine factors.
Principal Components Analysis—Unrotated.

Note. Extraction method: Principal component analysis.
With parameters set to nine factors, principal axis extraction with varimax rotations indicated removal of three items (Knowledge 4, Pleasure 3, and Pleasure 4) as they did not load with other items from their respective domains. Kaiser-Meyer-Olkin sampling adequacy (0.954) and Bartlett’s test of sphericity (χ2 = 43467.987, p < .001) indicated the data were suitable for factor analysis. Table 6 shows factor loadings for the 45 GLAD items rotated after removal of the three items noted above.
Factor Loadings—Principal Axis Factoring (100 Iterations)—Varimax Rotation.

Note. Extraction method: Principal axis factoring. Rotation method: Varimax.
Rotation converged in 100 iterations.
Factor loadings also found that the items for Inner Peace combined with those for Pleasure and that the items for Community combined with those for Relatedness. All remaining items clustered with other items in their a priori domains. 2 Seven items, including all items for Pleasure, loaded onto their respective factors less than 0.5. In addition to the three items noted above, these seven items were removed from a conservative model of the GLAD.
Confirmatory Factor Analysis of the GLAD
Confirmatory factor analysis performed on two models emerging from exploratory factor analysis produced similar results in Amos. The full model consisted of the 45 items remaining after removal of the three items that failed to cluster with their domains (Knowledge 4, Pleasure 3, and Pleasure 4). Both models allowed latent factors to covary. Figure 2 shows the path of the full model.
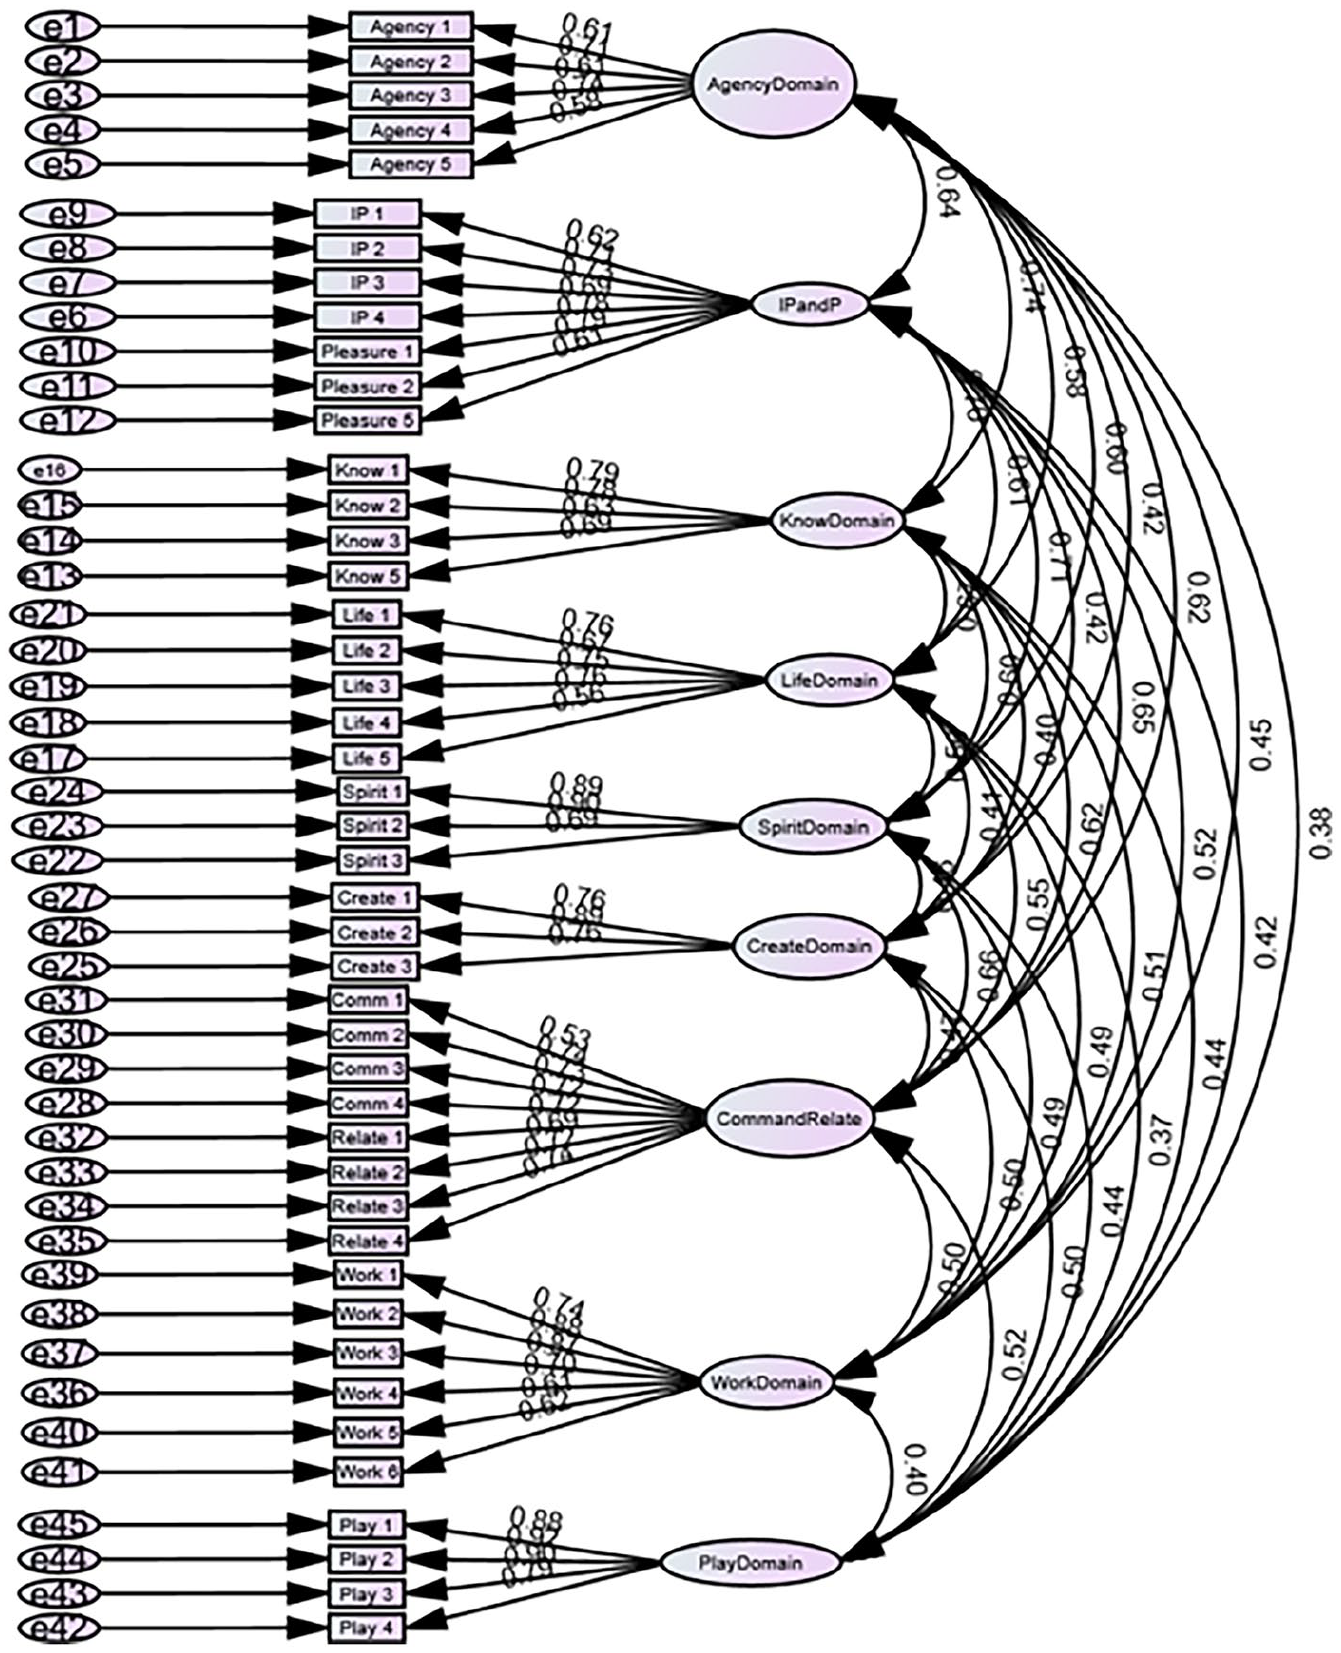
Confirmatory factor model for full GLAD model.
The conservative model consisted of the 38 items that loaded 0.5 or greater. Figure 3 shows the path of the conservative model.

Confirmatory factor model for conservative GLAD model.
Both models demonstrated acceptable data, considering the large sample size. In the full model, χ2 = 6201.990, p = .000 with a comparative fit index (CFI) = 0.866, a root mean square residual (RMR) = 0.070 and a Root Mean Square Error of Approximation (RMSEA) = 0.063. In the conservative model, χ2 = 4124.796, p = .000 with a CFI = 0.895, RMR = 0.062, and RMSEA = 0.061.
In an effort to disconfirm the subdomain structure of the GLAD, a unidimensional model consisting of all 45 items of the full model was run. The data fit the unidimensional model poorly (χ2 = 18745.743, p = .000; CFI = 0.551; RMR = 0.108; RMSEA = 0.113). Because of the similar fits between the full and conservative models, results from the full model of 45 items 3 are reported hereafter.
Construct Replicability of the GLAD
To assess the replicability of the GLAD constructs, H values were analyzed. According to its developers (Hancock & Mueller, 2000), H values 0.7 or above indicate a well-defined and stable latent variable. Some more recent authors suggest H values should be greater than 0.8 (Rodriquez et al., 2016) while others note that measures such as H sometimes have an acceptable lower bound of 0.5 (Schmitt et al., 2018). As shown in Table 7, six of the GLAD domains met the criteria for 0.7 or higher, four met the bounds of 0.8 or higher, and all domains met the lower bound of 0.5 or higher.
H Values of GLAD Domains.

Reliability Testing of the GLAD
Internal consistency of the GLAD domains was assessed via Cronbach’s alpha. As shown in Table 8, all domains achieved alphas above .7, demonstrating acceptable internal consistency.
Cronbach’s Alphas of GLAD Domains.

Inter-item correlations for the GLAD domains revealed moderate and significant (p < .001) correlations between all domains, with the exceptions of Creativity and Play which demonstrated weaker, but still significant (p < .001), correlations with the other domains. Table 9 shows the inter-item correlation matrix between all domains.
Inter-Item Correlation Matrix.

Note. All correlations significant, p < .001.
Construct Validity of the GLAD
Correlation to Satisfaction With Life Scale
Before construct validity testing, the Satisfaction with Life Scale (SWLS) items were analyzed for validity and reliability. In Confirmatory Factor Analysis, the five SWLS items loaded onto one factor with an Eigenvalue greater than 1 (Eigenvalue = 3.579). This factor explained 71.580% of variance. All Communalities were greater than 0.5. A clear elbow was evident at Factor 2 in the SWLS Scree Plot. The five items of the SWLS achieved a Cronbach’s Alpha score of .896.
Using raw scores for both the GLAD and SWLS revealed a significant Pearson Correlation of .610 (p < .01). This r demonstrates moderate, positive association between the SWLS and the GLAD. Thus, the GLAD demonstrates acceptable concurrent validity for overall satisfaction with life. It is noted that while concurrence between the SWLS and the GLAD denotes some agreement between the SWLS and GLAD on overall perceptions of satisfaction with life, it does not necessarily indicate a validation of the GLAD subscales.
Concurrent Validity of Domains
In an effort to validate the latent variables of the domains, correlations were run against a set of items chosen from the PANAS and Strain instruments. For each domain, PANAS and Strain items that best reflected the underlying construct of the domain were selected. For example, the construct underlying Inner Peace and Pleasure is an ability to enjoy one’s day without interference from obstructive emotions. Thus, PANAS items of “Nervous” and “Enthusiastic” were chosen, along with Strain items for “Depressed” and “Stressed.” Here, it was hypothesized that “Nervous,” “Stressed,” “Depressed” would have negative correlations with Inner Peace and Pleasure, while “Enthusiastic” would have a positive correlation. As shown in Table 10, all of the chosen PANAS and Strain items had significant correlations in directions expected of higher satisfaction within each domain. These results lend credence to the constructs within each GLAD domain.
Domain Correlations With Selected PANAS and Strain Items.

p < .01 *** p < .001
Criterion-Related Validity of the GLAD
The predictive ability of the GLAD was assessed via an Independent Samples T-test where mean GLAD scores were compared between those who self-reported engagement in crime and deviance and those who did not report such engagement. It was hypothesized that respondents who did not report engaging in crime and deviance would have significantly higher GLAD scores. The hypothesis was supported (t = 4.360, p < .001) with the mean difference (8.15737) representing 19.16% of the range in GLAD scores.
Discussion
The Good Lives Model Offender Rehabilitation (GLM) is a positive psychology-based intervention that is seeing increased, global use with people who offend, and with people who are at risk of offending. Its foundational theory is that improving the circumstances within domains important to individuals can improve their satisfaction with life, and subsequently decrease their chances of engaging in crime and deviance. However, the GLM does not yet have an empirically sound instrument to assess clients’ perceptions of satisfaction in important domains. This study sought to fill that void by undertaking an initial validation of the Good Lives Assessment of Domains (GLAD). Data for analyses came from 1,484 responses to a national survey of American adults, with quotas set to approximate the population on five demographics. Tests of constructs and internal consistency, as well as a correlation to a global measure of life satisfaction, found that the GLAD is a reliable and valid measure of life satisfaction for 9 factors, and where these 9 factors cover all 11 domains of the GLM. As such, the GLAD can be useful to several ends.
Clinical and Research Uses of the GLAD
Because the 45 items of the GLAD are built from a model of satisfaction with life (SWL) that is already in clinical use in various parts of the world, the GLAD allows immediately for deeper investigations into respondents’ perceptions of domain satisfaction than does the sole existing measure of GLM global domain satisfaction. The Common Good Lives Questionnaire (CGLQ) only assesses whether a respondent feels the domain is important and how satisfied the respondent is with any domain overall. Probing further into domain satisfaction will allow clinicians and clients to better assess domain satisfaction, target areas for improvements, and evaluate progress. For instance, instead of knowing simply that a client is dissatisfied with Inner Peace from the CGLQ, the GLAD responses might reveal both that the client is dissatisfied in Inner Peace and Pleasure and that the dissatisfaction arises primarily from overwhelming emotions (GLAD item IP2) and disturbed thoughts (GLAD item IP3). Work can then begin to identify the source of overwhelming emotions and disturbing thoughts, and on overcoming their impact to domain satisfaction. Returning to the GLAD several months into treatment can help determine if the client’s satisfaction with Inner Peace and Pleasure is resolving. Because the Good Lives Model is being used with both people who offend and people who don’t offend, more empirically sound clinical work can now be carried out forthwith by practitioners serving clients across multiple fields, including but not limited to psychology, criminal justice, community mental health, and school counseling.
Improved clinical work with people is not the only benefit of the GLAD. SWL has been associated with resilience (Fredrickson, 2001; Tugade & Fredrickson, 2004), prevention from bullying (Estevez et al., 2009), desistance from substance use (Laudet et al., 2009), and disengagement from crime (MacDonald et al., 2005; Olson et al., 2020). It is feasible that universal education and targeted interventions focused in SWL could help prevent deviance in general and help change the behavioral course for people who have begun to experiment in deviance. For example, elementary, secondary, and higher education institutions could augment or replace current programs to drive a focus on SWL. Rather than primarily addressing the physical and mental harms of bullying or using illicit substances, universal and targeted prevention programs could teach a model of SWL like the GLM and focus on the benefits of achieving SWL through a sense of Community and Inner Peace. Subsequent discussion can then work to build plans to achieve satisfaction in the domains important to participants and address how behaviors like bullying or substance use can reduce satisfaction in those domains. Here again, the GLAD can help with targeting important domains and offering a way for participants to visualize improvements to their satisfaction in those domains.
The GLAD can also improve various research efforts in SWL. Having a quantitative measure for satisfaction in the GLM domains allows for program evaluation and comparison. Using participant data collectively, evaluators can work to determine if SWL improvements are likely the result of participation in any one or more of the GLM implementations. The GLAD will also allow for comparison of program effectiveness across different types of implementations (e.g., community or institutional), populations (e.g., youths vs. adults; mental health or criminal justice), geographies (e.g., U.S. vs. Australia), and cultures (e.g., collectivist Eastern vs. capitalist Western). As researchers learn where and how SWL programs like the GLM are most effective, program refinements can be made to improve their effectiveness and their reach.
Uses for the GLAD span clinical work, preventative efforts, and research into SWL. Building knowledge about the universality and potential benefits of models like the GLM will deepen the understanding of positive psychology. Demonstrating effectiveness of intervention and educational programs built on such models can help make positive psychology more attractive to more people.
Limitations and Future Directions
As clinicians and researchers begin their use of the GLAD, their efforts can help reduce or eliminate several limitations of the present study. First, the GLAD validated nine factors, where two of the factors each combine two GLM domains (Inner Peace & Pleasure, and Community & Relatedness). While the GLAD assesses all 11 GLM domains, future work should discern whether Inner Peace/Pleasure and Community/Relatedness are standalone domains. If any of them are unique domains, refine items to assess their individual achievement.
The reliability and validity of the GLAD discussed herein is based on a single convenience sample of U.S. adults. While quotas within the sampling methods approximated that population on five demographics, it is not a random and representative sample of the general population. Care should be taken when generalizing these results, especially to populations of youths. Additionally, cross-section samples do not permit full validation testing, such as comparisons among and between clinical, offender, adult, or youth groups and repeated testing among the same samples. As participant data are collected with the GLAD, future studies can aid validation efforts by undertaking such longitudinal and cross-group analyses. If data are specific to identifiable populations, or are collected randomly across populations, then the generalizability of the GLAD can be assessed more accurately.
While some respondents did report engagement in crime and deviance, this study did not target a population of people who offend. Since the GLM was created to intervene in the lives of people who offend, future studies should target people from this population in order to assess both the validity of the GLAD in that population and the utility of positive psychology ideology to help prevent or reduce crime. Random, longitudinal studies employing the GLM and GLAD with people in- and at-risk can help determine whether increases to SWL are an efficient and effective strategy to reducing crime.
Finally, concurrent validity of the GLAD was assessed via correlation with the Satisfaction with Life Scale, or SWLS (Diener et al., 1985). The SWLS is a global measure of SWL. The GLAD and SWLS scores achieved moderate associations between each other. This suggests that the GLAD is also a good indicator of global SWL. Construct validity suggests that the GLAD items assess 9 distinct factors in a way consistent with the 11 GLM domains. Those domains are similar to domains posited in other models of SWL (cf. Table 1 above). Though they are not necessarily tied to clinical interventions or psychoeducational prevention programs, other assessments of domain satisfaction do exist, like the Happiness Index (Musikanski et al., 2017). To further validate the GLAD, and to confirm the similarity and universality of life domains in SWL models, future research should collect data from indices of other SWL models for correlational analyses. A fully validated GLAD that assesses domains consistent across models of SWL can be relied upon to help people and societies build their own versions of a good life.
Conclusion
Both Aristotle (1999) and the Dalai Lama (Lama & Cutler, 1998) wrote that the goal of humans is to seek and attain happiness. Frankl (2006) believed that happiness could even be sought and found in the depths of despair and suffering. Building on those philosophical perspectives, Seligman (1999) suggested a science that would lead people to achieving happiness. The initial validity of the Good Lives Assessment of Domains allows people to take one more step toward achieving happiness. It also offers a little more hope that future work within positive psychology can help build the kinds of “. . .positive individuals, flourishing communities, and just society” that Seligman (1999, p. 560) saw.
Supplemental Material
sj-docx-1-ijo-10.1177_0306624X241240711 – Supplemental material for Validation of the Good Lives Assessment of Domains in an Adult U.S. Sample
Supplemental material, sj-docx-1-ijo-10.1177_0306624X241240711 for Validation of the Good Lives Assessment of Domains in an Adult U.S. Sample by Jeremy Olson, Dennis Giever and Rebecca S. Sarver in International Journal of Offender Therapy and Comparative Criminology
Footnotes
Declaration of Conflicting Interests
The author(s) declared no potential conflicts of interest with respect to the research, authorship, and/or publication of this article.
Funding
The author(s) disclosed receipt of the following financial support for the research, authorship, and/or publication of this article: This study was funded by a grant from the George Bierly Endowment of the Chancellor Endowment Funds at Penn State Wilkes-Barre, CEF #128.

Data Availability
Data for this study is available by contact with the corresponding author.
Supplemental Material
Supplemental material for this article is available online.
Notes
References
Supplementary Material
Please find the following supplemental material available below.
For Open Access articles published under a Creative Commons License, all supplemental material carries the same license as the article it is associated with.
For non-Open Access articles published, all supplemental material carries a non-exclusive license, and permission requests for re-use of supplemental material or any part of supplemental material shall be sent directly to the copyright owner as specified in the copyright notice associated with the article.
