
Abstract
Laboratory activities support conceptual understanding in engineering education, particularly in aerodynamics and computational fluid dynamics (CFD), where many flow phenomena are difficult to interpret using numerical results alone. This paper presents the development, implementation, and educational evaluation of a low-cost smoke flow visualisation system for the TecQuipment AF-100 subsonic wind tunnel. The system enables real-time observation of airflow and was integrated into laboratory and project-based learning within undergraduate aerodynamics teaching. The system was developed through an iterative process involving computer-aided design, CFD-informed refinement, prototyping, and experimental testing, and was applied across a range of educational case studies, including aerofoil testing and Formula Student vehicle aerodynamics. The educational impact was evaluated using an anonymous post-activity student survey comprising Likert-scale and open-ended questions. The results indicate positive student perceptions of improved conceptual understanding, stronger links between theory and experiment, and increased confidence in interpreting aerodynamic phenomena. As these findings are based on self-reported student perceptions, and indicative of the educational benefit of having smoke visualisation accompany quantitative wind tunnel measurements. Hence, smoke flow visualisation can support engagement and experimental learning in undergraduate aerodynamics laboratories.
Keywords
Introduction
Background
Effective teaching and learning in higher education involve the design of learning environments that actively engage students, rather than relying solely on the transmission of information. Research in STEM education consistently shows that active learning approaches, in which students participate in meaningful learning activities are associated with improved academic achievement and lower failure rates compared with traditional lecture-based approaches.1,2 Within engineering education, active learning has also been linked to enhanced conceptual understanding, improved problem-solving ability, and knowledge transfer. 1 This evidence supports teaching approaches that encourage interaction, interpretation, and reflection. Such approaches are particularly valuable in conceptually demanding modules, where learners often struggle to connect theoretical models and simulations with physical phenomena.2,3
Laboratory-based learning remains central to engineering education, as it enables students to test ideas, analyse real systems, and develop engineering judgement under realistic constraints. However, the educational value of laboratory activities depends on clearly defined learning objectives and alignment between intended outcomes, teaching activities, and assessment methods.4,5 Engineering education research has long emphasised that laboratories should extend beyond procedural tasks to support conceptual understanding, inquiry, and professional practices such as modelling, validation, and awareness of uncertainty. 4 Laboratories are therefore most effective when they encourage students to reason from observations and evidence, rather than simply record measurements.
In fluid mechanics and aerodynamics, the ability to observe airflow behaviour and relate these observations to theoretical and computational models is essential for meaningful learning. Despite this, many undergraduate wind tunnel laboratories are configured primarily for quantitative measurements, such as lift, drag, and pressure, with limited visual access to the flow field. This emphasis on numerical outputs can unintentionally encourage a “numbers-first” approach, in which students focus on measured values without developing a clear understanding of the underlying flow physics. Educational research suggests that providing learners with multiple, complementary representations of a concept, such as graphical, computational, and physical representations can strengthen conceptual understanding and improve learning outcomes.6,7
Within aerodynamics education, the use of computational fluid dynamics (CFD) has become increasingly common and can support student learning when used as part of an integrated modelling-experiment approach. However, research on learning with simulations shows that they are most effective when combined with appropriate instructional support, structured tasks, and opportunities for learners to test, interpret and revise their ideas. 8 In engineering curricula, integrating simulation with experimental study has been shown to support students’ understanding of modelling assumptions, validation practices, and the relationship between predicted and observed behaviour.9,10 In the context of aerodynamics, wind tunnel testing remains essential, not only for validating CFD simulations but also for enabling students to observe flow phenomena that are not always evident in numerical results alone. 11
This highlights an important pedagogical need in aerodynamics laboratories. Students benefit from learning activities that make the flow field observable, allowing CFD results and theoretical expectations to be interpreted against physical evidence rather than treated as abstract outputs. This aligns with Prince, 1 who emphasised the role of hands-on activities in promoting conceptual understanding. When students are given opportunities to engage actively with physical systems and relate observations to structured learning tasks, deeper engagement and learning through problem-solving are more likely to occur.
Flow visualisation offers a direct pedagogical means of addressing this need by enabling real-time observation of aerodynamic behaviour. Flow visualization techniques are commonly categorised as optical or non-optical methods.12–14 Optical approaches include smoke-wire techniques and laser-illuminated smoke sheets, which can reveal streamline patterns and flow structures with high clarity.15,16 However, such systems are often too expensive, limiting their suitability for routine use in undergraduate laboratories. In contrast, smoke-based visualisation offers a simple and low-cost alternative for educational settings, producing repeatable qualitative evidence that supports discussion, inquiry, and conceptual explanation.
Previous work has demonstrated the educational value of this approach. For instance, Trinder and Jabbal 17 developed a smoke visualisation system for wind tunnel experiments and showed that controlled smoke trails can support aerodynamic interpretation across a range of test objects and teaching contexts. Such systems typically use a smoke generator with a flow rake to produce discrete smoke lines that are easier for students to observe and track. While Trinder and Jabbal 17 established the value of smoke visualisation in wind tunnel teaching, the present study extends their work in several ways. Unlike Trinder and Jabbal's, the current system was developed through a student-led design and build process and implemented on a TecQuipment AF-100 subsonic wind tunnel. Furthermore, a wider set of case studies, including aerofoil testing, morphing configurations, and Formula Student components were explored. The study includes a structured evaluation based on quantitative and qualitative student feedback, providing insight into how the activity is experienced in practice. Particle or aerosol tracking methods have also been used effectively in both teaching and research settings. 12 Among optical techniques, the shadowgraph method remains a basic yet effective approach, where a light source passes through a translucent medium to project flow disturbances onto a screen for visual analysis. 14
Advanced methods such as Particle Image Velocimetry (PIV) provide instantaneous velocity fields by tracking the motion of smoke or aerosol particles. PIV is a non-intrusive technique that offers high spatial and temporal resolution, making it well suited for the analysis of unsteady and turbulent aerodynamic flows.14,18 Other visualisation methods include the smoke-wire technique, in which a heated tungsten or stainless-steel wire generates discrete smoke filaments that produce clear and well-defined flow traces with minimal wire degradation. 19 Smoke for flow tracing can also be generated using natural oils, synthetic polymers, or fuels such as kerosene, depending on the application and required smoke density. 20 More advanced techniques, such as three-dimensional particle tracking velocimetry (3D-PTV), employ high-speed stereo imaging to reconstruct particle trajectories in complex flow fields, providing detailed three-dimensional velocity measurements, particularly at high Reynolds numbers. 21
While these techniques are widely used in research settings, their cost, complexity, and operational demands often limit their suitability for routine use in undergraduate teaching laboratories. This study therefore focuses on a more accessible approach and presents the design, implementation, and use of a smoke-based flow visualisation system. The design addresses two pedagogical objectives: to make key aerodynamic flow structures visible in a clear, repeatable, and affordable way, and to support structured learning activities in which students interpret flow behaviour alongside theoretical principles and CFD predictions. This aligns with experiential learning perspectives, where understanding develops through direct experience, reflection, and the iterative refinement of ideas.
To examine the perceived educational value of the system, it was integrated into undergraduate aerodynamics learning activities. Student perceptions were collected using a structured, anonymous survey comprising Likert-scale and open-ended questions. The evaluation focused on students’ perceived understanding of aerodynamic phenomena and their ability to connect theory, simulation, and experimental observations. Overall positive feedback was obtained, suggesting that students perceived the system as useful in supporting their learning.
Educational and research benefits of smoke visualisation in the aerodynamics laboratory
The integration of smoke visualisation into a subsonic wind tunnel provides a clear pedagogical means of linking theoretical aerodynamics with experimental experience. Within engineering education, laboratory activities are known to support conceptual understanding, and the linking of theory to practice, particularly when learners engage with multiple forms of representation, such as physical, graphical, and computational models. Visualisation has long been recognised as an effective means of helping students develop mental models and interpret underlying concepts more clearly. 22
Figure 1 illustrates a conceptual framework showing how qualitative visualisation complements traditional quantitative measurements within the wind tunnel laboratory. While quantitative measurements provide aerodynamic performance numerically, they do not make the flow field visible. Without visual access to the flow, students often find it difficult to relate numerical results to the underlying physics, particularly for flow phenomena such as separation, reattachment, or wake formation, that are central to aerodynamic understanding.
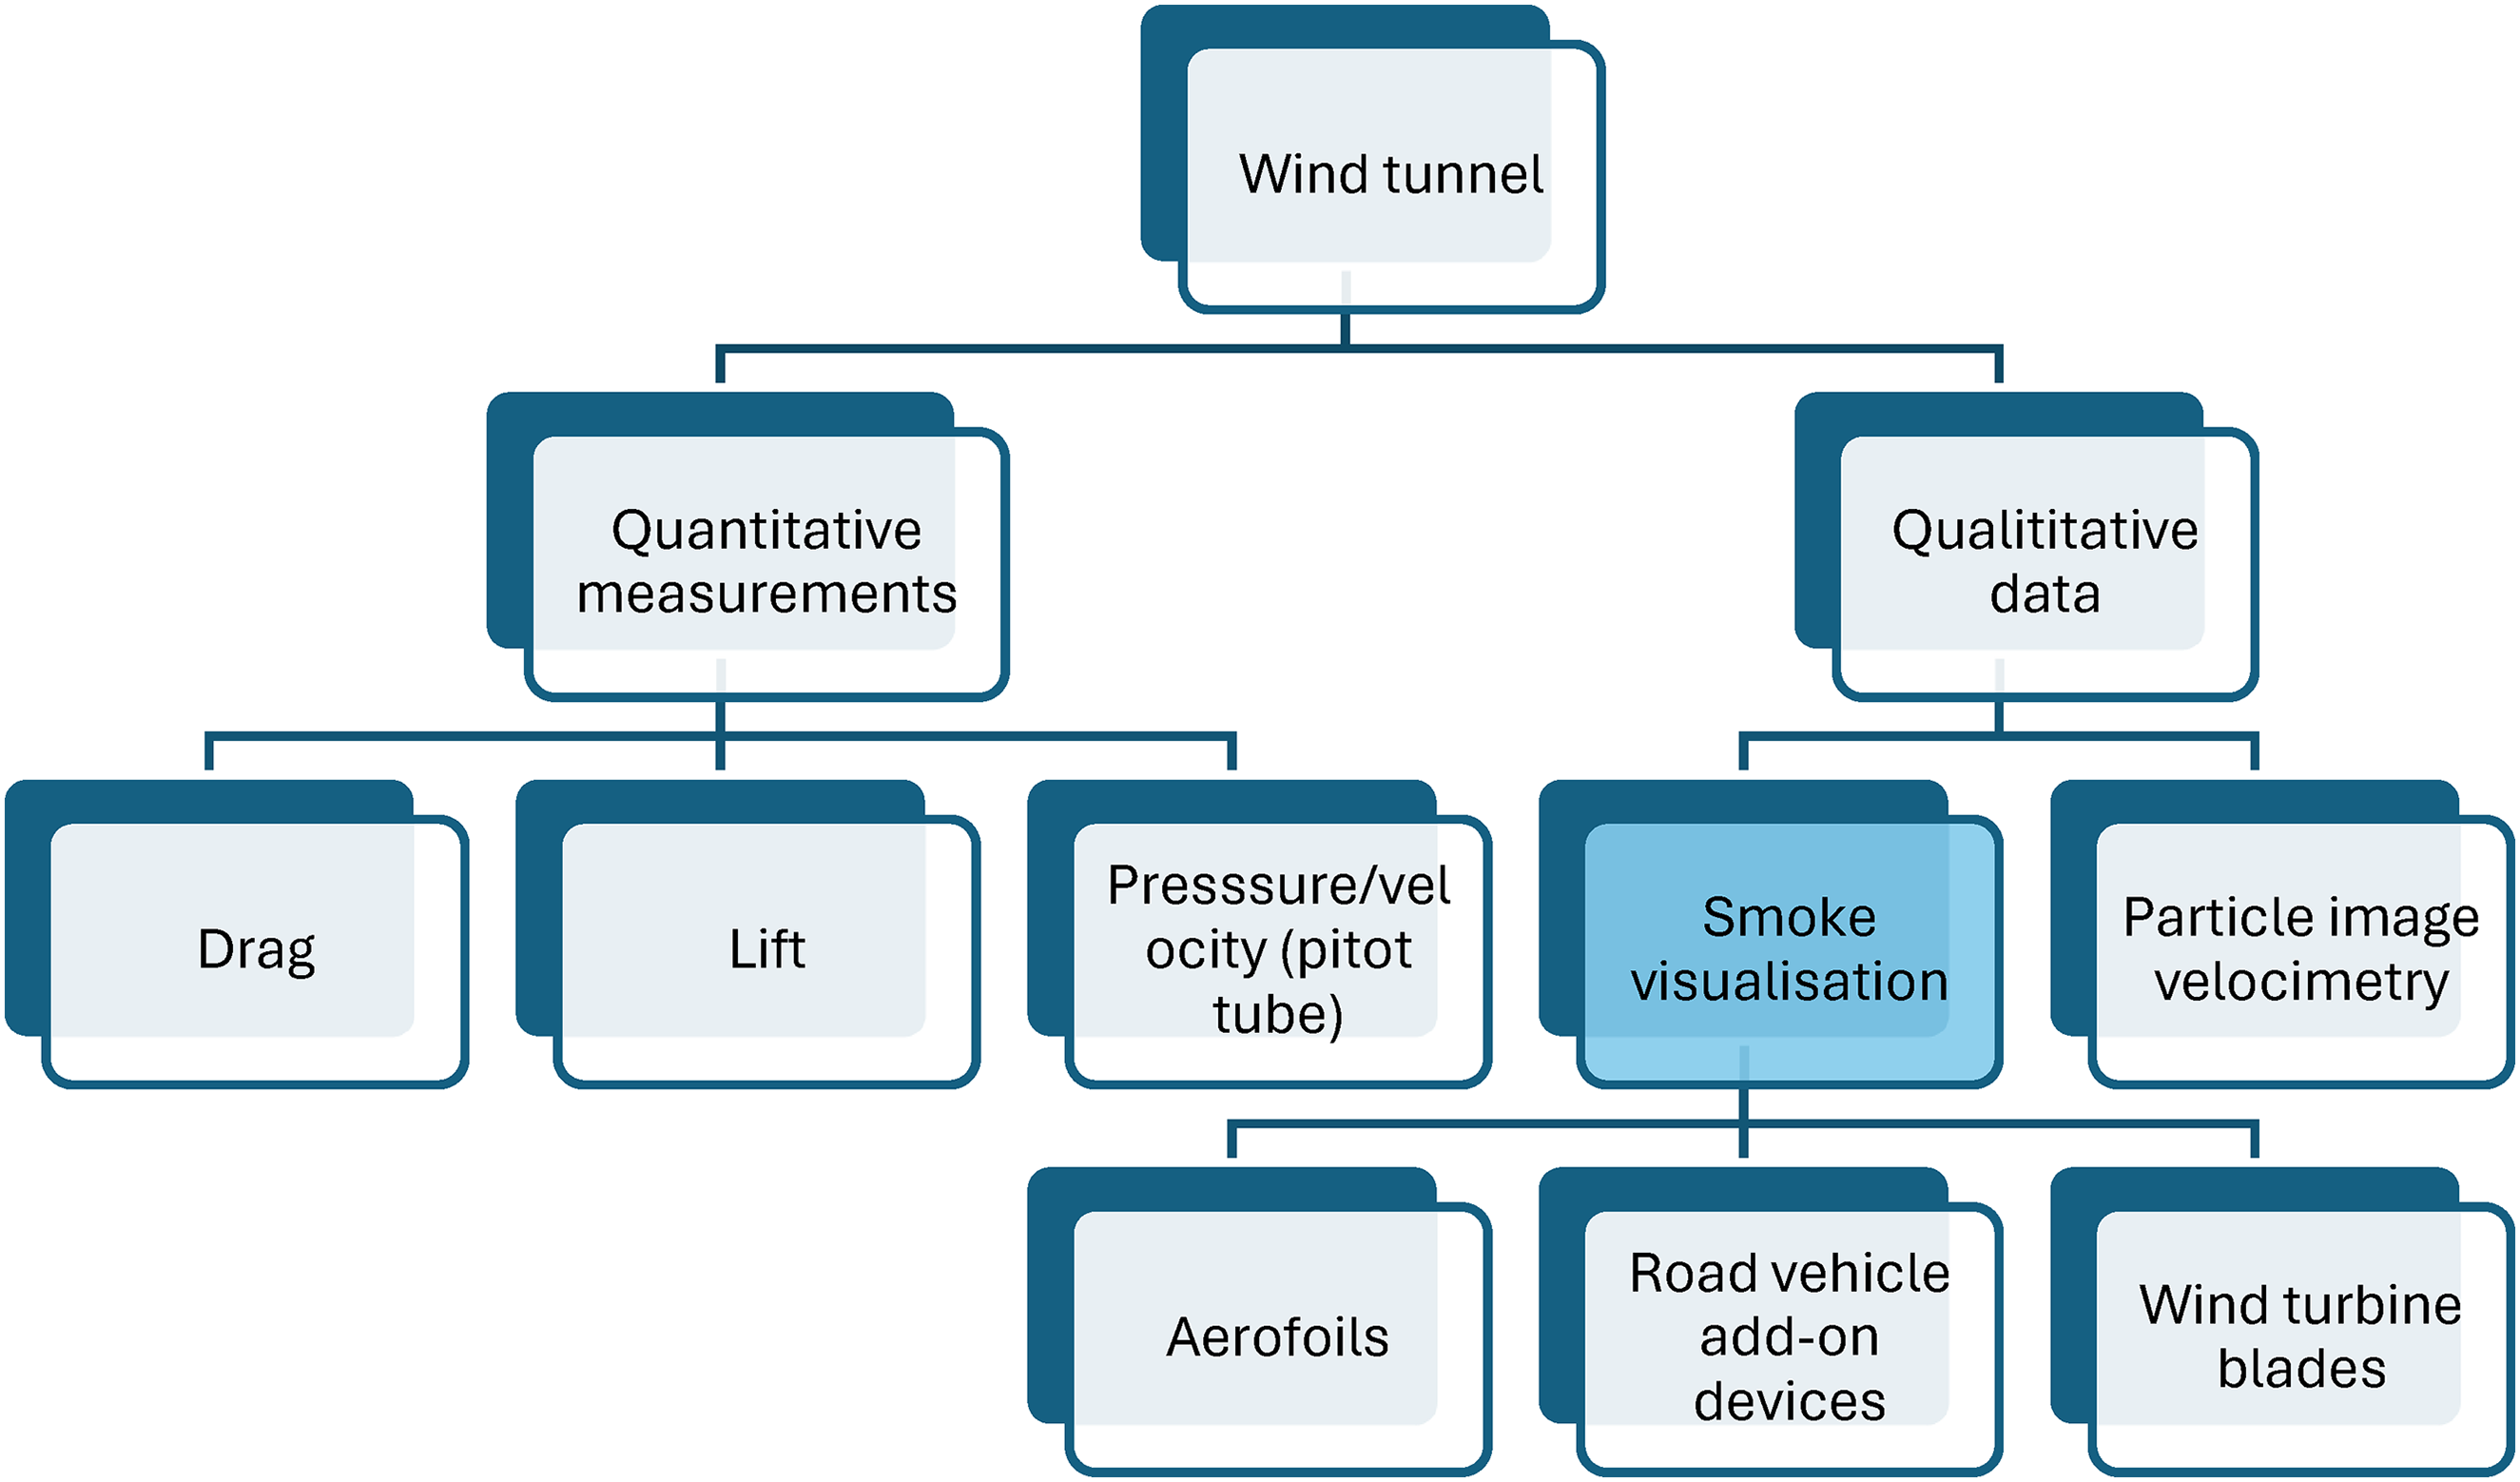
Educational integration of smoke visualisation in aerodynamics laboratory.
Including smoke visualisation gives students a more intuitive way to explore airflow around engineering components and to contextualise quantitative measurements. When used in wind tunnel experiments, it allows students to observe airflow over aerofoils and other aerodynamic bodies, complementing traditional quantitative tools such as pitot tubes used to measure static and dynamic pressures. This approach aligns with constructivist and experiential learning principles, where understanding develops through active engagement, observation, reflection, and comparison between expected and observed outcomes. 23
The educational value of smoke visualisation is particularly evident when applied across a range of aerodynamic contexts, as shown in Figure 1. Through these activities, students are able to observe phenomena such as wingtip vortices during aerofoil testing, flow interaction with road vehicle add-on devices, and flow disturbances around turbine blades. These applications help students connect theoretical ideas, such as pressure-velocity relationships and flow separation, with aerodynamic behaviour encountered in practical engineering situations. Enabling learners to apply conceptual knowledge in authentic contexts is a key aim of engineering education and has been associated with improved engagement, retention, and critical thinking. 23 The learning activity developed in this study was structured around these principles and aligned with specific learning outcomes, which were later evaluated through a student survey. The qualitative nature of smoke visualisation reflects students’ reported experiences, including interpretation of boundary-layer behaviour, clearer understanding of aerodynamic concepts, and stronger links between theoretical analysis, computational modelling, and experimental observation.
Methodology
Study design and educational context
This study was carried out within an undergraduate aerodynamics teaching context in which wind tunnel experimentation is a core component of learning in fluid mechanics and aerodynamics. The activity was delivered as a laboratory and project-based learning, where students designed, fabricated, and implemented a smoke-based flow visualisation system for use in the wind tunnel. The educational impact of the activity was evaluated using an anonymous survey that captured students’ perceptions of learning, engagement, and interpretation of aerodynamic phenomena.
The activity was designed to support the development of key engineering competencies, including engagement with the engineering design process, iterative prototyping, and interpretation of aerodynamic behaviour. It also aimed to strengthen students’ ability to relate theoretical principles and computational fluid dynamics (CFD) predictions to experimental observations through real-time visualisation of flow behaviour.
The methodological approach comprises two components:
Technical development, in which students designed, fabricated, and tested a smoke-based flow visualisation system for use in a subsonic wind tunnel, and Educational evaluation, in which students’ learning experiences and perceptions were examined using an anonymous post-activity survey.
This approach aligns with established practice in engineering education research, where the impact of teaching innovations is examined using descriptive quantitative data alongside qualitative student feedback, with a focus on perceived learning, engagement, and conceptual understanding.
Participants and learning activity structure
A total of 18 students engaged in wind tunnel-based aerodynamics activities that incorporated the smoke visualisation system. The cohort included students at different stages of study, with varying levels of prior experience in aerodynamics and wind tunnel experimentation. Of those who took part in the learning activities, 13 students completed the post-activity evaluation survey. Survey participation was voluntary, and responses were collected anonymously.
Students participated not only as users of the visualisation system but also as co-designers, contributing directly to the design, fabrication, and testing of the smoke rake and its integration within the wind tunnel. This student-led development approach reflects authentic engineering practice and was intended to promote a sense of ownership, sustained engagement, and reflective understanding of both the engineering design process and experimental investigation.
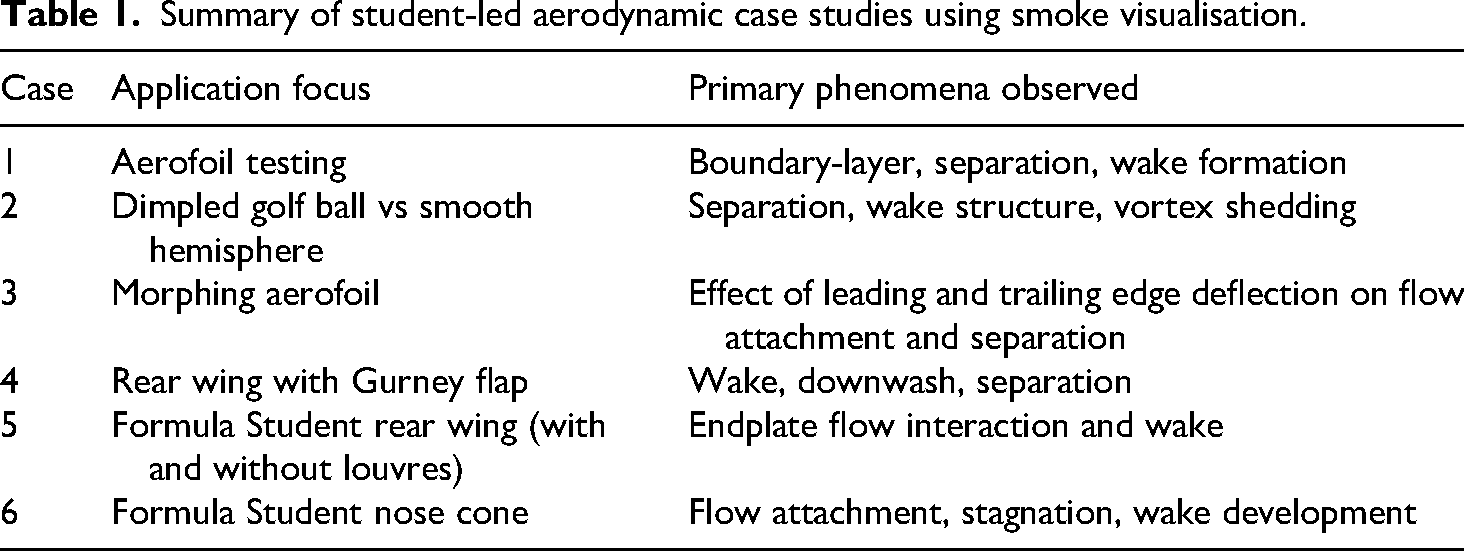
Following system development, the smoke visualisation setup was used by students to carry out a series of six applied case studies (summarised in Table 1), each selected to illustrate different aerodynamic phenomena and engineering design contexts. Across these activities, students used smoke visualisation to observe key flow features, including separation, reattachment, wake development, and vortex formation. Where appropriate, visual observations were compared with CFD results, supporting interpretation of flow behaviour and informed discussion of modelling assumptions and limitations.
Summary of student-led aerodynamic case studies using smoke visualisation.
Smoke flow visualisation system and laboratory setup
The experimental setup comprised a smoke generation and delivery system integrated into a TecQuipment AF-100 subsonic wind tunnel. The system included a smoke generator, a smoke rake with mounting frame to enable controlled smoke release, lighting and imaging arrangements to support clear visual observation, and an extraction system to maintain air quality and visual clarity during operation. The configuration was designed to support repeatable visualisation of flow behaviour while remaining suitable for routine use in a teaching laboratory environment.
Equipment and operating environment
Wind tunnel facility
Experiments were conducted using the TecQuipment AF-100 subsonic wind tunnel, an educational wind tunnel commonly used for aerodynamic experiments. The AF-100 test section measures 305 mm × 305 mm × 600 mm and supports air velocities up to 36 m/s in an open-end configuration. The wind tunnel consists of several key components arranged sequentially from the air intake to the exhaust, which includes a contraction section, honeycomb, test section, diffuser, and fan, as shown in Figure 2.
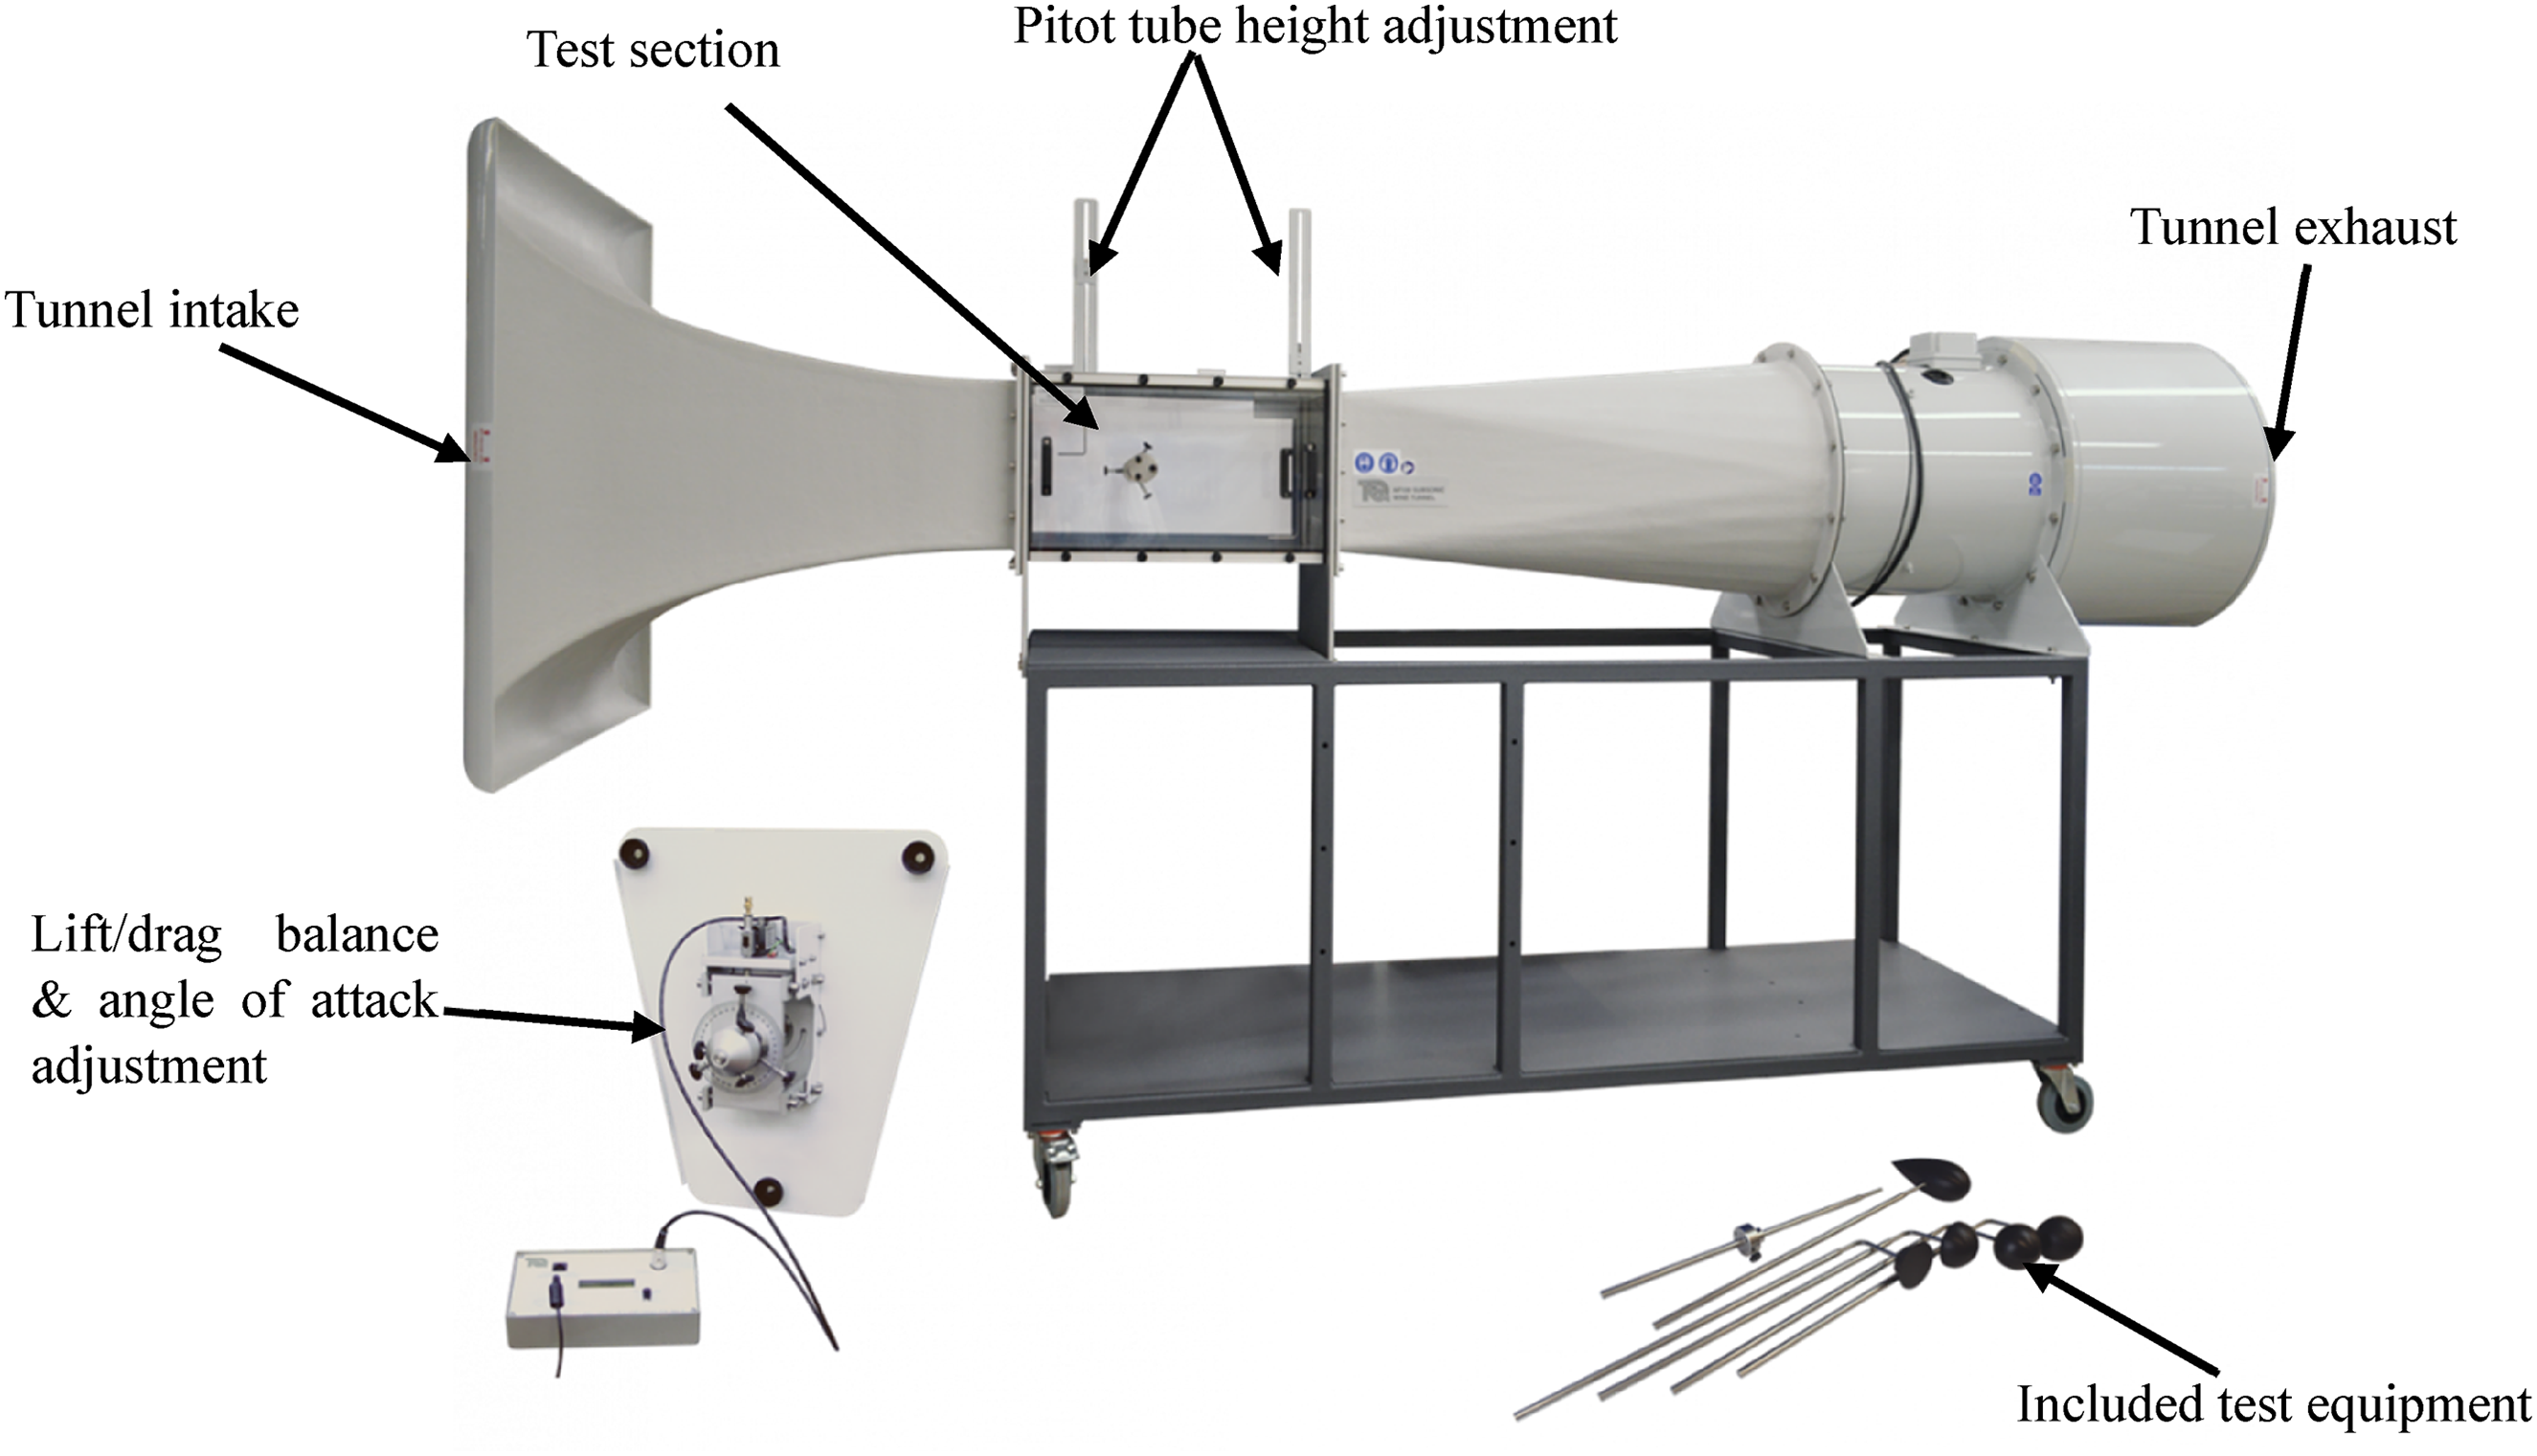
TecQuipment AF-100 subsonic wind tunnel.
Smoking machine (smoke generation device and liquid selection)
Two options were considered for the smoke generation system: a water-based propylene glycol and a paraffin-based oil. For the latter, the commercial Johnson & Johnson Paraffinum Liquidum was used given its wide commercial availability. Water-based paraffin oil and propylene glycol are commonly used in commercial smoke generators. A comparative analysis was conducted to evaluate their suitability in terms of performance, safety, and compatibility with the TecQuipment AF-100 wind tunnel.
The water-based smoke machine (shown in Figure 3(a)) was originally selected because it was cheaper and due to the lower toxicity of its fumes. However, initial testing revealed two limitations. Firstly, the device required high temperatures to vaporise the solution, which caused the melting of the plastic tubing used and subsequent deformation of the 3D-printed PLA components of the smoke rake. Furthermore, the smoke produced was of low density and dissipated rapidly, resulting in poor visibility. This significantly limited its effectiveness in visualising flow features around aerofoil within the test section. While some visualisation was achieved, the smoke volume and visibility were insufficient for consistent and clear aerodynamic analysis.
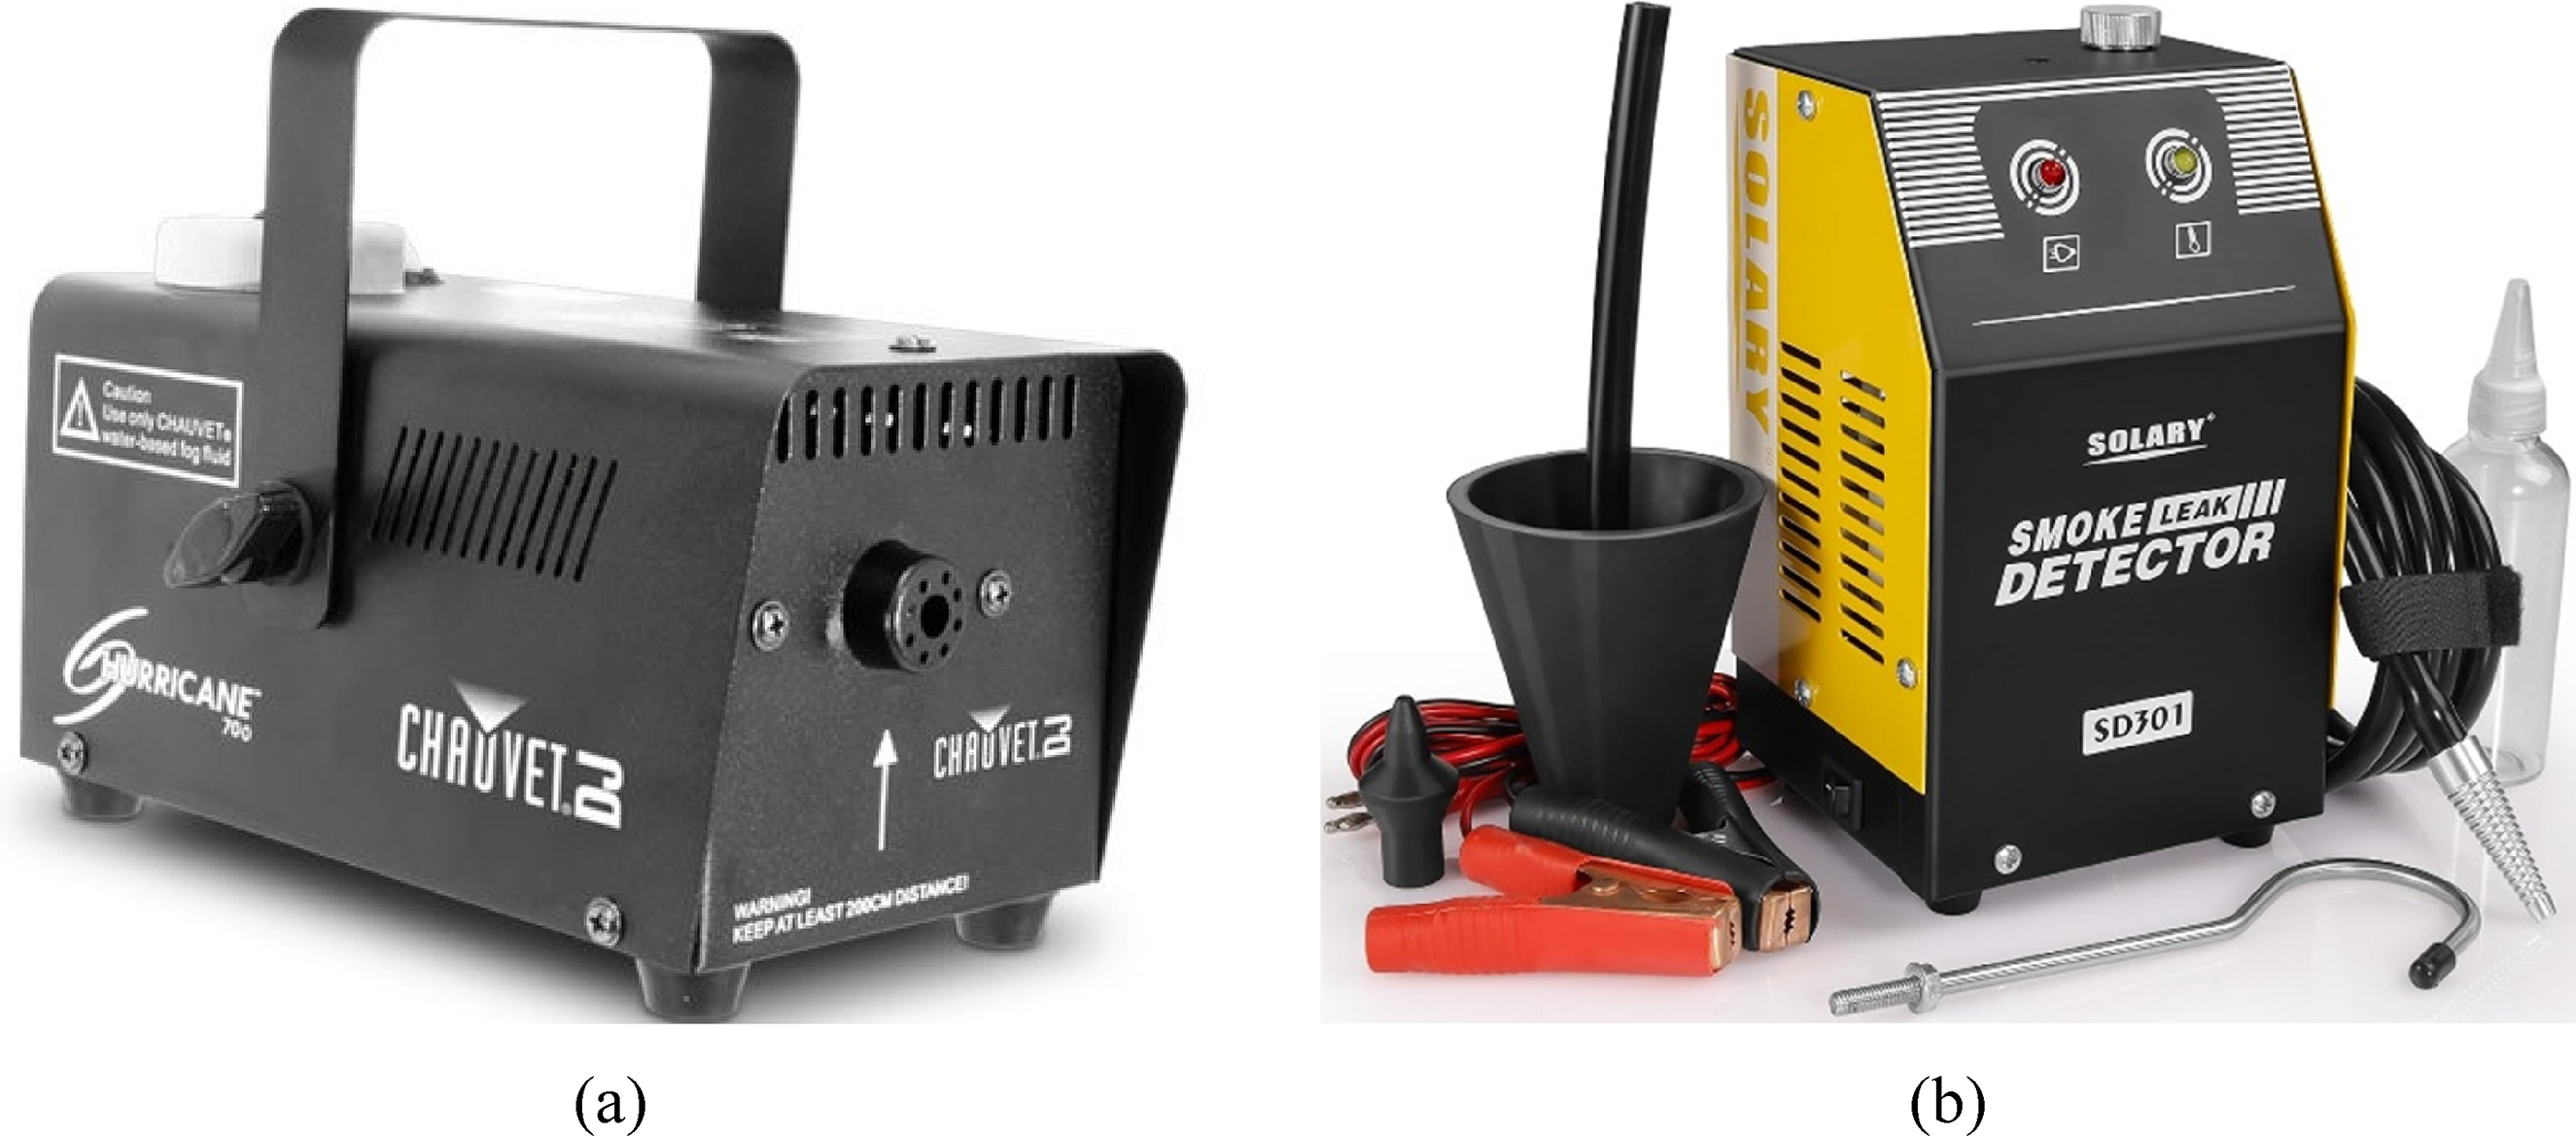
Two candidate smoke machines (a) water-based (b) oil-based.
Due to these limitations, the study adopted a paraffin oil-based smoke machine. (shown in Figure 3(b)), commonly used in automotive leak detection for generating dense and stable smoke streams suitable for flow tracing. The paraffin oil offered higher smoke density, longer operating duration, and greater thermal/material compatibility, producing clearer visualisation of flow patterns. To ensure reliability, additional tests were conducted to assess potential thermal effects and ensure that the new setup would not cause component deformation or safety risks during prolonged operation. To mitigate any health risks of inhaling the paraffin oil-derived smoke, sufficient ventilation within the laboratory was ensured as well as the use of a custom fabricated exhaust duct. More details on the duct are given in the next section.
Exhaust fabrication and integration
A commercially available smoke machine was employed to generate smoke for the experiments. To ensure compatibility with the smoke rake, the supplied rubber tubing was measured, and a slightly oversized inlet valve was designed. This allowed the rubber to stretch over the connection, ensuring a secure seal adequate for experimental use. A key consideration during setup was the safe removal of smoke generated during flow visualisation. Before any physical testing, an exhaust system was designed and installed to prevent the build-up of vapour in the laboratory, mitigating health and safety risks. This extraction system also played a key role in maintaining air quality and ensuring visual clarity during experiments.
The system featured a wooden frame which was built from medium-density fibreboard (MDF) for rigidity, ease of fabrication, and cost-effectiveness. The frame was sized to fit securely within a window opening, providing an airtight seal for efficient smoke extraction, as shown in Figure 4.
Tarpaulin material was used for the ducting due to its flexibility, lightweight, and wind resistance. Several attachment techniques were evaluated, and countersunk screws were selected for their secure hold and minimal impact on the frame. To maintain proper alignment during operation, alignment markers (tape) were added. The final exhaust system effectively channelled smoke out of the laboratory space while maintaining ease of installation, operationally effective and structurally stable throughout the testing period.
Smoke rake design process
Computational fluid dynamics-assisted smoke rake design
CFD simulations were carried out using ANSYS Fluent to support the design and refinement of the smoke rake and flow visualisation system. Air was used as the working fluid, with a density of 1.293 kg/m3 and a dynamic viscosity of
External flow analyses were first used to examine airflow around the rake and supporting frame, with attention to local velocity distribution, pressure gradients, drag, and recirculation regions. The purpose of this stage was to identify geometric features that could disturb the incoming flow or introduce unwanted wake structures into the contraction and test-section region. Based on these results, the external geometry was modified iteratively to reduce local flow disturbance and improve downstream flow recovery.
Internal flow simulations were then carried out to examine smoke transport within the rake and its release into the wind tunnel. These simulations were used to identify regions of stagnation, backflow, and uneven outlet behaviour, and to guide adjustments to the internal passage geometry and outlet arrangement. The aim was to achieve a more uniform and directed smoke release across the outlets, thereby improving smoke coherence and visualisation quality. The final configuration was selected when the simulations indicated a reasonably uniform downstream velocity profile, minimal local recirculation, and a consistent distribution of smoke across the rake outlets. The CFD work was therefore used as a design-support and refinement tool rather than as a formal numerical optimisation procedure.
Prototyping selection
The design phase involved brainstorming concept and ideas that aligned with the project objectives and constraints. From these, three promising concepts were developed into detailed CAD models, shown in the Appendix (Figure A1). To evaluate and refine these designs, CFD simulations were conducted, analysing both internal and external airflow. The simulations guided design modifications, including narrowing and elongating the external aerofoil cross-section, smoothing sharp edges, and adding aerofoil shaped sections to streamline complex geometries, conceal joints, and improve overall aerodynamic performance. Prototypes were fabricated and tested in the wind tunnel under both standard and off-design operating conditions to assess robustness. Data from these tests led to further analysis and comparison, leading to the selection of the most viable design.
Prototype 3 (Figure A1 (e) and (f), in Appendix), initially considered promising, was excluded after testing. Its compact size within the test section caused high internal pressure and uneven smoke distribution, with excess smoke exiting the upper rake outlets. Additionally, its limited functionality offering only vertical smoke analysis and the need for significant structural modification of the wind tunnel test section made it unsuitable for further development.
Designs 1 and 2 (as shown in Appendix, Figure A1 (a) and (c)) featured the same rake configuration but differed in frame geometry (circular and square). Testing revealed that the square frame of Prototype 2 offered greater versatility and ease of use. As a result, Prototype 1 was excluded from further testing and development.
Prototype 2 was refined to address issues identified during testing. The pipe outlets were repositioned closer to the rake to improve smoke coherence. The retention pin, which secures the rake to the frame was reinforced and duplicated at both ends, while interface arms were redesigned for permanent integration with the frame, increasing the durability of the frame. To minimise the risk of damage, the exposure of fragile pipework was reduced. The improvements resulted in Prototype 2.1 (shown in Figure A1 (g) and (h), in Appendix), which retained the frame of Prototype 2 (square frame) but incorporated a longer, more streamlined rake with reduced pipe exposed. While this design showed improved performance, further refinement was required.
Building on the insights from Prototype 2.1 and subsequent testing, a final prototype was developed. This design incorporated all previous improvements and was validated through CFD analysis before fabrication. The new design included components specifically designed for 3D printing, reinforced mounting interfaces, and a fully integrated frame with improved aerodynamic performance.
Selected final configuration prototype design
Prototype 2.2 is the outcome of an iterative process involving research, prototyping, CFD analysis, and experimental validation (Figure 4 and (Figure 5(a) and (b))). The square frame is aerodynamically shaped and incorporates multiple mounting positions along its length for flexible rake placement. The interface between the frame and the wind tunnel is enhanced using soft thermoplastic polyurethane (TPU) feet, which offer high grip without requiring permanent installation (as shown in Figure 5(a) & (e)). These feet are also adjustable, allowing the frame to be repositioned deeper into or further along the contraction section of the wind tunnel.
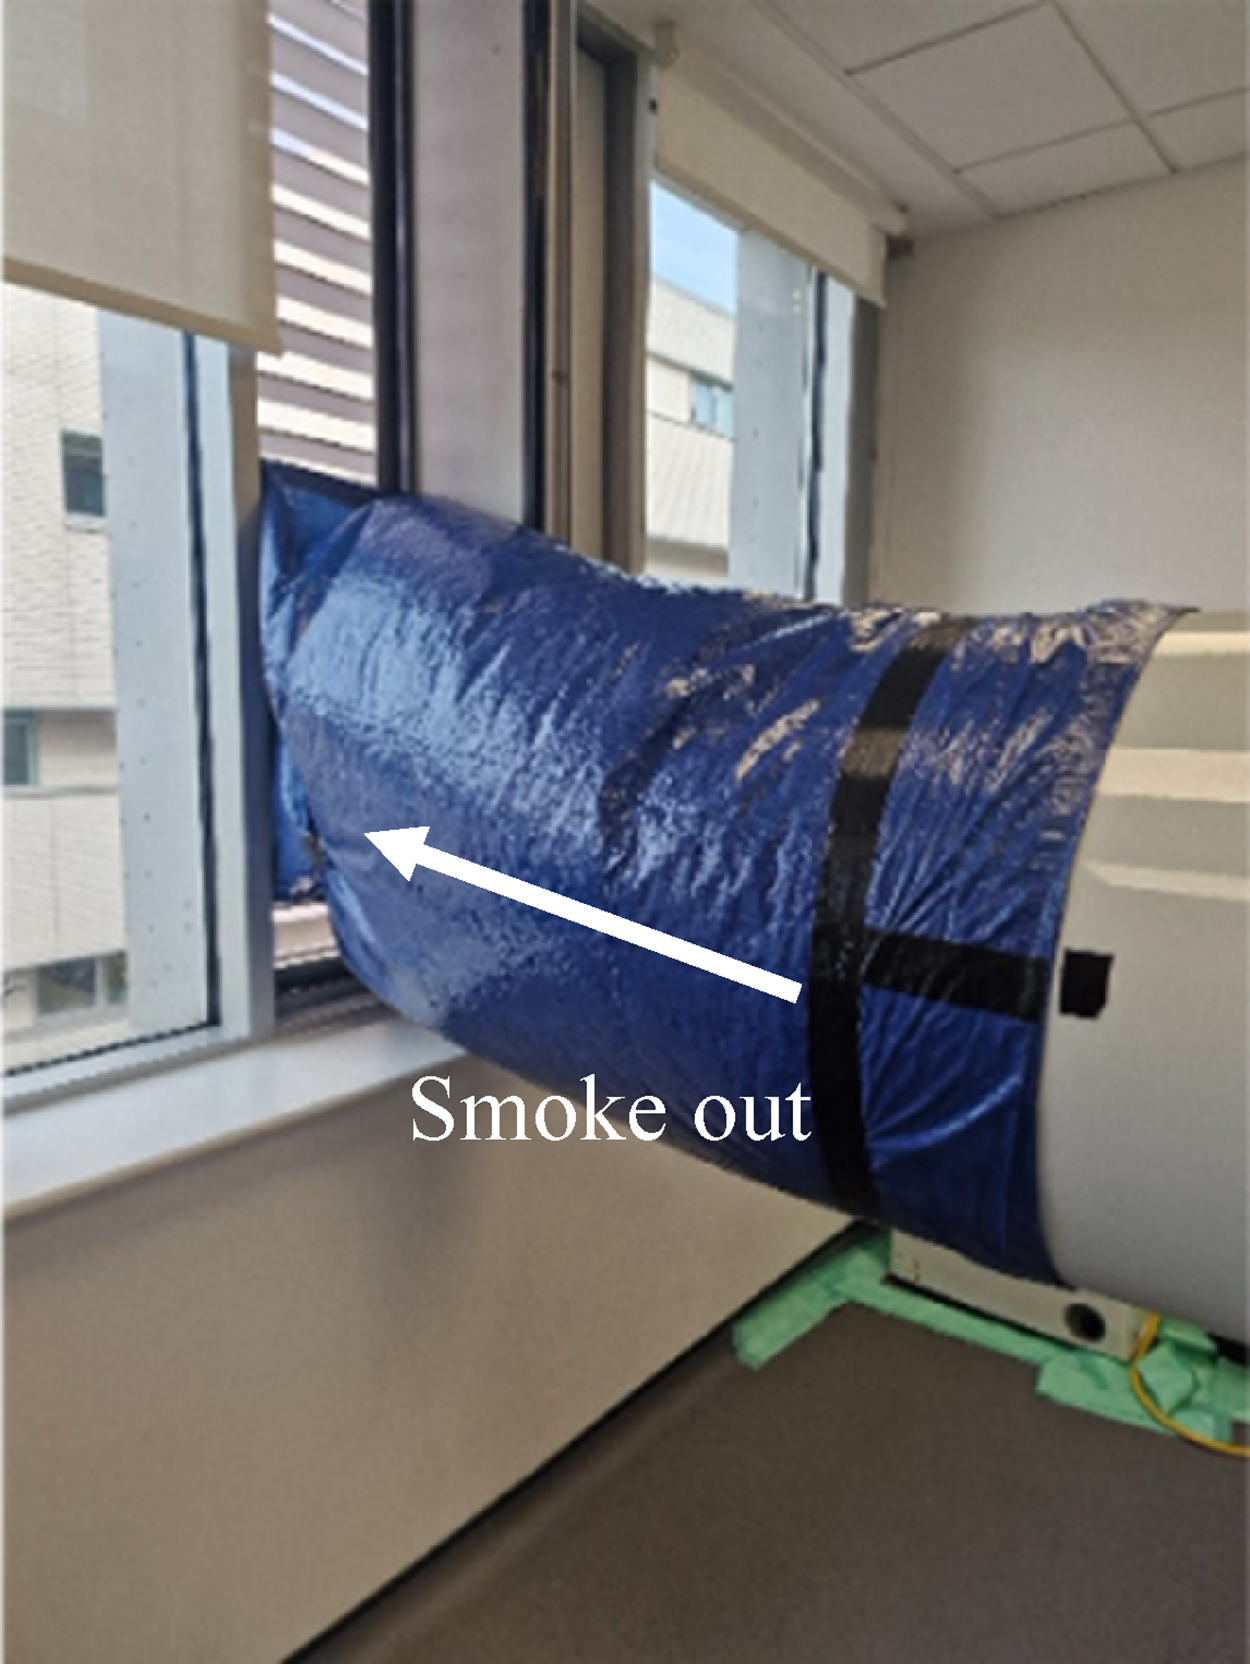
Setup of the laboratory smoke extraction duct.

(a) final design (Prototype 2.2) front profile (b) side profile (c) centreline CFD velocity contour (d) velocity profile 10 mm downstream of frame (section A-A) (e) Prototype 2.2 smoke rake system with mounting feet (f) final design (Prototype 2.2) wireframe side profile.
The rake assembly consists of a long profile with enclosed pipes, each containing a spiral groove to ensure uniform smoke distribution and clearer visualisation. The rake is made up of six individual components and two bearings, enabling for simple fabrication and reassembly. The entire system weighs less than 0.75 kg, making it lightweight and portable for educational or experimental use. It is hence easy to handle and quick to install and can be detached or rotated
CFD simulations showed that the prototype produced only minor and local wake effects that did not propagate. Figure 5 (c & d) shows the velocity contour at the centreline and 10 mm downstream of the frame. At a velocity of 2 m/s, the design generated a drag force of 0.7 N, which is within acceptable limits. A region of lower velocity (of about 0.2 m/s) was observed directly behind the frame, but this disturbance dissipated quickly. As shown in Figure 5 (c & d), the flow recovered further downstream, resulting in a stable and uniform profile. The wake blended smoothly into the surrounding stream, with minimal turbulence and flow disturbances that dissipate quickly. These results demonstrate that the final design is aerodynamically efficient/stable and well suited for smoke visualisation in wind tunnel experiments, supporting its repeated use in both teaching laboratories and student-led experimental work.
Fabrication and materials
Following design optimisation and testing, prototypes were fabricated for experimental evaluation. Most components were produced using additive manufacturing (3D printing), as the complex geometries involved were not easily achievable through traditional subtractive or casting methods. Polylactic Acid (PLA) was selected as the primary material for most components due to its low cost, availability, and ease of post-processing, making it ideal for prototyping. Thermoplastic Polyurethane (TPU) was used for the wind tunnel interface feet, selected for its soft and rubber-like flexibility, which improves grip and allows adaptability through controlled deformation under load. All components were fabricated using a Creality K1 Max printer
24
with a 0.4-mm nozzle. For the final design, a
Despite the reliability of modern 3D printing, two print failures were encountered during the fabrication process. One issue involved bed adhesion, which was resolved by applying glue to the print bed. The second was a print orientation error, resolved by rotating the model by
Steel was used for specific parts requiring high strength, precision, or durability. This includes, the pins connecting the TPU feet to the frame, where a circular profile and threaded section were required, features difficult to produce accurately with 3D printing. These parts were machined to precise tolerances necessary for integration with the rest of the assembly.
An attempt was made to use Carbon Fibre Polycarbonate (CF-PC) due to its high thermal resistance, tensile strength, and impact durability. However, the material proved difficult to print. While suitable for small prints (components), larger prints were unpredictable, with recurring issues such as poor bed adhesion, warping, irregular material flow, and inconsistent layer bonding. Although successful print exhibited excellent surface finish and mechanical performance, these reliability issues led to the decision to continue using PLA for the final assembly.
Future iterations could explore alternative materials such as Polycarbonate (PC), ABS, ASA, resin-based printing, or even metal sintering. These materials offer distinct advantages in terms of mechanical performance, thermal stability, and surface finish, and may be more suitable for long-term or higher-duty applications.
Imaging, observation and documentation
Following fabrication, a comprehensive experimental setup was implemented to ensure functionality, safety, and ease of use within the laboratory environment. The setup integrated key elements including the wind tunnel, computer and data board, power supply, smoke machine, test section backing, rake, LED lighting, and a custom-built exhaust duct. Each component was positioned to enable efficient workflow, facilitate smooth experimentation, and minimise hazards such as cable entanglement or obstruction to other equipment.
The full configuration is shown in Figure 6, illustrating the placement of the smoke machine, 230 V to 12 V power supply, and lighting adjacent to the wind tunnel's contraction section for ease of access and control. A tripod-mounted LED light was used to enhance smoke visibility within the test section.
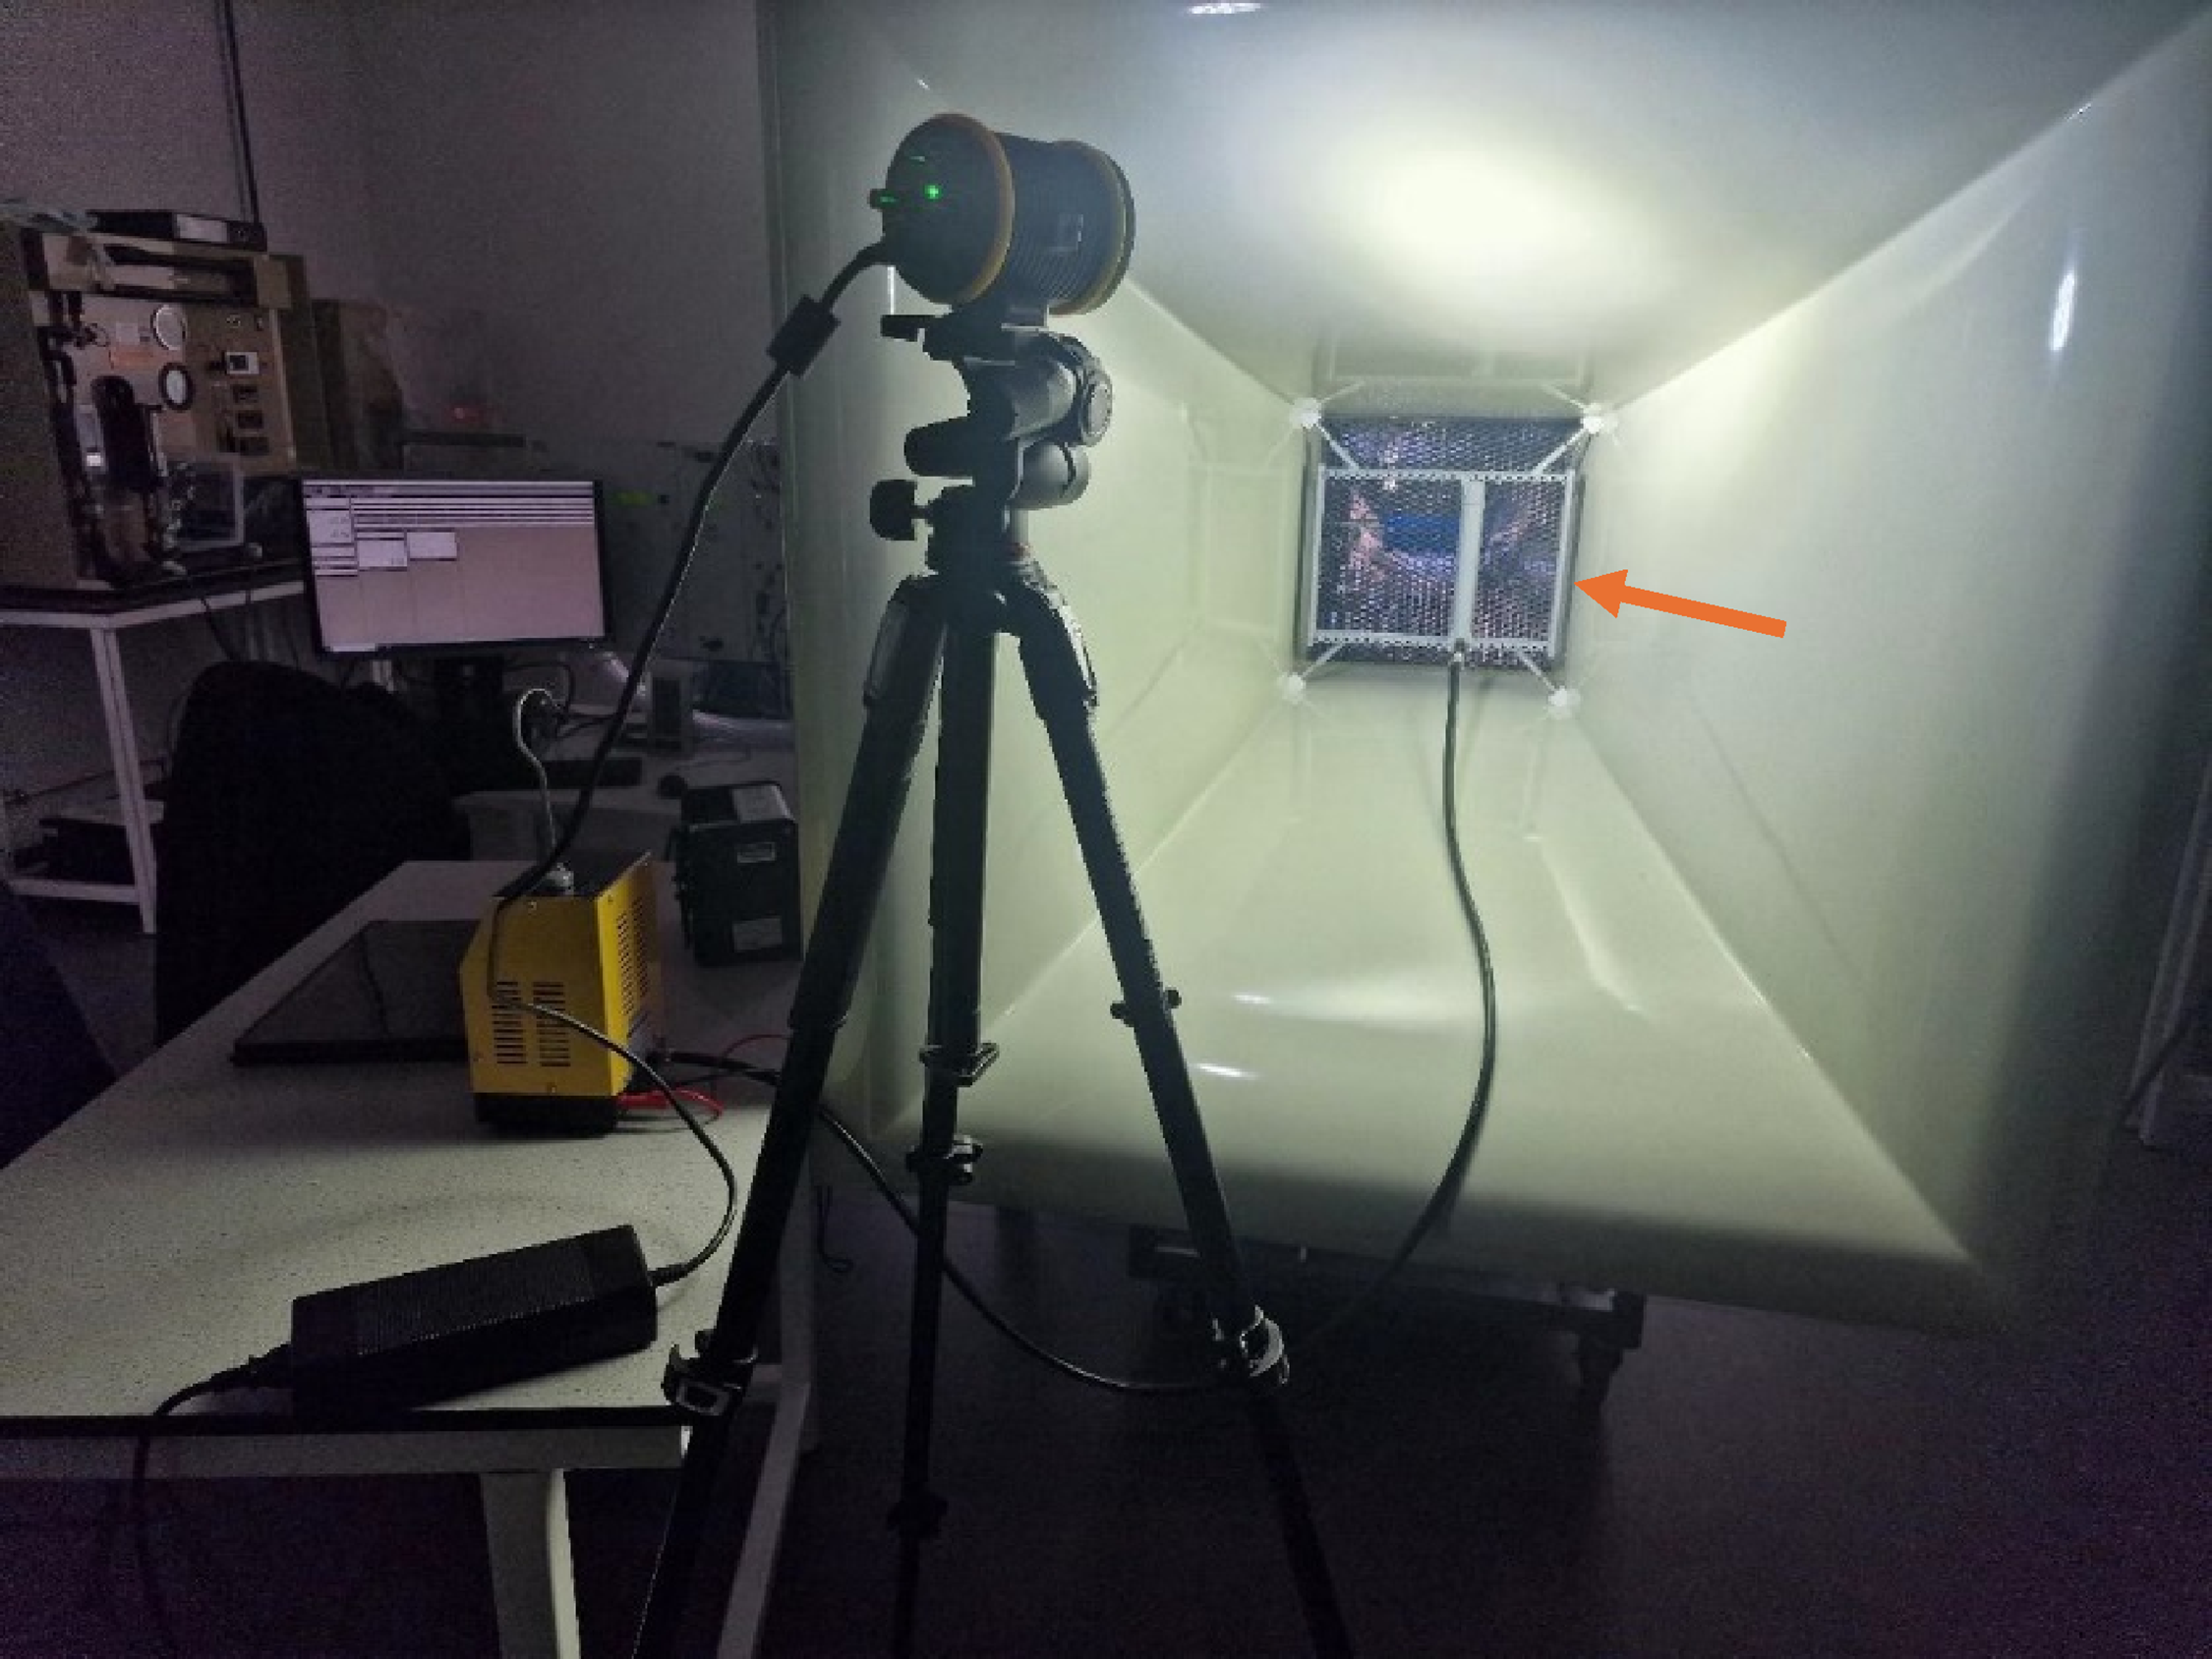
Wind tunnel experimental setup with LED lighting and smoke machine. Arrow shows the smoke rake installed at the end of the bell intake just before the honeycomb.
Proper light positioning was essential for improving image contrast and minimising glare from the acrylic tunnel walls. After testing several configurations and materials, a black spray-painted card was used as the backdrop to maximise smoke contrast and reduce reflections. The clearest visual results were achieved when the LED was directed along the tunnel axis from the contraction inlet.
The extraction duct (Figure 4) consisted of a removable wooden frame designed to slot into a nearby window, approximately one metre behind the wind tunnel exit. A tarpaulin duct connected the frame to the tunnel outlet, with all joint sealed to prevent leakage and pressure loss. The system supported airflow speeds up to 10 m/s, exceeding the requirements for smoke testing.
Despite its effectiveness, the setup was sensitive to external wind conditions, which occasionally caused back pressure and reversed airflow, reducing the accuracy of low-speed tests. A potential improvement would be to extend and angle the duct to minimise backflow and stabilise extraction performance. Although the system functioned adequately for this study, further improvement of the extraction arrangement is required and was also reflected in student feedback.
Anonymous student survey and evaluation
Following completion of the learning activity, an anonymous post-activity student survey was developed to evaluate its educational impact and to capture students’ perceptions of learning and engagement associated with the use of smoke visualisation.
The survey comprised three sections. The first collected contextual information, including year of study and prior experience with wind tunnel experimentation. The second section consisted of Likert-scale items using a five-point scale (Strongly disagree to Strongly agree) and focused on key learning outcomes. These items addressed students’ understanding of aerodynamic phenomena such as separation and wake behaviour, the extent to which visualisation supported interpretation of concepts, the ability to connect theory to practical applications, the value of comparing smoke visualisation with CFD results, confidence in interpreting aerodynamic phenomena, perceived ease of use of the system, and overall engagement with the activity. The third section comprised open-ended questions that invited students to reflect on (i) the most valuable aspects of the activity, (ii) whether the experience influenced how they understood aerodynamic concepts, (iii) challenges encountered during use of the system, and (iv) suggestions for improvement. The survey was developed by the teaching team for this study. Survey questions were mapped to the intended learning outcomes of the activity and reviewed by the teaching team before used to check clarity and relevance.
Quantitative responses to the Likert-scale items were analysed using descriptive statistics, including response frequencies, percentages, medians, and interquartile ranges. Given the nature of Likert data and the relatively small sample size, no inferential statistical analyses was performed. Responses to the open-ended questions were analysed using an inductive thematic approach. Student comments were reviewed and grouped into recurring themes aligned with the intended learning outcomes of the activity. These themes included visualisation of flow separation and vortices, validation of CFD predictions, linking theory and experiment, and considerations related to usability and safety. The qualitative analysis was used to contextualise the quantitative results and to support triangulation of observed trends.
Results and discussion
Test section velocity profile
To evaluate the performance of the wind tunnel and assess the influence of the rake and frame components, the velocity profile was measured across the test section height. This analysis provided insights into flow uniformity and the disturbances introduced by the rake.
The test was conducted by setting a reference centre velocity of 5 m/s and recording velocity at 15 mm intervals along the vertical axis of the test section, starting 2.5 mm above the boundary wall, which was the closest position permitted by the pitot tube arrangement. Measurements were taken both with and without the rake in place, and the resulting profiles are presented in Figure 7.
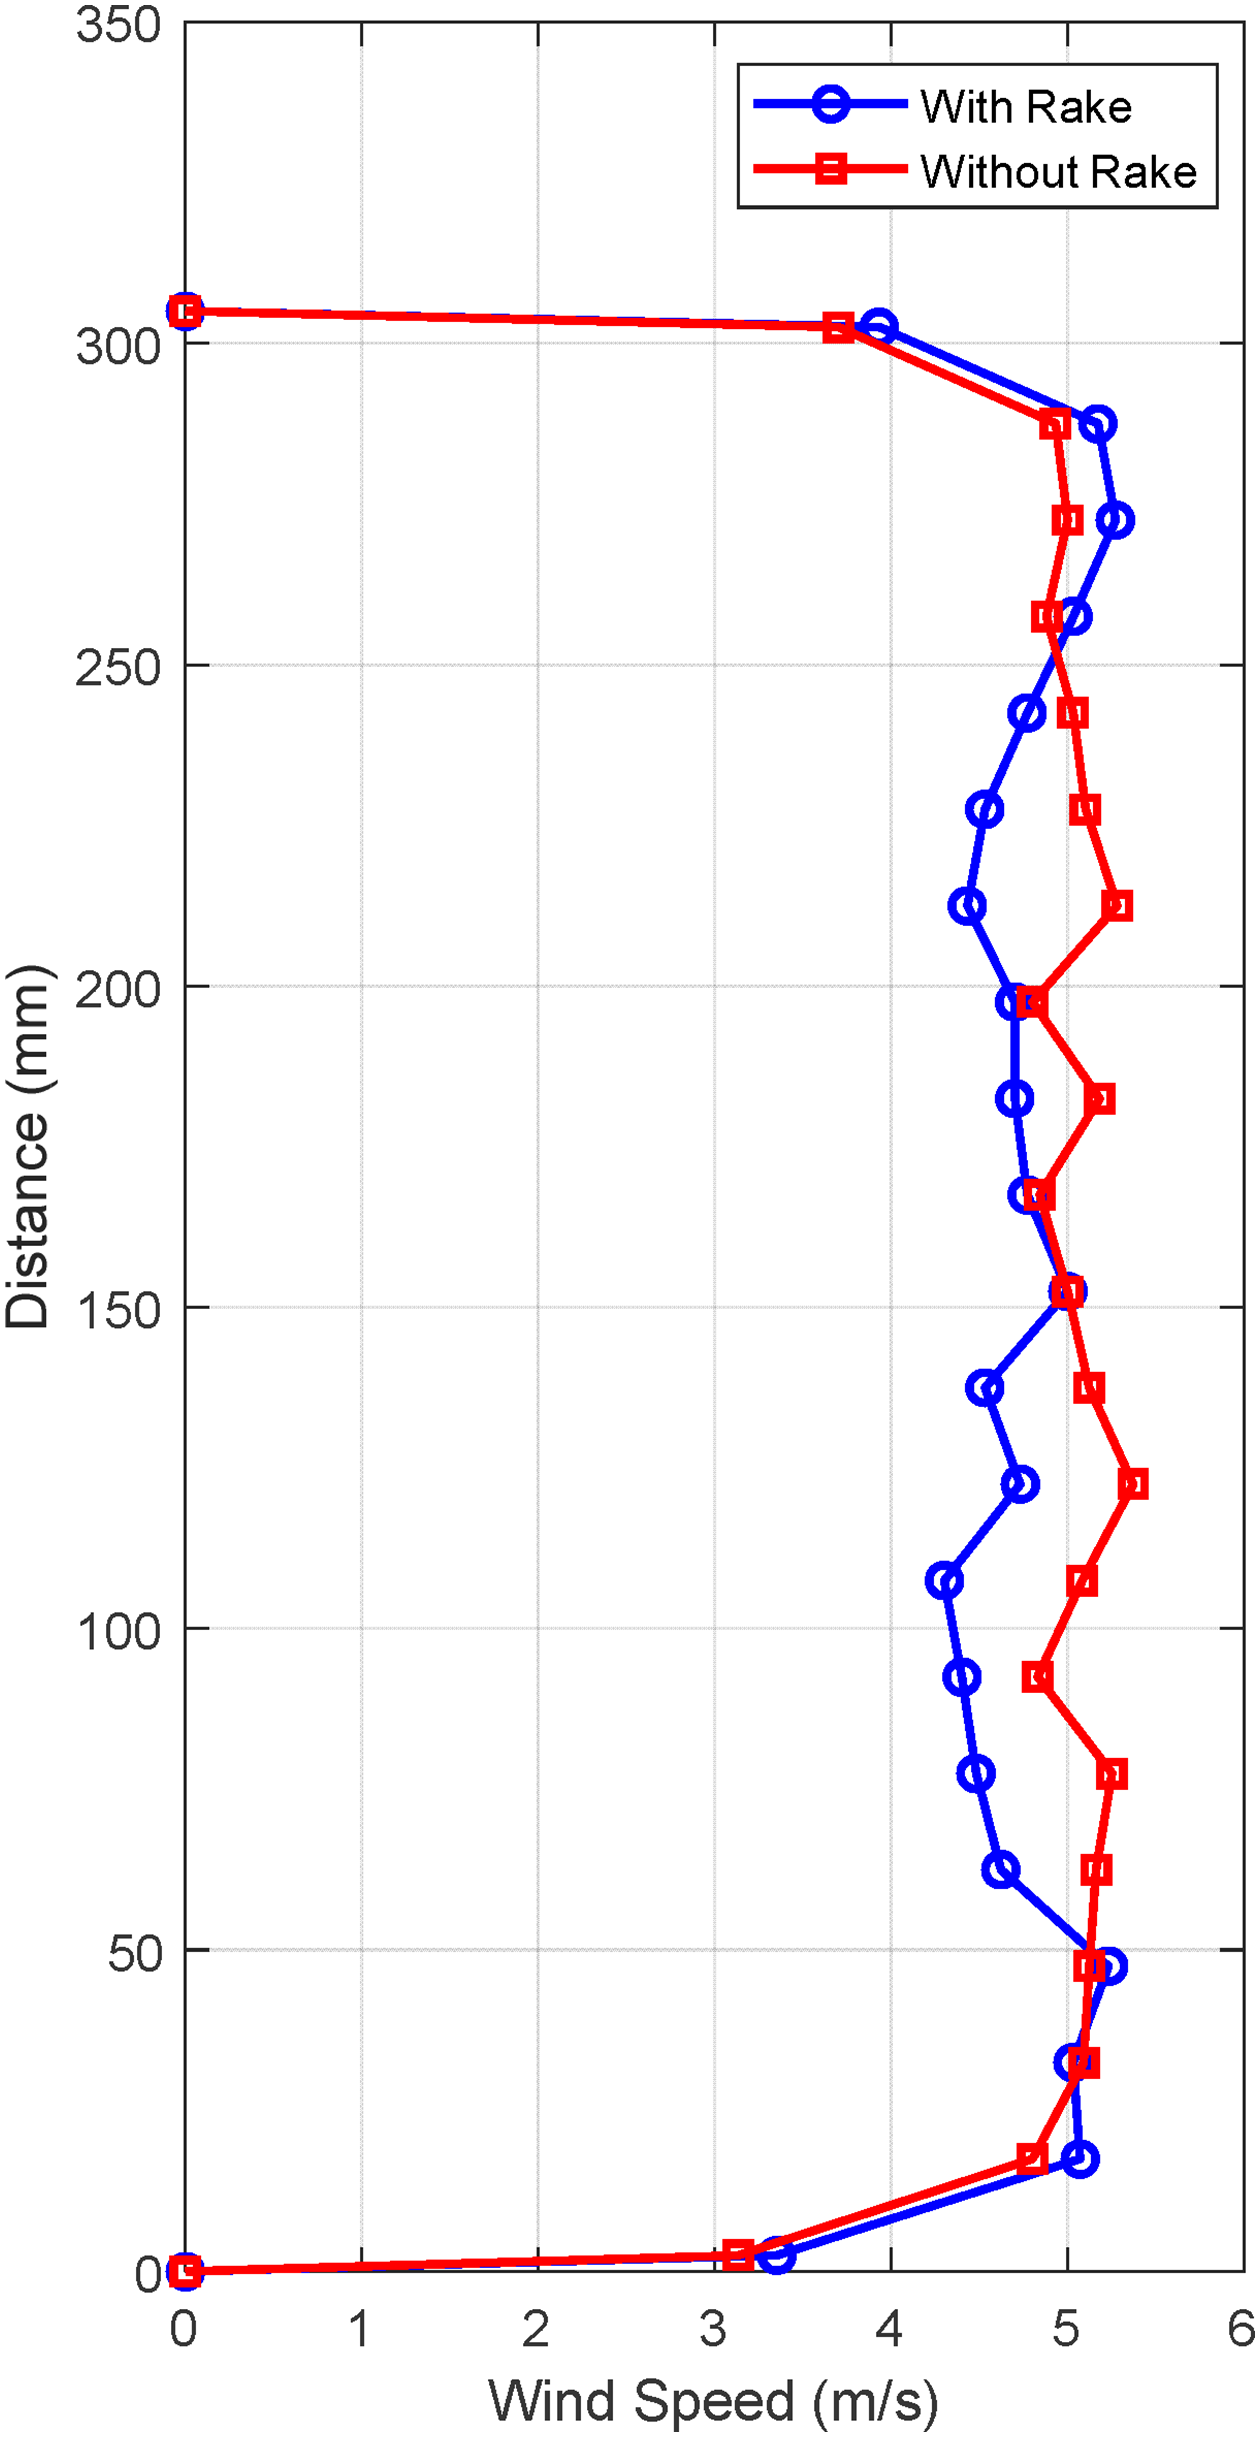
Test section velocity profile.
The result shows clear differences between the two configurations. Without the rake, the velocity varied by up to 0.5 m/s, indicating some inherent non-uniformities in the wind tunnel. With the rake installed, larger fluctuations of up to 1 m/s were observed, particularly in the central region where the rake obstructed flow. In both cases, higher velocities were observed near the top and bottom of the section, consistent with the rake influence being localised around the centre. These measurements confirm that the rake introduces a local disturbance to the flow field and should therefore be considered when interpreting the smoke visualisation results, particularly under low-speed conditions.
From an educational perspective, these observations are significant for two reasons. First, they show that the visualisation system is not a neutral addition to the setup but part of the experimental arrangement, with identifiable effects on the flow. Second, they provide an opportunity for students to engage with concepts such as flow interference, measurement limitations, and the relationship between experimental design and data quality, all of which are central to the development of experimental competence in engineering education.
Educational case studies
The smoke visualisation system was employed across a range of undergraduate projects to investigate different aerodynamic scenarios. Each case study served as an experimental investigation and a learning activity, supporting students in observing flow behaviour and interpreting aerodynamic phenomena. Where appropriate, students used the visualisations to compare experimental observations with theoretical expectations and CFD predictions, reinforcing links between modelling, simulation, and physical evidence.
Case study 1: Aerofoil testing
A “Boeing 737” inspired aerofoil was selected for this case study because of its varying profile along the span provides a clear basis for examining airflow behaviour over a practical aerodynamic geometry. Figure 8 depicts smoke visualisation at 0° angle of attack (AoA). The smoke lines are well defined, indicating laminar flow across the test section. A stagnation point was observed at the leading edge, after which the flow remained attached along the aerofoil surface, demonstrating a stable laminar boundary layer.
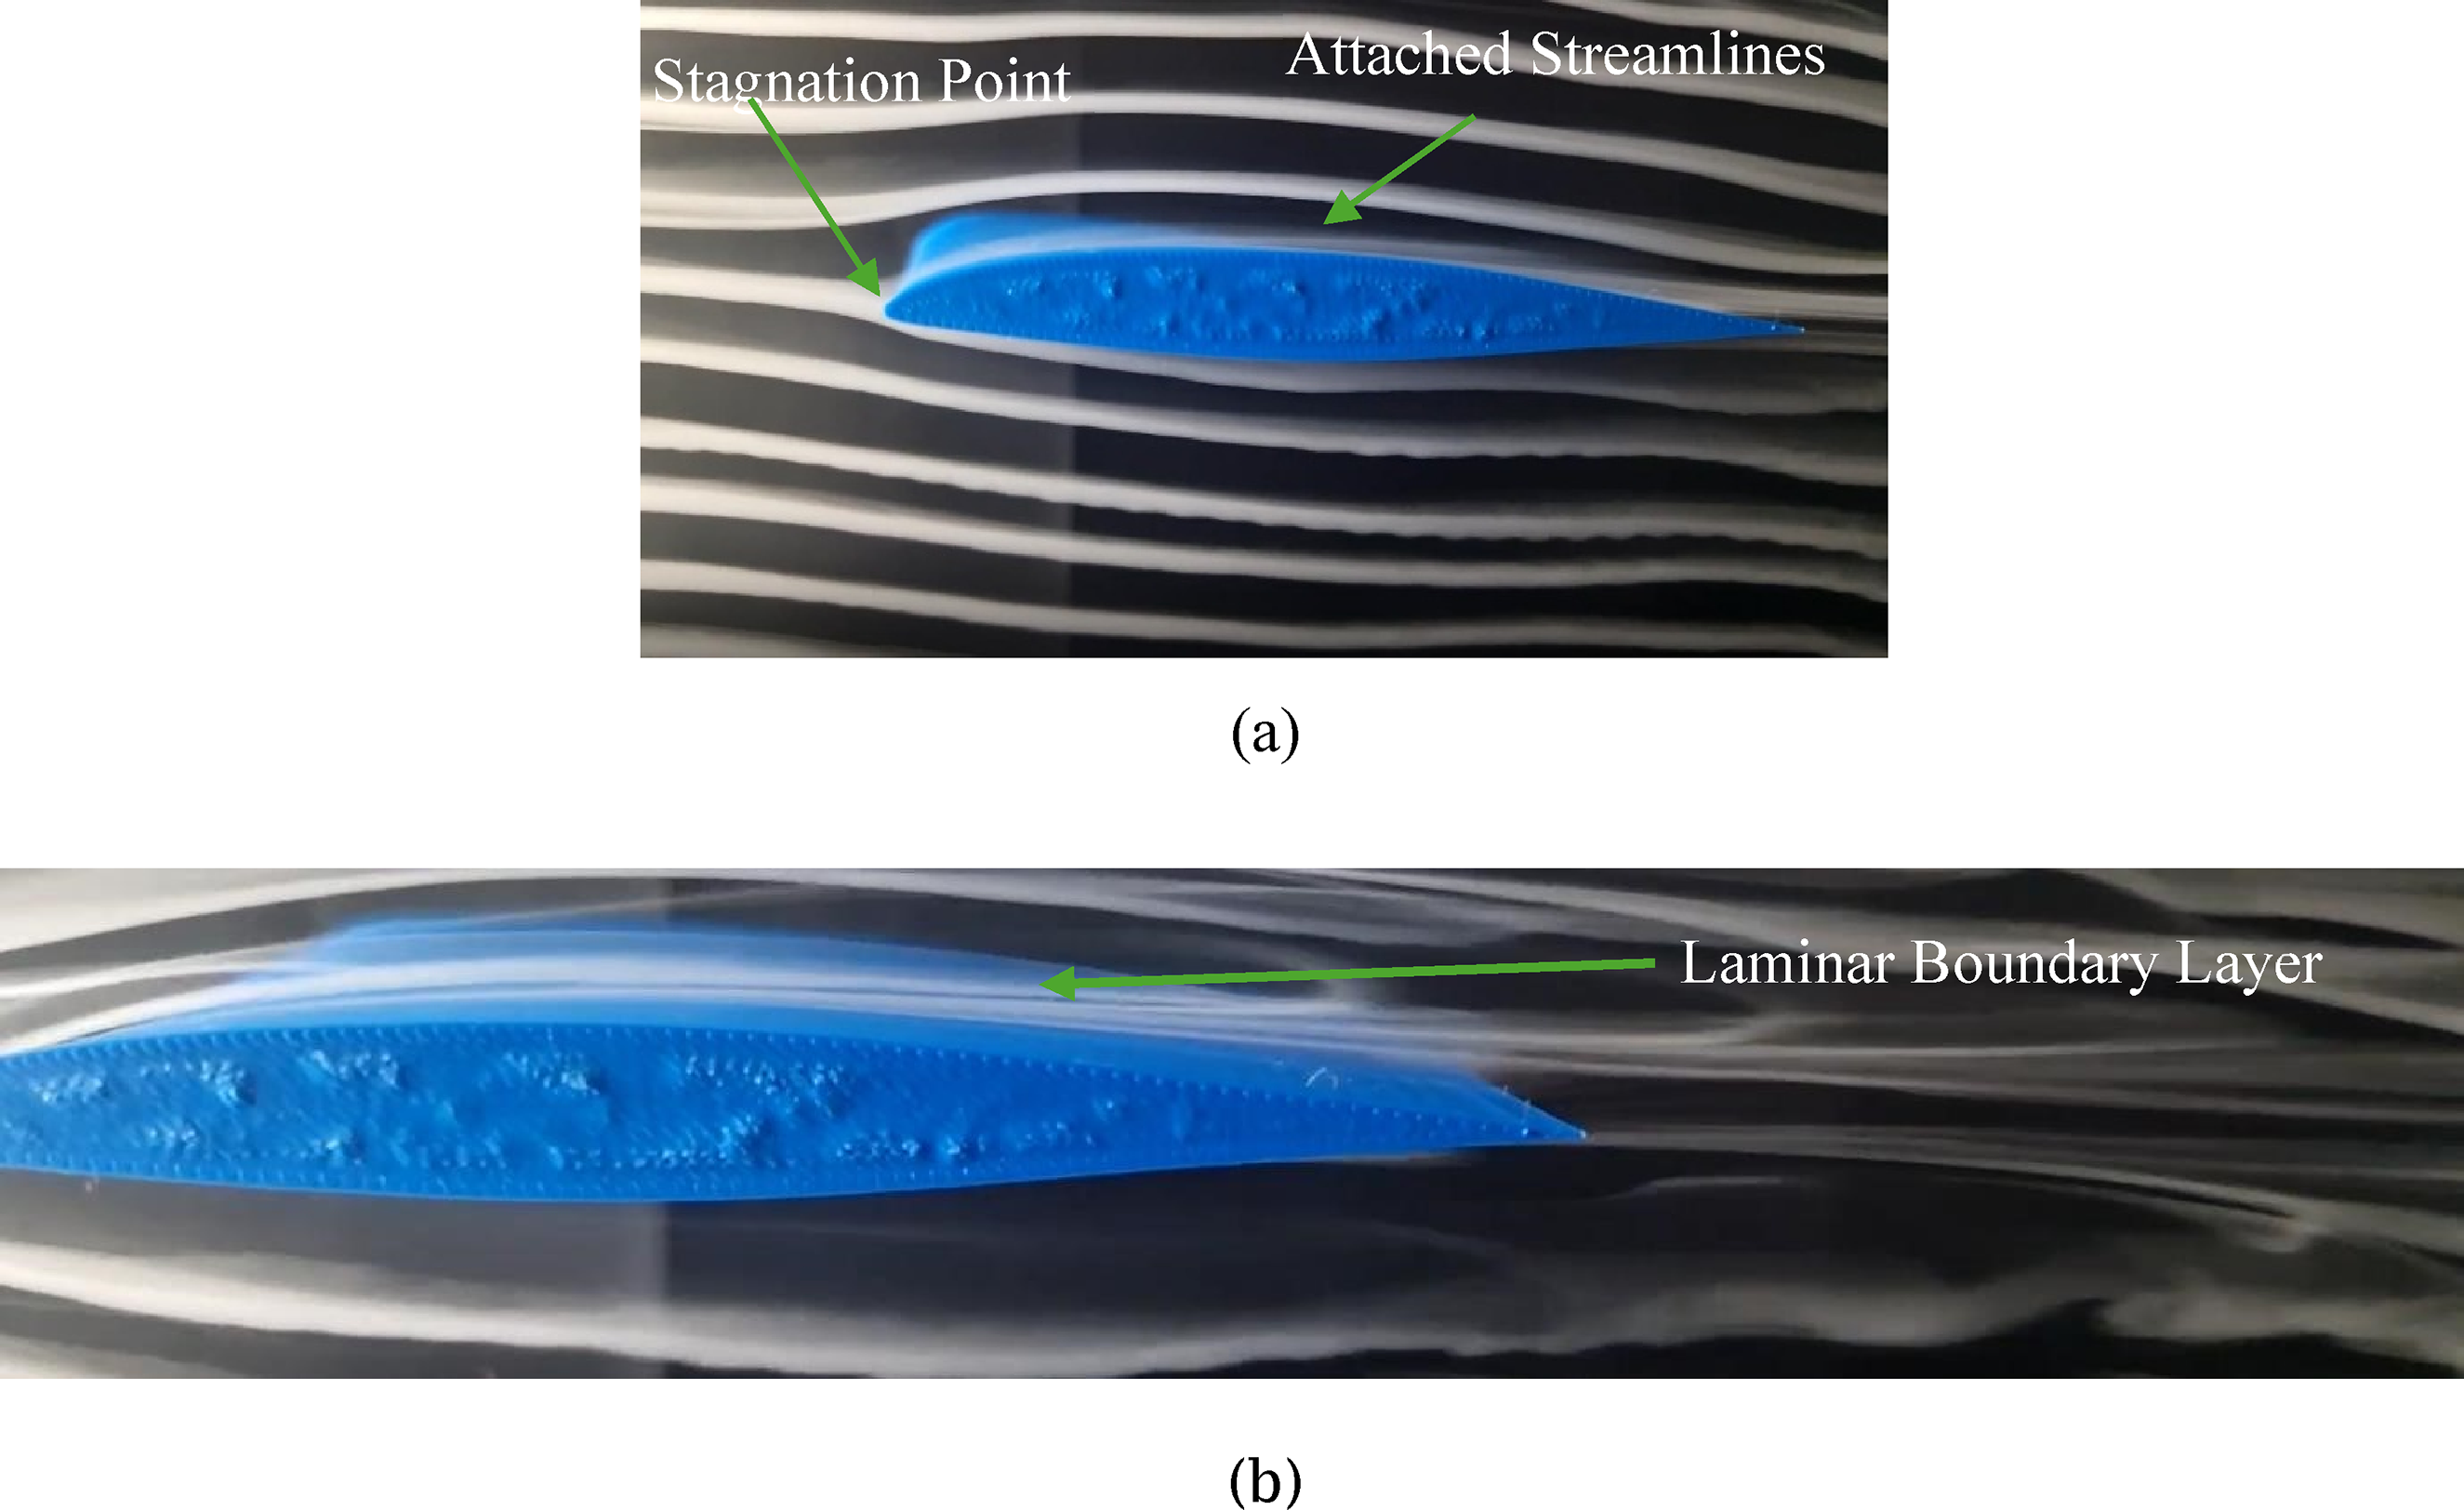
Laminar smoke streamlines around Boeing 737 inspired aerofoil at 0°AoA (a) side view showing attached streamlines in the boundary layer (b) close up of attached streamlines.
At an increased AoA of 15°, shown in Figure 9, the smoke visualisation showed a clear change in flow behaviour. Streamlines over the upper surface became more compressed, indicating increased local velocity and suction. Flow attachment was no longer maintained, and separation of the boundary layer occurred. Downstream of the aerofoil, a turbulent wake with recirculating vortices developed. This flow behaviour indicates the onset of stall, where an adverse pressure gradient causes boundary-layer breakdown, resulting in increased drag and a reduced lift-to-drag ratio.

Angled view of Boeing 737 inspired aerofoil showing flow separation at 15°AoA. (a) laminar separation with crowded suction side smoke streamlines, (b) recirculating vortices, (c) side view of recirculating vortices (d) wing-tip vortices.
Smoke visualisation also allowed examination of flow behaviour near the trailing edge and wingtips. As shown in Figure 9(d), distinct wingtip vortices were observed, forming as higher-pressure air from the lower surface moved around the wingtip toward the lower-pressure region above the aerofoil. These vortices are a primary source of induced drag and contribute to reduced aerodynamic efficiency. The smoke visualisation supported classroom discussions on lift generation and induced drag, as well as the role of wingtip devices such as winglets in reducing vortex strength. Through this case study, students were able to relate observed flow features directly to aerodynamic concepts and established aircraft design practices.
Case study 2: Dimpled golf ball and smooth hemisphere testing
The TecQuipment wind tunnel equipment includes a range of standardised models designed for aerodynamic testing, including a golf ball and a smooth hemisphere. Owing to their well-established aerodynamic behaviour, these models were also evaluated using the smoke visualisation system alongside the aerofoil cases. The models offered a broad range of observations. While most provided useful visual data, some presented challenges. Larger geometries made image capture more difficult, and highly reflective surface complicated the lighting setup.
The first model that produced high quality results was the hemisphere (Figure 10(a)), which has a rounded front and a flat rear surface. The support rod was mounted at the flat rear section and extended downstream into the wake. This configuration enabled the observation of key aerodynamic features, including wake formation, vortex shedding, and the stagnation point. Clear visualisation of the separated wake region and spiralling vortices behind the flat face was achieved. The airflow was seen to split cleanly at the front stagnation point. A limitation of this setup was the presence of the support rod within the wake, which extended toward the rear of the test section and may have introduced some disturbance. Despite this, the hemisphere provided a clear demonstration of fundamental aerodynamic behaviour.
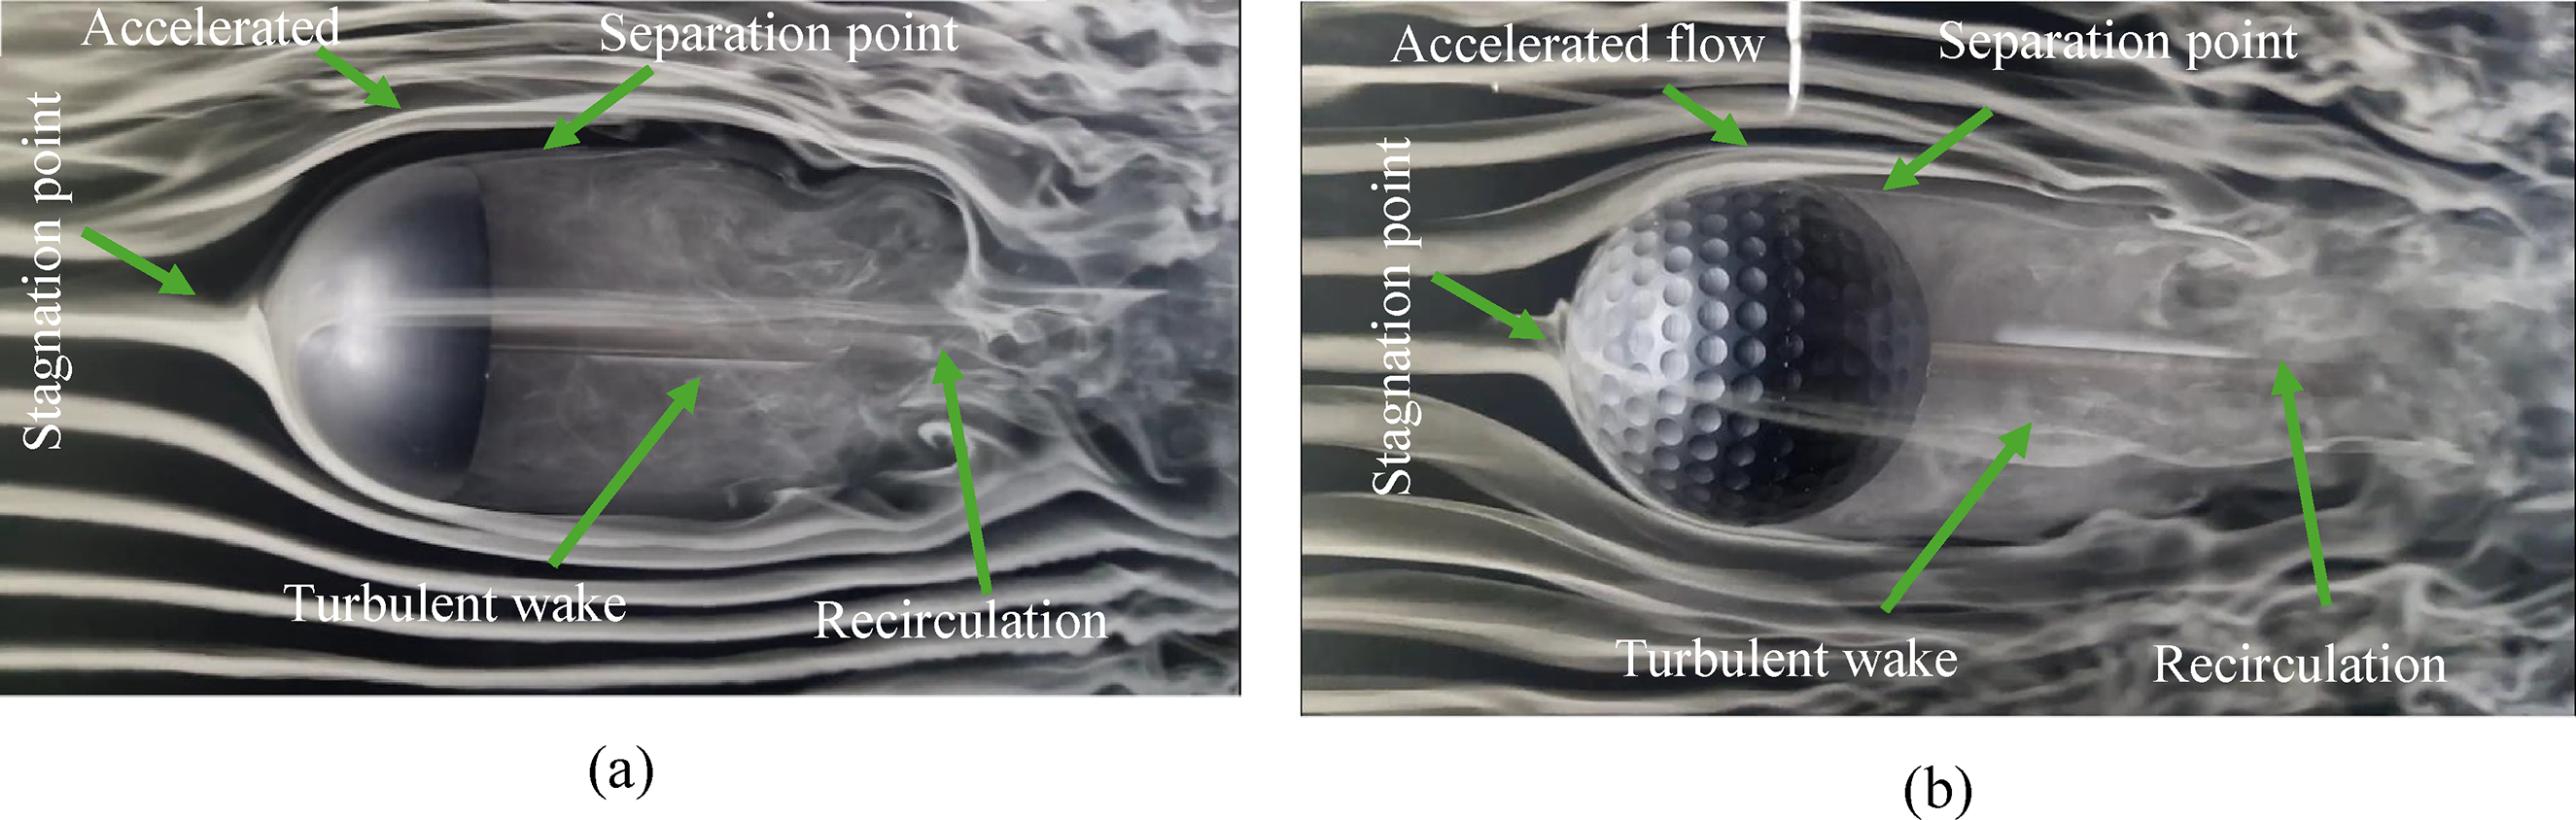
(a) hemisphere side profile smoke flow (b) golf ball side profile smoke flow.
The golf ball model (Figure 10(b)) also produced clear and useful visualisation. It has the same diameter as the hemisphere but with a dimpled surface. The images show a clear stagnation point at the front of the ball, and clear movements within the wake, highlighting its turbulent nature. The dimples delayed flow separation, allowing the smoke to reveal the effect of surface roughness on wake behaviour. The support rod was positioned in the same way as for the hemisphere and may have introduced minor disturbances to the flow. However, this effect was considered negligible. This case study enabled students to visualise the transition from laminar to turbulent flow and to examine how surface texture influences aerodynamic behaviour.
Case study 3: Morphing aerofoil
This study examined the design and testing of a morphing aerofoil (MAF0000) with adjustable leading edge (LE) and trailing edge (TE). The aim was to explore how geometric changes during morphing influenced flow behaviour, particularly in relation to lift, stall onset, and drag. The aerofoil was based on the NACA0012 profile and fabricated using additive manufacturing, with rigid materials (PLA/ABS) for structural stiffness and flexible (TPU) materials to enable surface morphing. Actuation was achieved using servo motors controlled through Arduino with pulse width modulation (PWM), producing LE and TE deflections comparable to slat and flap mechanisms used in aircraft. Wind tunnel testing was carried out in the TecQuipment AF-100 subsonic wind tunnel over angles of attack from 0° to 20° at selected flow velocities. Smoke visualisation was used to examine boundary layer behaviour, separation, stall, and wake formations.
The wind tunnel results suggested that some morphing configurations gave more favourable aerodynamic behaviour than the baseline NACA0012 at lower angles of attack. For example, MAF3025 (30° LE, 25° TE) showed a lift-to-drag ratio (
Figure 11(a) shows the wind tunnel arrangement for the morphing aerofoil. The smoke visualisation revealed clear differences in stagnation behaviour, flow attachment, and wake structure. Figure 11(b) and (c) show how leading-edge morphing changed the stagnation point and affected the way flow attached and moved along the aerofoil surface. Figure 11(d) shows Coanda-type attachment behaviour for MAF2010, whereas Figure 11(e) for MAF0010 shows clearer separation and more disturbed flow. In contrast, Figure 11(b) shows more stable attached flow. Within this study, the case study helped students examine the influence of aerofoil morphing on visible flow structures relevant to adaptive wing design. Future experiments are planned to provide definitive quantitative comparison of morphing and static aerofoil performance.

Morphine aerofoil smoke visualisation results (a) wind tunnel setup with the morphing aerofoil (b) wind tunnel setup with the NACA0012 aerofoil (c) airflow around MAF2010 (d) airflow around MAF0010 (e) Coanda effect observed on MAF2010 (f) flow separation on MAF0010.
Case study 4: Effect of gurney flap on rear-wing flow visualisation
This case study compares the aerodynamic behaviour of a rear-wing section fitted with a full Gurney flap to the same section without a flap, tested in the TecQuipment AF-100 subsonic wind tunnel. Smoke visualisation was used to examine boundary-layer behaviour, downwash and wake development.
With the Gurney flap installed (shown in Figure 12(c)), the smoke streamlines remained attached along the suction surface and were deflected more steeply at the trailing edge, showing stronger circulation and greater downwash. A thicker shear layer developed behind the flap, breaking down into smaller vortical structures. The resulting wake is broader but more uniform, suggesting that the flap energised the near-wall flow and delayed large-scale trailing-edge separation.

Racing car model spoiler (a) CAD model showing spoiler with gurney flap of a height that is 2% of chord length (b) flow over the rear-wing spoiler section without a gurney flap, (c) flow over the rear-wing section with a gurney flap.
Figure 12(b) shows the flow over the rear-wing section with no gurney flap, exhibited weaker downwash and earlier flow separation. The smoke streamlines rolled into larger, coherent vortices in the near wake, producing less stable flow pattern with reduced circulation compared to the flapped case.
These results are consistent with the established aerodynamic role of Gurney flaps, which generate a counter-rotating vortex that enhances suction on the upper surface and increases base pressure on the lower surface, thereby strengthening circulation and improving downforce. Therefore, the smoke visualisation confirmed this effect, showing that the Gurney flap enhances circulation, increases downwash, maintained attached flow on the suction side, and produced a more controlled wake, resulting in higher aerodynamic efficiency through increased downforce generation. This visual evidence helped students to understand how Gurney flaps influence near-wall flow behaviour and downforce generation, concepts that are often explained theoretically but rarely visualised during laboratory experiments.
Case study 5: Formula students concept vehicle rear wing design with and without louvres
This case study reports on an undergraduate research project that employed the TecQuipment AF-100 subsonic wind tunnel to evaluate aerodynamic optimisation strategies for a Formula Student racing car. The study investigated the impact of introducing louvres into the rear wing endplate design, with the aim of improving the lift-to-drag ratio and delaying stall. Wind tunnel experiments were carried out across an AoA range of −8° to 20°, supported by smoke visualisation to capture qualitative flow behaviour.
The addition of louvres delayed stall onset from 14° to 16°, allowing the modified wing to achieve a maximum downforce of

(a) Airflow exiting through the louvres forms small counter-rotating vortices, suppressing the coherent wing-tip vortex and producing a more ordered wake (b) non-louvred endplate showing a strong wing-tip vortex rolling over the endplate edge, indicating a larger pressure differential and earlier separation (c) base wing showing tip-vortex formation and a layered wake structure.
Case study 6: Formula student concept racing car nose cone visualisation
Smoke visualisation was used to investigate how the geometry of a race car nose cone influences flow attachment, wake development, and the downforce-to-drag ratio. Three 3D-printed nose cone profiles with different tip heights were tested, as shown in Figure 14. Each model shared the same base length, curvature, and rear interface to maintain consistent aerodynamic conditions.

Race car nose cone (a): low tip profile 1 (b) mid tip profile 2 (c) higher tip profile.
The designs were based on the University of Lincoln Formula Student chassis, with a maximum length of 700 mm from the front wheel edge and a minimum height of 550 mm for chassis compatibility. Each profile extended 300 mm forward from the rear section, differing only in nose tip height: profile 1: 63.5 mm from base (low-tip), profile 2: 248.9 mm from base (mid-tip), profile 3: 434.3 mm from base (high-tip).
To fit the nose cone within the TecQuipment AF-100 wind tunnel, the models were scaled by a factor of 0.2 and fabricated via 3D printing. The scaled models measured approximately 111 × 108 mm, with a frontal area of 0.0108 m2, giving a blockage ratio of 12%, within the recommended 10–15% range to minimise wall-interference effects. Tests were performed at airflow velocities of 8, 16, and 24 m/s to observe changes in boundary-layer attachment, separation, and wake structure across the three configurations.
In Figure 14(a), the streamlines split at the stagnation point and follow the rounded leading edge, remaining attached along both the upper and lower surface of nose cone before forming a wake at the end of the cone, consistent with lower pressure drag. Figure 14(b) shows a similar pattern for profile 2, though with slight separation near the upper surface of the nose cone. As seen in Figure 14(c), it reveals a broader, less uniform wake and earlier flow detachment, indicating a stronger adverse pressure gradient and reduced aerodynamic efficiency compared with the lower-tip profile.
The smoke visualisation shows that reducing the nose tip helps maintain flow attachment and results in a more stable, ordered wake, potentially improving downforce. Consistent with this observation, the lowest-tip profile (profile 1) achieved the lowest
Testing and evaluation of the final smoke rake and frame design demonstrated reliable performance across a range of aerodynamic models. The system enabled clear and consistent flow visualisation and proved sufficiently versatile for use with different geometries and experimental configurations. Across the case studies, the effectiveness of smoke visualisation was strongly influenced by wind tunnel operating speed. An operating range of approximately 1-5 m/s provided usable smoke visibility, with the most stable and coherent smoke trails consistently observed between 1.4 and 1.8 m/s. This range was therefore adopted as the preferred condition for teaching-focused visualisation activities. In addition, case studies (Cases 4–6) were particularly effective in motivating student learning by situating fundamental aerodynamic principles within relevant engineering contexts.
Educational evaluation results
To examine students’ perceptions of whether the smoke visualisation activity supported the intended learning outcomes, students completed an anonymous post-activity survey. The quantitative results are summarised in Table 2, and the distribution of responses across survey items is shown in Figure 15
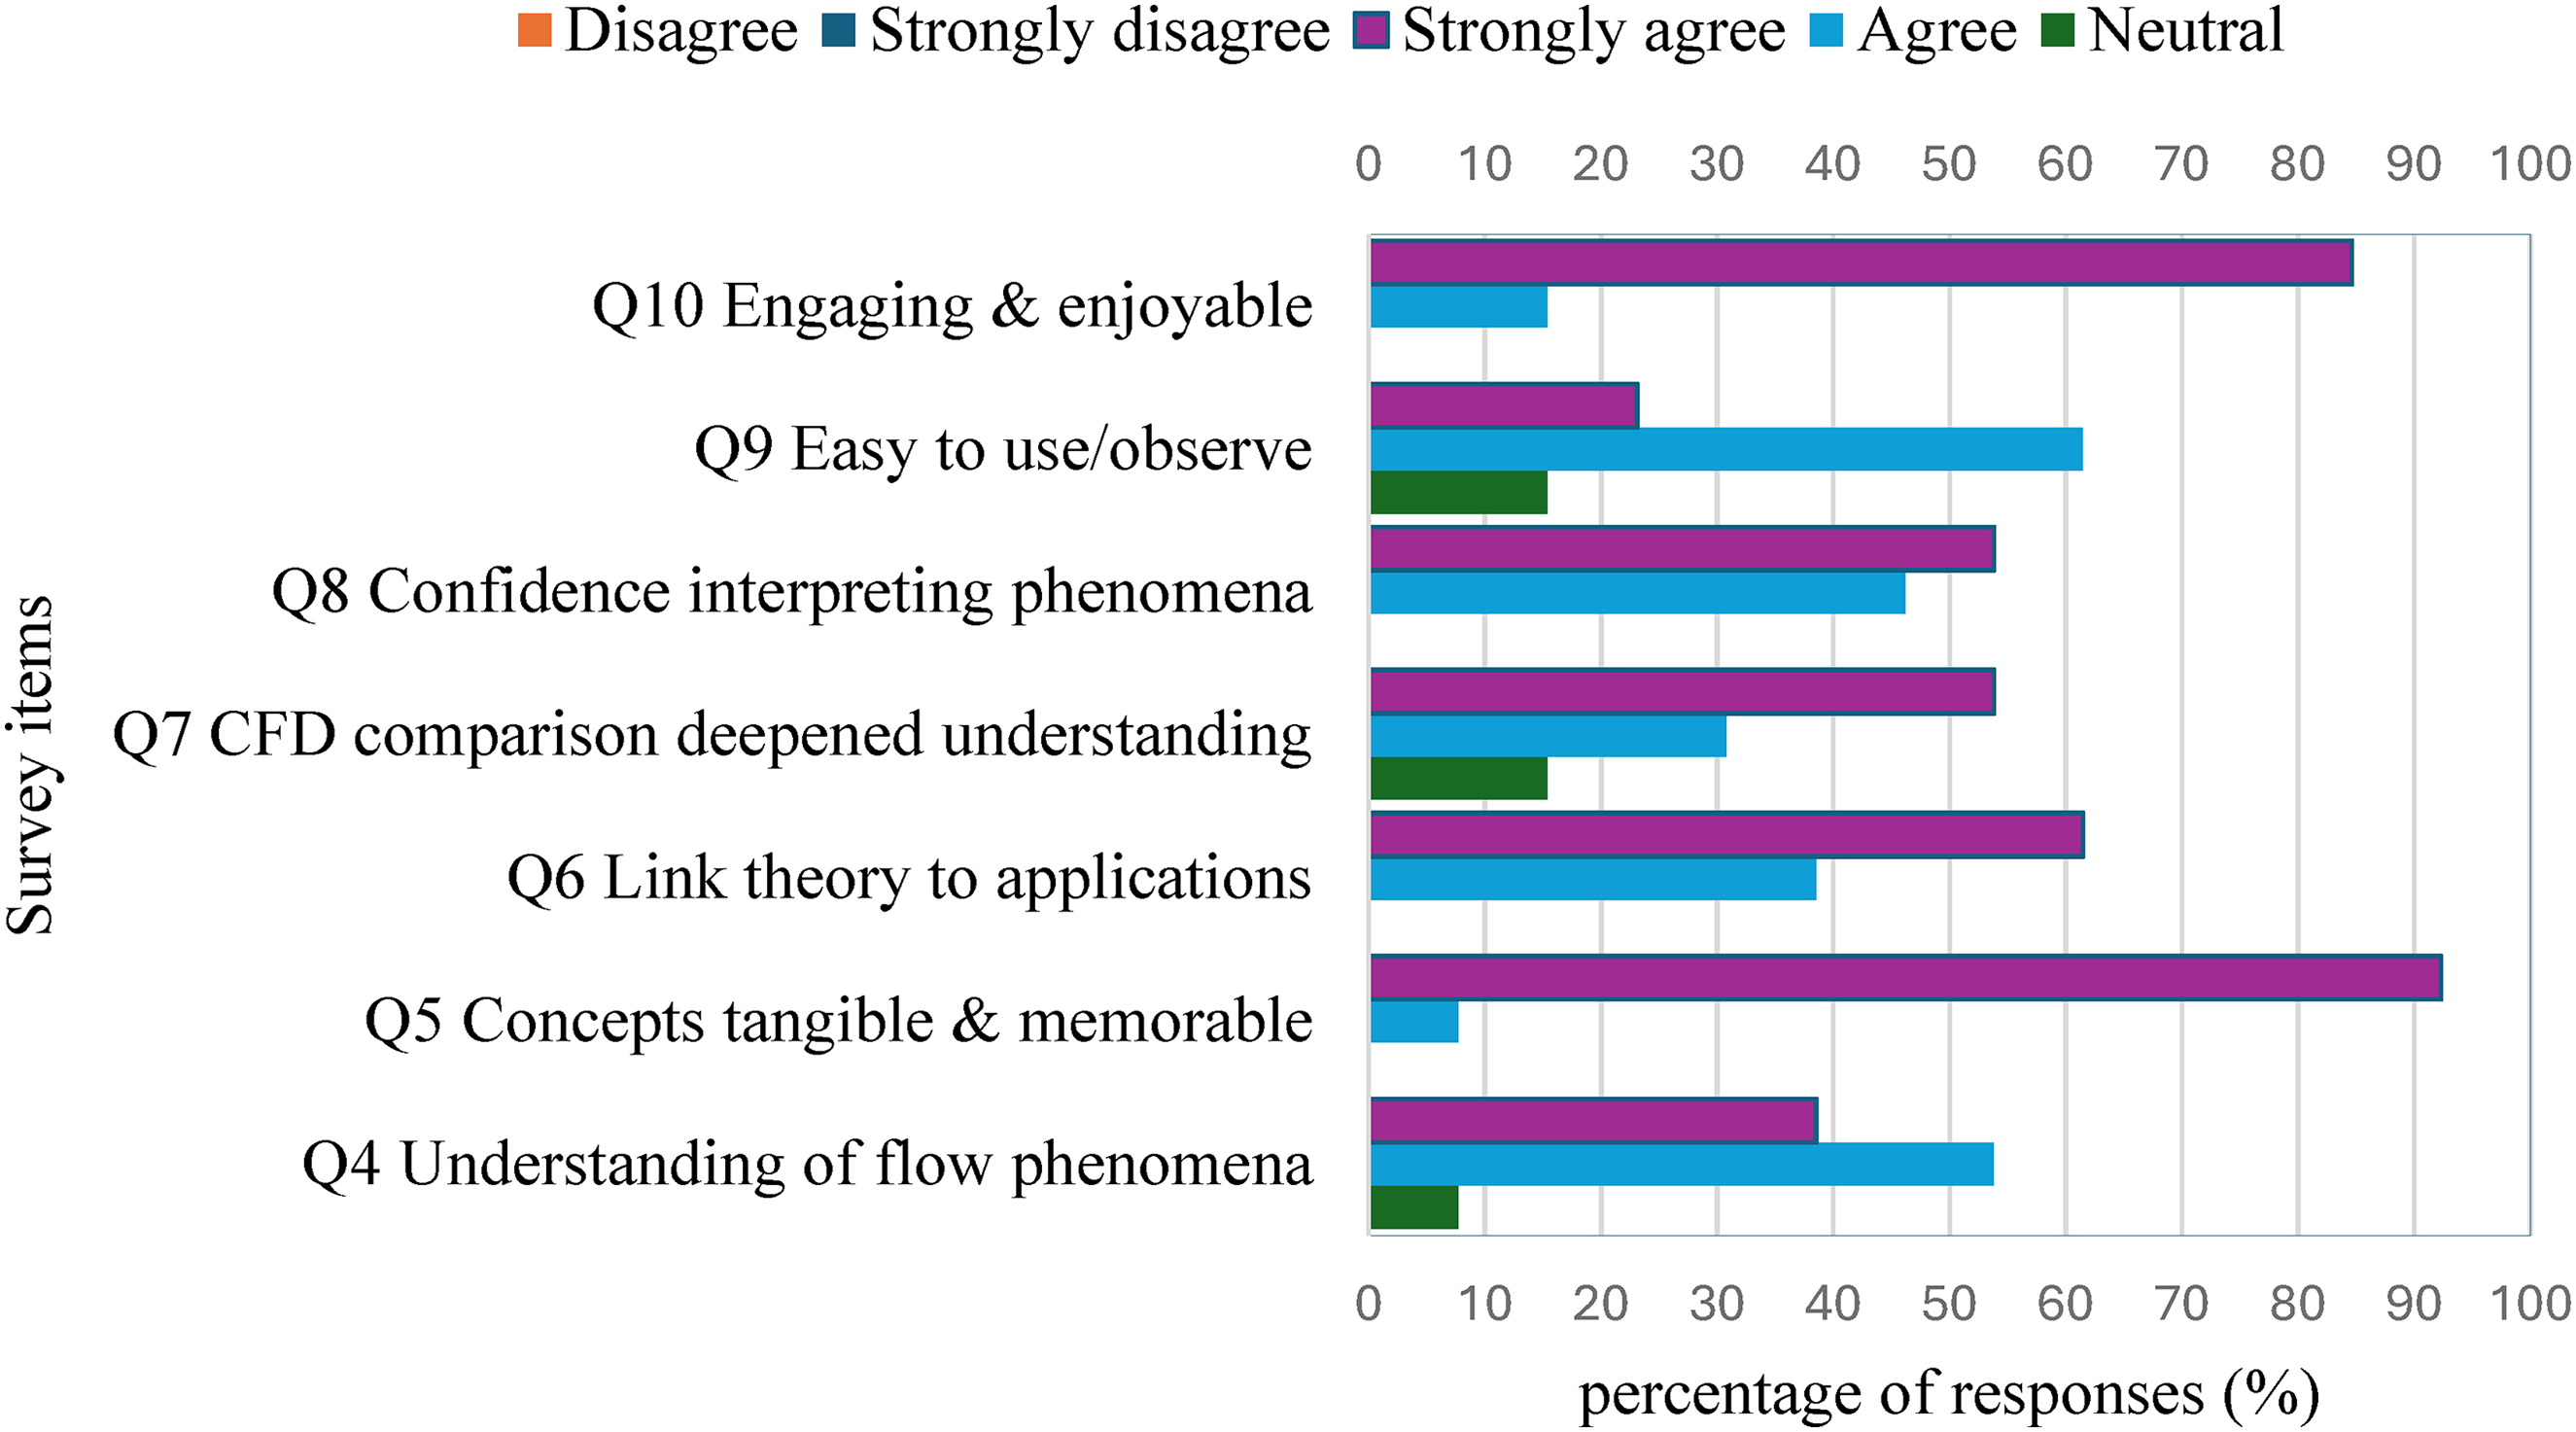
Distribution of responses across learning, usability, and engagement items.
Student perceptions of learning experience and engagement.
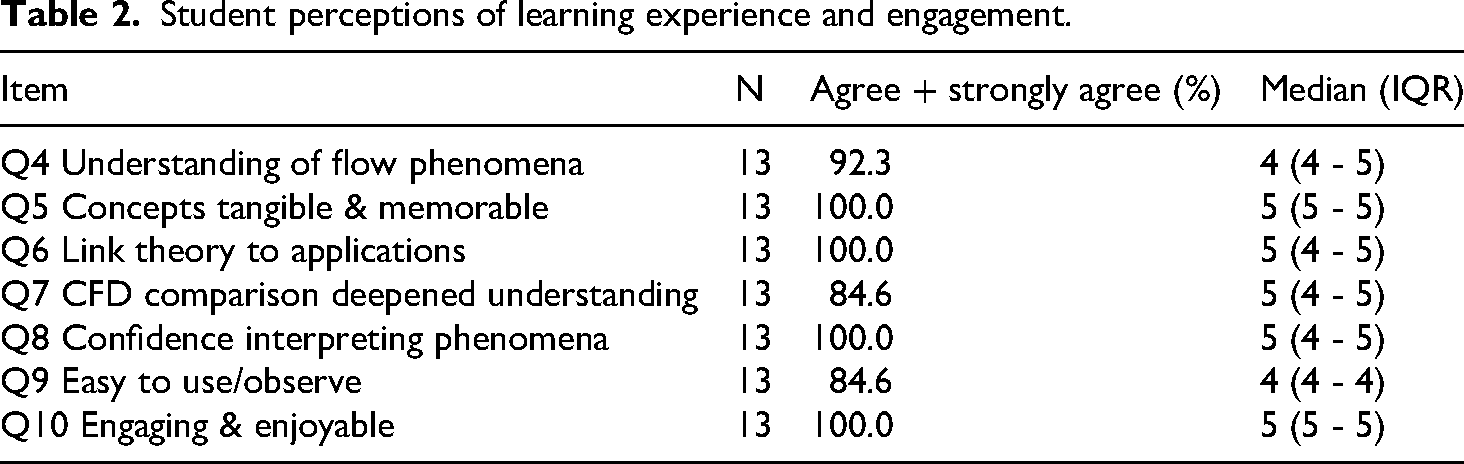
As shown in Table 2, students reported positive perceptions of the learning experience across all measured dimensions. The proportion of positive responses ranged from 84.6% to 100%, with median scores of 4 or 5 on the five-point Likert scale. Students expressed strong agreement that observing smoke patterns made aerodynamic concepts more tangible and memorable (Q5; median = 5), that the activity helped them connect theoretical knowledge to real-world applications (Q6; median = 5), and that it increased their confidence in interpreting aerodynamic phenomena (Q8; median 5). High levels of agreement were also reported for the value of comparing smoke visualisation with CFD results (Q7) and for overall engagement and enjoyment of the activity (Q10).
These outcomes suggest that students perceived the smoke visualisation activity as supporting their conceptual understanding, confidence, and engagement. The results align with the use of qualitative flow visualisation as a means of supporting students’ interpretation of aerodynamic behaviour and strengthening links between theory, simulation, and experimental observation.
The open-ended survey responses provide qualitative insight that helps contextualise the quantitative trends reported in Table 2 and Figure 15. Analysis of student reflections revealed four main themes describing how the smoke visualisation activity was perceived to influence learning, reflection, and application.
One recurring theme in the responses was the value of being able to observe aerodynamic phenomena directly, rather than inferring them from theory or simulation. Students frequently referred to observing flow separation, vortex formation, wake development, and stagnation regions, and noted that these observations helped reinforce concepts previously encountered in lectures or CFD-based analysis. Several students commented that smoke patterns made it easier to see how flow structures change with angle of attack or geometry, supporting interpretation of complex behaviours such as stall onset and vortex shedding. This theme corresponds with the high levels of agreement reported for conceptual understanding and tangibility of aerodynamic concepts (Q4 and Q5 in Table 2), suggesting that students experienced the visualisation as supporting interpretive learning by making flow behaviour visible.
Many students highlighted the value of comparing smoke visualisation with CFD results, noting that the activity supported validation of simulation results and improved awareness of modelling assumptions. These reflections align with the positive responses observed for Q7 in Table 2. The broader distribution of responses shown in Figure 15 suggests some variation in students’ confidence when making such comparisons, which is likely related to differences in prior experience with CFD. Several students described identifying discrepancies between idealised simulations and experimental observations, suggesting developing awareness of modelling assumptions and encouraging critical reflection on differences between simulated and observed behaviour.
Students also emphasised the benefit of applying smoke visualisation within realistic, application-driven case studies, particularly those related to Formula Student components and vehicle aerodynamics. These contexts were described as motivating and engaging, helping students relate fundamental aerodynamic principles to recognisable engineering problems. Reflections indicated that students perceived authentic design scenarios as helping them connect theoretical concepts to real engineering systems. This theme reinforces the importance of relevance and authenticity in sustaining engagement and supporting deeper reflection, while maintaining a focus on core aerodynamic principles.
Alongside positive learning experiences, students identified practical challenges associated with the activity, including sensitivity to wind speed, smoke stability, ventilation requirements, and setup complexity. These challenges were commonly described as part of the experimental learning process rather than as barriers to learning. This interpretation is consistent with the high engagement and confidence scores reported in Table 2 (Q8 and Q10), suggesting that experimental constraints did not undermine perceived educational value. Instead, students described these limitations as reflecting the realities of experimental work and engineering practice.
Several students also described the activity as engaging and memorable. One student noted that it was “one of the most engaging parts of my project” and that it contributed directly to their dissertation work. These comments are consistent with the strong engagement score observed in the quantitative survey results and are consistent with the view that smoke visualisation can promote sustained interest and support meaningful engagement in aerodynamics laboratories.
Summary of findings
The qualitative findings indicate that students perceived the smoke visualisation activity as supporting their learning across several dimensions. Students described perceived improvements in their understanding of aerodynamic phenomena, particularly through the opportunity to interpret flow behaviour directly and to relate observations to prior theoretical and CFD-based work. Reflections also emphasised the value of applying visualisation within realistic engineering contexts, which contributed to motivation and sustained engagement.
In addition, students described greater awareness of experimental constraints and limitations, identifying factors such as operating conditions and setup sensitivity as part of normal experimental practice rather than as obstacles to learning. These qualitative insights are consistent with the positive trends observed in the quantitative survey data and help explain why students perceived the activity as supporting conceptual understanding and engagement. The findings suggest that low-cost smoke visualisation has educational value in aerodynamics laboratories when integrated with theory, simulation, and application-focused activities.
Discussion
Alignment with pedagogical aims and learning theory
The use of smoke visualisation in the aerodynamics laboratory was intended to complement conventional quantitative wind tunnel measurements by providing visually accessible representations of flow behaviour. The survey results presented in Table 2 and Figure 15 provide evidence of positive student perceptions of this approach. High levels of agreement across items related to conceptual understanding, tangibility of concepts, and integration of theory with application suggest that students experienced the visualisation as an active learning resource rather than as a passive demonstration. This study builds on earlier work by integrating smoke visualisation into a student-led design and build process, implementing it on a TecQuipment AF-100 wind tunnel, and applying it across a wider range of undergraduate case studies.
These outcomes align with multi-representational approaches to learning, which emphasise the coordination of theoretical models, computational models, and physical observations. 6 Strong responses related to linking theory to applications (Q6) and comparing smoke visualisation with CFD results (Q7) suggest that students perceived the visualisation as helping them interpret numerical predictions alongside observable flow behaviour. They also suggest growing awareness of modelling assumptions and the relationship between predicted and observed aerodynamic behaviour, both of which are important aims of laboratory-based engineering education and professional engineering practice.
The high levels of reported engagement and enjoyment (Q10), shown in Figure 15
The reported increase in students’ confidence in interpreting aerodynamic phenomena (Q8) suggests that repeated exposure to visual flow evidence may have helped students move beyond descriptive observation toward more explanatory reasoning. This aligns with work in laboratory education showing that learning is supported when students are given opportunities to interact with physical phenomena and reflect on their interpretations, rather than focusing solely on procedural or technical tasks. 25 Within the aerodynamics laboratory, smoke visualisation functioned as a formative learning resource by making flow behaviour observable and creating space for discussion and reflection. When integrated with theory and simulation, visualisation may therefore provide a useful means of supporting conceptual development and strengthening students’ interpretive capability.
Limitations and implications for future work
The survey results show positive trends (Table 2 and Figure 15
There are also technical limitations. The smoke rake and supporting frame introduce a local disturbance to the flow field, particularly in the centre of the test section, and this should be considered when interpreting the results. The experiments were carried out at low speeds, so the Reynolds numbers are lower than those in many full-scale applications. The observed flow behaviour should therefore be treated as qualitative rather than directly representative of aerodynamic performance. Blockage and wall effects may also have influenced the flow in some cases, particularly where the models occupied a larger portion of the test section.
These limitations are common in exploratory studies of educational practice and suggest clear directions for future work. Further studies could involve larger cohorts, incorporate pre- and post-activity assessments, and compare groups with and without access to smoke visualisation. On the technical side, future work could include more detailed aerodynamic validation, closer matching of Reynolds numbers where feasible, and correction-based analysis where blockage effects are significant. These approaches would support a more robust evaluation of both perceived and measured learning outcomes, strengthening the evidence for the educational value of flow visualisation in aerodynamics laboratories.
Conclusions
This study examined the design, implementation, and educational use of a smoke-based flow visualisation system integrated into a subsonic wind tunnel laboratory for aerodynamics teaching. Although the system was developed through an iterative engineering process involving CAD modelling, CFD analysis, and prototyping, the principal contribution of the work lies in its educational application rather than in technical novelty. The final configuration enabled consistent and repeatable visualisation of airflow across a range of undergraduate learning activities, including aerofoil testing, morphing wing studies, and Formula Student vehicle components.
The visualisation system allowed students to observe key aerodynamic phenomena, including boundary-layer attachment and separation, wake development, vortex formation, and stall onset. These features are often difficult to interpret using numerical data or CFD outputs alone, particularly for students at earlier stages of study. For teaching-focused applications, the most effective operating conditions were identified in the low-speed range of approximately 1.4-1.8 m/s, where smoke coherence and visual clarity supported reliable interpretation of flow behaviour.
Evaluation using an anonymous student survey indicated that students perceived the activity as supporting several intended learning outcomes. Students reported perceived improvements in their understanding of aerodynamic phenomena, stronger connections between theoretical principles, simulation results, and experimental observations, increased confidence in interpreting flow behaviour, and high levels of engagement. These findings suggest that qualitative flow visualisation can serve as a useful representational link between abstract theory and physical experimentation in aerodynamics laboratories.
Students also identified practical challenges related to operating conditions, smoke extraction, and system sensitivity. These constraints were commonly viewed as part of authentic experimental practice and were not seen as hindering learning. Instead, students described them as contributing to experimental judgement and reflective reasoning. At the same time, student feedback highlighted opportunities for refinement, including clearer setup guidance, improved ventilation arrangements, and structured induction materials, which will inform future activity.
Several limitations should be acknowledged. The study involved a small cohort (N = 13) and relied on self-reported perceptions of learning and engagement rather than direct measures of learning gain. No control or comparison group was included. The survey instrument, although mapped to the intended learning outcomes and reviewed for clarity by the teaching team, was not formally validated. As participation was voluntary, responses may reflect a degree of self-selection bias, and the involvement of some students in the design and fabrication of the system may also have influenced their responses. Future work will focus on larger cohorts, pre- and post-activity assessments, and comparative studies to provide stronger evidence for the educational value of the approach.
The findings suggest that low-cost smoke flow visualisation can enrich aerodynamics education by supporting engagement and strengthening links between theory, computation, and experiment. The approach offers a practical and accessible enhancement to traditional wind tunnel laboratories and contributes to wider efforts in engineering education to design laboratory experiences that emphasise interpretation, inquiry, and professional engineering judgement.
Footnotes
Acknowledgment
The authors would like to acknowledge Mr. Daniel Stones, Technical Resource Manager at the University of Lincoln, for the project idea and providing valuable technical guidance and support throughout the development of the smoke rake design.
Ethics considerations
This study evaluated an educational activity using a voluntary, anonymous student survey. No identifying information was collected, and participation had no impact on assessment or academic progression. Consent was implied through voluntary participation, and all data were analysed and reported in anonymised form in accordance with institutional guidelines for educational research.
Funding
The authors received no financial support for the research, authorship, and/or publication of this article.
Declaration of conflicting interests
The authors declared no potential conflicts of interest with respect to the research, authorship, and/or publication of this article.
Data availability statement
The datasets generated and/or analysed during the current study are not publicly available due to ethical and privacy restrictions related to participant confidentiality but are available from the corresponding author on reasonable request.